mycoplasma gallisepticumlipid associated … gallisepticumlipid associated membrane proteins...
TRANSCRIPT

Mycoplasma gallisepticum Lipid Associated MembraneProteins Up-regulate Inflammatory Genes in ChickenTracheal Epithelial Cells via TLR-2 Ligation through anNF-kB Dependent PathwaySanjukta Majumder1,3, Frank Zappulla2, Lawrence K. Silbart1,2,3,4*
1 Department of Animal Science, The University of Connecticut, Storrs, Connecticut, United States of America, 2 Department of Pathobiology and Veterinary Sciences, The
University of Connecticut, Storrs, Connecticut, United States of America, 3 Center of Excellence for Vaccine Research, The University of Connecticut, Storrs, Connecticut,
United States of America, 4 Department of Allied Health Sciences, The University of Connecticut, Storrs, Connecticut, United States of America
Abstract
Mycoplasma gallisepticum-mediated respiratory inflammation in chickens is associated with accumulation of leukocytes inthe tracheal submucosa. However the molecular mechanisms underpinning these changes have not been well described.We hypothesized that the initial inflammatory events are initiated upon ligation of mycoplasma lipid associated membraneproteins (LAMP) to TLRs expressed on chicken tracheal epithelial cells (TEC). To test this hypothesis, live bacteria or LAMPsisolated from a virulent (Rlow) or a non-virulent (Rhigh) strain were incubated with primary TECs or chicken tracheae ex vivo.Microarray analysis identified up-regulation of several inflammatory and chemokine genes in TECs as early as 1.5 hours post-exposure. Kinetic analysis using RT-qPCR identified the peak of expression for most genes to be at either 1.5 or 6 hours. Ex-vivo exposure also showed up-regulation of inflammatory genes in epithelial cells by 1.5 hours. Among the commonly up-regulated genes were IL-1b, IL-6, IL-8, IL-12p40, CCL-20, and NOS-2, all of which are important immune-modulators and/orchemo-attractants of leukocytes. While these inflammatory genes were up-regulated in all four treatment groups, Rlow
exposed epithelial cells both in vitro and ex vivo showed the most dramatic up-regulation, inducing over 100 unique genesby 5-fold or more in TECs. Upon addition of a TLR-2 inhibitor, LAMP-mediated gene expression of IL-1b and CCL-20 wasreduced by almost 5-fold while expression of IL-12p40, IL-6, IL-8 and NOS-2 mRNA was reduced by about 2–3 fold.Conversely, an NF-kB inhibitor abrogated the response entirely for all six genes. miRNA-146a, a negative regulator of TLR-2signaling, was up-regulated in TECs in response to either Rlow or Rhigh exposure. Taken together we conclude that LAMPsisolated from both Rhigh and Rlow induced rapid, TLR-2 dependent but transient up-regulation of inflammatory genes inprimary TECs through an NF-kB dependent pathway.
Citation: Majumder S, Zappulla F, Silbart LK (2014) Mycoplasma gallisepticum Lipid Associated Membrane Proteins Up-regulate Inflammatory Genes in ChickenTracheal Epithelial Cells via TLR-2 Ligation through an NF-kB Dependent Pathway. PLoS ONE 9(11): e112796. doi:10.1371/journal.pone.0112796
Editor: Mitchell F. Balish, Miami University, United States of America
Received June 26, 2014; Accepted October 20, 2014; Published November 17, 2014
This is an open-access article, free of all copyright, and may be freely reproduced, distributed, transmitted, modified, built upon, or otherwise used by anyone forany lawful purpose. The work is made available under the Creative Commons CC0 public domain dedication.
Data Availability: The authors confirm that all data underlying the findings are fully available without restriction. All relevant data are within the paper and itsSupporting Information files. All microarray datasets have been deposited into Gene Expression Omnibus database repository, accession number GSE61520(http://www.ncbi.nlm.nih.gov/geo/query/acc.cgi?acc = GSE61520).
Funding: Support was provided by the United States Department of Agriculture, National Institute of Food and Agriculture to LKS (Hatch project numberCONS00930) [http://portal.nifa.usda.gov/web/crisprojectpages/0179772-the-role-of-membrane-associated-lipoproteins-and-hydrogen-peroxide-in-the-pathogenesis-of-mycoplasma-gallisepticum-in-chickens.html]. The funders had no role in study design, data collection and analysis, decision to publish, orpreparation of the manuscript.
Competing Interests: The authors have declared that no competing interests exist.
* Email: [email protected]
Introduction
Mycoplasma gallisepticum (M. gallisepticum) is an avian
respiratory pathogen causing severe inflammation of the trachea,
air sacs and lungs, especially in the presence of a co-infection [1–
3]. This pathogen is known to invade, survive and multiply inside a
variety of non-phagocytic cells such as chicken RBCs, HeLa cells,
and chicken fibroblasts, [4–9]. In addition, M. gallisepticum is
known to colonize many extra-pulmonary tissues including blood,
heart, spleen, liver and brain [4,5,7,8,10]. Indikova et al. (2013)
suggested that invasion may occur at the air sac, where the
mucosal barrier is quite thin [7]. However, there is yet no clear
evidence that M. gallisepticum invades tracheal epithelial cells invivo [unpublished observations], as it predominantly colonizes the
mucosal surface and only rarely is found inside phagocytic
vacuoles [11]. Nonetheless, the organism orchestrates immuno-
pathological changes in the tracheal mucosa marked by infiltration
of heterophils, macrophages and lymphocytes [2,12,13] soon after
attachment and colonization of the respiratory surface.
A previous study from our laboratory reported up-regulation of
several chemokines including lymphotactin, CXCL-13, RANTES
and MIP-1b in chicken trachea isolated from live birds within
24 hours of experimental M. gallisepticum infection [12]. These
chemokines are primarily produced by macrophages, lymphocytes
and NK cells; cell types not found in large numbers in the
uninfected tracheal mucosa [14–19]. However, chemokines and
cytokines that are produced by epithelial cells upon infection are
PLOS ONE | www.plosone.org 1 November 2014 | Volume 9 | Issue 11 | e112796

known for their ability to recruit phagocytic cells and lymphocytes
into infected tissues [20]. Due to the protective layer of mucus, it is
not clear if the initial interaction of mycoplasmas with the host
epithelium is driven by viable organisms or microbial components
such as lipoprotein-bearing membrane fragments or both,
although substantial evidence supports the notion that the initial
‘‘pathogen perception’’ occurs upon interaction of various PAMPs
with TLRs [20–24]. Previous studies conducted using other
mycoplasma species suggest an important role for epithelial cells in
inflammation. For example, A549 human lung epithelial cells
increase their production of IL-8, TNF-a, IL-1b, and IL-6
following Mycoplasma pneumoniae (M. pneumoniae) exposure
[25]. Similarly, cultured human endocervical epithelial cells
exposed to Mycoplasma genitalium (M. genitalium) secreted
several pro-inflammatory chemokines and cytokines including
IL-6, IL-7, IL-8, MCP-1 and GM-CSF [26–28].
Due to the lack of a peptidoglycan cell wall or outer membrane,
mycoplasmas do not possess lipopolysaccharides (LPS), lipotechoic
acid or flagella. Even though certain mycoplasmas are known for
production of exotoxins, like the M. pneumoniae CARDS toxin or
Mycoplasma arthritidis mitogen MAM [29–32], the majority of
mycoplasmas including M. gallisepticum are not known to
produce or secrete any exotoxin. Their surface-exposed mem-
branes are composed of a single lipid bi-layer with numerous
embedded integral and peripheral proteins and membrane
anchored lipoproteins [33–35]. Phase and antigenic variable
expression of these membrane lipoproteins provides a mechanism
of immune evasion [36–46], and the importance of these
molecules is reflected by the percentage of the mycoplasma
genome devoted to lipoproteins. For example, in M. gallisepticumabout 10% of the genome is devoted to vlhAs (variable lipoprotein
hemagglutinins) which includes 38 genes with signature vlhAfeatures and 5 pseudogenes possessing vlhA sequence homology
[47].
Mycoplasma lipoproteins are known to partition into the Triton
X-114 detergent phase during phase partitioning. This detergent
phase fraction may also contain other hydrophobic proteins
besides lipoproteins [48], and therefore has been termed ‘‘lipid
associated membrane proteins’’ (LAMPs) [48–51]. In other
mycoplasma species, the detergent phase fraction containing these
LAMPs was found to activate NF-kB via TLR-1, 2, 6 as well as
CD-14 via a MyD88 pathway, and induce expression of pro-
inflammatory cytokines in monocytes and macrophages
[43,48,50–53]. Recently, it was also found that mycoplasma
LAMPs are capable of activating the NLRP3 inflammasome
resulting in the induction of IL-1b [54]. Several other studies
found that lipoproteins purified from the TX-114 fraction induce
inflammatory responses via TLR-2 or TLR-1/2 andTLR-2/6
heterodimers [28,34,48–50,55–59]. However, the vast majority of
these in-vitro studies were performed using leukocytes even though
the initial interactions between mycoplasma membrane compo-
nents and host cells occur at the mucosal surface upon contact
with epithelial cells [28,60,61]. Thus, we hypothesized that
LAMPs of M. gallisepticum ligate TLR-2 on respiratory epithelial
cells, resulting in the up-regulation of inflammatory chemokine
and cytokine genes via an NF- kB dependent pathway. To test this
hypothesis, M. gallisepticum LAMPs were incubated with primary
chicken tracheal epithelial cells in culture (TEC) or tracheae exvivo to examine differential gene expression and to determine if
the response is mediated via TLR-2 ligation. Similar studies using
viable organisms were conducted to assess the relative contribution
of LAMPs to early inflammatory events, using the low passage,
adherent and virulent M. gallisepticum strain Rlow or a high
passage, non-adherent and non-virulent strain, Rhigh.
Materials and Methods
Bacterial Strains and Culture ConditionsM. gallisepticum low passage virulent strain Rlow (passage 17)
and high passage non-virulent strain Rhigh (passage 167) were
cultured at 37uC in modified Hayflicks medium supplemented
with 10% horse serum and 5% yeast extract until mid-log phase as
determined by acid-mediated shift of phenol red dye from red to
orange, as previously described [2]. Cell density was measured and
a mycoplasma concentration of 0.96108 to1.66108 cfu (colony
forming unit) per milliliter, approximately mid-log phase, was
used.
Isolation of TX-114 phase proteinsM. gallisepticum strains Rlow and Rhigh were grown to mid-log
phase as previously described and pelleted by centrifuging at
10,0006g for 20 minutes. Pellets were washed twice with PBS and
suspended in 750 ml of TS buffer (10 mM Tris, 150 mM NaCl,
pH 7.5) containing 1 mM PMSF and 1% TX-114 and rocked for
30 minutes at 4uC, followed by centrifugation at 10,0006g at 4uCfor 5 minutes. The soluble phase was transferred to a new tube
and incubated at 37uC with rocking for 10 minutes and then
centrifuged for 5 minutes at room temperature to separate the
aqueous and detergent phases. 500 ml of TS buffer containing
1 mM PMSF and 1% TX114 was added to the detergent phase
obtained in the previous step and thoroughly mixed and incubated
for 15 min at 4uC followed by 10 min at 37uC with rocking
followed by centrifugation for 5 minutes (at 10,0006g) at room
temperature. The detergent phase was collected and the previous
step was repeated to obtain the final detergent phase. The LAMPs
were precipitated overnight at 220uC with 2 volumes of methanol
and centrifuged at 15,0006g for 20 minutes. Precipitated protein
was suspended in PBS by sonication for 30 seconds at output 5
using Biosonik ultrasonic disintegrator (Bronwill Scientific; Roch-
ester, NY). Protein concentration was determined by Quick Start
Bradford protein assay kit (Bio Rad; Hercules, CA) according to
manufacturer’s instructions.
Cell culture and exposure/stimulationA primary chicken tracheal epithelial cell culture was estab-
lished based upon two previously described protocols [62,63].
Five-week-old female specific pathogen free chicken tracheae were
obtained from SPAFAS (Charles River Laboratories; Mansfield,
CT) in sterile PBS (phosphate-buffered saline) containing 1X
penicillin-streptomycin to inhibit bacterial and fungal growth. The
tracheae were rinsed twice in DMEM (Dulbecco’s modified eagles
medium) (Gibco, Life technologies; Grand Island, NY) under
sterile conditions. After removal of the surrounding adipose and
muscular tissues, tracheae were cut into 2 cm pieces and incised
vertically. They were then twice rinsed for 5 minutes in PBS/DTT
(Dithiothreitol) (Sigma Aldrich; St. Louis, Missouri) (0.0385 g
DTT- in 50 ml 1X PBS) to remove non-adherent mucus. The
pieces were then rinsed twice with PBS and DMEM. To dissociate
the epithelial cells from the underlying connective tissue, about 3–
4 tracheal pieces were placed in a T25 flask containing 25 ml
dissociation solution [DMEM 50 ml, protease type XIV 0.14 g
(Sigma Aldrich), DNAse 0.01 g (Sigma Aldrich) and antibiotic/
antimycotic 1X (Gibco, Life technologies)]. The flasks were gently
shaken for 15 minutes at 37uC to slightly loosen the cells. 10%
FBS (Gibco, Life technologies) was added to block protease activity
after incubation. The tracheae were washed twice with fresh
DMEM. The luminal surface of tracheae was scraped gently with
a sterile scalpel in a petri dish containing fresh DMEM to obtain
the epithelial cells. Cells were centrifuged at 1,250 rpm for
M. gallisepticum LAMPs in Inflammatory Gene Expression
PLOS ONE | www.plosone.org 2 November 2014 | Volume 9 | Issue 11 | e112796

5 minutes to remove media. The epithelial cells were placed in
10 ml dissociation solution for 10 minutes at 37uC and then
pipetted up and down several times to dissociate clumped cells.
10% FBS was added to the dissociation solution to stop the
reaction. Cells were centrifuged at 1,250 rpm for 5 min to remove
residual enzymes and washed twice with PBS. Cells were
suspended in DMEM supplemented with 10% FBS and plated
in a T75 flask for 4 hours to allow adherent cells (primarily
fibroblasts and macrophages) to attach. The unattached cells were
collected and precipitated by centrifugation at 1,250 rpm for
5 minutes and suspended in ATE medium [DMEM F-12+Glutamax, (Gibco, Life technologies) 10% FBS (Gibco, Life
technologies), 10% chick embryo extract (US Biologicals; Salem,
MA), 1X MEM non-essential amino acids (NEAA) (Gibco, Life
technologies), 1X antibiotic/antimycotic (Gibco, Life technolo-
gies)], counted on a hemocytometer and plated on 5% matrigel
(BD Biosciences; San Jose, CA) coated T12.5 flasks. Exposure
studies were done at 96 hours post-plating when the flasks reached
70–80% confluence, at which time they were exposed to either
56108 cfu (roughly equal to 500 multiplicity of infection (MOI)
live strain Rlow, Rhigh as previously described [64] or LAMPs
isolated from each strain at a concentration of 5 mg/mL. This
concentration was based on preliminary studies where 5 mg/mL
and 50 mg/mL LAMPs showed comparable potency (based on
changes in gene regulation) and roughly equivalent to 500 MOI
(56108 cfu) live mycoplasma. All experiments were done with 6
replicates each for 1.5, 6, and 24 hours.
Whole tracheal exposureTracheae from 5-week-old female specific-pathogen free white
leghorn chickens were obtained from SPAFAS (Charles River
Laboratories; Mansfied, CT) in sterile PBS containing 1X
penicillin-streptomycin to inhibit bacterial and fungal growth.
Surrounding adipose tissues were removed and tracheae were cut
into 0.5 inch pieces by vertical incision and rinsed 3 times with
PBS and DMEM under sterile conditions. The tracheae were
exposed to either 109 cfu M. gallisepticum strains Rlow and Rhigh
or 10 mg/mL LAMPs from either strain for 1.5 or 6 hours in ATE
medium at 37uC, 5% CO2. After exposure, tracheae were digested
in dissociation solution (described previously) for 15 minutes at
37uC and immediately placed on ice. Epithelial cells from the
luminal surface of tracheal pieces were lightly scraped using a
sterile scalpel. Epithelial cells were then preserved in RNA later
(Ambion, Life Technologies; Grand Island, NY) at 4uC for future
RNA isolation (detailed below). All exposures were done with 6
replicates each for 1.5, and 6 hours.
ImmunocytostainingTracheal epithelial cells and DF-1(Chicken embryonic fibro-
blast) cells grown on coverslips were fixed with 10% formalin and
permeablized with 0.25% Triton X-100. Immunocytochemistry
was performed using primary monoclonal anti-vimentin antibody
(Sigma-aldrich) and anti E-cadherin antibody (Millipore; Billerica,
MA) at a concentration of 1:200. Fluorescence-tagged secondary
antibodies used were goat anti mouse IgG FITC (Sigma-aldrich)
for visualization of vimentin and Alexa Fluor 546 Goat Anti-
Rabbit IgG (H+L) (Life Technologies; Grand Island, NY) for
visualization of E-cadherin at a 1:250 dilution. Vectashied
HardSet mounting medium containing DAPI (49, 6-Diamidino-
2-phenylindole) (Vector Laboratories; Burlingame, CA) was used
to mount cells on a slide for imaging. Images of immunostaining
were captured using a Nikon A1R Spectral Confocal Microscope
(Nikon Instruments Inc.; Melville, NY).
Signaling inhibitorsTracheal epithelial cells were incubated with either 3 mg/mL
Rlow LAMPs or 5 mg/mL Rhigh LAMPs in the presence or absence
of signaling inhibitors. TLR-2/4 signaling inhibitor OxPAPC
(oxidated 1-palmitoyl-2-arachidonyl-sn- glycero-3-phosphorylcho-
line), TLR-4 inhibitor CLI-095, and NF-kB inhibitor Celastrol
were purchased from Invivogen (Invivogen; San Diego, CA). Cells
were co-incubated with either 10 mg/mL or 30 mg/mL OxPAPC
and LAMPs for 6 hours, in accordance with the manufacturer’s
instruction. Cells were pre-incubated with 1 mg/mL CLI-095 for
6 hours before exposure to LAMPs and then further incubated for
6 hours after LAMP exposure. Pre-incubation of cells with 5 mM
Celastrol for 30 minutes was done before LAMP exposure for
6 hours. All experiments were performed with 6 replicates each.
RNA isolation and cDNA synthesisTotal RNA was extracted from cells using TRIzol reagent (Life
Technologies) and purified using RNeasy mini columns according
to the manufacturer’s instructions (Qiagen; Valencia, CA). On-
column DNase digestion was done using RNase free DNase
(Qiagen;). RNA quality and quantity was assessed using the
Agilent 2100 Bioanalyzer with the RNA pico kit (Agilent
technologies; Mendon, MA). All RNA samples had a RNA
integrity number of 8 or more. 500 ng of RNA from individual
samples was reverse transcribed using iScript reverse transcription
supermix for RT-qPCR (Bio Rad; Hercules, CA) according to the
manufacturer’s recommendation, and 2 mg RNA was reverse
transcribed for PCR reaction to assess epithelial-specific gene
expression.
MicroarrayAgilent chicken gene expression microarray slides were utilized
(Agilent technologies). Total RNA (50 ng) was utilized as starting
material for microarray hybridization. Four biological replicates
for each of five exposure conditions utilized were: Rhigh, Rlow,
Rhigh LAMPs, Rlow LAMPs and media control. Dye swap
technical replicates were created for each biological replicate
totaling eight replicates for each exposure condition. The Agilent
two-color microarray-based gene expression analysis protocol
version 6.5 (http://www.genome.duke.edu/cores/microarray/
services/agilent-microarrays/documents/LIQA_G4140-90050_
GeneExpression_Two_Color_v6.5.pdf) was followed. All incuba-
tions were performed utilizing the Applied Biosystem Geneamp
PCR system 9700 (Life Technologies). The Agilent two-color low-
input quick amp labeling kit (Agilent technologies) was utilized for
cDNA synthesis, in-vitro amplification and labeling of nucleic
acids. Purification of labeled cRNA was performed with the
Qiagen RNeasy mini kit). Purified cRNA was fragmented using
the Agilent gene expression hybridization kit (Agilent technolo-
gies). Microarray slides and hybridization gasket were assembled
in a hybridization chamber (Agilent technologies). Samples were
placed in a rotating hybridization oven set to 10 rpm at 65uC for
17 hours. Microarray slides were scanned using a GenePix 4000B
laser scanner (Molecular Devices; Sunnyvale, CA) following the
instructions in the GenePixPro 7 user guide. Feature extraction
was performed utilizing GenePixPro 7 software (Molecular
Devices). Microarray images were visually inspected for quality
control of features (spots on microarray slide that have spotted
oligonucleotide probes). Background fluorescence of each feature
was calculated as the mean of the five closest negative control
features. Each channel’s background-corrected median fluores-
cence value was used in an intensity-based analysis utilizing
Agilent GeneSpring (v12.5) software (Agilent technologies).
Quantile normalization was performed on all the background-
M. gallisepticum LAMPs in Inflammatory Gene Expression
PLOS ONE | www.plosone.org 3 November 2014 | Volume 9 | Issue 11 | e112796
corrected intensity values and samples were clustered according to
their original exposure group. Features were removed if they were at
saturating intensity or flagged ‘‘bad’’ in the aforementioned visual
inspection. Genes were removed from downstream analysis if ,
80% of the features representing a gene were already excluded
following preprocessing of data. Genes with duplicate or triplicate
features on the microarray were grouped and their mean values
were used for a gene-level analysis. Quantile normalization was then
performed on the gene-level in-silico experiment. All microarray
datasets have been deposited into Gene Expression Omnibus
database repository, accession number GSE61520 (http://www.
ncbi.nlm.nih.gov/geo/query/acc.cgi?acc=GSE61520).
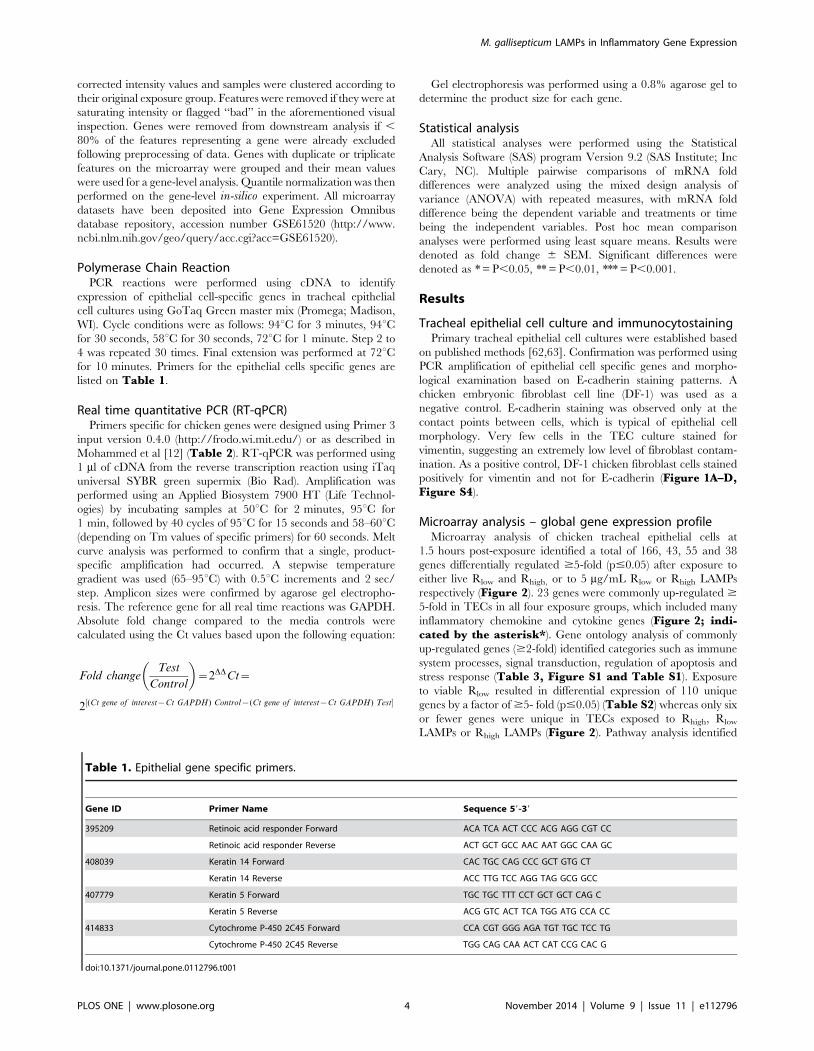
Polymerase Chain ReactionPCR reactions were performed using cDNA to identify
expression of epithelial cell-specific genes in tracheal epithelial
cell cultures using GoTaq Green master mix (Promega; Madison,
WI). Cycle conditions were as follows: 94uC for 3 minutes, 94uCfor 30 seconds, 58uC for 30 seconds, 72uC for 1 minute. Step 2 to
4 was repeated 30 times. Final extension was performed at 72uCfor 10 minutes. Primers for the epithelial cells specific genes are
listed on Table 1.
Real time quantitative PCR (RT-qPCR)Primers specific for chicken genes were designed using Primer 3
input version 0.4.0 (http://frodo.wi.mit.edu/) or as described in
Mohammed et al [12] (Table 2). RT-qPCR was performed using
1 ml of cDNA from the reverse transcription reaction using iTaq
universal SYBR green supermix (Bio Rad). Amplification was
performed using an Applied Biosystem 7900 HT (Life Technol-
ogies) by incubating samples at 50uC for 2 minutes, 95uC for
1 min, followed by 40 cycles of 95uC for 15 seconds and 58–60uC(depending on Tm values of specific primers) for 60 seconds. Melt
curve analysis was performed to confirm that a single, product-
specific amplification had occurred. A stepwise temperature
gradient was used (65–95uC) with 0.5uC increments and 2 sec/
step. Amplicon sizes were confirmed by agarose gel electropho-
resis. The reference gene for all real time reactions was GAPDH.
Absolute fold change compared to the media controls were
calculated using the Ct values based upon the following equation:
Fold changeTest
Control
� �~2DDCt~
2½(Ct gene of interest{Ct GAPDH) Control{(Ct gene of interest{Ct GAPDH) Test�
Gel electrophoresis was performed using a 0.8% agarose gel to
determine the product size for each gene.
Statistical analysisAll statistical analyses were performed using the Statistical
Analysis Software (SAS) program Version 9.2 (SAS Institute; Inc
Cary, NC). Multiple pairwise comparisons of mRNA fold
differences were analyzed using the mixed design analysis of
variance (ANOVA) with repeated measures, with mRNA fold
difference being the dependent variable and treatments or time
being the independent variables. Post hoc mean comparison
analyses were performed using least square means. Results were
denoted as fold change 6 SEM. Significant differences were
denoted as * = P,0.05, ** = P,0.01, *** = P,0.001.
Results
Tracheal epithelial cell culture and immunocytostainingPrimary tracheal epithelial cell cultures were established based
on published methods [62,63]. Confirmation was performed using
PCR amplification of epithelial cell specific genes and morpho-
logical examination based on E-cadherin staining patterns. A
chicken embryonic fibroblast cell line (DF-1) was used as a
negative control. E-cadherin staining was observed only at the
contact points between cells, which is typical of epithelial cell
morphology. Very few cells in the TEC culture stained for
vimentin, suggesting an extremely low level of fibroblast contam-
ination. As a positive control, DF-1 chicken fibroblast cells stained
positively for vimentin and not for E-cadherin (Figure 1A–D,Figure S4).
Microarray analysis – global gene expression profileMicroarray analysis of chicken tracheal epithelial cells at
1.5 hours post-exposure identified a total of 166, 43, 55 and 38
genes differentially regulated $5-fold (p#0.05) after exposure to
either live Rlow and Rhigh, or to 5 mg/mL Rlow or Rhigh LAMPs
respectively (Figure 2). 23 genes were commonly up-regulated $
5-fold in TECs in all four exposure groups, which included many
inflammatory chemokine and cytokine genes (Figure 2; indi-cated by the asterisk*). Gene ontology analysis of commonly
up-regulated genes ($2-fold) identified categories such as immune
system processes, signal transduction, regulation of apoptosis and
stress response (Table 3, Figure S1 and Table S1). Exposure
to viable Rlow resulted in differential expression of 110 unique
genes by a factor of $5- fold (p#0.05) (Table S2) whereas only six
or fewer genes were unique in TECs exposed to Rhigh, Rlow
LAMPs or Rhigh LAMPs (Figure 2). Pathway analysis identified
Table 1. Epithelial gene specific primers.
Gene ID Primer Name Sequence 59-39
395209 Retinoic acid responder Forward ACA TCA ACT CCC ACG AGG CGT CC
Retinoic acid responder Reverse ACT GCT GCC AAC AAT GGC CAA GC
408039 Keratin 14 Forward CAC TGC CAG CCC GCT GTG CT
Keratin 14 Reverse ACC TTG TCC AGG TAG GCG GCC
407779 Keratin 5 Forward TGC TGC TTT CCT GCT GCT CAG C
Keratin 5 Reverse ACG GTC ACT TCA TGG ATG CCA CC
414833 Cytochrome P-450 2C45 Forward CCA CGT GGG AGA TGT TGC TCC TG
Cytochrome P-450 2C45 Reverse TGG CAG CAA ACT CAT CCG CAC G
doi:10.1371/journal.pone.0112796.t001
M. gallisepticum LAMPs in Inflammatory Gene Expression
PLOS ONE | www.plosone.org 4 November 2014 | Volume 9 | Issue 11 | e112796

Table 2. Gene specific primers for RT-qPCR.
Primer Name Sequence 59-39
GAPDH Forward ATT CTA CAC ACG GAC ACT TCA
GAPDH Reverse CAC CAG TGG ACT CCA CAA CAT A
IL-12p40 Forward TGAAGGAGTTCCCAGATGC
IL-12p40 Reverse CGTCTTGCTTGGCTCTTTATA
IL-1b Forward GCT GGA ACT GGG CAG AT
IL-1b Reverse GGT AGA AGA TGA AGC GGG TC
IL-8 Forward GTG CAT TAG CAC TCA TTC TAA GTT
IL-8 Reverse GGC CAT AAG TGC CTT TAC G
IL-6 Forward CCT GTT CGC CTT TCA GAC CTA
IL-6 Reverse AGT CTG GGA TGA CCA CTT C
IL-10 Forward AGAGATGCTGCGCTTCTACA
IL-10 Reverse GCTTGATGGCTTTGCTCC
CCL-20 Forward GCC AGA AGC TCA AGA GGA TG
CCL-20 Reverse TCC AGA AGT TCA ACG GTT CC
NOS-2 Forward TGA TCT TTG CTG CCA AAC AG
NOS-2 Reverse TCC TCT GAG GGA AAA TGG TG
miRNA-146a Forward GAGAACTGAATTCCATGGGTTG
miRNA-146a Reverse TCCAAGCTGAAGAACTGAGC
doi:10.1371/journal.pone.0112796.t002
Figure 1. Primary chicken tracheal epithelial cell culture (TEC). Primary chicken tracheal epithelial cells were isolated and cultured asdescribed in the Methods section. 1A: Primary chicken tracheal epithelial cells at 100X magnification. 1B: Confirmation of tracheal epithelial cellidentity both in vitro and freshly isolated (ex vivo) from tracheae after ex-vivo exposure: PCR amplified epithelial cell specific genes from cDNA inagarose gel, compared to chicken embryonic fibroblast (DF-1) cells. 1C: Tracheal epithelial cells stained for E-cadherin and Vimentin at (400Xmagnification). Left panel shows TECs at different filter setting Blue (DAPI) for nuclear staining, Green (FITC) for Vimentin and Red (AlexaFluor 546) forE-cadherin, right panel shows merged picture for all filters. 1D: DF-1 fibroblast cells stained for E-cadherin and Vimentin at 400X magnification. Leftpanel shows DF-1 cells at different filter setting; Blue (DAPI) for nuclear staining, Green (FITC) for Vimentin and Red (AlexaFluor 546) for E-cadherin;right panel shows merged picture for all filters.doi:10.1371/journal.pone.0112796.g001
M. gallisepticum LAMPs in Inflammatory Gene Expression
PLOS ONE | www.plosone.org 5 November 2014 | Volume 9 | Issue 11 | e112796

Figure 2. Distribution of differentially regulated genes in TECs. Differentially regulated genes ($5 fold) in tracheal epithelial cell afterexposure to live Rlow, Rhigh or LAMPs isolated from either strain 1.5 hours after exposure. The star (*) in the figure represent commonly up-regulatedgenes upon all four exposures, from which six follow up genes were chosen. n = 8 (4 biological replicates x2 dye swap technical replicates) for allmicroarray experiments.doi:10.1371/journal.pone.0112796.g002
Table 3. Genes of significant interest from microarray analysis.
Entrez ID Gene Name mRNA Fold Change in TECs exposed to:
Rlow Rhigh Rlow LAMP Rhigh LAMP
404671 Interleukin 12B 207.80 71.80 194.67 78.21
395196 Interleukin 1, beta 9.89 7.86 6.75 5.65
395082 Chemokine (C-C motif) ligand 20 55.34 11.67 43.92 12.98
395337 Interleukin 6 42.33 30.57 27.31 20.95
396495 Interleukin 8 22.92 20.72 17.87 19.44
395807 Nitric oxide synthase 2, inducible 10.53 3.68 8.41 3.94
396451 Prostaglandin-endoperoxide synthase 2 12.98 10.65 13.13 9.76
374012 Baculoviral IAP repeat-containing 2 5.42 4.07 5.45 3.48
396384 Interferon regulatory factor 1 (IRF1) 5.66 5.48 4.73 5.07
396424 Plasminogen activator, urokinase 7.15 16.65 7.95 14.86
396033 Nuclear factor of kappa light polypeptide gene enhancer in B-cells 1 2.55 2.08 2.58 2.02
418404 Nuclear factor of kappa light polypeptide gene enhancer in B-cells inhibitor, zeta 10.24 17.96 12.14 15.32
396093 Nuclear factor of kappa light polypeptide gene enhancer inB-cells inhibitor, alpha
5.00 4.15 5.00 3.62
417465 Chemokine (C-C motif) ligand 5 2.63 2.65 2.38 2.65
396330 Interferon regulatory factor 7 6.57 5.21 5.44 4.22
421219 Toll-like receptor 15 2.75 2.53 3.69 2.11
396093 Nuclear factor of kappa light polypeptide gene enhancerin B-cells inhibitor, alpha
5.00 4.15 5.00 3.62
417247 Similar to TL1A; tumor necrosis factor (ligand) superfamily, member 15 4.22 14.47 4.08 10.33
423471 TNF receptor-associated factor 3 3.68 5.35 4.39 5.46
408036 Epiregulin 4.01 2.02 2.80 2.66
422219 Interleukin 13 receptor, alpha 2 5.40 3.25 4.57 3.64
421686 Interleukin 20 receptor, alpha 5.01 3.73 3.72 3.97
424704 Interleukin 23 receptor 2.34 2.41 2.48 4.44
422884 TNFAIP3 interacting protein 2 10.95 4.77 7.09 7.01
768950 CD80 molecule 2.96 4.77 2.44 4.02
Representative list of Table S1: mRNA fold changes $2 (p-value #0.05) in TECs exposed to Rlow, Rhigh, Rlow LAMP and Rhigh LAMP compared to control.doi:10.1371/journal.pone.0112796.t003
M. gallisepticum LAMPs in Inflammatory Gene Expression
PLOS ONE | www.plosone.org 6 November 2014 | Volume 9 | Issue 11 | e112796

differential expression of genes in the TLR signaling pathway, with
12 out of 70 genes commonly up-regulated in all four exposure
groups. Other pathways of note included the TNF-a/NF-kB
signaling, apoptosis, and type II interferon pathways (Table 4and Figure S3).
Differential gene expression in Rlow, Rlow LAMP, Rhigh andRhigh LAMP exposed TECs
A concentration of 5 mg/mL LAMPs optimally induced the
expression of IL-1b and CCL-20, which was roughly comparable
to the up-regulation induced by 500 MOI (56108 cfu) live
mycoplasma (data not shown). mRNA transcripts of six immune
response associated genes up-regulated in TECs upon exposure to
each of the four treatments were validated by RT-qPCR at 1.5, 6
and 24 hours. TECs’ expression of IL-12p40, IL-1b and IL-6
peaked at 1.5 hours post-exposures in all four exposure groups and
waned significantly thereafter in contrast to CCL-20 and nitric
oxide synthase-2 (NOS-2) which peaked at 6 hours and returned
to near baseline levels within 24 hours. IL-8 expression peaked at
6 hours in Rlow exposed TECs, however Rhigh and Rlow LAMP
exposed TECs exhibited the highest level of IL-8 gene expression
at 1.5 hours (p#0.01 and p#0.001) (Figure S2A–D). Five out of
six genes (IL-6, IL-8, IL-12p40, CCL-20 and NOS-2) were
expressed at significantly higher levels in Rlow exposed TECs when
compared to TECs exposed to Rhigh or LAMPs isolated from
either strain, at one or more time point (Figure 3A–E). IL-1bgene expression in TECs did not significantly differ between any of
the four exposures at any time point (Figure 3F). We also
observed that Rlow LAMP exposed TECs had a significantly
higher level of the IL-12p40 gene expression when compared to
TECs exposed to Rhigh LAMP at 1.5 hours (p#0.05) (Figure 3A)
and CCL-20 when compared to TECs exposed to Rhigh or Rhigh
LAMP at 1.5 and 6 hours (p#0.01 and p#0.001) (Figure 3D).
Differential gene expression in TECs by mycoplasmaLAMPs in the presence of signaling inhibitors
OxPAPC, a TLR-2 and 4 signaling inhibitor, reduced
expression of all 6 genes in a concentration dependent manner
(Figure 4A–F). IL-12p40 gene expression was reduced by more
than 2-fold in TECs exposed to LAMPs when incubated with
OxPAPC at 30 mg/mL when compared to both Rlow (P,0.05)
and Rhigh LAMP (P,0.01) exposed TECs (Figure 4A). IL–1band CCL-20 gene expression were reduced by more than 5-fold
compared to TECs exposed to Rlow (P,0.001) or Rhigh (P,0.001)
LAMPs in the absence of the inhibitor (Figure 4B, E). IL-8 (P,
0.001), IL-6 (P,0.01) and NOS-2 (P,0.001) gene expression was
also significantly reduced by approximately 2–3 fold (Figure 4C,D, and F). No difference was observed upon exposure to CLI-
095, a selective TLR-4 inhibitor, for any of the genes analyzed in
this study, supporting the hypothesis that M. gallisepticum LAMPs
signal via TLR-2 and not TLR-4 (Figure 4A–F). In the presence
of Celastrol, an NF-kB inhibitor, cell signaling was abolished
entirely (comparable to control levels) in TECs exposed to any of
the four treatments (P,0.001 for all six genes analyzed)
(Figure 4A–F).
Comparison of gene regulation in Rlow, Rlow LAMP, Rhigh
and Rhigh LAMP exposed tracheal epithelial cells ex vivomRNA transcripts of all six genes were also up-regulated in
tracheal epithelial cells isolated from whole tracheal tissues
exposed ex vivo to live Rlow, Rhigh or the LAMPs isolated
therefrom. Most genes followed a similar pattern of expression as
seen in the in vitro experiments. IL-12p40 was expressed at a
significantly higher level in Rlow exposed trachea at both time
points compared to others, and CCL-20 was significantly higher in
Rlow exposed trachea than all others at 1.5 hours (p#0.001)
(Figure 5A, 5B). IL-8 expression was higher in both Rlow and
Rhigh exposed trachea when compared to the LAMP exposed
tracheae at both time points but IL-6 was found to be higher in the
LAMP-exposed tissues (p#0.001) at 1.5 hours and lower at
6 hours (p#0.01, p#0.05) when compared to tracheae exposed
to live Rlow or Rhigh. Although IL–1b expression did not differ
between any exposure groups at 1.5 hours, at 6 hours tracheae
exposed to the live mycoplasma were found to express IL–1b at a
higher level than either LAMP-exposed tracheae (p#0.001 for
Rlow, p#0.05 for Rhigh). NOS-2 expression did not differ between
any exposure groups at any time point (Figure 5A, 5B).
Micro RNA and IL-10 gene expressionExpression analysis of four miRNA genes including mir-21, mir-
146a, mir-146b, and mir-146c1, as well as IL-10 was assessed in
TECs exposed to either LAMPs or live organisms. IL-10 gene
expression in all TECs peaked at 1.5 hours, concomitant with the
pro-inflammatory genes (Figure 6A). Expression analysis of
miRNAs showed that miRNA146a increased over time in TECs
exposed to live mycoplasmas; however in TECs exposed to the
LAMPs from both strains, miRNA146a expression peaked at
6 hours (Figure 6B). Expression of miRNA21, miRNA146b and
Table 4. Pathway analysis of differentially regulated genes.
Pathway No. of genes from different pathways up-regulated in TEC’s exposed to: Total no. of genes in pathway
Rlow Rhigh Rlow LAMP Rhigh LAMP
Toll-like receptor signaling pathway 17 15 13 13 70
TNF-alpha NF-kB Signaling Pathway 10 9 11 10 157
Adipogenesis 14 7 4 4 100
Senescence and Autophagy 10 8 7 7 73
EGFR1 Signaling Pathway 8 4 5 2 148
MAPK signaling pathway 5 7 4 5 123
Apoptosis 5 6 5 6 65
Type II interferon signaling pathway 6 4 4 4 22
Analysis performed using GeneSpring (v12.5), within genes that are differentially expressed $2-fold (p-value #0.05).doi:10.1371/journal.pone.0112796.t004
M. gallisepticum LAMPs in Inflammatory Gene Expression
PLOS ONE | www.plosone.org 7 November 2014 | Volume 9 | Issue 11 | e112796

miRNA146c1 did not differ from media controls at any time point
in any exposure group (data not shown).
Discussion
Bacterial cell envelope components such as LPS, lipotechoic
acid, peptidoglycan, flagella and lipoproteins are well character-
ized PAMPs that interact with host cell pattern recognition
receptors such as TLRs, thereby contributing in part to the
inflammation that ensues post-infection [20,43,65]. With the
exception of lipoproteins, M. gallisepticum is devoid of these
PAMPs, yet is able to initiate a robust inflammatory response
marked by infiltration of leukocytes to the submucosa, often in
absence of tissue invasion [2,12,13,66,67]. Mycoplasma lipopro-
teins are well known for their pro-inflammatory properties,
initiated upon TLR ligation and NF-kB activation [34,48–
51,55,56,68]. However, the vast majority of studies examining
these effects have focused on monocytes/macrophages maintained
in culture rather than epithelial cells, the primary site of
mycoplasma attachment and colonization [11,69].
Previous studies from our laboratory in which live birds were
exposed to M. gallisepticum intra-tracheally reported alterations in
inflammatory gene expression in whole tracheal tissue [12]. The
current study is novel in that it reports interaction of M.gallisepticum lipid associated membrane proteins, a mixture of
lipoproteins, specifically with host airway epithelial cells.
A study by Walter et al (2001) reported that IL-12p40 was
expressed by airway epithelial cells during viral tracheobronchitis
[70,71]. We also observed IL-12p40 mRNA to be significantly up-
regulated both in TECs and epithelial cells from tracheae upon
exposure to live mycoplasma or LAMPs within 1.5 hours of
exposure. But this signal waned rapidly thereafter, suggesting that
IL-12p40 acts as an early, but not sustained, inflammatory event.
IL-1b and IL-6 mRNA expression were also up-regulated and
followed similar kinetics to that observed with IL-12p40. mRNA
expression of two important chemokines, CCL-20 and IL-8 were
also significantly up-regulated in epithelial cells in-vitro and ex-vivo after exposure to LAMPs or live organisms, as was NOS-2.
These molecules are known for their ability to chemo-attract and
activate leukocytes at the site of infection [72–77]. Several other
inflammation associated genes, including TLR-15, were up-
regulated to a lesser degree in TECs in all four exposure groups
(Table 3, RT-qPCR data not shown). This cytokine and
chemokine expression profile is in keeping with earlier studies
that reported M. pneumoniae and M. genitalium mediated
production of IL-8, TNF-a, IL-1b, IL-6 IL-7, MCP-1 and GM-
CSF from epithelial cells [25–28].
A previously published study from our laboratory however,
reported down-regulation of IL-12p40, IL-8, IL–1b, and CCL-20
mRNA in tracheal tissues at day-1 post-infection, whereas
chemokines like MIP-1b, CXCL-13, RANTES and lymphotactin
were found to be up-regulated [12]. As this later set of chemokines
are known to be produced primarily by macrophages, lymphocytes
and NK cells [14–19], types of cells not found in large numbers in
normal tracheal mucosa, we believe transient but robust expres-
sion of chemokines and cytokines like IL-12p40, IL-8, IL-6, IL–1b,
and CCL-20 by tracheal epithelial cells may be responsible for
initially attracting the inflammatory cells into the tracheal
submucosa. However these signals appear to be transient and
Figure 3. Differential gene expression in TECs post-exposure. mRNA fold difference in TECs exposed to Rlow, Rlow LAMP, Rhigh or Rhigh LAMPat 1.5, 6 and 24 hours respectively. Samples normalized to housekeeping gene GAPDH and un-exposed TECs as control. n = 6 for all experiments.Results are denoted as fold change 6 SEM with all control values set at 1. Significant differences denoted as * = P,0.05, ** = P,0.01, *** = P,0.001.A: IL-12p40 mRNA. B: IL-8 mRNA. C: IL-6 mRNA. D: CCL-20 mRNA. E: NOS-2 mRNA. F: IL-1b mRNA.doi:10.1371/journal.pone.0112796.g003
M. gallisepticum LAMPs in Inflammatory Gene Expression
PLOS ONE | www.plosone.org 8 November 2014 | Volume 9 | Issue 11 | e112796

Figure 4. Differential gene expression in TECs exposed to LAMPs in the presence of signaling inhibitors. Epithelial cells were exposedto LAMPs isolated from Rlow or Rhigh in the presence or absence of signaling inhibitors for 6 hours. Samples were normalized to the housekeepinggene GAPDH and un-exposed TECs served as control. n = 6 for all experiments. Results are denoted as fold change 6 SEM with all control values set at1. Significant differences denoted as * = P,0.05, ** = P,0.01, *** = P,0.001. A. IL-12p40. B. IL-1b. C. IL-8. D. IL-6. E. CCL-20. F. NOS-2.doi:10.1371/journal.pone.0112796.g004
Figure 5. Differential gene expression in tracheal epithelial cells after ex-vivo exposure to LAMPs. Comparison of mRNA fold differencein tracheal epithelial cells from tracheal explant exposed to Rlow, Rlow LAMP, Rhigh or Rhigh LAMP at 1.5 and 6 hours respectively. Samples normalizedto housekeeping gene GAPDH and un-exposed tracheae as control. n = 6 for all experiments. Results are denoted as fold change 6 SEM with allcontrol values set at 1. Significant differences denoted as * = P,0.05, ** = P,0.01, *** = P,0.001. A: mRNA fold difference of all genes at 1.5 hours. B:mRNA fold difference of all genes at 6 hours.doi:10.1371/journal.pone.0112796.g005
M. gallisepticum LAMPs in Inflammatory Gene Expression
PLOS ONE | www.plosone.org 9 November 2014 | Volume 9 | Issue 11 | e112796

subsequent signaling events appear to involve a unique set of
inflammatory genes not observed in epithelial cells.
In the current study we also observed that Rlow was by far the
most potent stimulus for initiating differential gene expression by
epithelial cells when compared to live Rhigh or LAMPs from either
strain. TECs exposed to Rlow not only up-regulated inflammatory
genes to a significantly higher extent, but up-regulated more than
a hundred additional unique genes by $5 fold. The Rhigh strain is
non-virulent as it lacks several virulence determinant proteins of
Rlow, especially GapA and CrmA [7,78] two significant cytadhe-
sion-associated proteins homologous to P1 and P40/P90 of M.pneumoniae [78–84]. The significantly diminished cytadhesion
capability of Rhigh [7,82,85,86], may explain the reduced
differential gene expression induced by this strain. Subtle
differences in gene expression observed between the LAMPs
prepared from Rlow and Rhigh may also be explained by the
differences identified by Szczepanek et al. involving 29 mutations
in the variable GAA repeat region associated with phase variable
expression of vlhA genes between these two strains [86].
When TECs were exposed to LAMPs in the presence of
OxPAPC, a competitive inhibitor of lipoprotein and LPS
mediated signaling via TLR-2 and TLR-4 respectively [87],
expression of all six genes was significantly reduced. However in
the presence of CLI-095, a selective TLR-4 inhibitor, no changes
in gene expression were observed. When TECs were exposed to
Celastrol, an NF-kB inhibitor [88], LAMP-mediated gene
expression was completely abrogated. This observation is in
keeping with previous studies from other mycoplasma species in
which LAMP-induced inflammation was mediated upon TLR-2
ligation and activation of NF-kB [28,34,49–51,53,55,56]. More-
over, these observations apply to early time-points post-exposure,
in a highly relevant cell population.
The kinetics of inflammatory gene expression in the current
study was found to be rapid, peaking at either 1.5 hours or
6 hours, and then waning by 24 hours. As modulation of host
responses is often accompanied by concurrent pro- and anti-
inflammatory mechanisms [89], we hypothesized that a compen-
satory, homeostatic mechanism may be working in concert with
the inflammatory response. Upon NF-kB activation, certain anti-
inflammatory genes and micro RNA’s are expressed that
participate in the homeostatic regulation of inflammatory
responses. For example, miRNA-146a, which is induced by LPS
via NF-kB activation, down-regulates IRAK-1 and TRAF-6 and
in turn suppresses further activation of NF-kB [90]. miRNA146a
also negatively regulate TLR-2 signaling [91]. miRNA-21, on the
other hand can promote IL-10 production by regulating PDCD4
(programmed cell death 4), an inhibitor of IL-10 production [90].
We observed miRNA-146a expression to be increasingly up-
regulated until 24 hours in TECs exposed to either Rlow or Rhigh
in contrast to the pattern observed upon exposure to LAMPs,
which peaked at 6 hours and waned thereafter, likely due to the
lack of LAMP re-stimulation [91]. No difference in expression was
observed for miRNA146b, miRNA146c1 or miRNA21. Con-
versely, the anti-inflammatory cytokine IL-10 showed no recipro-
cal relationship to pro-inflammatory gene expression, but was
significantly up-regulated by the epithelial cells initially upon
exposure to live Rlow and the LAMPs (but not Rhigh). IL-10 is
known to selectively inhibit nuclear localization of NF-kB by
blocking IkB kinase activity and inducing nuclear translocation
and DNA-binding of the repressive p50–p50 homodimer [92,93].
Therefore, miRNA-146a and in part IL-10 may play a role in
regulating the over-exuberant pro-inflammatory response ob-
served during M.gallisepticum infection.
Taken together our data suggest that M. gallisepticum LAMPs
have potent inflammatory properties and can mediate changes in
gene expression in chicken tracheal epithelial cells almost
immediately upon exposure. However, the response appears to
be transient in nature likely due to host compensatory mecha-
nisms. Thus, continuous LAMP-mediated stimulation by adher-
ent, replicating mycoplasma may be necessary to sustain the
Figure 6. RT-qPCR analysis of miRNA and IL-10 differential expression in TECs. Epithelial cells were exposed to Rlow, Rlow LAMP, Rhigh orRhigh LAMP at 1.5, 6 and 24 hours respectively. Samples were normalized to housekeeping gene GAPDH and un-exposed TECs as control. n = 6 for allexperiments. Results are denoted as fold change 6 SEM with all control values set at 1. Significant differences denoted as * = P,0.05, ** = P,0.01,*** = P,0.001. A: mRNA fold difference of IL-10 in TECs at all three time points post exposure. B: mRNA fold difference of miRNA-146a in TECs at allthree time points post exposure.doi:10.1371/journal.pone.0112796.g006
M. gallisepticum LAMPs in Inflammatory Gene Expression
PLOS ONE | www.plosone.org 10 November 2014 | Volume 9 | Issue 11 | e112796

response. Studies using chemical inhibitors of specific signaling
pathways indicated that mycoplasma LAMPs ligate TLR2 on
TECs and activate NF-kB resulting in downstream expression of
several pro-inflammatory chemokines and cytokines. Among the
up-regulated genes are chemokines and cytokines known for
leukocyte chemo-attraction and activation, consistent with the
immunopathology associated with infection. Our data also support
the notion that the virulent Rlow strain possesses additional
mechanisms of initiating inflammatory responses in tracheal
epithelial cells beyond that mediated by LAMPs alone.
Supporting Information
Figure S1 Distribution of differentially regulated genesin TECs. Differentially regulated genes ($2 fold) in tracheal
epithelial cells after exposure to live Rlow, Rhigh or LAMPs isolated
from either strain for 1.5 hours. n = 8 (4 biological replicates x2
dye swap technical replicates) for all microarray experiments.
(TIF)
Figure S2 Kinetic analysis of differentially regulatedgenes encoding inflammatory chemokines and cyto-kines. Differential gene expression in TECs exposed to Rlow,
Rlow LAMP, Rhigh or Rhigh LAMP at 1.5, 6 and 24 hours
respectively. Samples normalized to housekeeping gene GAPDH
and un-exposed TECs as control. n = 6 for all experiments. Results
are denoted as fold change 6 SEM with all control values set at 1.
Significant differences denoted as * = P,0.05, ** = P,0.01,
*** = P,0.001. A: mRNA fold difference in Rlow exposed cells
B: mRNA fold difference in Rhigh exposed cells. C: mRNA fold
difference in Rlow LAMP exposed cells. D: mRNA fold difference
in Rhigh LAMP exposed cells.
(TIF)
Figure S3 TLR- Signaling pathway. Toll like receptor
signaling network: Common genes up-regulated in TECs exposed
to Rlow, Rhigh, Rlow LAMP or Rhigh LAMP are depicted in yellow
boxes.
(TIF)
Figure S4 Original agarose gels photos of amplifiedproducts of epithelial cell specific genes. 1A: Confirmation
of tracheal epithelial cells in culture in vitro using amplification of
epithelial cell specific genes compared to chicken embryonic
fibroblast (DF-1) cells. 1B: Confirmation of epithelial cell specific
genes in freshly isolated epithelial cells from tracheae after ex-vivoexposure.
(TIF)
Table S1 Differentially expressed genes ($2-fold, p-value #0.05). Genes commonly up-regulated in TECs exposed
to Rlow, Rhigh, Rlow lipoprotein and Rhigh lipoprotein: analyzed for
gene ontology hierarchal clustering (Excludes unknown genes
listed as finished cDNA clones).
(DOCX)
Table S2 Differentially expressed unique genes in Rlow
exposed TECs ($5-fold, p-value #0.05) (Excludes un-known genes listed as finished cDNA clones).
(DOCX)
Acknowledgments
We acknowledge Dr. Steven J. Geary for providing us with the Mycoplasmagallisepticum strains and for his critical review of the manuscript; Dr.
Steven M. Szczepanek for his helpful inputs during the early stages of
project development and critical review of the manuscript. We acknowl-
edge Dr. Tania B. Huedo-Medina for her assistance with the statistical
analyses. We also thank Ms. Xiaofen Liao for her help during isolation of
mycoplasma LAMPs and Ms. Debra Rood for her maintenance of the
laboratory.
Author Contributions
Conceived and designed the experiments: LKS SM. Performed the
experiments: SM FZ. Analyzed the data: SM FZ. Wrote the paper: LKS
SM FZ.
References
1. Sato S, Nonomura I, Shimizu F, Shoya S, Horiuchi T (1970) Mixed infection
with Mycoplasma gallisepticum and the B1 strain of Newcastle disease virus in
chickens. Natl Inst Anim Health Q (Tokyo) 10: 58–65.
2. Gaunson JE, Philip CJ, Whithear KG, Browning GF (2000) Lymphocytic
infiltration in the chicken trachea in response to Mycoplasma gallisepticuminfection. Microbiology 146 (Pt5): 1223–1229.
3. Stipkovits L, Egyed L, Palfi V, Beres A, Pitlik E, et al. (2012) Effect of low-
pathogenicity influenza virus H3N8 infection on Mycoplasma gallisepticuminfection of chickens. Avian Pathol 41: 51–57.
4. Winner F, Rosengarten R, Citti C (2000) In vitro cell invasion of Mycoplasmagallisepticum. Infect Immun 68: 4238–4244.
5. Vogl G, Plaickner A, Szathmary S, Stipkovits L, Rosengarten R, et al. (2008)
Mycoplasma gallisepticum invades chicken erythrocytes during infection. Infect
Immun 76: 71–77.
6. Furnkranz U, Siebert-Gulle K, Rosengarten R, Szostak MP (2013) Factors
influencing the cell adhesion and invasion capacity of Mycoplasma gallisepticum.
Acta Vet Scand 55: 63.
7. Indikova I, Much P, Stipkovits L, Siebert-Gulle K, Szostak MP, et al. (2013)
Role of the GapA and CrmA cytadhesins of Mycoplasma gallisepticum in
promoting virulence and host colonization. Infect Immun.
8. Much P, Winner F, Stipkovits L, Rosengarten R, Citti C (2002) Mycoplasmagallisepticum: Influence of cell invasiveness on the outcome of experimental
infection in chickens. FEMS Immunol Med Microbiol 34: 181–186.
9. Jenkins C, Geary SJ, Gladd M, Djordjevic SP (2007) The Mycoplasmagallisepticum OsmC-like protein MG1142 resides on the cell surface and binds
heparin. Microbiology 153: 1455–1463.
10. Grodio JL, Dhondt KV, O’Connell PH, Schat KA (2008) Detection and
quantification of Mycoplasma gallisepticum genome load in conjunctival samples
of experimentally infected house finches (Carpodacus mexicanus) using real-time
polymerase chain reaction. Avian Pathol 37: 385–391.
11. Tajima M, Nunoya T, Yagihashi T (1979) An ultrastructural study on the
interaction of Mycoplasma gallisepticum with the chicken tracheal epithelium.
Am J Vet Res 40: 1009–1014.
12. Mohammed J, Frasca S Jr, Cecchini K, Rood D, Nyaoke AC, et al. (2007)
Chemokine and cytokine gene expression profiles in chickens inoculated with
Mycoplasma gallisepticum strains Rlow or GT5. Vaccine 25: 8611–8621.
13. Gaunson JE, Philip CJ, Whithear KG, Browning GF (2006) The cellular
immune response in the tracheal mucosa to Mycoplasma gallisepticum in
vaccinated and unvaccinated chickens in the acute and chronic stages of disease.
Vaccine 24: 2627–2633.
14. Bystry RS, Aluvihare V, Welch KA, Kallikourdis M, Betz AG (2001) B cells and
professional APCs recruit regulatory T cells via CCL4. Nat Immunol 2: 1126–
1132.
15. Sherry B, Tekamp-Olson P, Gallegos C, Bauer D, Davatelis G, et al. (1988)
Resolution of the two components of macrophage inflammatory protein 1, and
cloning and characterization of one of those components, macrophage
inflammatory protein 1 beta. J Exp Med 168: 2251–2259.
16. Legler DF, Loetscher M, Roos RS, Clark-Lewis I, Baggiolini M, et al. (1998) B
cell-attracting chemokine 1, a human CXC chemokine expressed in lymphoid
tissues, selectively attracts B lymphocytes via BLR1/CXCR5. J Exp Med 187:
655–660.
17. Gunn MD, Ngo VN, Ansel KM, Ekland EH, Cyster JG, et al. (1998) A B-cell-
homing chemokine made in lymphoid follicles activates Burkitt’s lymphoma
receptor-1. Nature 391: 799–803.
18. Kelner GS, Kennedy J, Bacon KB, Kleyensteuber S, Largaespada DA, et al.
(1994) Lymphotactin: a cytokine that represents a new class of chemokine.
Science 266: 1395–1399.
19. Schall TJ, Jongstra J, Dyer BJ, Jorgensen J, Clayberger C, et al. (1988) A human
T cell-specific molecule is a member of a new gene family. J Immunol 141:
1018–1025.
M. gallisepticum LAMPs in Inflammatory Gene Expression
PLOS ONE | www.plosone.org 11 November 2014 | Volume 9 | Issue 11 | e112796

20. Gomez MI, Prince A (2008) Airway epithelial cell signaling in response to
bacterial pathogens. Pediatr Pulmonol 43: 11–19.
21. Fournier B, Philpott DJ (2005) Recognition of Staphylococcus aureus by the
innate immune system. Clin Microbiol Rev 18: 521–540.
22. Prince A (2006) Flagellar activation of epithelial signaling. Am J Respir Cell Mol
Biol 34: 548–551.
23. Liu X, Wetzler LM, Nascimento LO, Massari P (2010) Human airway epithelial
cell responses to Neisseria lactamica and purified porin via Toll-like receptor 2-
dependent signaling. Infect Immun 78: 5314–5323.
24. Roussel L, Martel G, Berube J, Rousseau S (2011) P. aeruginosa drives CXCL8
synthesis via redundant toll-like receptors and NADPH oxidase in CFTRF508
airway epithelial cells. J Cyst Fibros 10: 107–113.
25. Yang J, Hooper WC, Phillips DJ, Talkington DF (2002) Regulation of
proinflammatory cytokines in human lung epithelial cells infected with
Mycoplasma pneumoniae. Infect Immun 70: 3649–3655.
26. McGowin CL, Annan RS, Quayle AJ, Greene SJ, Ma L, et al. (2012) Persistent
Mycoplasma genitalium infection of human endocervical epithelial cells elicits
chronic inflammatory cytokine secretion. Infect Immun 80: 3842–3849.
27. McGowin CL, Popov VL, Pyles RB (2009) Intracellular Mycoplasma genitaliuminfection of human vaginal and cervical epithelial cells elicits distinct patterns of
inflammatory cytokine secretion and provides a possible survival niche against
macrophage-mediated killing. BMC Microbiol 9: 139.
28. McGowin CL, Ma L, Martin DH, Pyles RB (2009) Mycoplasma genitalium-
encoded MG309 activates NF-kappaB via Toll-like receptors 2 and 6 to elicit
proinflammatory cytokine secretion from human genital epithelial cells. Infect
Immun 77: 1175–1181.
29. Krishnan M, Kannan TR, Baseman JB (2013) Mycoplasma pneumoniaeCARDS toxin is internalized via clathrin-mediated endocytosis. PLoS One 8:
e62706.
30. Medina JL, Coalson JJ, Brooks EG, Winter VT, Chaparro A, et al. (2012)
Mycoplasma pneumoniae CARDS toxin induces pulmonary eosinophilic and
lymphocytic inflammation. Am J Respir Cell Mol Biol 46: 815–822.
31. Cole BC (1991) The immunobiology of Mycoplasma arthritidis and its
superantigen MAM. Curr Top Microbiol Immunol 174: 107–119.
32. Cole BC, Aldridge KE, Ward JR (1977) Mycoplasma-dependent activation of
normal lymphocytes: mitogenic potential of mycoplasmas for mouse lympho-
cytes. Infect Immun 18: 393–399.
33. Zuo LL, Wu YM, You XX (2009) Mycoplasma lipoproteins and Toll-like
receptors. J Zhejiang Univ Sci B 10: 67–76.
34. Shimizu T, Kida Y, Kuwano K (2008) A triacylated lipoprotein from
Mycoplasma genitalium activates NF-kappaB through Toll-like receptor 1
(TLR1) and TLR2. Infect Immun 76: 3672–3678.
35. Chambaud I, Wroblewski H, Blanchard A (1999) Interactions between
mycoplasma lipoproteins and the host immune system. Trends Microbiol 7:
493–499.
36. Tulman ER, Liao X, Szczepanek SM, Ley DH, Kutish GF, et al. (2012)
Extensive variation in surface lipoprotein gene content and genomic changes
associated with virulence during evolution of a novel North American house
finch epizootic strain of Mycoplasma gallisepticum. Microbiology 158: 2073–
2088.
37. Xu CG, Hao YQ, Zhang L, Hao RX, Liu XL, et al. (2014) Molecular cloning
and immune response analysis of putative variable lipoproteins from
Mycoplasma mycoides subsp capri. Genet Mol Res 13: 1527–1539.
38. Noormohammadi AH, Markham PF, Kanci A, Whithear KG, Browning GF
(2000) A novel mechanism for control of antigenic variation in the
haemagglutinin gene family of Mycoplasma synoviae. Mol Microbiol 35: 911–
923.
39. Yogev D, Menaker D, Strutzberg K, Levisohn S, Kirchhoff H, et al. (1994) A
surface epitope undergoing high-frequency phase variation is shared by
Mycoplasma gallisepticum and Mycoplasma bovis. Infect Immun 62: 4962–4968.
40. Chopra-Dewasthaly R, Baumgartner M, Gamper E, Innerebner C, Zimmer-
mann M, et al. (2012) Role of Vpma phase variation in Mycoplasma agalactiaepathogenesis. FEMS Immunol Med Microbiol 66: 307–322.
41. Wu HN, Kawaguchi C, Nakane D, Miyata M (2012) "Mycoplasmal antigen
modulation," a novel surface variation suggested for a lipoprotein specifically
localized on Mycoplasma mobile. Curr Microbiol 64: 433–440.
42. Nouvel LX, Marenda M, Sirand-Pugnet P, Sagne E, Glew M, et al. (2009)
Occurrence, plasticity, and evolution of the vpma gene family, a genetic system
devoted to high-frequency surface variation in Mycoplasma agalactiae.
J Bacteriol 191: 4111–4121.
43. You XX, Zeng YH, Wu YM (2006) Interactions between mycoplasma lipid-
associated membrane proteins and the host cells. J Zhejiang Univ Sci B 7: 342–
350.
44. Behrens A, Heller M, Kirchhoff H, Yogev D, Rosengarten R (1994) A family of
phase- and size-variant membrane surface lipoprotein antigens (Vsps) of
Mycoplasma bovis. Infect Immun 62: 5075–5084.
45. Calcutt MJ, Kim MF, Karpas AB, Muhlradt PF, Wise KS (1999) Differential
posttranslational processing confers intraspecies variation of a major surface
lipoprotein and a macrophage-activating lipopeptide of Mycoplasma fermentans.Infect Immun 67: 760–771.
46. Citti C, Wise KS (1995) Mycoplasma hyorhinis vlp gene transcription: critical
role in phase variation and expression of surface lipoproteins. Mol Microbiol 18:
649–660.
47. Papazisi L, Gorton TS, Kutish G, Markham PF, Browning GF, et al. (2003) The
complete genome sequence of the avian pathogen Mycoplasma gallisepticumstrain R(low). Microbiology 149: 2307–2316.
48. Liu YC, Lin IH, Chung WJ, Hu WS, Ng WV, et al. (2012) Proteomics
characterization of cytoplasmic and lipid-associated membrane proteins ofhuman pathogen Mycoplasma fermentans M64. PLoS One 7: e35304.
49. He J, Wang S, Zeng Y, You X, Ma X, et al. (2014) Binding of CD14 to
Mycoplasma genitalium-Derived Lipid-Associated Membrane Proteins Upregu-
lates TNF-alpha. Inflammation 37: 322–330.
50. He J, You X, Zeng Y, Yu M, Zuo L, et al. (2009) Mycoplasma genitalium-derived lipid-associated membrane proteins activate NF-kappaB through toll-
like receptors 1, 2, and 6 and CD14 in a MyD88-dependent pathway. ClinVaccine Immunol 16: 1750–1757.
51. Logunov D, Shchebliakov DV, Zubkova OV, Shmarov MM, Rakovskaia IV, et
al. (2009) [Lipid-associated membrane lipopeptides of M. arginini activate NF-
kB by interacting with TLR2/1, TLR2/6, and TLR2/CD14]. Mol GenMikrobiol Virusol: 25–28.
52. You X, Wu Y, Zeng Y, Deng Z, Qiu H, et al. (2008) Mycoplasma genitalium-
derived lipid-associated membrane proteins induce activation of MAPKs, NF-kappaB and AP-1 in THP-1 cells. FEMS Immunol Med Microbiol 52: 228–236.
53. Qiu H, Wu YM, You XX, Yu MJ, Zeng YH (2007) [Mycoplasma genitaliumlipid-associated membrane proteins induce human monocytic cell expressproinflammatory cytokines and apoptosis by activating nuclear factor kappaB].
Wei Sheng Wu Xue Bao 47: 899–904.
54. Xu Y, Li H, Chen W, Yao X, Xing Y, et al. (2013) Mycoplasma hyorhinisactivates the NLRP3 inflammasome and promotes migration and invasion ofgastric cancer cells. PLoS One 8: e77955.
55. Shimizu T, Kida Y, Kuwano K (2005) A dipalmitoylated lipoprotein from
Mycoplasma pneumoniae activates NF-kappa B through TLR1, TLR2, andTLR6. J Immunol 175: 4641–4646.
56. Shimizu T, Kida Y, Kuwano K (2007) Triacylated lipoproteins derived from
Mycoplasma pneumoniae activate nuclear factor-kappaB through toll-like
receptors 1 and 2. Immunology 121: 473–483.
57. Seya T, Matsumoto M (2002) A lipoprotein family from Mycoplasma fermentansconfers host immune activation through Toll-like receptor 2. Int J Biochem Cell
Biol 34: 901–906.
58. Deiters U, Muhlradt PF (1999) Mycoplasmal lipopeptide MALP-2 induces thechemoattractant proteins macrophage inflammatory protein 1alpha (MIP-
1alpha), monocyte chemoattractant protein 1, and MIP-2 and promotes
leukocyte infiltration in mice. Infect Immun 67: 3390–3398.
59. Into T, Kiura K, Yasuda M, Kataoka H, Inoue N, et al. (2004) Stimulation ofhuman Toll-like receptor (TLR) 2 and TLR6 with membrane lipoproteins of
Mycoplasma fermentans induces apoptotic cell death after NF-kappa Bactivation. Cell Microbiol 6: 187–199.
60. Fichorova RN, Cronin AO, Lien E, Anderson DJ, Ingalls RR (2002) Response
to Neisseria gonorrhoeae by cervicovaginal epithelial cells occurs in the absence
of toll-like receptor 4-mediated signaling. J Immunol 168: 2424–2432.
61. Choi SY, Lim JW, Shimizu T, Kuwano K, Kim JM, et al. (2012) Reactiveoxygen species mediate Jak2/Stat3 activation and IL-8 expression in pulmonary
epithelial cells stimulated with lipid-associated membrane proteins fromMycoplasma pneumoniae. Inflammation Research 61: 493–501.
62. Zaffuto KM, Estevez CN, Afonso CL (2008) Primary chicken tracheal cell
culture system for the study of infection with avian respiratory viruses. Avian
Pathol 37: 25–31.
63. Shen CI, Wang CH, Liao JW, Hsu TW, Kuo SM, et al. The infection ofprimary avian tracheal epithelial cells with infectious bronchitis virus. Vet Res
41: 6.
64. Bischof DF, Janis C, Vilei EM, Bertoni G, Frey J (2008) Cytotoxicity ofMycoplasma mycoides subsp. mycoides small colony type to bovine epithelial
cells. Infect Immun 76: 263–269.
65. Love W, Dobbs N, Tabor L, Simecka JW (2010) Toll-like receptor 2 (TLR2)
plays a major role in innate resistance in the lung against murine Mycoplasma.PLoS One 5: e10739.
66. Razin S, Yogev D, Naot Y (1998) Molecular biology and pathogenicity of
mycoplasmas. Microbiol Mol Biol Rev 62: 1094–1156.
67. Javed MA, Frasca S Jr, Rood D, Cecchini K, Gladd M, et al. (2005) Correlatesof immune protection in chickens vaccinated with Mycoplasma gallisepticumstrain GT5 following challenge with pathogenic M. gallisepticum strain R(low).
Infect Immun 73: 5410–5419.
68. Rawadi G (2000) Mycoplasma fermentans interaction with monocytes/macrophages: molecular basis. Microbes Infect 2: 955–964.
69. Rottem S (2003) Interaction of mycoplasmas with host cells. Physiol Rev 83:
417–432.
70. Walter MJ, Kajiwara N, Karanja P, Castro M, Holtzman MJ (2001) Interleukin12 p40 production by barrier epithelial cells during airway inflammation. J Exp
Med 193: 339–351.
71. Oppmann B, Lesley R, Blom B, Timans JC, Xu Y, et al. (2000) Novel p19
protein engages IL-12p40 to form a cytokine, IL-23, with biological activitiessimilar as well as distinct from IL-12. Immunity 13: 715–725.
72. Hieshima K, Imai T, Opdenakker G, Van Damme J, Kusuda J, et al. (1997)
Molecular cloning of a novel human CC chemokine liver and activation-regulated chemokine (LARC) expressed in liver. Chemotactic activity for
lymphocytes and gene localization on chromosome 2. J Biol Chem 272: 5846–
5853.
M. gallisepticum LAMPs in Inflammatory Gene Expression
PLOS ONE | www.plosone.org 12 November 2014 | Volume 9 | Issue 11 | e112796

73. Baggiolini M, Clark-Lewis I (1992) Interleukin-8, a chemotactic and inflamma-
tory cytokine. FEBS Lett 307: 97–101.74. Zamora R, Vodovotz Y, Billiar TR (2000) Inducible nitric oxide synthase and
inflammatory diseases. Mol Med 6: 347–373.
75. Medina S, Del Rio M, Hernanz A, Guaza C, De la Fuente M (2005) Nitric oxidereleased by accessory cells mediates the gastrin-releasing peptide effect on
murine lymphocyte chemotaxis. Regul Pept 131: 46–53.76. Hsieh CS, Macatonia SE, Tripp CS, Wolf SF, O’Garra A, et al. (1993)
Development of TH1 CD4+ T cells through IL-12 produced by Listeria-induced
macrophages. Science 260: 547–549.77. Xing Z, Zganiacz A, Santosuosso M (2000) Role of IL-12 in macrophage
activation during intracellular infection: IL-12 and mycobacteria synergisticallyrelease TNF-alpha and nitric oxide from macrophages via IFN-gamma
induction. J Leukoc Biol 68: 897–902.78. Papazisi L, Frasca S Jr, Gladd M, Liao X, Yogev D, et al. (2002) GapA and
CrmA coexpression is essential for Mycoplasma gallisepticum cytadherence and
virulence. Infect Immun 70: 6839–6845.79. Dallo SF, Chavoya A, Baseman JB (1990) Characterization of the gene for a 30-
kilodalton adhesion-related protein of Mycoplasma pneumoniae. Infect Immun58: 4163–4165.
80. Krause DC, Balish MF (2001) Structure, function, and assembly of the terminal
organelle of Mycoplasma pneumoniae. FEMS Microbiol Lett 198: 1–7.81. Kahane I, Tucker S, Leith DK, Morrison-Plummer J, Baseman JB (1985)
Detection of the major adhesin P1 in triton shells of virulent Mycoplasmapneumoniae. Infect Immun 50: 944–946.
82. Papazisi L, Troy KE, Gorton TS, Liao X, Geary SJ (2000) Analysis ofcytadherence-deficient, GapA-negative Mycoplasma gallisepticum strain R.
Infect Immun 68: 6643–6649.
83. Krause DC, Balish MF (2004) Cellular engineering in a minimal microbe:structure and assembly of the terminal organelle of Mycoplasma pneumoniae.
Mol Microbiol 51: 917–924.
84. Krause DC (1996) Mycoplasma pneumoniae cytadherence: unravelling the tie
that binds. Mol Microbiol 20: 247–253.
85. May M, Papazisi L, Gorton TS, Geary SJ (2006) Identification of fibronectin-
binding proteins in Mycoplasma gallisepticum strain R. Infect Immun 74: 1777–
1785.
86. Szczepanek SM, Tulman ER, Gorton TS, Liao X, Lu Z, et al. (2010)
Comparative genomic analyses of attenuated strains of Mycoplasma gallisepti-cum. Infect Immun 78: 1760–1771.
87. Erridge C, Kennedy S, Spickett CM, Webb DJ (2008) Oxidized phospholipid
inhibition of toll-like receptor (TLR) signaling is restricted to TLR2 and TLR4:
roles for CD14, LPS-binding protein, and MD2 as targets for specificity of
inhibition. J Biol Chem 283: 24748–24759.
88. Sethi G, Ahn KS, Pandey MK, Aggarwal BB (2007) Celastrol, a novel
triterpene, potentiates TNF-induced apoptosis and suppresses invasion of tumor
cells by inhibiting NF-kappaB-regulated gene products and TAK1-mediated
NF-kappaB activation. Blood 109: 2727–2735.
89. Griesinger G, Saleh L, Bauer S, Husslein P, Knofler M (2001) Production of pro-
and anti-inflammatory cytokines of human placental trophoblasts in response to
pathogenic bacteria. J Soc Gynecol Investig 8: 334–340.
90. Alam MM, O’Neill LA (2011) MicroRNAs and the resolution phase of
inflammation in macrophages. Eur J Immunol 41: 2482–2485.
91. Quinn EM, Wang JH, O’Callaghan G, Redmond HP (2013) MicroRNA-146a is
upregulated by and negatively regulates TLR2 signaling. PLoS One 8: e62232.
92. Wang P, Wu P, Siegel MI, Egan RW, Billah MM (1995) Interleukin (IL)-10
inhibits nuclear factor kappa B (NF kappa B) activation in human monocytes.
IL-10 and IL-4 suppress cytokine synthesis by different mechanisms. J Biol
Chem 270: 9558–9563.
93. Driessler F, Venstrom K, Sabat R, Asadullah K, Schottelius AJ (2004) Molecular
mechanisms of interleukin-10-mediated inhibition of NF-kappaB activity: a role
for p50. Clin Exp Immunol 135: 64–73.
M. gallisepticum LAMPs in Inflammatory Gene Expression
PLOS ONE | www.plosone.org 13 November 2014 | Volume 9 | Issue 11 | e112796