myanmar transport sector policy note: how to reduce ... · myanmar transport sector policy note:...
TRANSCRIPT

ASIAN DEVELOPMENT BANK
MYANMAR TRANSPORTSECTOR POLICY NOTE HOW TO REDUCE TRANSPORT COSTS

ASIAN DEVELOPMENT BANK
Creative Commons Attribution 3.0 IGO license (CC BY 3.0 IGO)
© 2016 Asian Development Bank6 ADB Avenue, Mandaluyong City, 1550 Metro Manila, PhilippinesTel +63 2 632 4444; Fax +63 2 636 2444www.adb.org
Some rights reserved. Published in 2016. Printed in the Philippines.
ISBN 978-92-9257-459-8 (Print), 978-92-9257-460-4 (e-ISBN) Publication Stock No. RPT168051-2
Cataloging-In-Publication Data
Asian Development Bank. Myanmar transport sector policy note: How to reduce transport costs.Mandaluyong City, Philippines: Asian Development Bank, 2016.
1. Transport. 2. Transport costs. 3. Myanmar. I. Asian Development Bank.
The views expressed in this publication are those of the authors and do not necessarily reflect the views and policies of the Asian Development Bank (ADB) or its Board of Governors or the governments they represent.
ADB does not guarantee the accuracy of the data included in this publication and accepts no responsibility for any consequence of their use. The mention of specific companies or products of manufacturers does not imply that they are endorsed or recommended by ADB in preference to others of a similar nature that are not mentioned.
By making any designation of or reference to a particular territory or geographic area, or by using the term “country” in this document, ADB does not intend to make any judgments as to the legal or other status of any territory or area.
This work is available under the Creative Commons Attribution 3.0 IGO license (CC BY 3.0 IGO) https://creativecommons.org/licenses/by/3.0/igo/. By using the content of this publication, you agree to be bound by the terms of this license.
This CC license does not apply to non-ADB copyright materials in this publication. If the material is attributed to another source, please contact the copyright owner or publisher of that source for permission to reproduce it. ADB cannot be held liable for any claims that arise as a result of your use of the material.
Attribution—In acknowledging ADB as the source, please be sure to include all of the following information: Author. Year of publication. Title of the material. © Asian Development Bank [and/or Publisher].
URL. Available under a CC BY 3.0 IGO license.
Translations—Any translations you create should carry the following disclaimer:Originally published by the Asian Development Bank in English under the title [title] © [Year of publication]
Asian Development Bank. All rights reserved. The quality of this translation and its coherence with the original text is the sole responsibility of the [translator]. The English original of this work is the only official version.
Adaptations—Any adaptations you create should carry the following disclaimer:This is an adaptation of an original Work © Asian Development Bank [Year]. The views expressed here are
those of the authors and do not necessarily reflect the views and policies of ADB or its Board of Governors or the governments they represent. ADB does not endorse this work or guarantee the accuracy of the data included in this publication and accepts no responsibility for any consequence of their use.
Please contact [email protected] if you have questions or comments with respect to content, or if you wish to obtain copyright permission for your intended use that does not fall within these terms, or for permission to use the ADB logo.
Notes: In this publication, “$” refers to US dollars. Corrigenda to ADB publications may be found at: http://www.adb.org/publications/corrigendaThe fiscal year of the Government of Myanmar begins on 1 April.

iii
Contents
Tables and Figures ivForeword viiAcknowledgments ix
Abbreviations x
Executive Summary xi1 Transport Demand Patterns 11.1 Passenger Transport Demand 11.2 Freight Transport Demand 31.3 Role of Public State-Owned Transport Enterprises 6
2 Road Transport Services 132.1 Road Freight Transport 132.2 Intercity Bus Services 22
3 Railway Transport Services 263.1 Fares 263.2 Costs 27
4 River Transport Services 334.1 Rates and Services 334.2 Costs 34
5 Competitiveness of Each Mode of Transport 375.1 Freight 375.2 Passenger Transport 43
6 Outlook and Benefits from Operational Improvements and Policy Reforms 486.1 Analysis Framework 486.2 Baseline and Outlook without Improvements 506.3 Operational Improvements and Policy Reforms 53

iv
Tables and Figures
Tables1 Passenger Transport Volumes by Distance, 2013 12 Freight Transport Volumes by Distance 43 1993 Transport Modal Share 64 Comparison of Transport Rates and Economic Costs, 1993 75 Potential Long-Term Modal Share 86 2013 Transport Modal Share 87 Myanmar’s Vehicle Fleet, 1990–2014 158 Freight Rates: Yangon–Mandalay, 710 kilometers 179 Freight Rates: Mandalay–Muse, 450 kilometers 1810 Freight Rates: Other Corridors 1811 Truck Characteristics 2012 Fleet Age Distribution 2013 Truck Economic Costs 2114 Fleet Age Distribution 2315 Surveyed Bus Operator Size 2316 Long-Distance Bus Rates 2317 Economic Costs of a Bus 2418 Long-Distance Rail Fares, 2013 2719 Myanma Railways Financial Expenses, FY2012 2820 Myanma Railways Costs and Cost Coverage Ratio (Top-Down Analysis) 3021 Myanma Railways Cost Coverage Ratio—Comparison of Top-Down and Bottom-Up Analysis 3122 Long-Distance River Passenger Fares 3423 River Vessel Cost Data—2013 Survey 3424 River Freight Cost Model Parameters 3525 Freight Vessel Operating Costs for a Distance of 950 kilometers 3626 Freight Modal Competitiveness—Price and Speed 3827 Total Transport Costs for the Shipper for a Low-Value Commodity between Yangon
and Mandalay 3828 Total Transport Costs for the Shipper for a High-Value Commodity
Over a Distance of 250 kilometers 3929 Market Shares if Mode Choice Are Purely Based on Price and Time Factors 4030 Modal Market Share by Commodity 4131 Myanma Railways Freight Transport Volumes, FY2013–FY2014 4232 Passenger Transport Speed and Rates 4333 Total Perceived User Costs per Passenger Category between Yangon and Mandalay 4434 Total Perceived User Costs per Passenger Category—Other Areas 4535 Comparison between Observed and Predicted Modal Shares 46

Tables and Figures�v
36 Passenger Transport Costs and Modal Shares, 2013 5037 Freight Transport Costs and Modal Shares, 2013 5138 Long-Distance Transport Volumes 5239 Long-Distance Transport Volumes 5240 Reducing Myanmar’s Transport Costs: Benefits of Selected Measures 5741 Potential Passenger Transport Costs and Modal Shares, 2025 5942 Potential Freight Transport Costs and Modal Shares, 2025 59
FiguresES1 Long-Distance Transport Modal Share Trends in Myanmar xiiES2 Truck Freight Rates xiiiES3 Myanma Railways Costs and Rates xivES4 Myanmar Long-Distance Transport Costs xvES5 Proposed Program: Net Present Value of Benefits and Costs xviES6 Impacts of Operational and Efficiency Improvements on Myanmar’s Transport Costs xvii1 Passenger Transport Volumes by Length of Trip 22 Passenger Transport Volumes and Modal Share on Main Corridors 23 Passenger Modal Share on Main Corridors 34 Freight Transport Volumes by Distance 45 Freight Transport Volumes and Modal Share on Main Corridors 56 Freight Modal Share on Main Corridors 57 Long-Distance Transport Modal Share Trends in Myanmar 88, 9, and 10 Unit Operating Expenditures and Revenues of State-Owned Transport Enterprises 911 and 12 Traffic Volume of Main State-Owned Transport Enterprises 1013, 14, and 15 State-Owned Transport Enterprises Operating Expenses, Revenues, and Investments 1116 Freight Rates 1917 Annual Truck Mileage 2018 Freight Rates and Financial Costs, Yangon–Mandalay Corridor 2219 Bus Rates and Financial Costs 2520 Myanma Railways Investment 2821 Myanma Railways Estimated Assets at Replacement Value 2822 Myanma Railways Estimated Depreciation Costs 2923 Myanma Railways Estimated Capital Costs 2924 Myanma Railways Costs and Rates 3025 International Rail Rates Benchmarks 3126 Modeled Vessel Costs by Distance 3627 Yangon–Mandalay Corridor Transport Costs of Low-Value Commodities 3928 Yangon–Mandalay Corridor Transport Costs of Medium-Value Commodities 3929 Transport Costs of Low-Value Commodities in Other Areas 4030 Transport Costs of High-Value Commodities in Other Areas 4031 Freight Economic Costs and User Costs—Yangon–Mandalay, Low-Value Commodity 4232 Yangon–Mandalay Corridor Transport Costs of Low-Income Passengers 4533 Yangon–Mandalay Corridor Transport Costs of High-Income Passengers 4534 Other Areas, Transport Costs of Low-Income Passengers 4635 Other Areas, Transport Costs of High-Income Passengers 46

vi�Tables and Figures
36 Predicted Passenger Transport Matrix 4737 Observed Passenger Transport Matrix 4738 Low-Income Passenger Economic and User Costs, Yangon–Mandalay 4739 Myanmar’s Long-Distance Transport Costs 5140 Passenger Transport Volumes 5241 Passenger Transport Production 5242 Reducing Myanmar’s Long-Distance Transport Costs 5843 Yangon–Mandalay Passenger Transport Volumes, 2025 6044 Yangon–Mandalay Freight Transport Volumes, 2025 6045 Other Areas, Passenger Transport Volumes, 2025 6046 Other Areas, Freight Transport Volumes, 2025 60

vii
Foreword
Myanmar is at a historic milestone in its transition into a market economy and democracy. After decades of isolation and stagnation, the country has, since 2011, been undergoing a fundamental political, economic, and social transformation at unprecedented speed and scope. Achieving the
country’s high growth potential will require continued reforms and structural transformation, especially in advancing major investments in infrastructure, developing relevant capacities and skills, and enhancing the business environment. This will enable Myanmar to reach the ranks of upper middle income economies by 2030.
Due to massive underinvestment and neglect in recent history, Myanmar’s infrastructure lags behind its Association of Southeast Asian Nations neighbors, and hinders access to markets and social services. High transport costs and associated limited access to markets and services are among the main causes of poverty and regional inequality. Twenty million people still live in villages without access to all-season roads. The questions then are: how can basic transport services be provided to all? What does it take to improve the quality of the transport infrastructure and services for the private sector? How can Myanmar reduce the economic and social costs of transport?
The Government of the Republic of the Union of Myanmar is committed to addressing these questions, and the underlying issues. Toward this end, the Government has commissioned from the Asian Development Bank (ADB) the preparation of a Transport Sector Policy Note. The Transport Sector Policy Note takes stock of the transport sector challenges, provides a strategic framework for reforms that could assist Myanmar’s policymaking, and identifies the areas where international financial and technical assistance could make the highest contribution to the development of Myanmar’s transport sector.
The Transport Sector Policy Note is composed of nine reports, including this one, and a summary for decision-makers. The first two—How to Reform Transport Institutions, and How to Reduce Transport Costs—provide an overview and framework for policy reform, institutional restructuring, and investments. These are accompanied by separate reviews of key subsectors of transport: Railways, River Transport, Rural Roads and Access, Trunk Roads, and Urban Transport. These reports summarize and interpret trends on each transport sector to propose new initiatives to develop them. The thematic report Road Safety builds a first assessment of road safety in Myanmar. The thematic report How to Improve Road User Charges is a stand-alone study of cost-recovery in the road sector.
The research was organized by ADB and the then Ministry of Transport, with the active participation of the Ministry of Construction and the then Ministry of Railway Transportation. A working group comprising senior staff from these government ministries guided preparation. The work stretched over the period of 24 months, and was timed such that the final results could be presented to the new government that assumed office in April 2016, as a contribution to its policy making in the transport sector.
viii�Foreword
As the Transport Sector Policy Note demonstrates, Myanmar can, and should, develop a modern transport system that provides low-cost and safe services, is accessible to all including in rural areas and lagging regions, and connects Myanmar with its neighbors by 2030. The Government has the determination to doing so, and can tap the support from development partners, the private sector and other stakeholders. It can take inspiration from good practices in the region and globally.
The Transport Sector Policy Note provides a rich set of sector data, is meant to be thought-provoking, presents strategic directions, and makes concrete reform recommendations. It stresses the need to strengthen the role of planning and policy-making to make the best use of scarce resources in the transport sector. It highlights the need to reexamine the roles of the state—and particularly state enterprises—and the private sector in terms of regulation, management, and delivery of services in the sector. It identifies private sector investment, based on principles of cost-recovery and competitive bidding, as a driver for accelerated change. Finally, it aims at a safe, accessible, and environmentally friendly transport system, in which all modes of transport play the role for which they are the most suited.
We are confident that the Transport Sector Policy Note will provide value and a meaningful contribution to Myanmar’s policymakers and other key stakeholders in the transport sector.
James Nugent H.E. Thant Sin MaungDirector General Union MinisterSoutheast Asia Department Ministry of Transport Asian Development Bank and Communications
J N

ix
Acknowledgments
The Transport Sector Policy Note was prepared at the initiative of Hideaki Iwasaki, director of the Transport and Communications Division of the Southeast Asia Department of the Asian Development Bank (ADB). It was prepared by ADB staff and consultants. Adrien Véron-Okamoto (ADB)
coordinated the study, prepared the notes How to Reduce Transport Costs, How to Improve Road User Charges and the overall Summary for Decision-Makers, drafted the executive summaries, and contributed substantially to the notes How to Reform Transport Institutions, River Transport, Trunk Roads, and Urban Transport. Gregory Wood prepared the note How to Reform Transport Institutions. The Railways note was prepared by Paul Power. It also benefited from analytical research and suggestions by Richard Bullock. Eric Howard prepared the Road Safety note. Kek Chung Choo prepared the River Transport note. Paul Starkey and Serge Cartier van Dissel prepared the Rural Roads and Access note. Serge Cartier van Dissel also prepared the Trunk Roads note. Colin Brader (of Integrated Transport Planning) prepared the Urban Transport note.
The notes benefited from advice and suggestions from ADB peer reviewers and colleagues including James Leather, Steve Lewis-Workman, Masahiro Nishimura, Markus Roesner, David Salter, Nana Soetantri, and Fergal Trace. Angelica Luz Fernando coordinated the publication of the reports. The editing and typesetting team, comprising Hammed Bolotaolo, Corazon Desuasido, Joanne Gerber, Joseph Manglicmot, Larson Moth, Principe Nicdao, Kate Tighe-Pigott, Maricris Tobias, and Alvin Tubio greatly enhanced the reports.
Assistance from the Government of Myanmar, especially of the Ministry of Transport and Communications, the Ministry of Construction, and the Ministry of Agriculture, Livestock and Irrigation, is gratefully acknowledged. A first draft of these notes was presented and reviewed by government’s study counterparts in 2015. This final version benefited from the comments and suggestions received.
x
Abbreviations
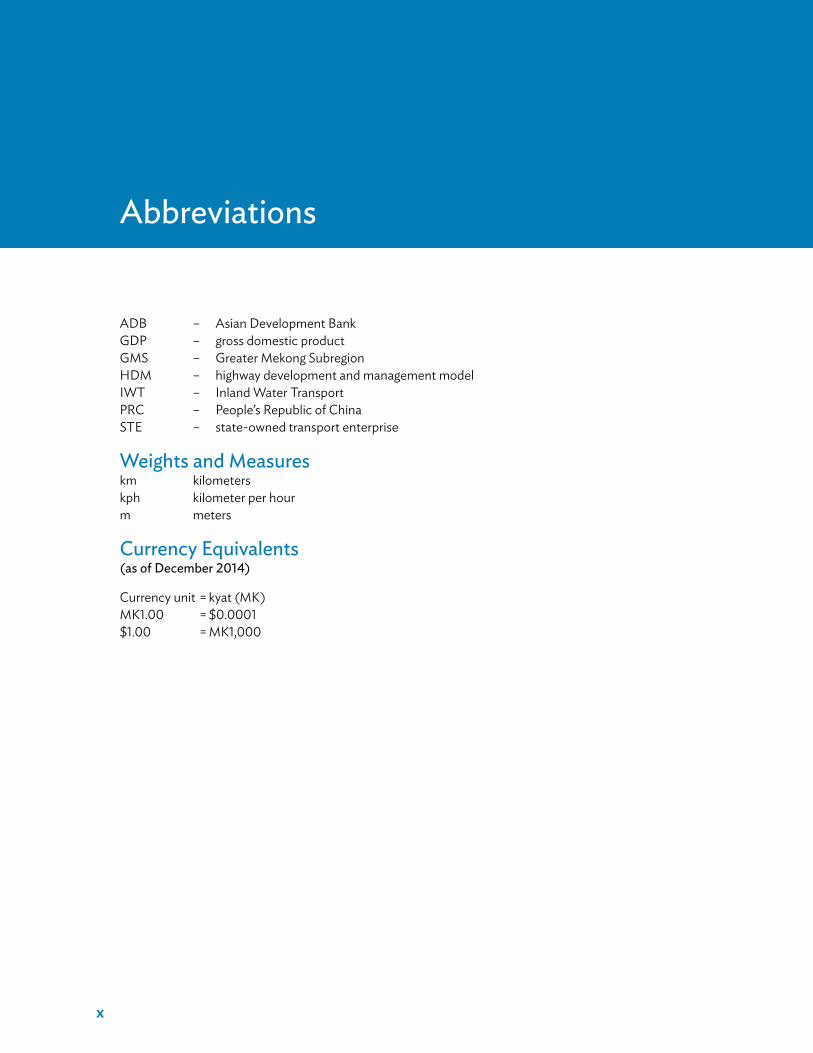
ADB – Asian Development BankGDP – gross domestic productGMS – Greater Mekong SubregionHDM – highway development and management modelIWT – Inland Water TransportPRC – People’s Republic of ChinaSTE – state-owned transport enterprise
Weights and Measureskm kilometerskph kilometer per hourm meters
Currency Equivalents(as of December 2014)
Currency unit = kyat (MK)MK1.00 = $0.0001$1.00 = MK1,000

xi
Executive Summary
The Demand for Transport in MyanmarMyanmar’s economy has so far required very few movements of goods over a long distance. At about 1.3 tons of goods per person and per year, Myanmar needs to move 3–5 times less, by weight, than countries at a similar level of development. The reason behind this exceptionalism is likely structural, linked to the way Myanmar’s economy has been organized. Myanmar’s freight rates are actually very comparable or even lower than that of other developing countries. This history makes Myanmar’s transport system ill adapted to the upcoming transformations of Myanmar’s economy that will very likely make it more freight-intensive. In particular, Myanmar’s logistics infrastructure is not geared to large movements of commodities over long distance. It lacks a performing rail or river freight transport system, and relies mostly on trucking, which ensures more than 90% of movements of freight over land.
By contrast, Myanmar’s population is remarkably mobile. People make on average of two long-distance trips per person each year. For comparison, this is about the level in the United States (US) in 1960s. Passenger movements have grown 80% faster than the economy in the last 20 years. The historical role of the railways, which still moved 44% of people in 1991, has declined over the years, so that its modal share was only 10%–12% in 2013. More than 60% of people move by bus, which provides twice faster and more reliable transport, for only moderately higher prices, and almost 25% move already by car or pickup.
The 5 years between 2007 and 2012 have initiated a deep transformation of Myanmar’s transport demand. On the one hand, the government lifted some of the very heavy constraints and taxes imposed on people wishing to purchase trucks, buses, or cars. Just between 2012 and 2014, the number of trucks and cars has doubled. We estimate that this policy change likely reduced freight trucking costs by about 20%. On the other hand, the government reduced its support for public road, rail, and river transport operators, which had been heavily subsidized. Since 2007, the government successively raised fuel costs, fares, the costs of imports of parts and equipment (which, until 2012, were done at the official exchange rate), while insisting that transport operators balance their books, pay for the retirement of their staff, but without much equity support if any. As a result, the market share of public transport operators has collapsed and in 2014 remained on a declining trend. In 1993, public transport operators accounted for 73% market share for passengers, which had fallen to 15% by 2013. For freight, their market share was lower (36%), but has fallen even more to 7.5%.
xii�Executive Summary
The Costs of TransportIn this policy note, we carry out a detailed analysis of the costs and rates charged by transport operators, drawing from the very rich data of the 2012–2013 National Transport Development Plan surveys. Our findings reveal the following patterns:
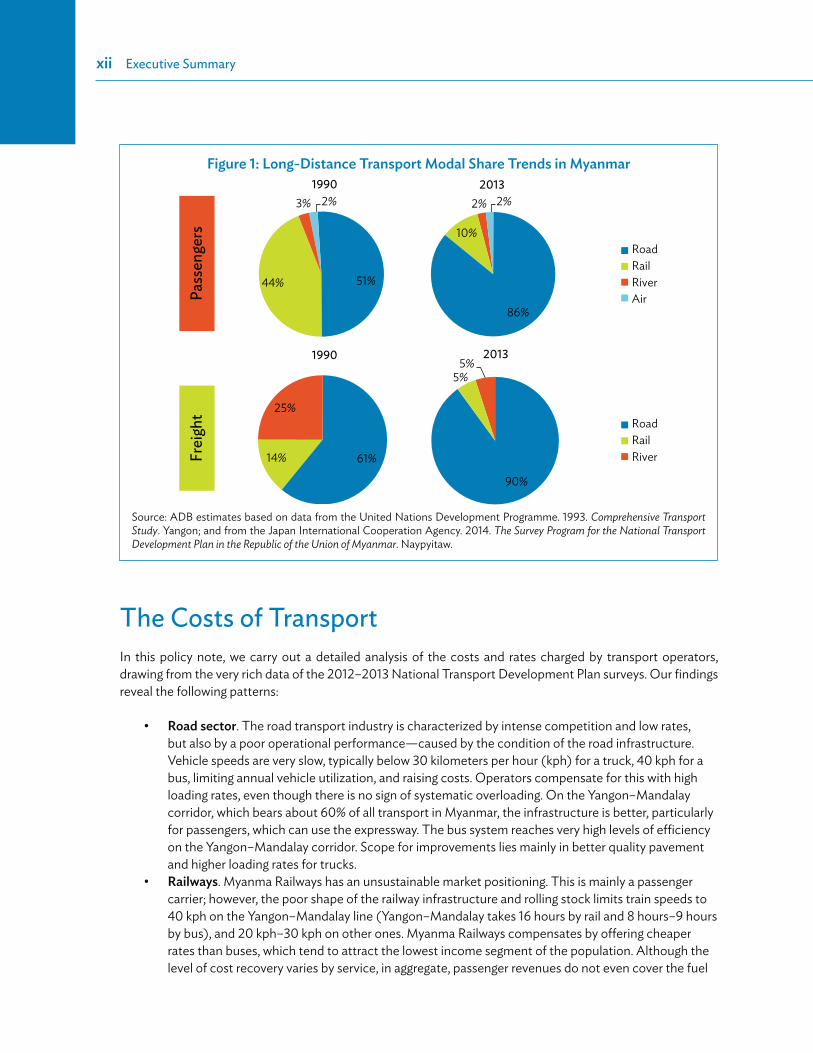
Road sector. The road transport industry is characterized by intense competition and low rates, but also by a poor operational performance—caused by the condition of the road infrastructure. Vehicle speeds are very slow, typically below 30 kilometers per hour (kph) for a truck, 40 kph for a bus, limiting annual vehicle utilization, and raising costs. Operators compensate for this with high loading rates, even though there is no sign of systematic overloading. On the Yangon–Mandalay corridor, which bears about 60% of all transport in Myanmar, the infrastructure is better, particularly for passengers, which can use the expressway. The bus system reaches very high levels of efficiency on the Yangon–Mandalay corridor. Scope for improvements lies mainly in better quality pavement and higher loading rates for trucks.Railways. Myanma Railways has an unsustainable market positioning. This is mainly a passenger carrier; however, the poor shape of the railway infrastructure and rolling stock limits train speeds to 40 kph on the Yangon–Mandalay line (Yangon–Mandalay takes 16 hours by rail and 8 hours–9 hours by bus), and 20 kph–30 kph on other ones. Myanma Railways compensates by offering cheaper rates than buses, which tend to attract the lowest income segment of the population. Although the level of cost recovery varies by service, in aggregate, passenger revenues do not even cover the fuel
Figure 1: Long-Distance Transport Modal Share Trends in Myanmar
3% 2%
5%5%
90%
25%
14% 61%
86%
10%
2%
51%44%
1990Pa
ssen
gers
Frei
ght
1990
2013
2013
2%
RoadRailRiverAir
RoadRailRiver
Source: ADB estimates based on data from the United Nations Development Programme. 1993. Comprehensive Transport Study. Yangon; and from the Japan International Cooperation Agency. 2014. The Survey Program for the National Transport Development Plan in the Republic of the Union of Myanmar. Naypyitaw.
Executive Summary�xiii
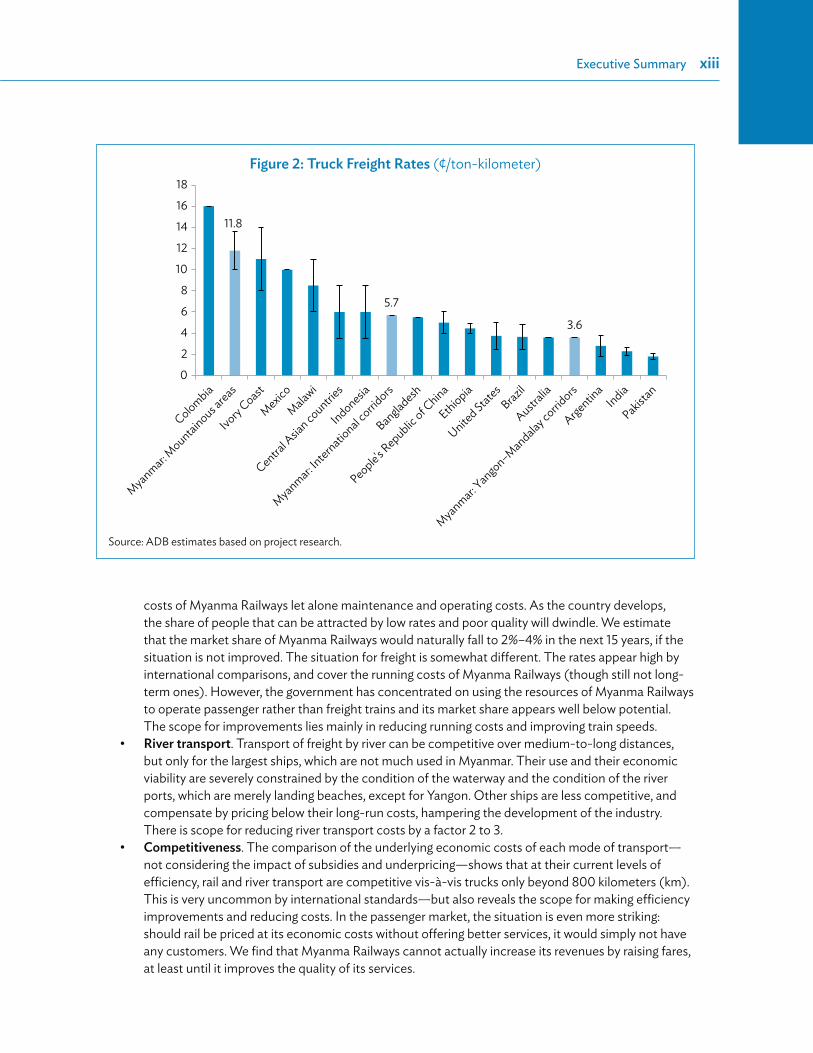
costs of Myanma Railways let alone maintenance and operating costs. As the country develops, the share of people that can be attracted by low rates and poor quality will dwindle. We estimate that the market share of Myanma Railways would naturally fall to 2%–4% in the next 15 years, if the situation is not improved. The situation for freight is somewhat different. The rates appear high by international comparisons, and cover the running costs of Myanma Railways (though still not long-term ones). However, the government has concentrated on using the resources of Myanma Railways to operate passenger rather than freight trains and its market share appears well below potential. The scope for improvements lies mainly in reducing running costs and improving train speeds. River transport. Transport of freight by river can be competitive over medium-to-long distances, but only for the largest ships, which are not much used in Myanmar. Their use and their economic viability are severely constrained by the condition of the waterway and the condition of the river ports, which are merely landing beaches, except for Yangon. Other ships are less competitive, and compensate by pricing below their long-run costs, hampering the development of the industry. There is scope for reducing river transport costs by a factor 2 to 3.Competitiveness. The comparison of the underlying economic costs of each mode of transport—not considering the impact of subsidies and underpricing—shows that at their current levels of efficiency, rail and river transport are competitive vis-à-vis trucks only beyond 800 kilometers (km). This is very uncommon by international standards—but also reveals the scope for making efficiency improvements and reducing costs. In the passenger market, the situation is even more striking: should rail be priced at its economic costs without offering better services, it would simply not have any customers. We find that Myanma Railways cannot actually increase its revenues by raising fares, at least until it improves the quality of its services.
Figure 2: Truck Freight Rates (¢/ton-kilometer)
11.8
5.7
3.6
Colombia
Myanmar: Mountainous a
reas
Myanmar: Internatio
nal corridors
Myanmar: Yangon–Mandalay corrid
ors
Bangladesh
People's Republic of C
hina
Ethiopia
United States
Brazil
Australia
Argentina
India
Pakistan
Ivory Coast
Mexico
Malawi
Central A
sian countrie
s
Indonesia0
2
4
6
8
10
12
14
16
18
Source: ADB estimates based on project research.
xiv�Executive Summary
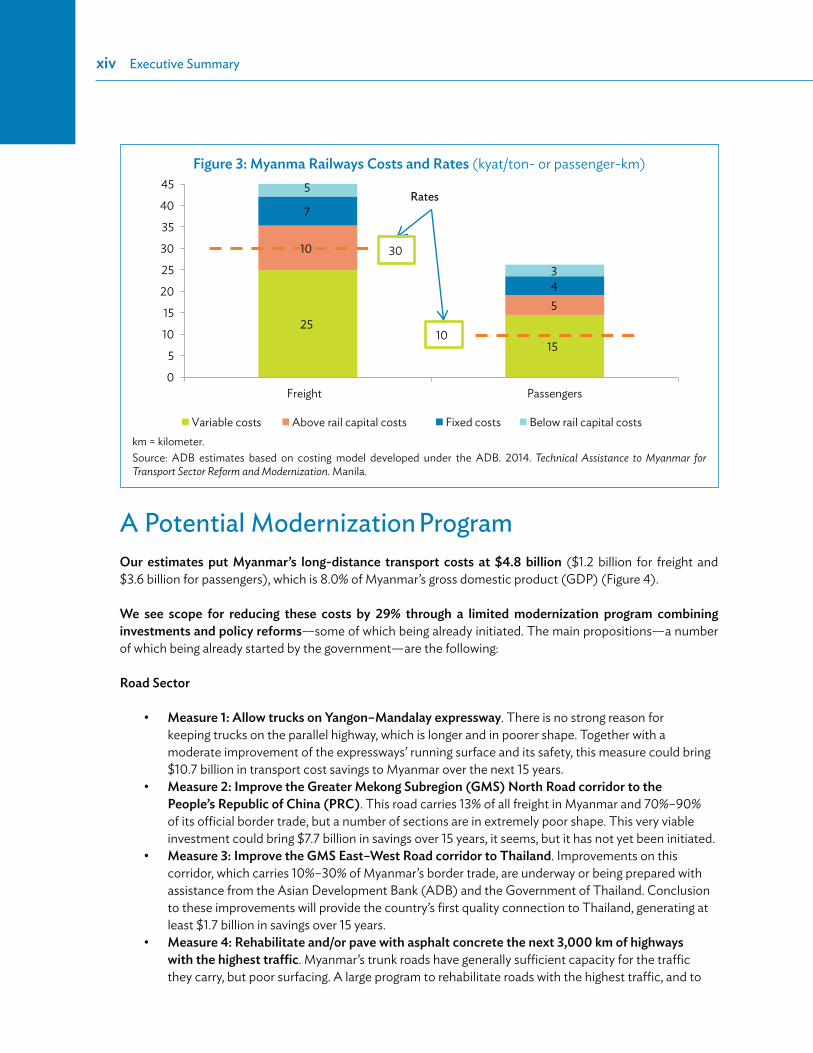
A Potential Modernization ProgramOur estimates put Myanmar’s long-distance transport costs at $4.8 billion ($1.2 billion for freight and $3.6 billion for passengers), which is 8.0% of Myanmar’s gross domestic product (GDP) (Figure 4).
We see scope for reducing these costs by 29% through a limited modernization program combining investments and policy reforms—some of which being already initiated. The main propositions—a number of which being already started by the government—are the following:
Road Sector
Measure 1: Allow trucks on Yangon–Mandalay expressway. There is no strong reason for keeping trucks on the parallel highway, which is longer and in poorer shape. Together with a moderate improvement of the expressways’ running surface and its safety, this measure could bring $10.7 billion in transport cost savings to Myanmar over the next 15 years.Measure 2: Improve the Greater Mekong Subregion (GMS) North Road corridor to the People’s Republic of China (PRC). This road carries 13% of all freight in Myanmar and 70%–90% of its official border trade, but a number of sections are in extremely poor shape. This very viable investment could bring $7.7 billion in savings over 15 years, it seems, but it has not yet been initiated.Measure 3: Improve the GMS East–West Road corridor to Thailand. Improvements on this corridor, which carries 10%–30% of Myanmar’s border trade, are underway or being prepared with assistance from the Asian Development Bank (ADB) and the Government of Thailand. Conclusion to these improvements will provide the country’s first quality connection to Thailand, generating at least $1.7 billion in savings over 15 years. Measure 4: Rehabilitate and/or pave with asphalt concrete the next 3,000 km of highways with the highest traffic. Myanmar’s trunk roads have generally sufficient capacity for the traffic they carry, but poor surfacing. A large program to rehabilitate roads with the highest traffic, and to
Figure 3: Myanma Railways Costs and Rates (kyat/ton- or passenger-km)
25
15
5
7
4
5
3
0
5
10
15
20
25
30
35
40
45
Freight Passengers
Variable costs Above rail capital costs Fixed costs Below rail capital costs
10
Rates
3010
km = kilometer.Source: ADB estimates based on costing model developed under the ADB. 2014. Technical Assistance to Myanmar for Transport Sector Reform and Modernization. Manila.

Executive Summary�xv
upgrade them to asphalt concrete standards, would cost $2 billion over 10 years, but would bring as much as $30 billion in savings over 15 years. Measure 5: Widen 1,000 km of narrow highways with traffic exceeding capacity. We estimate that 1,000 km of highways (280 km of narrow 12-feet highways and 750 km of 18-feet highways in addition to the corridor needs identified above) require widening. This would cost about $530 million, with a benefit-to-cost ratio of 1.8.
Rail Sector
Measure 6: Improve the Yangon–Mandalay rail line. Myanmar has started the rehabilitation and improvement of the main trunk railway corridor. Its modernization should enable the Myanma Railways to take a large share of the passenger transport market, and potentially also freight. We note, however, that by the time the investment is complete, train commercial speeds are reported to only reach 65 kph, which will still be slower than buses and cars. The investment appears viable, but only moderately. Should a higher commercial speed be possible (e.g., 80 kph or more), economic returns could be much higher.Measure 7: Rehabilitate selectively secondary rail lines. We believe that some secondary lines should be rehabilitated but find no viability in a program to rehabilitate all lines. Rehabilitation decisions should be taken on a case-by-case basis, where rail can take a clear competitive advantage against car or bus travel. They should go together with a program to reduce the Myanma Railways costs.Measure 8: Develop rail freight. We estimate that rail freight could capture between 7% and 15% of the market, putting its potential market by 2025 between 12.5 million tons and 27.0 million tons of commercial freight—a scale jump from the 2013 levels (1 million ton). Doing so would require new investments in rolling stock, loading facilities, and a strong market development effort. It would likely require a new organizational structure dedicated to freight (as discussed in the rail sector policy note). We find that such investments would likely be very viable, and bring cost savings to Myanmar in the range of $2.3 billion over 15 years.
Figure 4: Myanmar Long-Distance Transport Costs ($ million)
Total: $4.8 billion
Freight$1.2 billion
1,080 1,200
1,930310 25
130
85 50
River River AirRail RailBusCarRoad
Passengers$3.6 billion
Other costs (time, access, terminal)
Vehicle operating costs
Source: ADB estimates based on model developed for the study.
xvi�Executive Summary
River Transport Sector
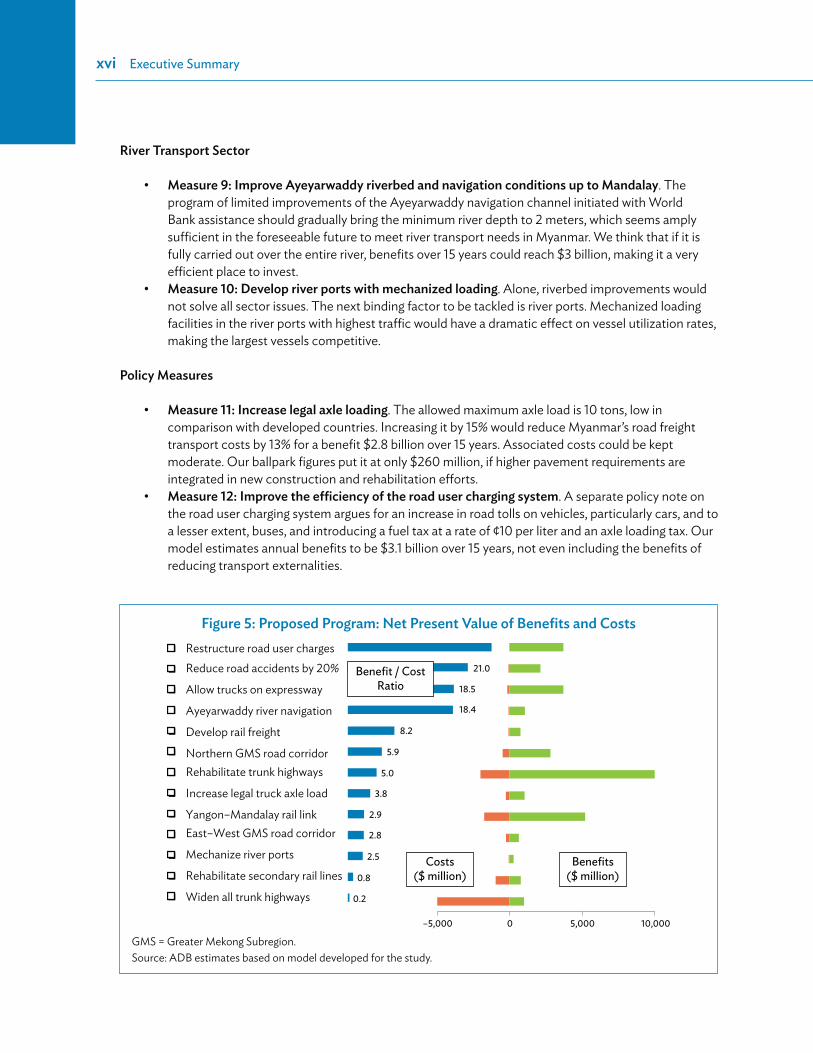
Measure 9: Improve Ayeyarwaddy riverbed and navigation conditions up to Mandalay. The program of limited improvements of the Ayeyarwaddy navigation channel initiated with World Bank assistance should gradually bring the minimum river depth to 2 meters, which seems amply sufficient in the foreseeable future to meet river transport needs in Myanmar. We think that if it is fully carried out over the entire river, benefits over 15 years could reach $3 billion, making it a very efficient place to invest.Measure 10: Develop river ports with mechanized loading. Alone, riverbed improvements would not solve all sector issues. The next binding factor to be tackled is river ports. Mechanized loading facilities in the river ports with highest traffic would have a dramatic effect on vessel utilization rates, making the largest vessels competitive.
Policy Measures
Measure 11: Increase legal axle loading. The allowed maximum axle load is 10 tons, low in comparison with developed countries. Increasing it by 15% would reduce Myanmar’s road freight transport costs by 13% for a benefit $2.8 billion over 15 years. Associated costs could be kept moderate. Our ballpark figures put it at only $260 million, if higher pavement requirements are integrated in new construction and rehabilitation efforts.Measure 12: Improve the efficiency of the road user charging system. A separate policy note on the road user charging system argues for an increase in road tolls on vehicles, particularly cars, and to a lesser extent, buses, and introducing a fuel tax at a rate of ¢10 per liter and an axle loading tax. Our model estimates annual benefits to be $3.1 billion over 15 years, not even including the benefits of reducing transport externalities.
Figure 5: Proposed Program: Net Present Value of Benefits and Costs
21.0
18.5
18.4
8.2
5.9
5.0
3.8
2.9
2.8
2.5
0.8
0.2
–5,000 5,000
Benefits($ million)
10,0000
Costs($ million)
Benefit / CostRatio
Restructure road user chargesReduce road accidents by 20%
Allow trucks on expressway
Ayeyarwaddy river navigation
Develop rail freight
Northern GMS road corridorRehabilitate trunk highways
Increase legal truck axle load
Yangon–Mandalay rail linkEast–West GMS road corridor
Mechanize river ports
Rehabilitate secondary rail lines
Widen all trunk highways
GMS = Greater Mekong Subregion.Source: ADB estimates based on model developed for the study.
Executive Summary�xvii
Measure 13: Reduce road accident rate. A 20% reduction in Myanmar’s very high road accident rates would bring a benefit over 15 years of $5.7 billion. More importantly, it would save 40,000 lives during that period.
Figure 5 summarizes the costs and benefits of each measure, ranked by their benefit-to-cost ratio.
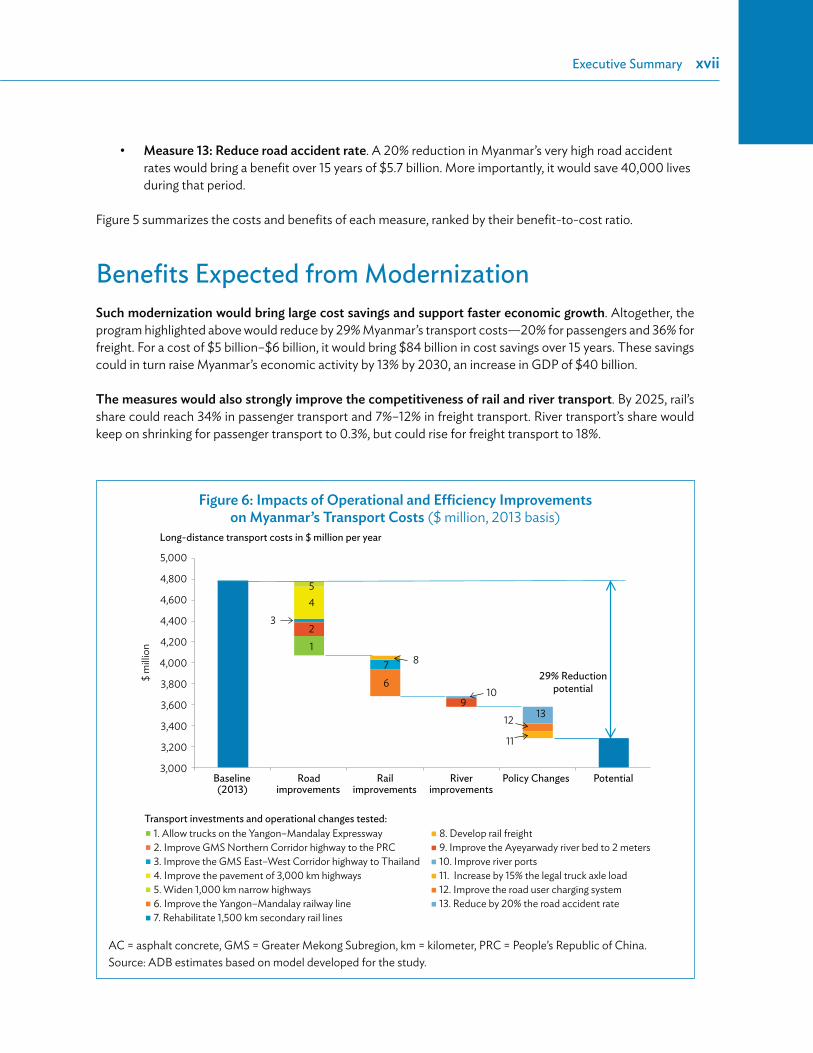
Benefits Expected from ModernizationSuch modernization would bring large cost savings and support faster economic growth. Altogether, the program highlighted above would reduce by 29% Myanmar’s transport costs—20% for passengers and 36% for freight. For a cost of $5 billion–$6 billion, it would bring $84 billion in cost savings over 15 years. These savings could in turn raise Myanmar’s economic activity by 13% by 2030, an increase in GDP of $40 billion.
The measures would also strongly improve the competitiveness of rail and river transport. By 2025, rail’s share could reach 34% in passenger transport and 7%–12% in freight transport. River transport’s share would keep on shrinking for passenger transport to 0.3%, but could rise for freight transport to 18%.
Figure 6: Impacts of Operational and Efficiency Improvements on Myanmar’s Transport Costs ($ million, 2013 basis)
5,000
4,800
4,600
4,400
4,200
4,000
3,800
3,600
3,400
3,200
3,000Baseline Road
54
321
8
910
12
11
13
76
improvements(2013) improvements improvementsRail River Policy Changes Potential
29% Reductionpotential
$ m
illion
Long-distance transport costs in $ million per year
1. Allow trucks on the Yangon–Mandalay Expressway2. Improve GMS Northern Corridor highway to the PRC3. Improve the GMS East–West Corridor highway to Thailand4. Improve the pavement of 3,000 km highways5. Widen 1,000 km narrow highways6. Improve the Yangon–Mandalay railway line7. Rehabilitate 1,500 km secondary rail lines
8. Develop rail freight9. Improve the Ayeyarwady river bed to 2 meters10. Improve river ports11. Increase by 15% the legal truck axle load12. Improve the road user charging system13. Reduce by 20% the road accident rate
Transport investments and operational changes tested:
AC = asphalt concrete, GMS = Greater Mekong Subregion, km = kilometer, PRC = People’s Republic of China.Source: ADB estimates based on model developed for the study.
1
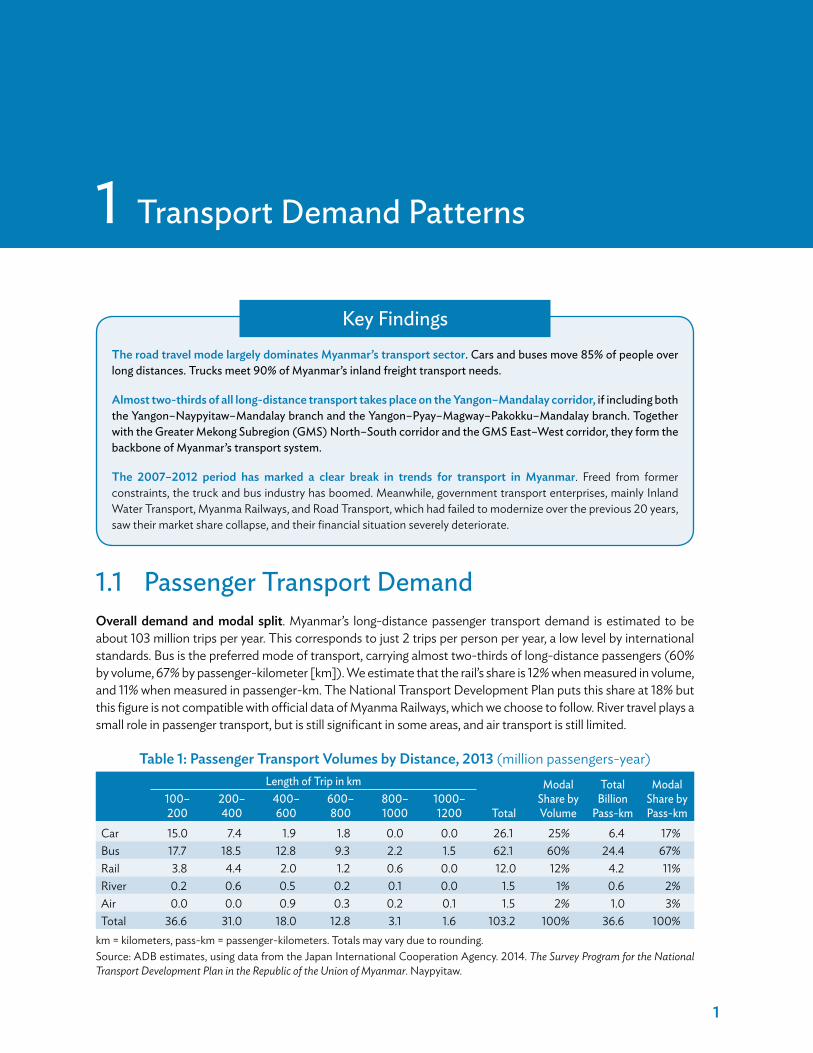
1.1 Passenger Transport DemandOverall demand and modal split. Myanmar’s long-distance passenger transport demand is estimated to be about 103 million trips per year. This corresponds to just 2 trips per person per year, a low level by international standards. Bus is the preferred mode of transport, carrying almost two-thirds of long-distance passengers (60% by volume, 67% by passenger-kilometer [km]). We estimate that the rail’s share is 12% when measured in volume, and 11% when measured in passenger-km. The National Transport Development Plan puts this share at 18% but this figure is not compatible with official data of Myanma Railways, which we choose to follow. River travel plays a small role in passenger transport, but is still significant in some areas, and air transport is still limited.
Table 1: Passenger Transport Volumes by Distance, 2013 (million passengers-year)Length of Trip in km
Total
Modal Share by Volume
Total Billion
Pass-km
Modal Share by Pass-km
100–200
200–400
400–600
600–800
800–1000
1000–1200
Car 15.0 7.4 1.9 1.8 0.0 0.0 26.1 25% 6.4 17%Bus 17.7 18.5 12.8 9.3 2.2 1.5 62.1 60% 24.4 67%Rail 3.8 4.4 2.0 1.2 0.6 0.0 12.0 12% 4.2 11%River 0.2 0.6 0.5 0.2 0.1 0.0 1.5 1% 0.6 2%Air 0.0 0.0 0.9 0.3 0.2 0.1 1.5 2% 1.0 3%Total 36.6 31.0 18.0 12.8 3.1 1.6 103.2 100% 36.6 100%
km = kilometers, pass-km = passenger-kilometers. Totals may vary due to rounding. Source: ADB estimates, using data from the Japan International Cooperation Agency. 2014. The Survey Program for the National Transport Development Plan in the Republic of the Union of Myanmar. Naypyitaw.
1 Transport Demand Patterns
Key FindingsThe road travel mode largely dominates Myanmar’s transport sector. Cars and buses move 85% of people over long distances. Trucks meet 90% of Myanmar’s inland freight transport needs.
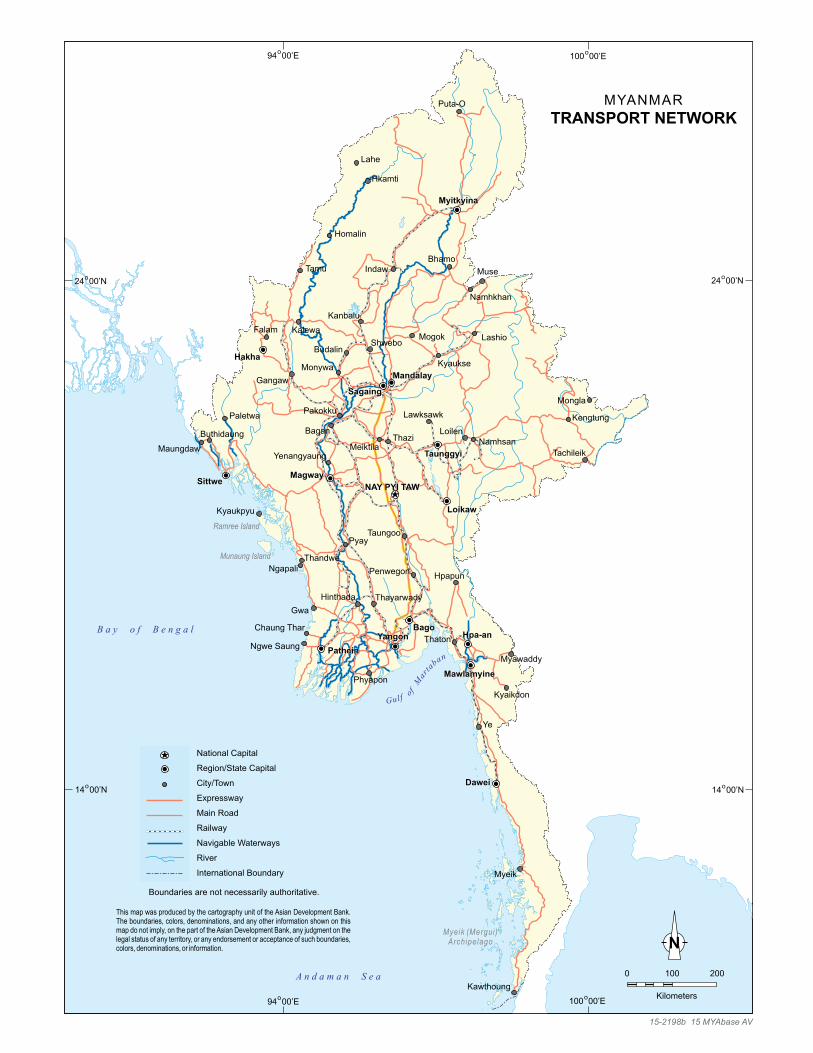
Almost two-thirds of all long-distance transport takes place on the Yangon–Mandalay corridor, if including both the Yangon–Naypyitaw–Mandalay branch and the Yangon–Pyay–Magway–Pakokku–Mandalay branch. Together with the Greater Mekong Subregion (GMS) North–South corridor and the GMS East–West corridor, they form the backbone of Myanmar’s transport system.
The 2007–2012 period has marked a clear break in trends for transport in Myanmar. Freed from former constraints, the truck and bus industry has boomed. Meanwhile, government transport enterprises, mainly Inland Water Transport, Myanma Railways, and Road Transport, which had failed to modernize over the previous 20 years, saw their market share collapse, and their financial situation severely deteriorate.

2�Myanmar Transport Sector Policy Note: How to Reduce Transport Costs
Demand by corridors. Myanmar’s transport system is dominated by the Yangon–Mandalay corridor, which accounts for 64% of all trips if considering together the Yangon–Naypyidaw–Mandalay corridor and the parallel corridor Yangon–Pyay–Magway–Mandalay.
Modal share by corridors. Road travel—usually by cars and buses—dominates in most areas. The main exception is the Mandalay–Myitkina corridor, where travel by road is such a poor option that railway (60%
Figure 1: Passenger Transport Volumes by Length of Trip(million passengers-year)
0
10
20
30
40
100–200 200–400 400–600 600–800 800–1,000 1,000–1,200
River Rail Bus Car Air
milli
on
km
km = kilometer.Source: Japan International Cooperation Agency. 2014. The Survey Program for the National Transport Development Plan in the Republic of the Union of Myanmar. Naypyitaw.
Figure 2: Passenger Transport Volumes and Modal Share on Main Corridors (million passengers)
0
5
10
15
20
25
Air Car Bus River Rail
Yangon–Naypyitaw
Naypyitaw–Mandalay
Yangon–Pathein
Mawlamyine–Dawei
Mandalay–Tamu
Loikaw–Magway
Mandalay–Muse
Yangon–Hpa–An–Myawaddy
Yangon–Pyay–Magway
Mandalay–Myitkyna
Tachilek–Meiktila–Kyaukpyu
Magway–Mandalay
Source: Japan International Cooperation Agency. 2014. The Survey Program for the National Transport Development Plan in the Republic of the Union of Myanmar. Naypyitaw.

Transport Demand Patterns�3
modal share on the corridor) and river take up part of the demand. Another exception is the Ayeyarwaddy Delta, where river transport plays a moderate role (e.g., 10% share on the Yangon–Pathein corridor).
Growth rates. A comparison with the baseline established by the 1991 Comprehensive Transport Study shows that demand has grown at 8.4% a year in the last 20 years. Because the economic growth rate during that period is estimated to have been only 4.7%, this would imply a high elasticity of passenger transport to growth of 1.8.
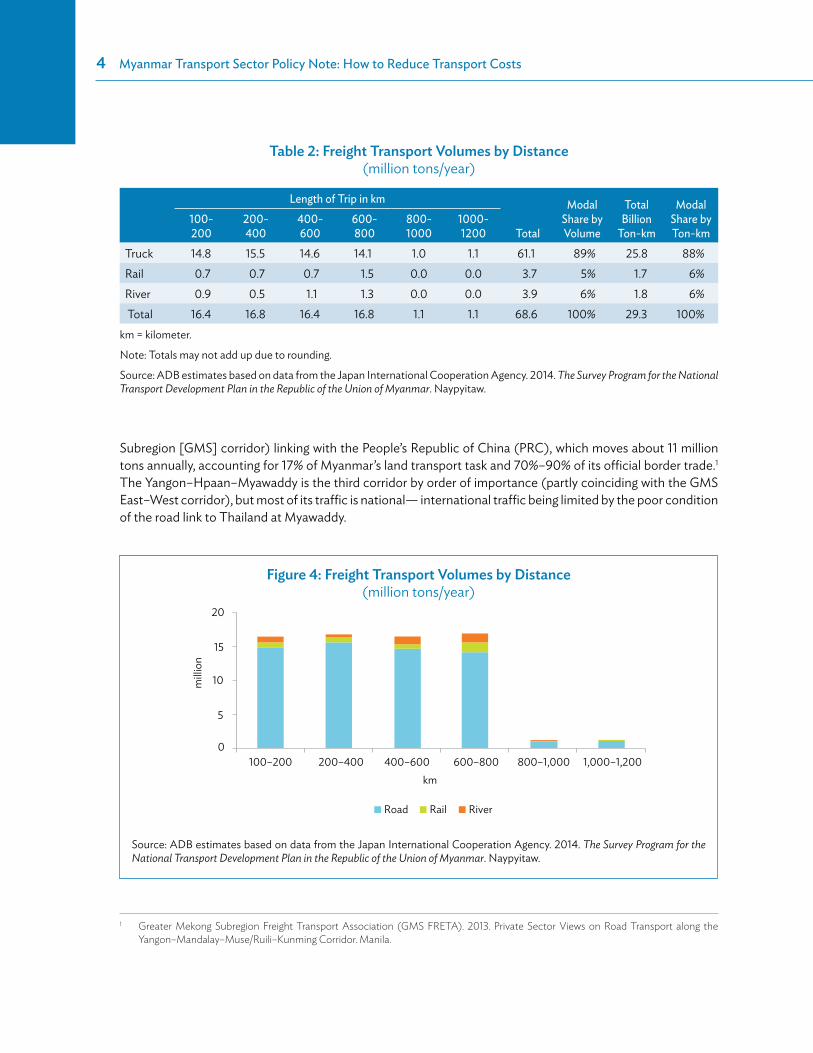
1.2 Freight Transport DemandOverall demand and modal split. Myanmar’s long-distance freight transport demand is estimated to be 68.6 million tons per year (not considering coastal and international sea transport). This corresponds to just 1.3 tons per person per year, a strikingly low level by international standards. This issue is further analyzed in the last section.
Truck is by far the preferred mode of transport, carrying almost 90% of long-distance freight. Rail transport’s share is at most 5%, and if considering only commercial rail freight, which reached just 1 million tons in 2013, barely reaching 1.5%. River transport plays a moderate role for freight transport, mainly on the Yangon–Mandalay corridor.
Demand by corridors. As for passenger transport, the freight market is dominated by the Yangon–Mandalay corridor, which accounts for 67% of all trips, if one considers its two parallel branches. The second most important corridor is the Mandalay–Muse corridor (this is a segment of the North–South Greater Mekong
Figure 3: Passenger Modal Share on Main Corridors (%)
0
25
50
75
100
Air Car Bus River Rail
Yangon–Naypyitaw
Naypyitaw–Mandalay
Yangon–Pathein
Mawlamyine–Dawei
Mandalay–Tamu
Loikaw–Magway
Mandalay–Muse
Yangon–Hpa–An–Myawaddy
Yangon–Pyay–Magway
Mandalay–Myitkyna
Tachilek–Meiktila–Kyaukpyu
Magway–Mandalay
Source: Japan International Cooperation Agency. 2014. The Survey Program for the National Transport Development Plan in the Republic of the Union of Myanmar. Naypyitaw.
4�Myanmar Transport Sector Policy Note: How to Reduce Transport Costs
Subregion [GMS] corridor) linking with the People’s Republic of China (PRC), which moves about 11 million tons annually, accounting for 17% of Myanmar’s land transport task and 70%–90% of its official border trade.1 The Yangon–Hpaan–Myawaddy is the third corridor by order of importance (partly coinciding with the GMS East–West corridor), but most of its traffic is national— international traffic being limited by the poor condition of the road link to Thailand at Myawaddy.
1 Greater Mekong Subregion Freight Transport Association (GMS FRETA). 2013. Private Sector Views on Road Transport along the
Yangon–Mandalay–Muse/Ruili–Kunming Corridor. Manila.
Table 2: Freight Transport Volumes by Distance (million tons/year)
Length of Trip in km
Total
Modal Share by Volume
Total Billion
Ton-km
Modal Share by Ton-km
100-200
200-400
400-600
600-800
800-1000
1000-1200
Truck 14.8 15.5 14.6 14.1 1.0 1.1 61.1 89% 25.8 88%Rail 0.7 0.7 0.7 1.5 0.0 0.0 3.7 5% 1.7 6%River 0.9 0.5 1.1 1.3 0.0 0.0 3.9 6% 1.8 6% Total 16.4 16.8 16.4 16.8 1.1 1.1 68.6 100% 29.3 100%
km = kilometer.
Note: Totals may not add up due to rounding.
Source: ADB estimates based on data from the Japan International Cooperation Agency. 2014. The Survey Program for the National Transport Development Plan in the Republic of the Union of Myanmar. Naypyitaw.
Figure 4: Freight Transport Volumes by Distance (million tons/year)
0
5
10
15
20
milli
on
100–200 200–400 400–600 600–800 800–1,000 1,000–1,200km
Road RiverRail
Source: ADB estimates based on data from the Japan International Cooperation Agency. 2014. The Survey Program for the National Transport Development Plan in the Republic of the Union of Myanmar. Naypyitaw.

Transport Demand Patterns�5
Figure 5: Freight Transport Volumes and Modal Share on Main Corridors (million tons)
0
5
10
15
20
25
Road Rail River
Yangon–Naypyitaw
Naypyitaw–Mandalay
Yangon–Pathein
Mandalay–Tamu
Loikaw–Magway
Mandalay–Muse
Yangon–Hpa-An–Myawaddy
Yangon–Pyay–Magway
Mandalay–Myitkyna
Tachilek–Meiktila–Kyaukpyu
Magway–Mandalay
Source: ADB estimates based on data from the Japan International Cooperation Agency. 2014. The Survey Program for the National Transport Development Plan in the Republic of the Union of Myanmar. Naypyitaw.
Figure 6: Freight Modal Share on Main Corridors (%)
Yangon–Naypyitaw
Naypyitaw–Mandalay
Yangon–Pathein
Mandalay–Tamu
Loikaw–Magway
Mandalay–Muse
Yangon–Hpa–An–Myawaddy
Yangon–Pyay–Magway
Mandalay–Myitkyna
Tachilek–Meiktila–Kyaukpyu
Magway–Mandalay0
102030405060708090
100
Road Rail River
Source: ADB estimates based on data from the Japan International Cooperation Agency. 2014. The Survey Program for the National Transport Development Plan in the Republic of the Union of Myanmar. Naypyitaw.

6�Myanmar Transport Sector Policy Note: How to Reduce Transport Costs
Modal share by corridors. Trucks dominate freight transport in most corridors. On the Yangon–Pyay–Magway and Magway–Mandalay corridors, river transport plays an important role, but this is largely for movements of goods between Yangon and Mandalay, so that its market share over the complete corridor remains moderate. River transport takes half of the transport market in the delta area over short distances between Yangon and Pathein. The Mandalay–Myitkina corridor is again a special case, but less so than for passengers: the combined share of rail and river transport is only 35% for freight (70% for passengers). Rail transport does not catch more than 10% of the freight market on any other corridor.
1.3 Role of Public State-Owned Transport Enterprises
Situation in Early 1990s
In 1993, state-owned transport enterprises (STEs) dominated the long-distance transport market. Inland Waterway Transport (IWT), Myanma Railways, and Road Transport, together with smaller specialized state-owned enterprises accounted for 35% of the freight transport market and 73% of passenger transport market.
The Comprehensive Transport Study, financed by the United Nations, and managed by the World Bank, provided an in-depth account of the situation of the transport sector in Myanmar at the beginning of the 1990s.2
While very competitive and apparently profitable, STEs were not sustainable. To quote the Comprehensive Transport Study: “STEs’ tariffs were substantially lower than those paid to private operators.” “The tariffs charged by the private sector came close to covering financial costs, but those of STEs were much too low to guarantee long-term sustained operations.” STE revenues covered their immediate operational costs. However, because STE revenues did not cover asset depreciation (or only at book prices) and capital costs, “STEs were dependent on government financing for fleet replacement,” expansion, and infrastructure improvements.
2 United Nations Development Programme. 1993. Comprehensive Transport Study. Yangon.
Table 3: 1993 Transport Modal Share (%)
Passenger Transport Share
STEs’ share for each transport mode
Freight Transport Share
STEs’ share for each transport mode
Road 50 50 61 6Rail 44 100 14 100River transport 3 80 22 70Others 2 (air) 100 3 (coastal) 100Total 100 73 100 36
STE = state-owned transport enterprise.
Note: Totals may not add up due to rounding.
Source: ADB estimates based on data from the United Nations Development Programme. 1993. Comprehensive Transport Study. Yangon.

Transport Demand Patterns�7
Implicitly transport fares of STEs were heavily subsidized, not resembling real economic costs. This was because (i) STEs had privileged access to government-subsidized fuel; (ii) they imported foreign equipment and parts at the official exchange rate, far below the black market one; (iii) they depreciated assets at their book value, not accounting for inflation and foreign exchange variations; and (iv) capital for investment was provided free of charge by the government. STE freight rates were only 5%–50% of actual costs, and passenger rates were 10%–50% of actual costs. Both Myanma Railways and IWT had prices at 80%–95% below costs. Road Transport’s prices bore closer resemblance, but were still generally 50% below costs.
Subsidized rates compensated for the inefficiencies of STEs. Contrary to the international “norm,” the road transport mode proved more economical than the rail and river transport for moving freight or passengers, except for very long distances. Within the road and river transport modes, private operators were more efficient than public ones. Were it not for all these distortions, Myanma Railways and IWT would have no clients, and private road transport would always have been the mode of choice (Table 2).
Reform and modernization had the greatest potential in railway and river transport modes. Based on a detailed costing, the Comprehensive Transport Study found scope for reducing road costs by 10%–15%, rail costs by about 50%, and river transport costs by 60%–70%. It recommended that the government carry out these changes and raise STE tariffs so that they cover long-term costs. After the improvement and tariff changes, Myanma Railways and IWT would be sustainable and would compete advantageously on most transport markets. The modal share of rail transport would increase, and that of river transport would be at a comfortably high level.
Table 4: Comparison of Transport Rates and Economic Costs, 1993 (MK)
Distance (km)
Road Rail River TransportSTE
TariffsPrivateTariffs
Economic Costs
Potential Reduction
STE Tariffs
Economic Costs
Potential Reduction
STE Tariffs
PrivateTariffs
Economic Costs
Potential Reduction
Freight
100 109 250 375 12.0% 32 726 47.2% 22 100 828 73.3%250 273 625 660 13.5% 80 976 50.4% 55 250 1,000 66.0%500 545 1,250 1,138 14.2% 160 1,394 53.2% 110 500 1,289 58.3%Passengers
100 17 40 44 10% 13 75 47.2% 10 15 93 73.3%250 43 100 92 16% 33 155 50.4% 25 40 152 66.0%500 85 200 167 17% 65 297 53.2% 50 75 242 58.3%
km = kilometer, MK = Myanmar kyat, STE = state-owned transport enterprise. Source: United Nations Development Programme. 1993. Comprehensive Transport Study. Yangon.
Situation in 2013: “What Happens When the Tide Goes Out”
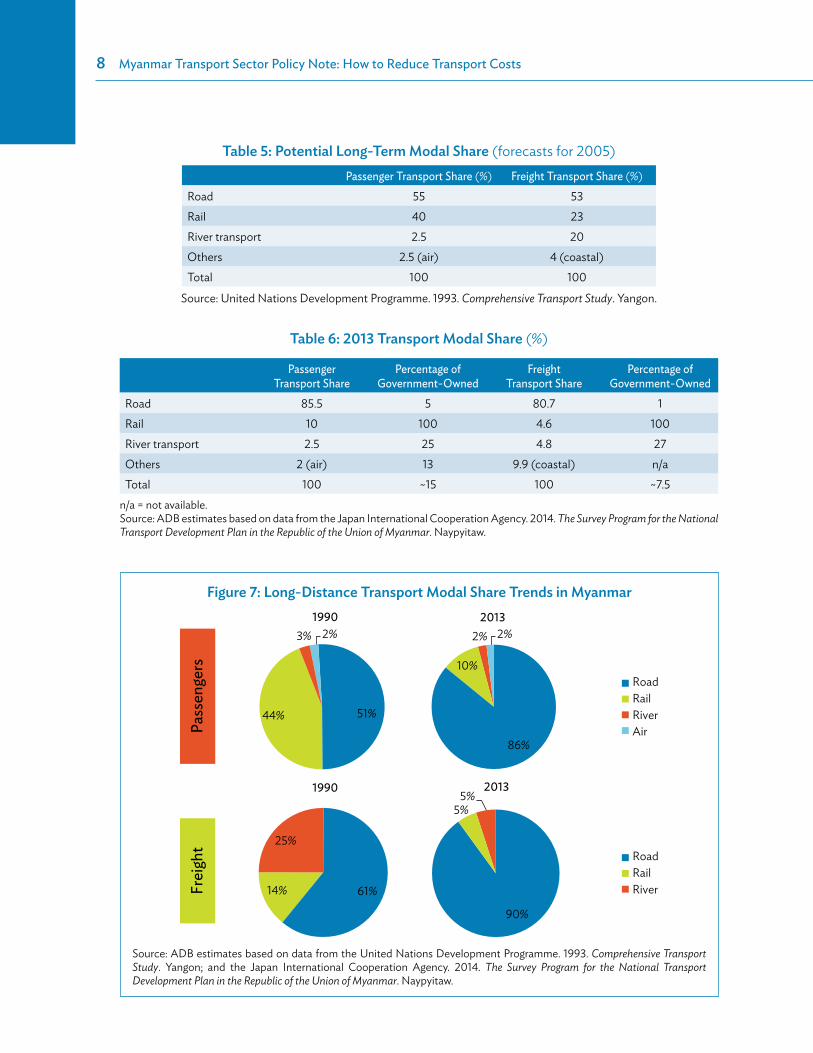
In 2013, private transport by truck or bus has become dominant. STEs play only a marginal role in the overall transport task. The modal share of transport by rail and inland waterway was reduced by 75% in 20 years (Table 5 and Figure 7).
8�Myanmar Transport Sector Policy Note: How to Reduce Transport Costs
Table 5: Potential Long-Term Modal Share (forecasts for 2005)Passenger Transport Share (%) Freight Transport Share (%)
Road 55 53Rail 40 23River transport 2.5 20Others 2.5 (air) 4 (coastal)Total 100 100
Source: United Nations Development Programme. 1993. Comprehensive Transport Study. Yangon.
Table 6: 2013 Transport Modal Share (%)
Passenger Transport Share
Percentage of Government-Owned
Freight Transport Share
Percentage of Government-Owned
Road 85.5 5 80.7 1Rail 10 100 4.6 100River transport 2.5 25 4.8 27Others 2 (air) 13 9.9 (coastal) n/aTotal 100 ~15 100 ~7.5
n/a = not available.Source: ADB estimates based on data from the Japan International Cooperation Agency. 2014. The Survey Program for the National Transport Development Plan in the Republic of the Union of Myanmar. Naypyitaw.
Figure 7: Long-Distance Transport Modal Share Trends in Myanmar
3% 2%
5%5%
90%
25%
14% 61%
86%
10%
2%
51%44%
1990
Pass
enge
rsFr
eigh
t
1990
2013
2013
2%
RoadRailRiverAir
RoadRailRiver
Source: ADB estimates based on data from the United Nations Development Programme. 1993. Comprehensive Transport Study. Yangon; and the Japan International Cooperation Agency. 2014. The Survey Program for the National Transport Development Plan in the Republic of the Union of Myanmar. Naypyitaw.
Transport Demand Patterns�9
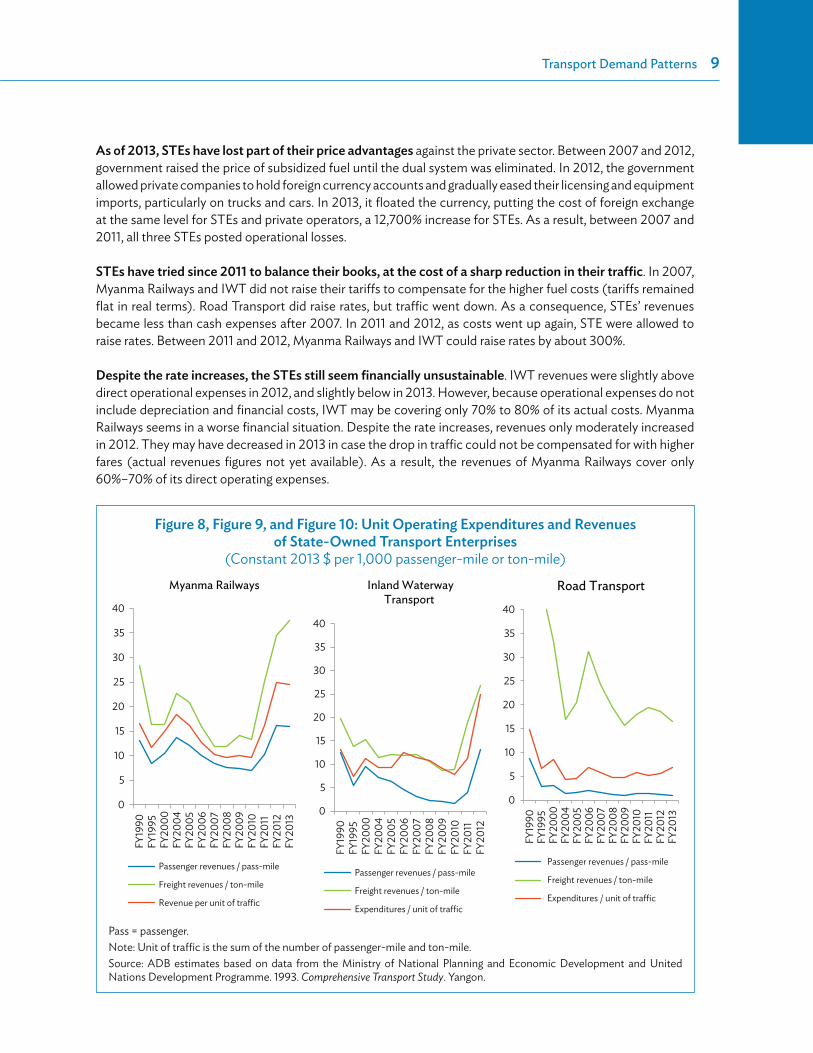
As of 2013, STEs have lost part of their price advantages against the private sector. Between 2007 and 2012, government raised the price of subsidized fuel until the dual system was eliminated. In 2012, the government allowed private companies to hold foreign currency accounts and gradually eased their licensing and equipment imports, particularly on trucks and cars. In 2013, it floated the currency, putting the cost of foreign exchange at the same level for STEs and private operators, a 12,700% increase for STEs. As a result, between 2007 and 2011, all three STEs posted operational losses.
STEs have tried since 2011 to balance their books, at the cost of a sharp reduction in their traffic. In 2007, Myanma Railways and IWT did not raise their tariffs to compensate for the higher fuel costs (tariffs remained flat in real terms). Road Transport did raise rates, but traffic went down. As a consequence, STEs’ revenues became less than cash expenses after 2007. In 2011 and 2012, as costs went up again, STE were allowed to raise rates. Between 2011 and 2012, Myanma Railways and IWT could raise rates by about 300%.
Despite the rate increases, the STEs still seem financially unsustainable. IWT revenues were slightly above direct operational expenses in 2012, and slightly below in 2013. However, because operational expenses do not include depreciation and financial costs, IWT may be covering only 70% to 80% of its actual costs. Myanma Railways seems in a worse financial situation. Despite the rate increases, revenues only moderately increased in 2012. They may have decreased in 2013 in case the drop in traffic could not be compensated for with higher fares (actual revenues figures not yet available). As a result, the revenues of Myanma Railways cover only 60%–70% of its direct operating expenses.
Figure 8, Figure 9, and Figure 10: Unit Operating Expenditures and Revenues of State-Owned Transport Enterprises
(Constant 2013 $ per 1,000 passenger-mile or ton-mile)
0
5
10
15
20
25
30
35
40
FY19
90FY
1995
FY20
00FY
2004
FY20
05FY
2006
FY20
07FY
2008
FY20
09FY
2010
FY20
11FY
2012
FY20
13
Myanma Railways
Passenger revenues / pass-mile
Freight revenues / ton-mile
Revenue per unit of traffic
0
5
10
15
20
25
30
35
40
FY19
90FY
1995
FY20
00FY
2004
FY20
05FY
2006
FY20
07FY
2008
FY20
09FY
2010
FY20
11FY
2012
Inland WaterwayTransport
Passenger revenues / pass-mile
Freight revenues / ton-mile
Expenditures / unit of traffic
0
5
10
15
20
25
30
35
40
FY19
90FY
1995
FY20
00FY
2004
FY20
05FY
2006
FY20
07FY
2008
FY20
09FY
2010
FY20
11FY
2012
FY20
13
Road Transport
Passenger revenues / pass-mile
Freight revenues / ton-mile
Expenditures / unit of traffic
Pass = passenger.Note: Unit of traffic is the sum of the number of passenger-mile and ton-mile.Source: ADB estimates based on data from the Ministry of National Planning and Economic Development and United Nations Development Programme. 1993. Comprehensive Transport Study. Yangon.
10�Myanmar Transport Sector Policy Note: How to Reduce Transport Costs
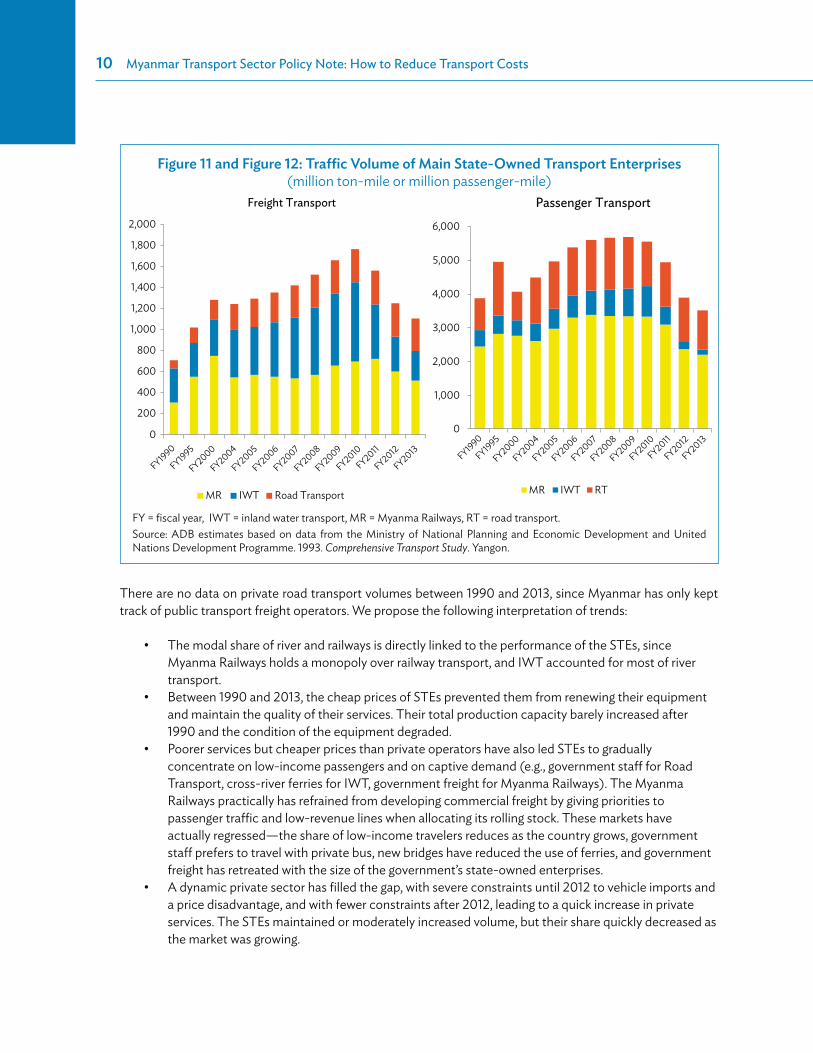
There are no data on private road transport volumes between 1990 and 2013, since Myanmar has only kept track of public transport freight operators. We propose the following interpretation of trends:
The modal share of river and railways is directly linked to the performance of the STEs, since Myanma Railways holds a monopoly over railway transport, and IWT accounted for most of river transport.Between 1990 and 2013, the cheap prices of STEs prevented them from renewing their equipment and maintain the quality of their services. Their total production capacity barely increased after 1990 and the condition of the equipment degraded.Poorer services but cheaper prices than private operators have also led STEs to gradually concentrate on low-income passengers and on captive demand (e.g., government staff for Road Transport, cross-river ferries for IWT, government freight for Myanma Railways). The Myanma Railways practically has refrained from developing commercial freight by giving priorities to passenger traffic and low-revenue lines when allocating its rolling stock. These markets have actually regressed—the share of low-income travelers reduces as the country grows, government staff prefers to travel with private bus, new bridges have reduced the use of ferries, and government freight has retreated with the size of the government’s state-owned enterprises.A dynamic private sector has filled the gap, with severe constraints until 2012 to vehicle imports and a price disadvantage, and with fewer constraints after 2012, leading to a quick increase in private services. The STEs maintained or moderately increased volume, but their share quickly decreased as the market was growing.
Figure 11 and Figure 12: Traffic Volume of Main State-Owned Transport Enterprises (million ton-mile or million passenger-mile)
200
0
400
600
800
1,000
1,200
1,400
1,600
1,800
2,000
Freight Transport
MR IWT Road Transport
FY1990
FY1995
FY2000
FY2004
FY2005
FY2006
FY2007
FY2008
FY2010
FY2011
FY2012
FY2013
FY2009
1,000
2,000
3,000
4,000
5,000
6,000
Passenger Transport
MR IWT RT
0
FY1990
FY1995
FY2000
FY2004
FY2005
FY2006
FY2007
FY2008
FY2010
FY2011
FY2012
FY2013
FY2009
FY = fiscal year, IWT = inland water transport, MR = Myanma Railways, RT = road transport. Source: ADB estimates based on data from the Ministry of National Planning and Economic Development and United Nations Development Programme. 1993. Comprehensive Transport Study. Yangon.

Transport Demand Patterns�11
Figure 13, Figure 14, and Figure 15: State-Owned Transport Enterprises Operating Expenses, Revenues, and Investments
(constant 2013 $ million)
02468
1012141618
FY19
90FY
1995
FY20
00FY
2004
FY20
05FY
2006
FY20
07FY
2008
FY20
09FY
2010
FY20
11FY
2012
Inland Water Transport
Revenues Expenditures Investments
02468
1012141618
20
FY19
90
FY19
95
FY20
00
FY20
04
FY20
05
FY20
06
FY20
07
FY20
08
FY20
09
FY20
10
FY20
11
FY20
12
FY20
13
Road Transport
Revenues Expenditures Investments
020406080
100120140160
Myanma Railways
Revenues Expenditures Investments
FY1990
FY1995
FY2000
FY2004
FY2005
FY2006
FY2007
FY2008
FY2009
FY2010
FY2011
FY2012
FY2013
Source: ADB estimates based on data from the Ministry of National Planning and Economic Development and United Nations Development Programme. 1993. Comprehensive Transport Study. Yangon.

12�Myanmar Transport Sector Policy Note: How to Reduce Transport Costs
The situation of the STEs worsened between 2007 and 2015, during which they lost about half of their volumes. Altogether, the poor management of the STEs during the last 2 decades has led to the current dominance of private road transport. The upside is that the current modal split does not reflect the true potential of rail and river transport, the modal share of which may rise with better policy and management as well as operational improvements.
The next sections analyze the potential and constraints of each mode. The approach replicates the framework of analysis of the Comprehensive Transport Study. It analyzes the financial and economic costs for each mode of transport, reviews the competitiveness of each mode, analyzes the importance of economic distortions, and analyzes the costs and benefits of various transport improvements.
13
2 Road Transport Services
Key FindingsThe truck industry is experiencing a quick transition. Since the government removed constraints and reduced taxes over imports of trucks in 2011, the number of trucks has doubled. New large trucks operating at 20% lesser costs are quickly replacing the older medium-sized trucks. Operating margins appear very small, the sign of an intensely competitive market.
The efficiency of the truck industry remains constrained by the quality of the road infrastructure. Poor road condition and low vehicle speeds limit vehicle utilization rates and increase fuel consumption. Myanmar’s trucking costs are generally in line with other countries, but our international comparison shows scope for cost reductions. This is particularly the case on international corridors, where costs are much higher than average.
Myanmar’s bus industry is functioning at a high level of efficiency, also in a strongly competitive market. On the Yangon–Mandalay corridor, the buses offer quality, low-cost services as they can use the expressway. Efficiency, speeds, and costs are constrained on other corridors by the poor condition of the roads.
This section reviews the road sector, focusing on services. It does not review the type and condition of the road network, which is analyzed in the 2015 ADB publication, Myanmar: Transport Sector Policy Note: Trunk Roads.
2.1 Road Freight TransportFleet. There were 138,000 trucks registered in Myanmar as of June 2014, of which 53,000 were heavy-duty trucks. In 2011, the government relaxed requirements and taxes to import heavy vehicles. The trucking fleet doubled in size between 1990 and 2011 and doubled again in just 2 years between 2012 and 2014.
Operators. There were 7,112 registered trucking companies in 2011 in Myanmar. As of 2010, it was reported that the largest private operator had 17 trucks, and that none provided nationwide services. However, by 2013, surveys carried out in areas other than Yangon identified five operators with 50 trucks or more, including one with 200 trucks. New medium-scale transport enterprises have likely been created, but we do not have enough data to characterize in detail the market landscape.
Road transport. The largest operator likely remains to be the Road Transport, under the Ministry of Rail Transportation. Its fleet comprises 1,100 trucks, mainly of medium size (6.5–10.0 tons capacity), and 285 large buses (40-seaters). It has 3,000 staff. This makes it a large company in a country where road operators are small. Its fleet, however, only accounts for 2% of the nation’s heavy-duty truck fleet. Its truck fleet is not expanding (1,385 trucks in 1990), and most trucks are old.
14�Myanmar Transport Sector Policy Note: How to Reduce Transport Costs
Industry organization. These next paragraphs are an extract from the draft background reports for the Bay of Bengal Initiative for Multi-Sectoral Technical and Economic Cooperation (BIMSTEC) 2013 Updating and Enhancement of the BIMSTEC Transport Infrastructure and Logistics Study. They are considered relevant and copied as is.
There is no international transport industry in Myanmar because vehicles are not permitted to cross the border into neighboring countries. However, domestic transporters are engaged in movement of international cargo, albeit from the borders or ports, but this is very much based on a local supply/demand basis. For example, transport from the borders at Myawaddy and Tachileik is predominantly undertaken by transport entities based there and contracted by border traders, rather than by transport coming from Yangon or Mandalay.
In Myanmar the trucking industry is organized in so-called ‘gates’. ‘Gates’ exists in each major city and each ‘gate’ specializes on one trunk route, such as between Yangon and Mandalay. A ‘gate’ consists of a pool of operators with membership not usually being obligatory. The newer and larger operators generally do not participate in this ‘gate’ system. The ‘gate’ manager accepts bookings for loads, sets rates and allocates loads to members, as well as consolidating loads. The consolidated cargo is transshipped at a truck park adjacent to the office area, whereas full truckloads are collected directly at the shipper’s premises (e.g., factory) and driven direct to the consignee without passing through the ‘gate’ area.
The ‘gates’ are suffering from decades of low and fluctuating freight rates, limited demand during part of the year, narrow operating margins, and poor investment. With the present income levels investment in more modern equipment is not considered realistically possible. There is a shortage of qualified drivers, especially for 22-wheelers—articulated transport—despite per-trip fees for drivers increasing. The wave of investment in new 22-wheelers (largely from outside the traditional industry), and the recent strict enforcement of truck-loaded weights (whilst both positive on the macro-level), have put further pressure on unit freight rates and on trip profitability. Improving the road network and increasing the average driving speed will effectively increase available truck capacity by reducing trip time and possibly exacerbate the ‘gates’ problems.
The backbone of the long-distance vehicle fleet is the 12-wheel, high-sided, rigid truck operating at 27 or 8 tons gross weight, typically second-hand imported from Japan. The Japanese trucks are right hand drive, but are still preferred in Myanmar for their reliability, even at ages of 7 years–15 years. The 12-wheeler trucks are now being supplemented by 22-wheel[er] articulated trucks, largely flat trailers, running at 50 tons gross weight. There are few van-trucks because the higher tare weight is seen as a cost-disadvantage. Most of the new 22-wheeler trucks are made in the PRC and have been imported since the import-licensing was relaxed in 2011. There also exists a large secondary fleet of 6- and 10-wheel trucks running on local distribution, low-volume routes and where there are restricted-access roads. These vehicles are often old, in some cases dating back to the 1950s, and are no longer competitive on the main routes. Many of them are laid up for long periods of time outside harvest periods.

Road Transport Services�15
Tabl
e 7:
Mya
nmar
’s Ve
hicl
e Fl
eet,
1990
–201
4
FY
1990
FY19
95FY
2000
FY20
04FY
2005
FY20
06FY
2007
FY20
08FY
2009
FY20
10FY
2011
FY20
12FY
2014
Cars
77,4
7214
9,96
817
3,44
418
6,90
819
3,94
020
2,06
821
7,018
233,
227
245,
921
265,
642
267,5
6133
1,468
395,
251
Yan
gon
49,9
2710
7,886
101,3
9611
7,129
122,
159
126,
433
134,
088
142,
869
149,
415
159,
854
n/a
n/a
279
,630
� O
ther
ar
eas
27,5
4542
,082
72,0
4869
,779
71,7
8175
,635
82,9
3090
,358
96,5
0610
5,78
8 n
/an/
a 11
5,62
1Tr
uck (
Ligh
t d
uty)
10,3
5519
,629
24,2
2922
,249
23,3
6423
,392
24,0
5124
,929
26,0
0728
,068
n/a
n/a
84,9
77�
Yang
on2,
386
10,19
613
,845
12,4
6413
,630
13,7
1713
,943
14,0
1214
,561
15,8
28 n
/a n
/a57
,997
� O
ther
ar
eas
7,969
9,43
310
,384
9,78
59,
734
9,67
510
,108
10,9
1711
,446
12,2
40 n
/a n
/a 2
6,98
0Tr
uck
(H
eavy
du
ty)
22,18
823
,199
29,6
6330
,499
31,4
3731
,990
33,16
033
,928
35,12
536
,820
n/a
n/a
53,2
67�
Yang
on10
,032
10,0
398,
112
8,84
39,
102
9,24
49,
703
9,62
410
,252
11,2
63 n
/a n
/a17
,820
� O
ther
ar
eas
12,15
613
,160
21,5
5121
,656
22,3
3522
,746
23,4
5724
,304
24,8
7325
,557
n/a
n/a
35,
447
Tota
l Tru
cks
32,5
4342
,828
53,8
9252
,748
54,8
0155
,382
57,2
1158
,857
61,13
264
,888
67,7
5074
,546
138,
244
Bus
17,9
4115
,639
16,8
6617
,973
18,0
3818
,857
19,2
9119
,683
19,8
0720
,944
19,5
7919
,812
22,7
99�
Yang
on9,
062
7,344
9,04
19,
997
9,88
210
,415
10,6
7410
,780
10,5
9211
,388
n/a
n/a
13,4
93�
Oth
er
area
s8,
879
8,29
57,8
257,9
768,
156
8,44
28,
617
8,90
39,
215
9,55
6 n
/an/
a 9
,306
Oth
er
Vehi
cles
*4,
701
6,61
17,4
0011
,359
11,3
0711
,758
13,0
0813
,933
14,5
1415
,862
n/a
n/a
62,9
69
Yang
on1,9
641,2
184,
835
7,746
7,694
8,05
29,
151
9,90
010
,401
11,4
63 n
/a n
/a 2
3,95
2�
Oth
er
area
s2,
737
5,39
32,
565
3,61
33,
613
3,70
63,
857
4,03
34,
113
4,39
9 n
/a n
/a 3
9,01
7M
otor
cycl
es43
,617
85,8
2117
4,48
963
8,51
964
1,777
646,
872
658,
997
1,612
,423
1,749
,083
1,883
,958
1,955
,505
3,21
9,21
33,
884,
902
�Ya
ngon
17,8
1537
,696
21,4
423,
466
3,31
03,1
623,
013
42,4
1646
,539
50,6
60n/
a n/
a 16
1,236
� O
ther
ar
eas
25,8
0248
,125
153,
047
635,
053
638,
467
643,
710
655,
984
1,570
,007
1,702
,544
1,833
,298
n/a
n/a
3,7
23,6
66
cont
inue
d on
nex
t pag
e

16�Myanmar Transport Sector Policy Note: How to Reduce Transport Costs
Tabl
e 7
cont
inue
d
FY
1990
FY19
95FY
2000
FY20
04FY
2005
FY20
06FY
2007
FY20
08FY
2009
FY20
10FY
2011
FY20
12FY
2014
Thre
e -
Whe
eler
2,22
61,9
661,3
051,3
322,
374
3,95
25,
643
6,66
88,
876
13,4
24 n
/a n
/a55
,001
�Ya
ngon
2 –
––
––
–52
4814
5 n
/an/
a 1,
415
� O
ther
ar
eas
2,22
41,9
661,3
051,3
322,
374
3,95
25,
643
6,61
68,
828
13,2
79 n
/a n
/a 5
3,58
6Tr
awle
rgi
n/a
n/a
14,8
6855
,430
57,0
5157
,867
61,6
7454
,169
48,0
7143
,678
53,3
5254
,070
n/a
�Ya
ngon
n/a
n/a
132
2,86
72,
756
2,51
52,
243
1,280
1,036
658
n/a
n/a
n/a
� O
ther
ar
eas
n/a
n/a
14,7
3652
,563
54,2
9555
,352
59,4
3152
,889
47,0
3543
,020
n/a
n/a
n/a
Hea
vy
Mac
hine
n/a
n/a
n/a
n/a
n/a
n/a
n/a
n/a
n/a
125
n/a
n/a
1,160
�Ya
ngon
n/a
n/a
n/a
n/a
n/a
n/a
n/a
n/a
n/a
71 n
/a n
/a 3
77�
Oth
er
area
sn/
an/
an/
an/
an/
an/
an/
an/
an/
a54
n/a
n/a
783
Tota
l17
8,50
030
2,83
344
2,26
496
4,26
997
9,28
899
6,75
61,0
32,8
421,9
98,9
602,
147,4
042,
308,
521
2,36
3,74
73,
699,
109
4,56
0,32
6�
Yang
on91
,188
174,
379
158,
803
162,
512
168,
533
173,
538
182,
815
230,
933
242,
844
261,3
30 n
/a n
/a 5
55,9
20�
Oth
er
Are
as87
,312
128,
454
283,
461
801,7
5781
0,75
582
3,21
885
0,02
71,7
68,0
271,9
04,5
602,
047,1
91n/
a n
/a 4
,004
,406
n/a
= no
t ava
ilabl
e.* 2
014
data
incl
udes
spec
ial p
urpo
se ve
hicl
es a
nd fa
rm tr
ucks
. So
urce
: AD
B es
timat
es b
ased
on
data
from
the
Road
Tra
nspo
rt A
dmin
istra
tion
Dep
artm
ent a
nd M
inist
ry o
f Nat
iona
l Pla
nnin
g and
Eco
nom
ic D
evel
opm
ent.
Road Transport Services�17
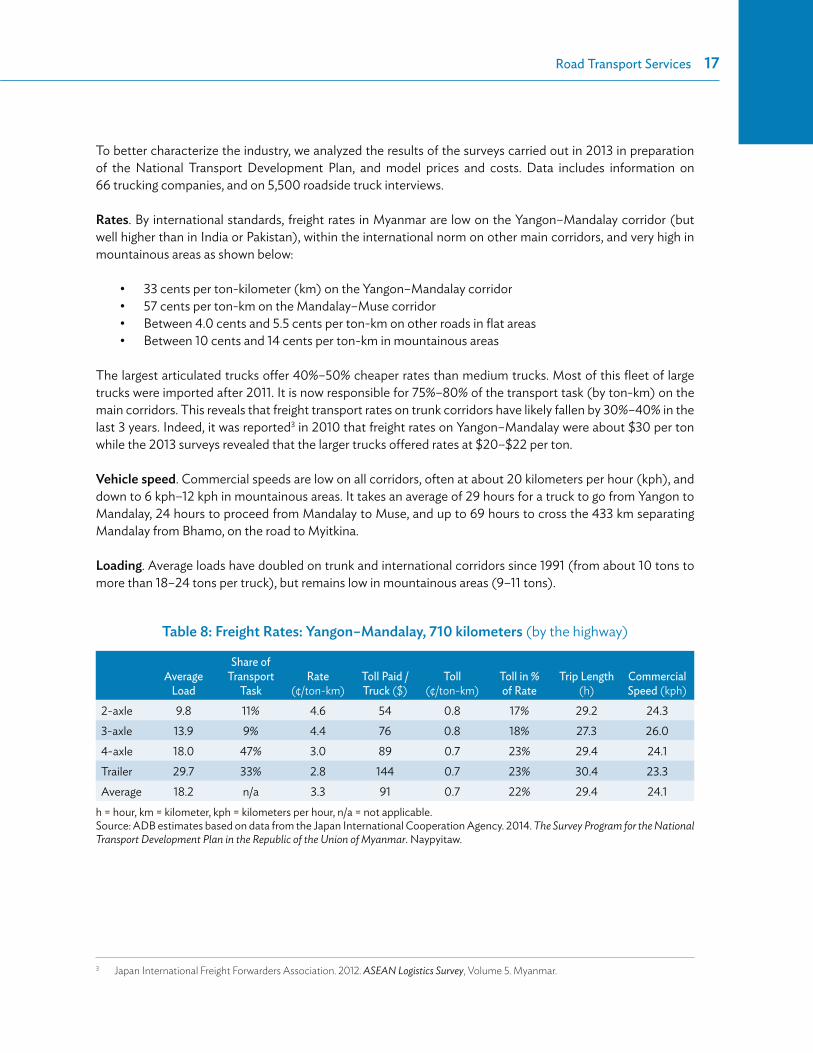
To better characterize the industry, we analyzed the results of the surveys carried out in 2013 in preparation of the National Transport Development Plan, and model prices and costs. Data includes information on 66 trucking companies, and on 5,500 roadside truck interviews.
Rates. By international standards, freight rates in Myanmar are low on the Yangon–Mandalay corridor (but well higher than in India or Pakistan), within the international norm on other main corridors, and very high in mountainous areas as shown below:
33 cents per ton-kilometer (km) on the Yangon–Mandalay corridor57 cents per ton-km on the Mandalay–Muse corridorBetween 4.0 cents and 5.5 cents per ton-km on other roads in flat areasBetween 10 cents and 14 cents per ton-km in mountainous areas
The largest articulated trucks offer 40%–50% cheaper rates than medium trucks. Most of this fleet of large trucks were imported after 2011. It is now responsible for 75%–80% of the transport task (by ton-km) on the main corridors. This reveals that freight transport rates on trunk corridors have likely fallen by 30%–40% in the last 3 years. Indeed, it was reported3 in 2010 that freight rates on Yangon–Mandalay were about $30 per ton while the 2013 surveys revealed that the larger trucks offered rates at $20–$22 per ton.
Vehicle speed. Commercial speeds are low on all corridors, often at about 20 kilometers per hour (kph), and down to 6 kph–12 kph in mountainous areas. It takes an average of 29 hours for a truck to go from Yangon to Mandalay, 24 hours to proceed from Mandalay to Muse, and up to 69 hours to cross the 433 km separating Mandalay from Bhamo, on the road to Myitkina.
Loading. Average loads have doubled on trunk and international corridors since 1991 (from about 10 tons to more than 18–24 tons per truck), but remains low in mountainous areas (9–11 tons).
Table 8: Freight Rates: Yangon–Mandalay, 710 kilometers (by the highway)
Average Load
Share of Transport
TaskRate
(¢/ton-km)Toll Paid / Truck ($)
Toll (¢/ton-km)
Toll in % of Rate
Trip Length (h)
CommercialSpeed (kph)
2-axle 9.8 11% 4.6 54 0.8 17% 29.2 24.33-axle 13.9 9% 4.4 76 0.8 18% 27.3 26.04-axle 18.0 47% 3.0 89 0.7 23% 29.4 24.1Trailer 29.7 33% 2.8 144 0.7 23% 30.4 23.3Average 18.2 n/a 3.3 91 0.7 22% 29.4 24.1
h = hour, km = kilometer, kph = kilometers per hour, n/a = not applicable.Source: ADB estimates based on data from the Japan International Cooperation Agency. 2014. The Survey Program for the National Transport Development Plan in the Republic of the Union of Myanmar. Naypyitaw.
3 Japan International Freight Forwarders Association. 2012. ASEAN Logistics Survey, Volume 5. Myanmar.

18�Myanmar Transport Sector Policy Note: How to Reduce Transport Costs
The analysis of the survey data also shows the following:
Vehicle utilization. Fleet utilization is low at 65,000 km annual average per truck on the Yangon-Mandalay corridor and 40,000 km in other areas. This is the same level as in 1991, and is closely linked to vehicle speeds. Utilization rates in hours per year per vehicle seem to be close to 2,000 hours, which is the norm in developing countries. Average truck mileage in India or Indonesia is 80,000 km/truck. Raising utilization would require increasing the average speeds on the roads. It would improve asset amortization and lower average costs. In the longer run, the improvement of loading facilities and night driving could much further raise utilization rates. A highly used truck in the United States can do 200 km–400,000 km a year.Fleet age. Most trucks are new, with an average reported age of 5 years, and very few trucks beyond 10 years. This shows the renewal of the fleet in the last years.Operational costs. There is a good fit between stated fuel consumption ($2,600/year) with highway development and management model (HDM-4) predictions fitted to Myanmar road conditions and vehicle costs and age, but maintenance costs ($2,600/year) are about half of what HDM-4 calculates. We use HDM-4 to analyze the impact of road roughness on vehicle operating costs after similar adjustments. Operating costs of the larger trucks are particularly sensitive to the condition of
Table 9: Freight Rates: Mandalay–Muse, 450 kilometers
Average Load
Share of Transport
TaskRate
(¢/ton-km)Toll Paid / Truck ($)
Toll (¢/ton-km)
Toll in % of Rate
Trip Length (h)
CommercialSpeed (kph)
2-axle 9.4 9% 9.9 52 1.2 14% 25.0 18.33-axle 16.0 19% 7.7 53 0.7 11% 25.6 17.94-axle 19.6 14% 6.8 63 0.7 11% 21.9 21.7Trailer 28.8 59% 5.0 69 0.5 11% 24.1 19.8Average 24.2 50% 5.7 29 0.6 12% 24.0 19.4
h = hour, km = kilometer, kph = kilometers per hour.Source: ADB estimates based on data from the Japan International Cooperation Agency. 2014. The Survey Program for the National Transport Development Plan in the Republic of the Union of Myanmar. Naypyitaw.
Table 10: Freight Rates: Other Corridors
DistanceAverage
Load (ton)Rate
(¢/ton-km)Toll
(¢/ton-km)Toll in % of Rate
Trip Length (h)
CommercialSpeed (kph)
Yangon–Myawaddy 450 13.9 5.2 1.8 36% 25.6 17.8Yangon–Pyay 280 14.0 5.3 1.2 32% 15.1 18.6Yangon–Pathein 195 9.0 4.3 1.4 25% 7.6 26.0Yangon–Mawlamyine 305 17.0 3.4 1.4 43% 13.3 22.9Yangon–Sittwe 890 11.2 4.8 0.9 21% 41.3 21.6Mandalay–Bhamo 433 9.0 13.6 2.9 21% 69.5 6.2Mandalay–Taunggyi 259 11.7 10.0 1.5 14% 27.9 9.3Mandalay–Kale 362 9.3 5.4 1.8 32% 31.4 11.5
h = hour, km = kilometer, kph = kilometers per hour.Source: ADB estimates based on data from the Japan International Cooperation Agency. 2014. The Survey Program for the National Transport Development Plan in the Republic of the Union of Myanmar. Naypyitaw.
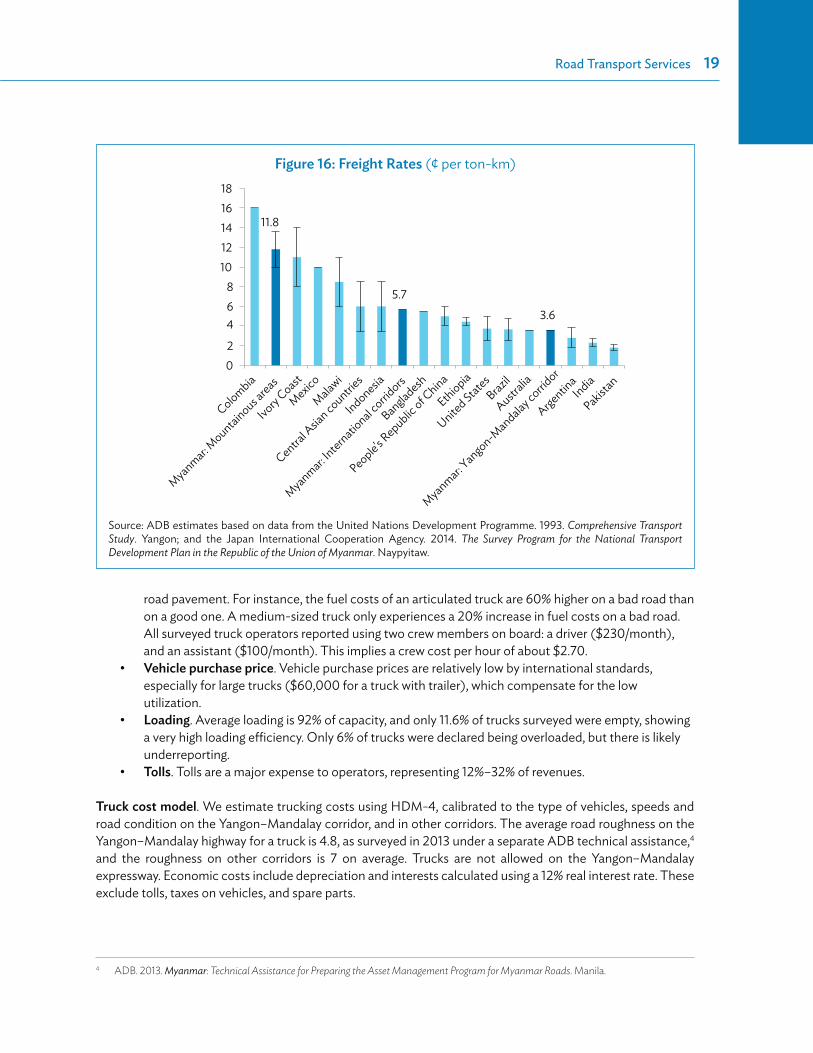
Road Transport Services�19
Figure 16: Freight Rates (¢ per ton-km)
11.8
5.7
3.6
0
Colombia
Myanmar: Mountainous a
reas
Myanmar: Internatio
nal corridors
Myanmar: Yangon-M
andalay corridor
Bangladesh
People's Republic of C
hina
Ethiopia
United States
Brazil
Australia
ArgentinaIndia
Pakistan
Ivory Coast
Mexico
Malawi
Central A
sian countrie
s
Indonesia
2
468
1012141618
Source: ADB estimates based on data from the United Nations Development Programme. 1993. Comprehensive Transport Study. Yangon; and the Japan International Cooperation Agency. 2014. The Survey Program for the National Transport Development Plan in the Republic of the Union of Myanmar. Naypyitaw.
road pavement. For instance, the fuel costs of an articulated truck are 60% higher on a bad road than on a good one. A medium-sized truck only experiences a 20% increase in fuel costs on a bad road. All surveyed truck operators reported using two crew members on board: a driver ($230/month), and an assistant ($100/month). This implies a crew cost per hour of about $2.70.Vehicle purchase price. Vehicle purchase prices are relatively low by international standards, especially for large trucks ($60,000 for a truck with trailer), which compensate for the low utilization. Loading. Average loading is 92% of capacity, and only 11.6% of trucks surveyed were empty, showing a very high loading efficiency. Only 6% of trucks were declared being overloaded, but there is likely underreporting. Tolls. Tolls are a major expense to operators, representing 12%–32% of revenues.
Truck cost model. We estimate trucking costs using HDM-4, calibrated to the type of vehicles, speeds and road condition on the Yangon–Mandalay corridor, and in other corridors. The average road roughness on the Yangon–Mandalay highway for a truck is 4.8, as surveyed in 2013 under a separate ADB technical assistance,4 and the roughness on other corridors is 7 on average. Trucks are not allowed on the Yangon–Mandalay expressway. Economic costs include depreciation and interests calculated using a 12% real interest rate. These exclude tolls, taxes on vehicles, and spare parts.
4 ADB. 2013. Myanmar: Technical Assistance for Preparing the Asset Management Program for Myanmar Roads. Manila.

20�Myanmar Transport Sector Policy Note: How to Reduce Transport Costs
Figure 17: Annual Truck Mileage (km)
0
50,000
100,000
150,000
200,000
250,000
300,000
350,000
Uni
ted
Stat
esM
exico
Argen
tina
Pakis
tan
Braz
ilAus
tralia
Indo
nesia
India
Nige
riaColo
mbia
Mya
nmar
: Yan
gon-
Man
dalay
corri
dor
Peop
le's R
epub
lic of
Chin
aEt
hiopia
Czech
Rep
ublic
Hunga
ryPo
land
Ivory
Coast
Centra
l Asia
n cou
ntrie
sBa
nglad
esh
Mala
wi
Mya
nmar
: Oth
er ar
eas
Source: ADB estimates based on data from the United Nations Development Programme. 1993. Comprehensive Transport Study. Yangon; and the Japan International Cooperation Agency. 2014. The Survey Program for the National Transport Development Plan in the Republic of the Union of Myanmar. Naypyitaw.
Table 11: Truck Characteristics
Vehicle Purchase Price ($) Fuel Consumption (l/km) Average Load (ton)2-axle truck (>2 tons) 15,000–30,000 0.27 8.33-axle truck 40,000 0.32 14.14-axle truck 50,000 0.43 17.3Truck with trailer 60,000 0.52 29.2
km = kilometer, l = liters.Source: ADB estimates based on data from the Japan International Cooperation Agency. 2014. The Survey Program for the National Transport Development Plan in the Republic of the Union of Myanmar. Naypyitaw.
Table 12: Fleet Age Distribution (Surveyed transporters)
<5 years 6–10 years 11–15 years 16–20 yearsShare of trucks surveyed 45.8% 52.6% 1.4% 0.2%
Source: ADB estimates based on data from the Japan International Cooperation Agency. 2014. The Survey Program for the National Transport Development Plan in the Republic of the Union of Myanmar. Naypyitaw.
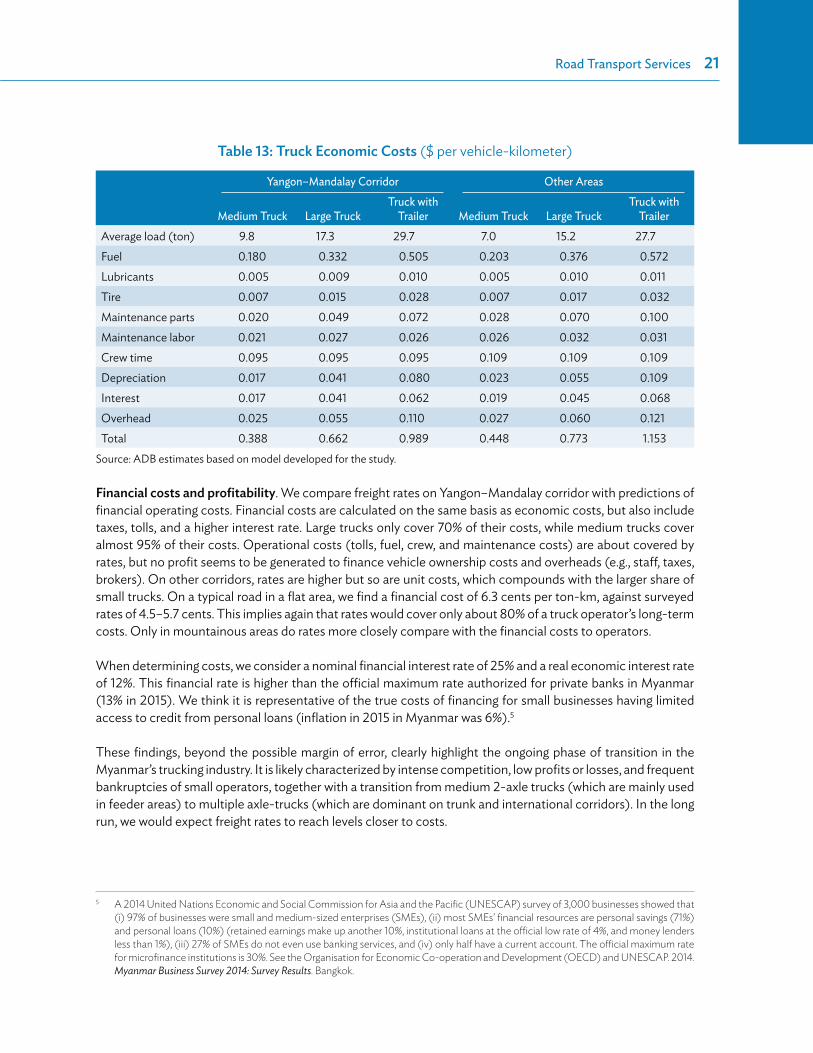
Road Transport Services�21
Financial costs and profitability. We compare freight rates on Yangon–Mandalay corridor with predictions of financial operating costs. Financial costs are calculated on the same basis as economic costs, but also include taxes, tolls, and a higher interest rate. Large trucks only cover 70% of their costs, while medium trucks cover almost 95% of their costs. Operational costs (tolls, fuel, crew, and maintenance costs) are about covered by rates, but no profit seems to be generated to finance vehicle ownership costs and overheads (e.g., staff, taxes, brokers). On other corridors, rates are higher but so are unit costs, which compounds with the larger share of small trucks. On a typical road in a flat area, we find a financial cost of 6.3 cents per ton-km, against surveyed rates of 4.5–5.7 cents. This implies again that rates would cover only about 80% of a truck operator’s long-term costs. Only in mountainous areas do rates more closely compare with the financial costs to operators.
When determining costs, we consider a nominal financial interest rate of 25% and a real economic interest rate of 12%. This financial rate is higher than the official maximum rate authorized for private banks in Myanmar (13% in 2015). We think it is representative of the true costs of financing for small businesses having limited access to credit from personal loans (inflation in 2015 in Myanmar was 6%).5
These findings, beyond the possible margin of error, clearly highlight the ongoing phase of transition in the Myanmar’s trucking industry. It is likely characterized by intense competition, low profits or losses, and frequent bankruptcies of small operators, together with a transition from medium 2-axle trucks (which are mainly used in feeder areas) to multiple axle-trucks (which are dominant on trunk and international corridors). In the long run, we would expect freight rates to reach levels closer to costs.
5 A 2014 United Nations Economic and Social Commission for Asia and the Pacific (UNESCAP) survey of 3,000 businesses showed that
(i) 97% of businesses were small and medium-sized enterprises (SMEs), (ii) most SMEs’ financial resources are personal savings (71%)
and personal loans (10%) (retained earnings make up another 10%, institutional loans at the official low rate of 4%, and money lenders
less than 1%), (iii) 27% of SMEs do not even use banking services, and (iv) only half have a current account. The official maximum rate
for microfinance institutions is 30%. See the Organisation for Economic Co-operation and Development (OECD) and UNESCAP. 2014.
Myanmar Business Survey 2014: Survey Results. Bangkok.
Table 13: Truck Economic Costs ($ per vehicle-kilometer)
Yangon–Mandalay Corridor Other Areas
Medium Truck Large TruckTruck with
Trailer Medium Truck Large TruckTruck with
TrailerAverage load (ton) 9.8 17.3 29.7 7.0 15.2 27.7Fuel 0.180 0.332 0.505 0.203 0.376 0.572Lubricants 0.005 0.009 0.010 0.005 0.010 0.011Tire 0.007 0.015 0.028 0.007 0.017 0.032Maintenance parts 0.020 0.049 0.072 0.028 0.070 0.100Maintenance labor 0.021 0.027 0.026 0.026 0.032 0.031Crew time 0.095 0.095 0.095 0.109 0.109 0.109Depreciation 0.017 0.041 0.080 0.023 0.055 0.109Interest 0.017 0.041 0.062 0.019 0.045 0.068Overhead 0.025 0.055 0.110 0.027 0.060 0.121Total 0.388 0.662 0.989 0.448 0.773 1.153
Source: ADB estimates based on model developed for the study.
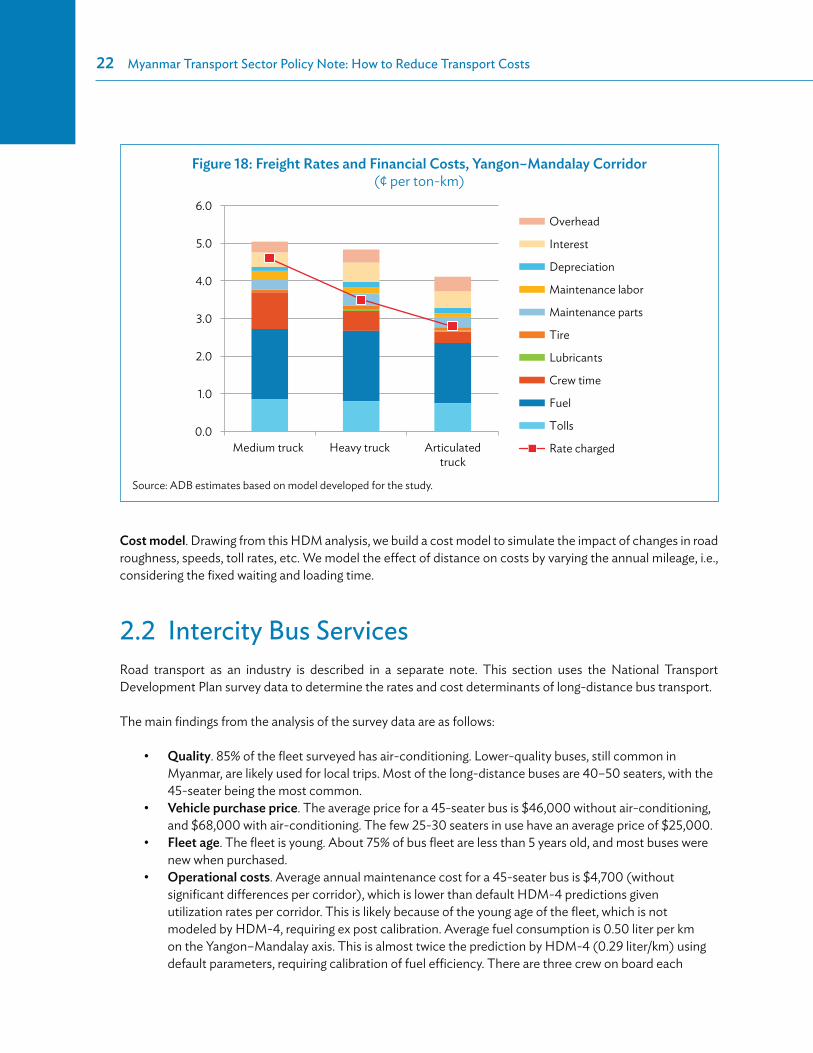
22�Myanmar Transport Sector Policy Note: How to Reduce Transport Costs
Cost model. Drawing from this HDM analysis, we build a cost model to simulate the impact of changes in road roughness, speeds, toll rates, etc. We model the effect of distance on costs by varying the annual mileage, i.e., considering the fixed waiting and loading time.
2.2 Intercity Bus ServicesRoad transport as an industry is described in a separate note. This section uses the National Transport Development Plan survey data to determine the rates and cost determinants of long-distance bus transport.
The main findings from the analysis of the survey data are as follows:
Quality. 85% of the fleet surveyed has air-conditioning. Lower-quality buses, still common in Myanmar, are likely used for local trips. Most of the long-distance buses are 40–50 seaters, with the 45-seater being the most common.Vehicle purchase price. The average price for a 45-seater bus is $46,000 without air-conditioning, and $68,000 with air-conditioning. The few 25-30 seaters in use have an average price of $25,000.Fleet age. The fleet is young. About 75% of bus fleet are less than 5 years old, and most buses were new when purchased.Operational costs. Average annual maintenance cost for a 45-seater bus is $4,700 (without significant differences per corridor), which is lower than default HDM-4 predictions given utilization rates per corridor. This is likely because of the young age of the fleet, which is not modeled by HDM-4, requiring ex post calibration. Average fuel consumption is 0.50 liter per km on the Yangon–Mandalay axis. This is almost twice the prediction by HDM-4 (0.29 liter/km) using default parameters, requiring calibration of fuel efficiency. There are three crew on board each
Figure 18: Freight Rates and Financial Costs, Yangon–Mandalay Corridor (¢ per ton-km)
0.0
1.0
2.0
3.0
4.0
5.0
6.0
Medium truck Heavy truck Articulatedtruck
Overhead
Interest
Depreciation
Maintenance labor
Maintenance parts
Tire
Lubricants
Crew time
Fuel
Tolls
Rate charged
Source: ADB estimates based on model developed for the study.
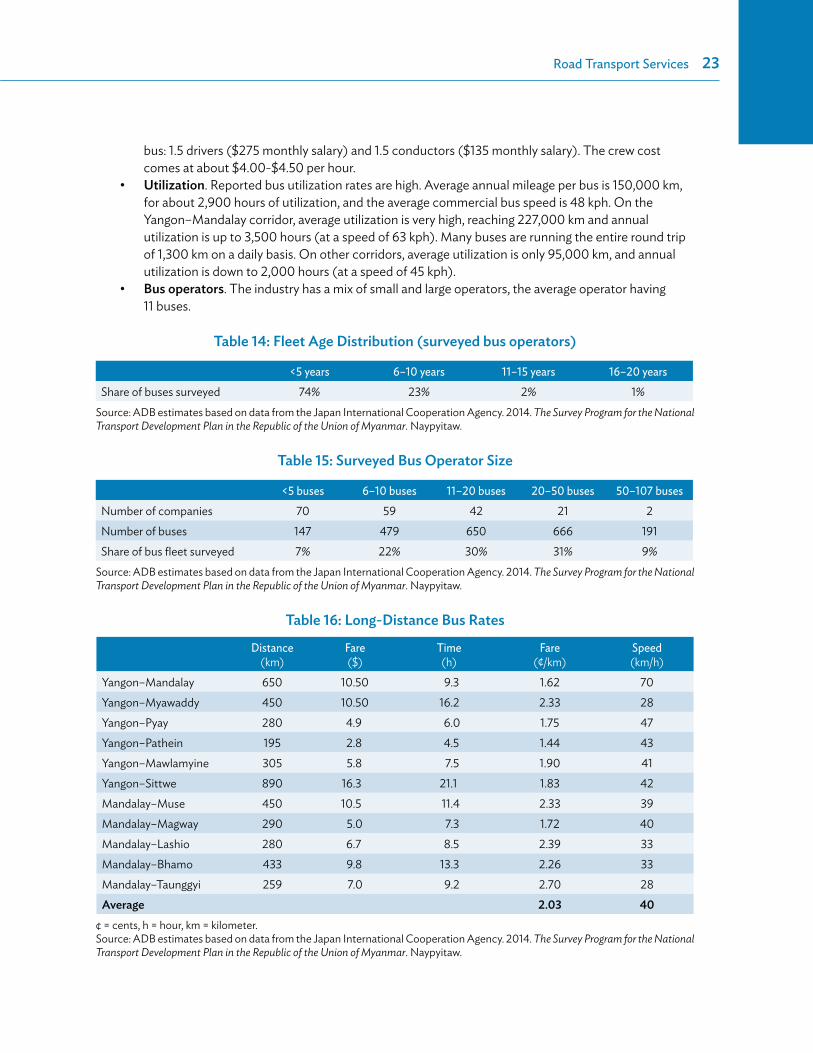
Road Transport Services�23
bus: 1.5 drivers ($275 monthly salary) and 1.5 conductors ($135 monthly salary). The crew cost comes at about $4.00-$4.50 per hour.Utilization. Reported bus utilization rates are high. Average annual mileage per bus is 150,000 km, for about 2,900 hours of utilization, and the average commercial bus speed is 48 kph. On the Yangon–Mandalay corridor, average utilization is very high, reaching 227,000 km and annual utilization is up to 3,500 hours (at a speed of 63 kph). Many buses are running the entire round trip of 1,300 km on a daily basis. On other corridors, average utilization is only 95,000 km, and annual utilization is down to 2,000 hours (at a speed of 45 kph). Bus operators. The industry has a mix of small and large operators, the average operator having 11 buses.
Table 14: Fleet Age Distribution (surveyed bus operators)
<5 years 6–10 years 11–15 years 16–20 yearsShare of buses surveyed 74% 23% 2% 1%
Source: ADB estimates based on data from the Japan International Cooperation Agency. 2014. The Survey Program for the National Transport Development Plan in the Republic of the Union of Myanmar. Naypyitaw.
Table 15: Surveyed Bus Operator Size
<5 buses 6–10 buses 11–20 buses 20–50 buses 50–107 busesNumber of companies 70 59 42 21 2Number of buses 147 479 650 666 191Share of bus fleet surveyed 7% 22% 30% 31% 9%
Source: ADB estimates based on data from the Japan International Cooperation Agency. 2014. The Survey Program for the National Transport Development Plan in the Republic of the Union of Myanmar. Naypyitaw.
Table 16: Long-Distance Bus Rates
Distance(km)
Fare($)
Time(h)
Fare(¢/km)
Speed (km/h)
Yangon–Mandalay 650 10.50 9.3 1.62 70Yangon–Myawaddy 450 10.50 16.2 2.33 28Yangon–Pyay 280 4.9 6.0 1.75 47Yangon–Pathein 195 2.8 4.5 1.44 43Yangon–Mawlamyine 305 5.8 7.5 1.90 41Yangon–Sittwe 890 16.3 21.1 1.83 42Mandalay–Muse 450 10.5 11.4 2.33 39Mandalay–Magway 290 5.0 7.3 1.72 40Mandalay–Lashio 280 6.7 8.5 2.39 33Mandalay–Bhamo 433 9.8 13.3 2.26 33Mandalay–Taunggyi 259 7.0 9.2 2.70 28Average 2.03 40
¢ = cents, h = hour, km = kilometer.Source: ADB estimates based on data from the Japan International Cooperation Agency. 2014. The Survey Program for the National Transport Development Plan in the Republic of the Union of Myanmar. Naypyitaw.

24�Myanmar Transport Sector Policy Note: How to Reduce Transport Costs
Rates. Intercity passenger rates are formally controlled by the Ministry of Transport and Communications. However, passenger survey data reveals the existence of a spectrum of rates for each origin–destination pair and between areas, which seems more consistent with free competition. The average fares revealed from surveys are
1.65 cents per km on the Yangon–Mandalay corridor;1.7–1.9 cents per km in plain areas (down to 1.45 cents between Yangon and Pathein); and2.3–2.7 cents per km in mountainous areas, including links with the PRC and Thailand.
Bus cost model. We build estimates of intercity bus transport costs using HDM-4 calibrated to the type of vehicles, speeds, and road condition on the Yangon–Mandalay corridor, other plain corridors, and mountainous areas. The average road roughness on the Yangon–Mandalay expressway is 3.0, and the roughness on other plain corridors is 7.0 on average, and rises to 10 often in mountainous areas. Computation of economic and financial costs follows the same logic as for trucks.
Costs. Rates charged are close but slightly below typical financial costs of bus operators by 10% to 15%. Financial costs to operators are calculated to be 1.8–2.9 cents per km. They are higher than the rates charged, which cannot cover full depreciation, interests, and overheads. We expect that financial costs will increase in the long run by ¢0.2 to ¢0.3 on the Yangon–Mandalay corridor and in plain areas, as the fleet ages and maintenance requirements rise.
Cost model. Drawing from this HDM-4 analysis, we built a cost model able to simulate the impact of changes in road roughness, speeds, toll rates, etc. We do not consider here distance to have an impact on costs per km, as the loading and unloading time for a bus can be kept very short, and as buses may drop passengers in the middle of longer journeys.
Table 17: Economic Costs of a Bus (¢ per vehicle-kilometer)
Yangon–Mandalay Other Plain Areas Mountainous AreasFuel 49.1 50.9 63.8Lubricants 0.9 0.9 1.0Tire 1.1 1.1 2.3Maintenance parts 4.1 4.2 16.0Maintenance labor 0.7 0.8 2.6Crew time 6.4 10.9 11.9Depreciation 2.3 8.3 9.7Interest 1.8 5.2 2.8Overhead 0.9 2.5 2.8Total 67.4 84.8 112.8
Source: ADB estimates based on model developed for the study.
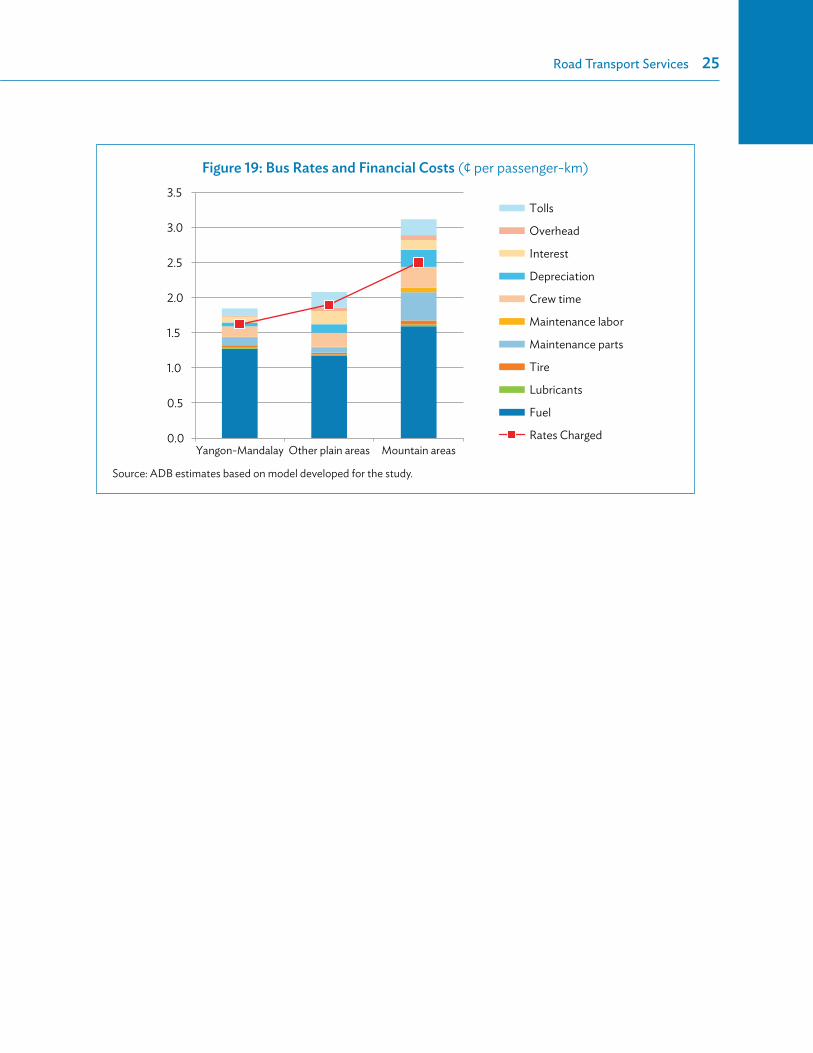
Road Transport Services�25
Figure 19: Bus Rates and Financial Costs (¢ per passenger-km)
0.0
0.5
1.0
1.5
2.0
2.5
3.0
3.5
Yangon-Mandalay Other plain areas Mountain areas
Tolls
Overhead
Interest
Depreciation
Crew time
Maintenance labor
Maintenance parts
Tire
Lubricants
Fuel
Rates Charged
Source: ADB estimates based on model developed for the study.
26
3 Railway Transport Services
Key FindingsRailways offer mainly low-quality transport services, the low costs of which make it attractive only to low-income passengers. A railway trip often takes twice as long as a bus trip, but railways compensate by offering 40% cheaper rates. Freight railways are similarly of low quality and lack reliability but are half the cost, or less, of a truck.
However, railways’ cost advantage disappears if one considers their true costs. Myanma Railways is subsidized by the government, does not depreciate capital at replacement value, and does not cover all its capital costs. Adding these costs, we estimate that Myanma Railways passenger rates only cover 37% of related costs. The figure for freight is better but still only 51% of related costs. If Myanma Railways also have to repay the cost of all rail lines created in the last 20 years, the ratios would fall to 18% for passengers, and 29% for freight.
The costs of Myanma Railways are high by any international comparison. By international standards, , Myanma Railways passenger rates are low, but comparable to India or Thailand. However, its costs are higher than in most developing countries. Freight rates and costs are higher than any benchmark country. Myanma Railways’ fuel consumption seems particularly high—and could likely be strongly reduced.
3.1 FaresRailway passenger fares. Myanma Railways runs three classes: ordinary, upper, and sleeper. Survey data reveals that the fare perceived by users in ordinary class is 0.85–1.50 cents per kilometer (km) (higher fares for mountain areas), and 1.2–2.6 cents for in upper class. We do not have sufficient data for sleeper class, which only caters to a small number of users. In 2013, the average revenue per long-distance passengers reported by Myanma Railways came at was 1.04 cents per km.
Railway freight. Myanma Railways move freight either through freight trains, or by combining goods wagon-to-passenger trains (parcel transport system). In 2013, the average product per freight-km reported by Myanma Railways was 2.33 cents per km, which is about the freight tariff for an express freight train in plain section (2.28 cents per km in 2012).
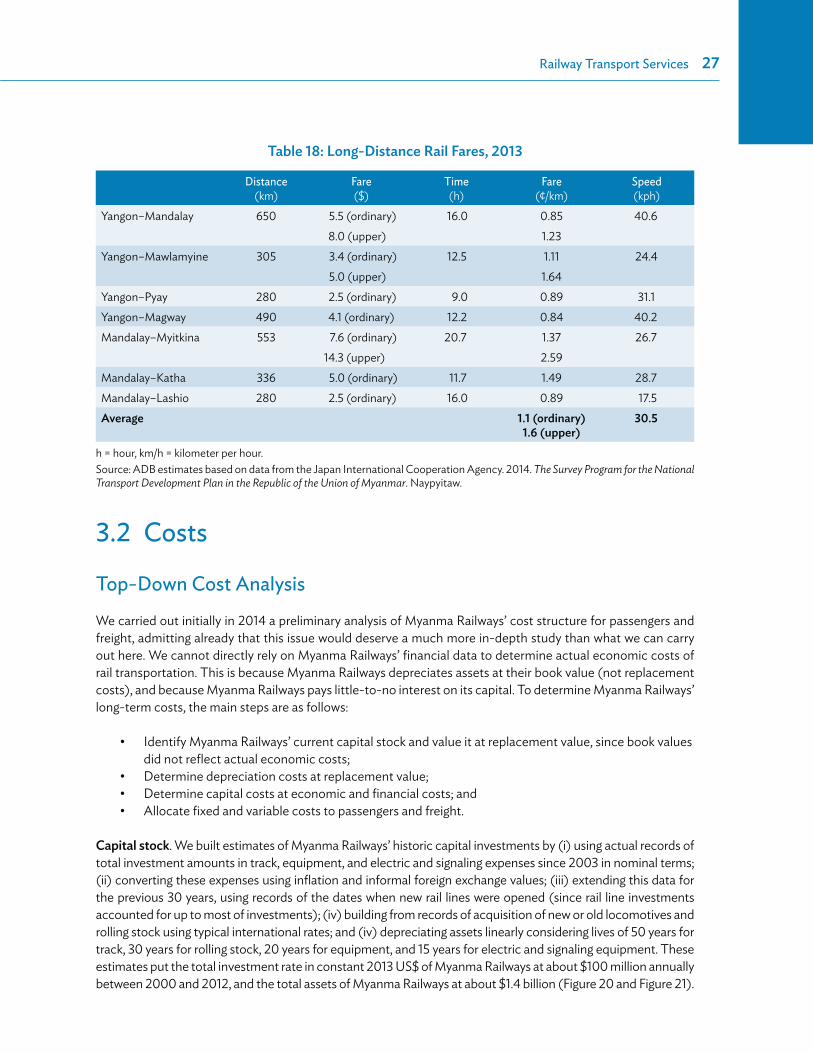
Railway Transport Services�27
3.2 Costs
Top-Down Cost Analysis
We carried out initially in 2014 a preliminary analysis of Myanma Railways’ cost structure for passengers and freight, admitting already that this issue would deserve a much more in-depth study than what we can carry out here. We cannot directly rely on Myanma Railways’ financial data to determine actual economic costs of rail transportation. This is because Myanma Railways depreciates assets at their book value (not replacement costs), and because Myanma Railways pays little-to-no interest on its capital. To determine Myanma Railways’ long-term costs, the main steps are as follows:
Identify Myanma Railways’ current capital stock and value it at replacement value, since book values did not reflect actual economic costs;Determine depreciation costs at replacement value;Determine capital costs at economic and financial costs; and Allocate fixed and variable costs to passengers and freight.
Capital stock. We built estimates of Myanma Railways’ historic capital investments by (i) using actual records of total investment amounts in track, equipment, and electric and signaling expenses since 2003 in nominal terms; (ii) converting these expenses using inflation and informal foreign exchange values; (iii) extending this data for the previous 30 years, using records of the dates when new rail lines were opened (since rail line investments accounted for up to most of investments); (iv) building from records of acquisition of new or old locomotives and rolling stock using typical international rates; and (iv) depreciating assets linearly considering lives of 50 years for track, 30 years for rolling stock, 20 years for equipment, and 15 years for electric and signaling equipment. These estimates put the total investment rate in constant 2013 US$ of Myanma Railways at about $100 million annually between 2000 and 2012, and the total assets of Myanma Railways at about $1.4 billion (Figure 20 and Figure 21).
Table 18: Long-Distance Rail Fares, 2013
Distance(km)
Fare($)
Time(h)
Fare(¢/km)
Speed (kph)
Yangon–Mandalay 650 5.5 (ordinary) 16.0 0.85 40.68.0 (upper) 1.23
Yangon–Mawlamyine 305 3.4 (ordinary) 12.5 1.11 24.45.0 (upper) 1.64
Yangon–Pyay 280 2.5 (ordinary) 9.0 0.89 31.1Yangon–Magway 490 4.1 (ordinary) 12.2 0.84 40.2Mandalay–Myitkina 553 7.6 (ordinary) 20.7 1.37 26.7
14.3 (upper) 2.59Mandalay–Katha 336 5.0 (ordinary) 11.7 1.49 28.7Mandalay–Lashio 280 2.5 (ordinary) 16.0 0.89 17.5Average 1.1 (ordinary)
1.6 (upper)30.5
h = hour, km/h = kilometer per hour.Source: ADB estimates based on data from the Japan International Cooperation Agency. 2014. The Survey Program for the National Transport Development Plan in the Republic of the Union of Myanmar. Naypyitaw.

28�Myanmar Transport Sector Policy Note: How to Reduce Transport Costs
Table 19: Myanma Railways Financial Expenses, FY2012
Category Myanmar Kyat $ millionStaff 19,009,890,000 19.6Pensions 4,040,374,000 4.2Fuel 35,064,781,000 36.1Direct material 7,119,130,000 7.3Operating 4,770,553,000 4.9Administrative 1,532,847,000 1.6Interest 2,418,254,000 2.5Depreciation 8,946,648,000 9.2Tax 1,395,479,000 1.4Exchange 5,580,000 0.0Total 84,303,536,000 86.9
Source: Myanma Railways, FY2012 accounts.
20 0
20002001
20022003
20042005
20062007
20082009
2010 20112012
40
60
80
100
120
140
160
180
Electric, signaling, and communicationsRolling stockEquipmentTrack, bridges, and structures
200
0
400
600
800
1,000
1,200
1,400
1,600
Electric, signaling, and communicationsRolling stockEquipmentTrack, bridges, and structures
20002001
20022003
20042005
20062007
20082009
2010 20112012
Figure 20: Myanma Railways Investment (2013, million $ value)
Figure 21: Myanma Railways Estimated Assets at Replacement Value
(2013, million $ value)
Source: ADB estimates based on model developed for the study.
Depreciation costs. The same estimates put the annual depreciation costs of Myanma Railways in economic terms at $43 million annual in 2012. For reference, Myanma Railways reported in FY2012 only MK8.9 billion ($8.9 million) of depreciation costs.
Capital costs. We considered next that capital costs (equity and debt) are a fixed 4% real cost applied to the capital stock. This puts Myanma Railways’ total annual capital costs at $57 million in 2012. For reference, Myanma Railways paid in 2012 $2.4 million in interests and did not pay dividends.

Railway Transport Services�29
Allocation rules. This top-down analysis relied on simple benchmarks. We considered pensions, administration, taxes, etc. as fixed costs, and allocated proportionally to the number of trains (bearing mostly on passengers). We allocated other costs (variable costs such as fuel, staff, etc.; depreciation costs; and cost of capital) proportionally to the share of train km, as a proxy for actual usage (bearing for about 70% on passengers, and for about 30% on freight).6
Coverage ratio. Because much of track costs relate to tracks in areas where there is little demand, three assumptions were considered: (i) integrating all track capital costs considering that past investments are representative of long-term needs, (ii) integrating only 15% of these costs as relating to actual needs of users, and (iii) not including any track costs. The fares of Myanma Railways cover 62% of freight costs when including track costs, and 115% of freight costs otherwise. These cover 28% of passenger costs when including track costs, and 50% of passenger costs otherwise (Table 20). In the scenario where only 15% of track costs are allocated, freight revenues cover 107% of its costs, and passenger revenues cover 45% of its costs.
6 This is a good approximation for fuel: in 2012, freight consumed 31% of all Myanma Railways’ diesel.
10
20
30
40
50
Electric, signaling, and communicationsRolling stockEquipmentTrack, bridges, and structures
20002001
20022003
20042005
20062007
20082009
2010 20112012
0 010203040506070
2000 2001 2002 2003 2004 2005 2006 2007 2008 2009 2010 2011 2012
Electric, signaling, and communications
Rolling stock
Equipment
Track, bridges, and structures
Figure 22: Myanma Railways Estimated Depreciation Costs
(2013, million $ value)
Figure 23: Myanma Railways Estimated Capital Costs
(2013, million $ value)
Source: ADB estimates based on model developed for the study.

30�Myanmar Transport Sector Policy Note: How to Reduce Transport Costs
Table 20: Myanma Railways Costs and Cost Coverage Ratio (Top–Down Analysis) (¢ per unit of traffic-km)
Expenditures
Freight Passenger
Full Track Costs
15% Track Costs
No Track Costs
Full Track Costs
15% Track Costs
No Track Costs
Fixed costs 0.1 0.1 0.1 0.4 0.4 0.4Variable costs 1.7 1.7 1.7 1.1 1.1 1.1Depreciation costs 1.3 0.5 0.4 0.9 0.4 0.3Capital costs (at 4% rate) 1.7 0.5 0.3 1.1 0.3 0.2Total costs 4.8 2.8 2.6 3.5 2.2 2.0Revenues 3.0 3.0 3.0 1.0 1.0 1.0Cost coverage ratio 62% 107% 115% 28% 45% 50%
Source: ADB estimates based on model developed for the study.
Bottom-Up Analysis
We developed a full costing model under a subsequent technical assistance.7 This model allocates the costs directly linked to rail services, not including historic excess pension, track, and rolling stock costs. The results are summarized in Figure 24. Freight revenues do not cover all capital costs. They are close to covering all above rail costs, so that a private operator may be able to invest. In contrast, passenger services only cover 67% of their direct above rail costs, and only 37% of total costs.
The two analyses give comparable results (Table 21).
7 ADB. 2014. Technical Assistance to Myanmar for Transport Sector Reform and Modernization. Manila.
Figure 24: Myanma Railways Costs and Rates (kyat/ton- or passenger-km)
25
15
5
7
4
5
3
0
5
10
15
20
25
30
35
40
45
Freight Passengers
Variable costs Above rail capital costs Fixed costs Below rail capital costs
10
Rates
3010
Notes: Infrastructure costs distributed on the basis of train-miles. Capital charges are based on a mixture of new and secondhand equipment at a 4% real interest rate per annum.Source: ADB. 2014. Technical Assistance to Myanmar for Transport Sector Reform and Modernization. Manila
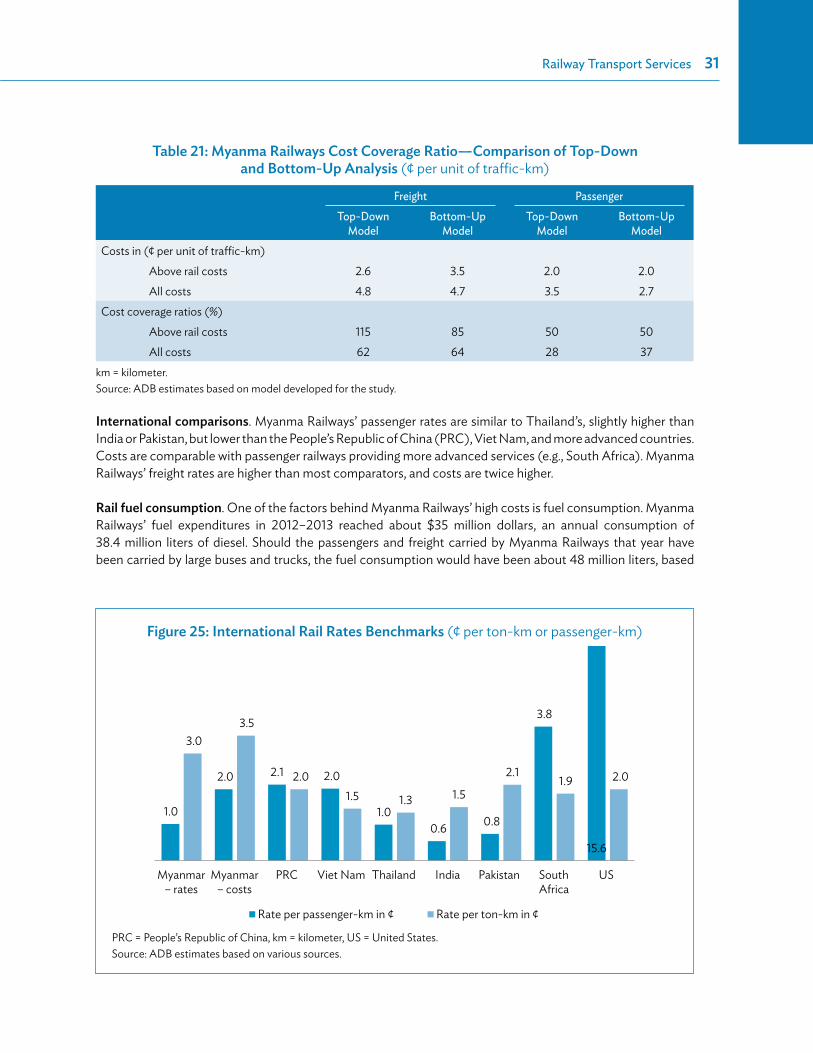
Railway Transport Services�31
Table 21: Myanma Railways Cost Coverage Ratio—Comparison of Top-Down and Bottom-Up Analysis (¢ per unit of traffic-km)
Freight PassengerTop-Down
ModelBottom-Up
ModelTop-Down
ModelBottom-Up
ModelCosts in (¢ per unit of traffic-km) Above rail costs 2.6 3.5 2.0 2.0 All costs 4.8 4.7 3.5 2.7Cost coverage ratios (%) Above rail costs 115 85 50 50 All costs 62 64 28 37
km = kilometer.Source: ADB estimates based on model developed for the study.
International comparisons. Myanma Railways’ passenger rates are similar to Thailand’s, slightly higher than India or Pakistan, but lower than the People’s Republic of China (PRC), Viet Nam, and more advanced countries. Costs are comparable with passenger railways providing more advanced services (e.g., South Africa). Myanma Railways’ freight rates are higher than most comparators, and costs are twice higher.
Rail fuel consumption. One of the factors behind Myanma Railways’ high costs is fuel consumption. Myanma Railways’ fuel expenditures in 2012–2013 reached about $35 million dollars, an annual consumption of 38.4 million liters of diesel. Should the passengers and freight carried by Myanma Railways that year have been carried by large buses and trucks, the fuel consumption would have been about 48 million liters, based
Figure 25: International Rail Rates Benchmarks (¢ per ton-km or passenger-km)
1.0
2.0 2.1 2.0
1.0 0.6 0.8
3.8
15.6
3.0 3.5
2.0 1.5 1.3 1.5
2.1 1.9 2.0
Myanmar– rates
Myanmar– costs
PRC Viet Nam Thailand India Pakistan SouthAfrica
US
Rate per passenger-km in ¢ Rate per ton-km in ¢
PRC = People’s Republic of China, km = kilometer, US = United States.Source: ADB estimates based on various sources.

32�Myanmar Transport Sector Policy Note: How to Reduce Transport Costs
on our earlier estimates of road costs. Rail passenger transport seems particularly inefficient, burning only 18% less fuel than buses, while rail freight transport burns 43% less fuel than competing road transport services. Altogether, Myanma Railways burns only 25% less fuel than equivalent road transport. While not negligible, this is far less than expected. For instance, in the United States, freight railways burn 10 times less fuel than trucks, and passenger railways in Europe consume typically about three times less energy than intercity buses.
This is in large part caused by the age of the locomotives. Myanma Railways’ older locomotives consume around twice the fuel of more modern ones. Modernizing the fleet of locomotives would quickly reduce operating costs.
33
4 River Transport Services
Key FindingsRiver transport in Myanmar is well positioned to serve the Yangon–Mandalay corridor and offer the cheapest services.
However, the efficiency of river transport is severely constrained by the (lack of) infrastructure. The shallowness of some key sections of the Ayeyarwaddy River, the absence of a navigation channel, and the lack of proper port facilities largely make it uneconomic to use large vessels.
4.1 Rates and ServicesPublic and private operators service the river’s various markets as shown in the following:
Transport in the Ayeyarwaddy Delta, which runs all year round, is often shorter than trips by road (when there is connectivity), and where there is a good integration between long-distance and short-distance river transport.Transport on the Ayeyarwaddy itself up to Mandalay is subdivided between the section to Pakokku, which is navigable 80%–90% of the year for any kind of vessel in use in Myanmar, and the one between Pakokku and Mandalay, which is only navigable 70% of the year because of the sandbanks.Transport on the upper reaches of the Ayeyarwaddy to Katha and Bhamo, and on the Chindwin to Monywa and Kalewa, is through small vessels that provide essential services during the wet season.
The public carrier, Inland Water Transport (IWT), which used to account for most of the river transport market, has all but stopped between 2012 and 2014 its long-distance passenger transport services. The average fare offered by private carriers was reported to be 1.2 cents per kilometer (km) (the distance on the waterway usually differs from the distance by road or rail), for an average speed of 15 kilometers per hour (kph). In the ranges of the Ayeyarwaddy north of Pakokku, services are restrained, and often take longer time during the dry season. IWT revenues were on average 1.1 cents per passenger-km, but this data includes both long-distance and short-distance passengers (river crossings).
The National Transport Development Plan reports that average freight rates are 1.5 cents per ton/km, with differences between low and high water season, and that average travel speed of cargo vessels is 5 kph. Rates are again very close from what IWT charges (1.6 cents per ton/km in 2013–2014). During the low water season, some sections of waterway become impassable to most vessels.
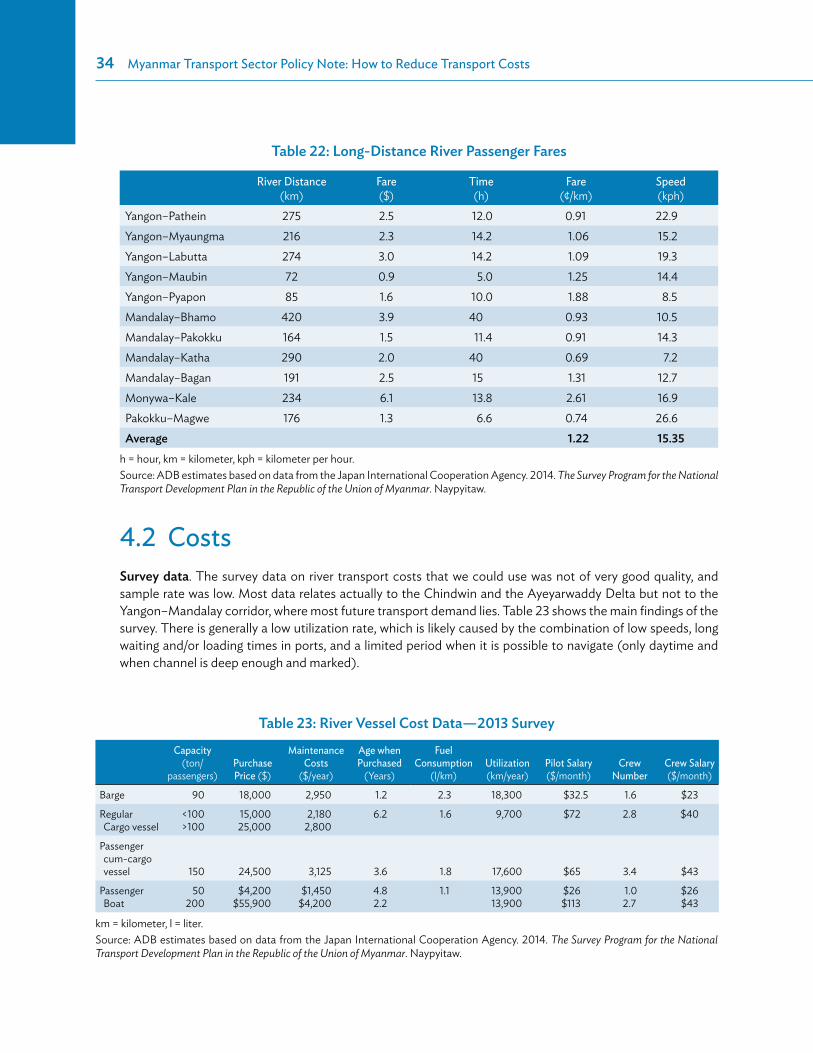
34�Myanmar Transport Sector Policy Note: How to Reduce Transport Costs
4.2 CostsSurvey data. The survey data on river transport costs that we could use was not of very good quality, and sample rate was low. Most data relates actually to the Chindwin and the Ayeyarwaddy Delta but not to the Yangon–Mandalay corridor, where most future transport demand lies. Table 23 shows the main findings of the survey. There is generally a low utilization rate, which is likely caused by the combination of low speeds, long waiting and/or loading times in ports, and a limited period when it is possible to navigate (only daytime and when channel is deep enough and marked).
Table 22: Long-Distance River Passenger Fares
River Distance(km)
Fare($)
Time(h)
Fare(¢/km)
Speed (kph)
Yangon–Pathein 275 2.5 12.0 0.91 22.9Yangon–Myaungma 216 2.3 14.2 1.06 15.2Yangon–Labutta 274 3.0 14.2 1.09 19.3Yangon–Maubin 72 0.9 5.0 1.25 14.4Yangon–Pyapon 85 1.6 10.0 1.88 8.5Mandalay–Bhamo 420 3.9 40 0.93 10.5Mandalay–Pakokku 164 1.5 11.4 0.91 14.3Mandalay–Katha 290 2.0 40 0.69 7.2Mandalay–Bagan 191 2.5 15 1.31 12.7Monywa–Kale 234 6.1 13.8 2.61 16.9Pakokku–Magwe 176 1.3 6.6 0.74 26.6Average 1.22 15.35
h = hour, km = kilometer, kph = kilometer per hour.Source: ADB estimates based on data from the Japan International Cooperation Agency. 2014. The Survey Program for the National Transport Development Plan in the Republic of the Union of Myanmar. Naypyitaw.
Table 23: River Vessel Cost Data—2013 Survey
Capacity (ton/
passengers)Purchase Price ($)
Maintenance Costs
($/year)
Age when Purchased
(Years)
Fuel Consumption
(l/km)Utilization(km/year)
Pilot Salary ($/month)
Crew Number
Crew Salary($/month)
Barge 90 18,000 2,950 1.2 2.3 18,300 $32.5 1.6 $23
Regular Cargo vessel
<100>100
15,00025,000
2,1802,800
6.2 1.6 9,700 $72 2.8 $40
Passenger cum-cargo vessel 150 24,500 3,125 3.6 1.8 17,600 $65 3.4 $43
Passenger Boat
50200
$4,200$55,900
$1,450$4,200
4.82.2
1.1 13,90013,900
$26$113
1.02.7
$26$43
km = kilometer, l = liter.Source: ADB estimates based on data from the Japan International Cooperation Agency. 2014. The Survey Program for the National Transport Development Plan in the Republic of the Union of Myanmar. Naypyitaw.

River Transport Services�35
River freight cost model. We build a model of freight costs in function of distance for different classes of vessels, drawing from regressions on the survey data, and data from the Comprehensive Transport Study (1991) deemed to be still valid (e.g., river depth, vessel draught, and motor horsepower). This will enable us to analyze the impact of potential investments on the waterway and ports. We have insufficient data to build reliable estimates of river passenger transport costs, and choose not to. This is not very constraining to the rest of the analysis as it concentrates on long-distance transport, while river passenger transport is likely to be increasingly only relevant for local trips.
We model five types of cargo vessels, as described in Table 24. The ones most commonly observed in Myanmar are the 50–200 ton vessels, as there are only a few river vessels or barges with a capacity of 500–1,000 tons. To model the impact of distance on costs, we consider an average waiting time at each end of the trip of 2 days. We add loading and/or unloading time (which depends on the tonnage of the vessel, and the efficiency of loading operations—which, in turn, depends upon the number of gangs working and the number of tons per hour that they can load and/or unload). This had been estimated by the Comprehensive Transport Study to be about 7.5 tons per gang/hour.
This model shows that larger vessels have a cost advantage over smaller ones for long distances. This effect is however less than observed in other countries, because larger vessels are penalized by their slower loading and unloading times in ports and by the limited share of the year they can navigate because of their higher draught. On long distances, fuel costs account for 75% of costs for small vessels, and about 60% for larger ones. Between Yangon and Mandalay (about 950 km by river), the economic cost for a 1,000 ton vessel comes just at 1.6 cents per ton-km, but is closer to 1.8 cents per ton-km for the more common 200–500 ton vessels on the corridor. The total turnover time for a 250 ton vessel there is calculated to be about 13 days, of which 30% is waiting time in ports and 70% is travel.
Table 24: River Freight Cost Model Parameters
Vessel Capacity Ton 50 125 250 500 1,000Rated horsepower kw 60 120 220 350 600Vessel purchase cost $ 7,000 30,000 100,000 450,000 650,000Average age Years 8 8 15 30 30Vessel life Years 20 20 25 40 40Crew No 2 3 3.7 6.7 11.7Annual maintenance cost $ 1,800 3,000 5,100 9,200 17,400Draught loaded meters 1.86 2.07 1.5 1.8 2.3Navigability to Mandalay Share of year (%) 75 71 79 75 68Loading efficiency ton/hour 7.5 11.2 15 22.5 30
kw = kilowatt, No. = number.Source: ADB estimates based on data from the Japan International Cooperation Agency. 2014. The Survey Program for the National Transport Development Plan in the Republic of the Union of Myanmar. Naypyitaw.
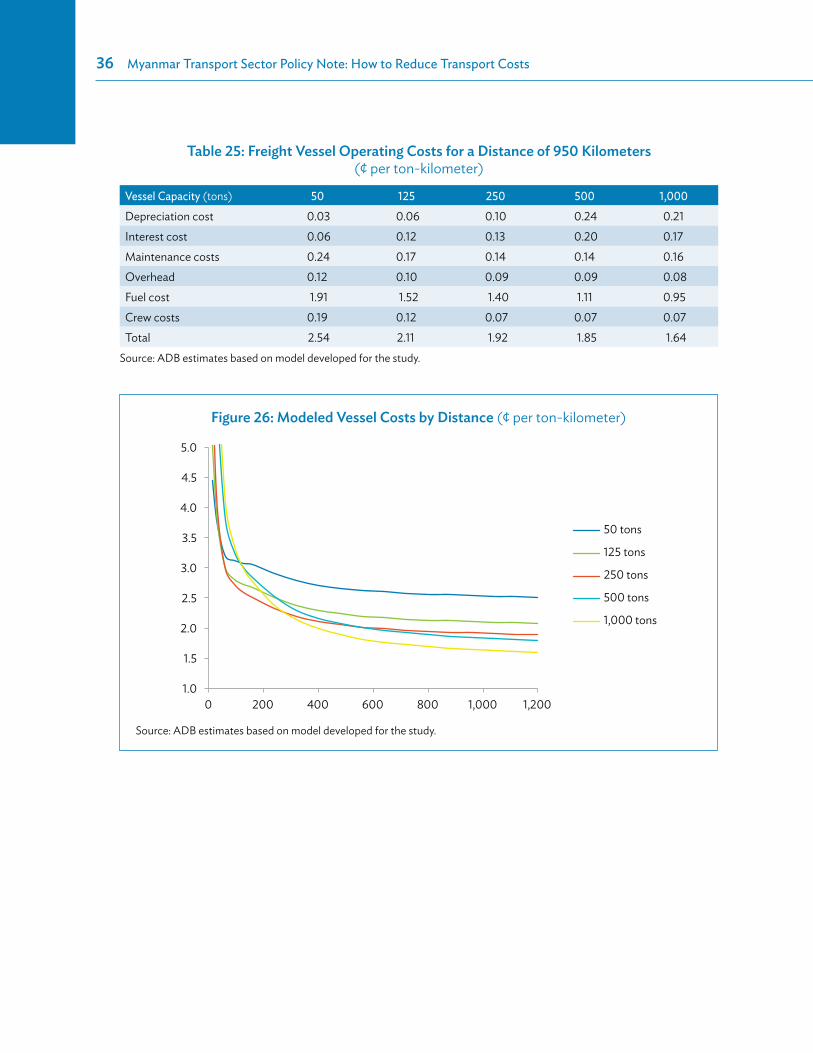
36�Myanmar Transport Sector Policy Note: How to Reduce Transport Costs
Table 25: Freight Vessel Operating Costs for a Distance of 950 Kilometers (¢ per ton-kilometer)
Vessel Capacity (tons) 50 125 250 500 1,000Depreciation cost 0.03 0.06 0.10 0.24 0.21Interest cost 0.06 0.12 0.13 0.20 0.17Maintenance costs 0.24 0.17 0.14 0.14 0.16Overhead 0.12 0.10 0.09 0.09 0.08Fuel cost 1.91 1.52 1.40 1.11 0.95Crew costs 0.19 0.12 0.07 0.07 0.07Total 2.54 2.11 1.92 1.85 1.64
Source: ADB estimates based on model developed for the study.
Figure 26: Modeled Vessel Costs by Distance (¢ per ton-kilometer)
1.0
1.5
2.0
2.5
3.0
3.5
4.0
4.5
5.0
0 200 400 600 800 1,000 1,200
50 tons
125 tons
250 tons
500 tons
1,000 tons
Source: ADB estimates based on model developed for the study.

37
5 Competitiveness of Each Mode of Transport
Key FindingsRailways and river transport appear moderately competitive—at prevalent fares—on the Yangon–Mandalay corridor, and should be highly competitive in other areas.
However, rail freight market share seems particularly below its potential. This seems to be more a matter of operational priorities of Myanma Railways, than of underlying market trends.
In the passenger transport market, cars are increasingly becoming the cheapest option to users who can afford one. Rail seems to be competing neck-to-neck with buses for low-income passengers, and is not competitive for middle- or high-income passengers.
The favorable market positioning of rail and river transport against roads is, however, largely artificial, caused by implicit rail subsidies and cutthroat competition in the river transport market. Notwithstanding these unsustainable advantages, neither rail nor river would be in a position to capture a significant share of any market.
Costs faced by users. Users differentiate between modes of transport based on:
Price, which is the fare of the main transporter for public transport and trucks or the tolls and fuel costs for cars, as well the costs of the local trips needed at the beginning and end of the journey to reach the station or the port.Time, which is the time taken for the main trip, the access and/or egress time and any waiting time en route. Users will value differently these costs depending on the income level of passengers and the value or time-sensitivity of the goods for freight.Other factors also affect modal choice, such as frequency, quality, and reliability; size of shipments and packaging mode; etc. Of course, a mode of transport may simply not be available at all to some users (e.g., river transport for freight, car travel for passengers without cars). It is also important to remember that distances by road, rail, or waterways differ, affecting time and prices.
5.1 Freight Prices and speed. River transport operators charge the least for freight, being 30% cheaper than railways. However, because the distance between Yangon and Mandalay is about 50% longer by river than by rail, the two modes of transport actually offer similar rates. Truck rates are 60% higher on the Yangon–Mandalay corridor, and 100%–160% higher on other corridors. Truck commercial speeds are slightly higher than railway speeds, but the difference is smaller than expected.
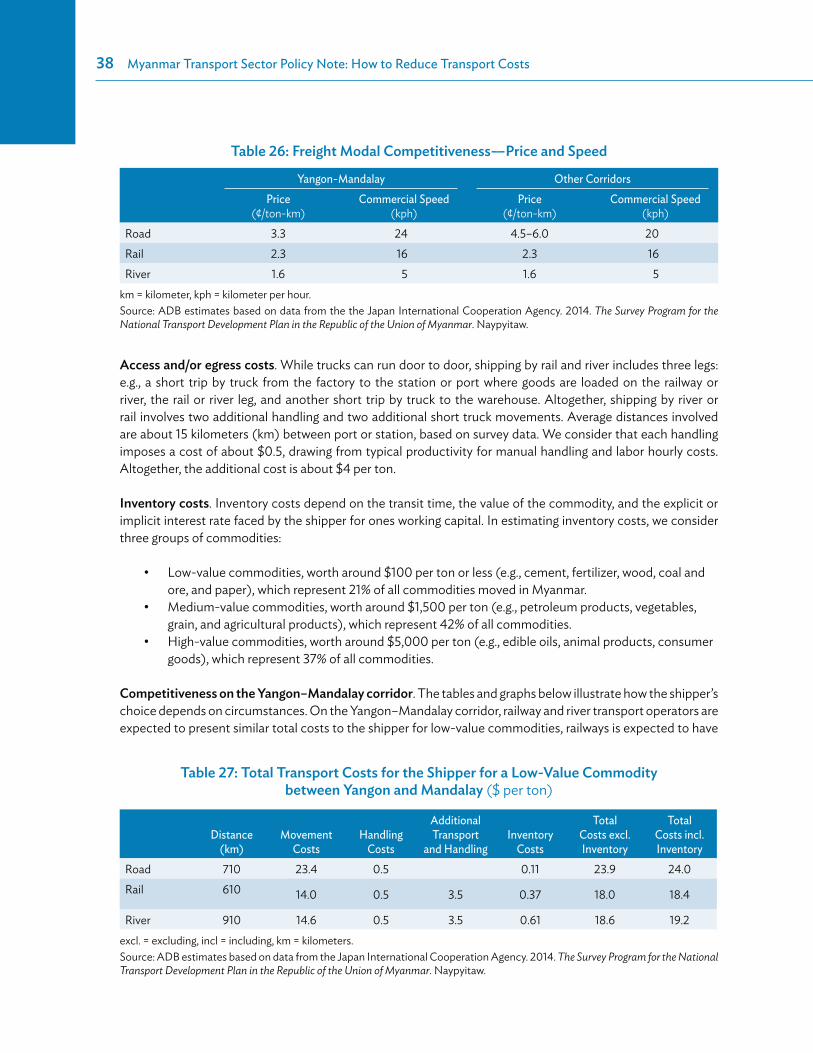
38�Myanmar Transport Sector Policy Note: How to Reduce Transport Costs
Table 26: Freight Modal Competitiveness—Price and Speed
Yangon-Mandalay Other CorridorsPrice
(¢/ton-km)Commercial Speed
(kph)Price
(¢/ton-km)Commercial Speed
(kph)Road 3.3 24 4.5–6.0 20Rail 2.3 16 2.3 16River 1.6 5 1.6 5
km = kilometer, kph = kilometer per hour.Source: ADB estimates based on data from the the Japan International Cooperation Agency. 2014. The Survey Program for the National Transport Development Plan in the Republic of the Union of Myanmar. Naypyitaw.
Access and/or egress costs. While trucks can run door to door, shipping by rail and river includes three legs: e.g., a short trip by truck from the factory to the station or port where goods are loaded on the railway or river, the rail or river leg, and another short trip by truck to the warehouse. Altogether, shipping by river or rail involves two additional handling and two additional short truck movements. Average distances involved are about 15 kilometers (km) between port or station, based on survey data. We consider that each handling imposes a cost of about $0.5, drawing from typical productivity for manual handling and labor hourly costs. Altogether, the additional cost is about $4 per ton.
Inventory costs. Inventory costs depend on the transit time, the value of the commodity, and the explicit or implicit interest rate faced by the shipper for ones working capital. In estimating inventory costs, we consider three groups of commodities:
Low-value commodities, worth around $100 per ton or less (e.g., cement, fertilizer, wood, coal and ore, and paper), which represent 21% of all commodities moved in Myanmar.Medium-value commodities, worth around $1,500 per ton (e.g., petroleum products, vegetables, grain, and agricultural products), which represent 42% of all commodities.High-value commodities, worth around $5,000 per ton (e.g., edible oils, animal products, consumer goods), which represent 37% of all commodities.
Competitiveness on the Yangon–Mandalay corridor. The tables and graphs below illustrate how the shipper’s choice depends on circumstances. On the Yangon–Mandalay corridor, railway and river transport operators are expected to present similar total costs to the shipper for low-value commodities, railways is expected to have
Table 27: Total Transport Costs for the Shipper for a Low-Value Commodity between Yangon and Mandalay ($ per ton)
Distance (km)
Movement Costs
Handling Costs
Additional Transport
and HandlingInventory
Costs
Total Costs excl. Inventory
Total Costs incl. Inventory
Road 710 23.4 0.5 0.11 23.9 24.0Rail 610 14.0 0.5 3.5 0.37 18.0 18.4
River 910 14.6 0.5 3.5 0.61 18.6 19.2excl. = excluding, incl = including, km = kilometers. Source: ADB estimates based on data from the Japan International Cooperation Agency. 2014. The Survey Program for the National Transport Development Plan in the Republic of the Union of Myanmar. Naypyitaw.

Competitiveness of Each Mode of Transport �39
an advantage for medium-value commodities for most trips, and road to have an advantage for high-value commodities. Trucks always have an advantage for short trips. For trips shorter than Yangon to Mandalay, road’s advantage becomes clearer as distances shorten, becoming competitive for low-value commodities for distances of less than 300 km, and for medium value commodities for distances of less than 600 km.
Competitiveness on other corridors. For other corridors, when available, river is expected to be the most cost-effective transport mode for low- and medium-value commodities even for short distances, but is irrelevant for high-value commodities. Rail transport is a second best, becoming competitive for distances above 150 km for low-value goods, 300 km for medium-value ones, and 650 km for high-value goods.
Table 28: Total Transport Costs for the Shipper for a High-Value Commodity Over a Distance of 250 kilometers ($ per ton)
Movement Costs Handling Costs
Additional Transport
and HandlingInventory
CostsTotal Costs
excl. InventoryTotal Costs
incl. InventoryRoad 12.5 0.5 3.0 13.0 16.0Rail 5.75 0.5 3.5 15.5 9.8 25.2River 4.00 0.5 3.5 12.4 8.0 20.4
excl. = excluding, incl = including.
Note: the data do not take into account the different distances between cities by road, rail, or river. Road fare is assumed to be 5 cents per kilometer.Source: ADB estimates based on data from the Japan International Cooperation Agency. 2014. The Survey Program for the National Transport Development Plan in the Republic of the Union of Myanmar. Naypyitaw.
0.00
0.02
0.04
0.06
0.08
0.10
0.12
0.14
0 200 400 600 800 1,000 1,200
Road Rail River
0.00
0.02
0.04
0.06
0.08
0.10
0.12
0.14
0 200 400 600 800 1,000 1,200
Road Rail River
Figure 27: Yangon–Mandalay Corridor Transport Costs of Low-Value Commodities ($ per ton-km)
Figure 28: Yangon–Mandalay Corridor Transport Costs of Medium-Value
Commodities ($ per ton-km)
km = kilometer.Note: the figures do not take into account the different distances between cities by road, rail, or river.Source: ADB estimates based on model developed for the study.
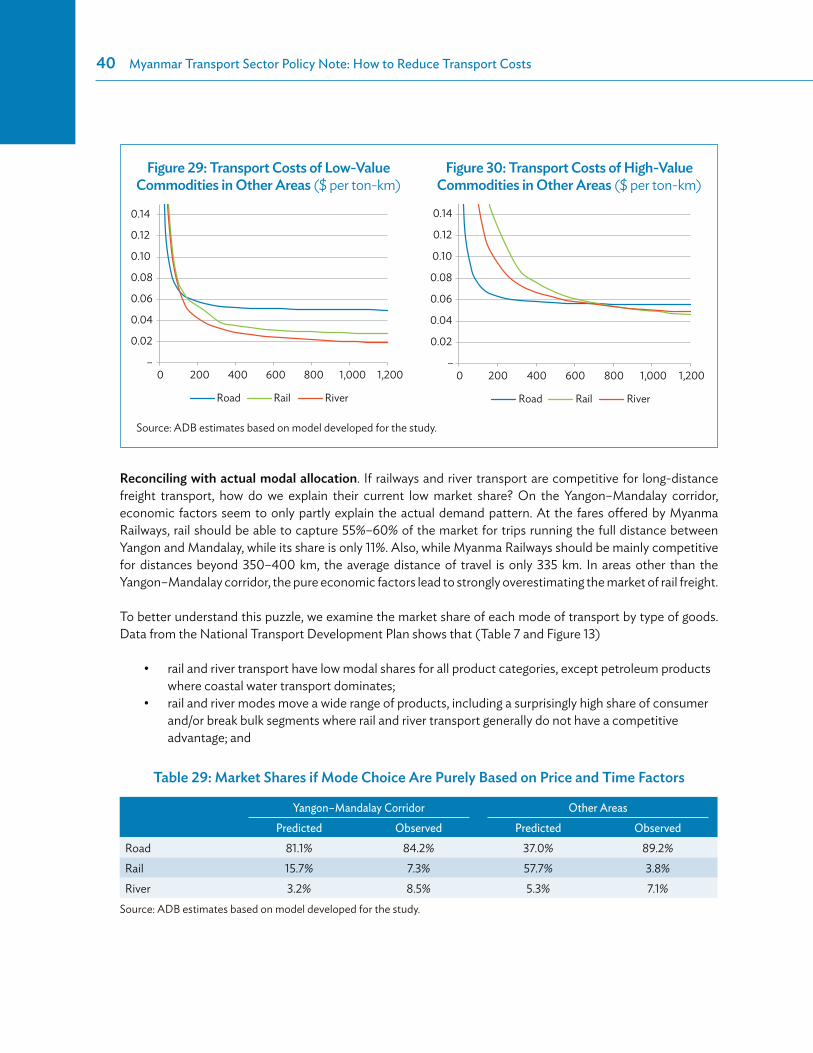
40�Myanmar Transport Sector Policy Note: How to Reduce Transport Costs
Reconciling with actual modal allocation. If railways and river transport are competitive for long-distance freight transport, how do we explain their current low market share? On the Yangon–Mandalay corridor, economic factors seem to only partly explain the actual demand pattern. At the fares offered by Myanma Railways, rail should be able to capture 55%–60% of the market for trips running the full distance between Yangon and Mandalay, while its share is only 11%. Also, while Myanma Railways should be mainly competitive for distances beyond 350–400 km, the average distance of travel is only 335 km. In areas other than the Yangon–Mandalay corridor, the pure economic factors lead to strongly overestimating the market of rail freight.
To better understand this puzzle, we examine the market share of each mode of transport by type of goods. Data from the National Transport Development Plan shows that (Table 7 and Figure 13)
rail and river transport have low modal shares for all product categories, except petroleum products where coastal water transport dominates;rail and river modes move a wide range of products, including a surprisingly high share of consumer and/or break bulk segments where rail and river transport generally do not have a competitive advantage; and
–
0.02
0.04
0.06
0.08
0.10
0.12
0.14
0 200 400 600 800 1,000 1,200
Road Rail River
–
0.02
0.04
0.06
0.08
0.10
0.12
0.14
0 200 400 600 800 1,000 1,200
Road Rail River
Figure 29: Transport Costs of Low-Value Commodities in Other Areas ($ per ton-km)
Figure 30: Transport Costs of High-Value Commodities in Other Areas ($ per ton-km)
Source: ADB estimates based on model developed for the study.
Table 29: Market Shares if Mode Choice Are Purely Based on Price and Time Factors
Yangon–Mandalay Corridor Other AreasPredicted Observed Predicted Observed
Road 81.1% 84.2% 37.0% 89.2%Rail 15.7% 7.3% 57.7% 3.8%River 3.2% 8.5% 5.3% 7.1%
Source: ADB estimates based on model developed for the study.
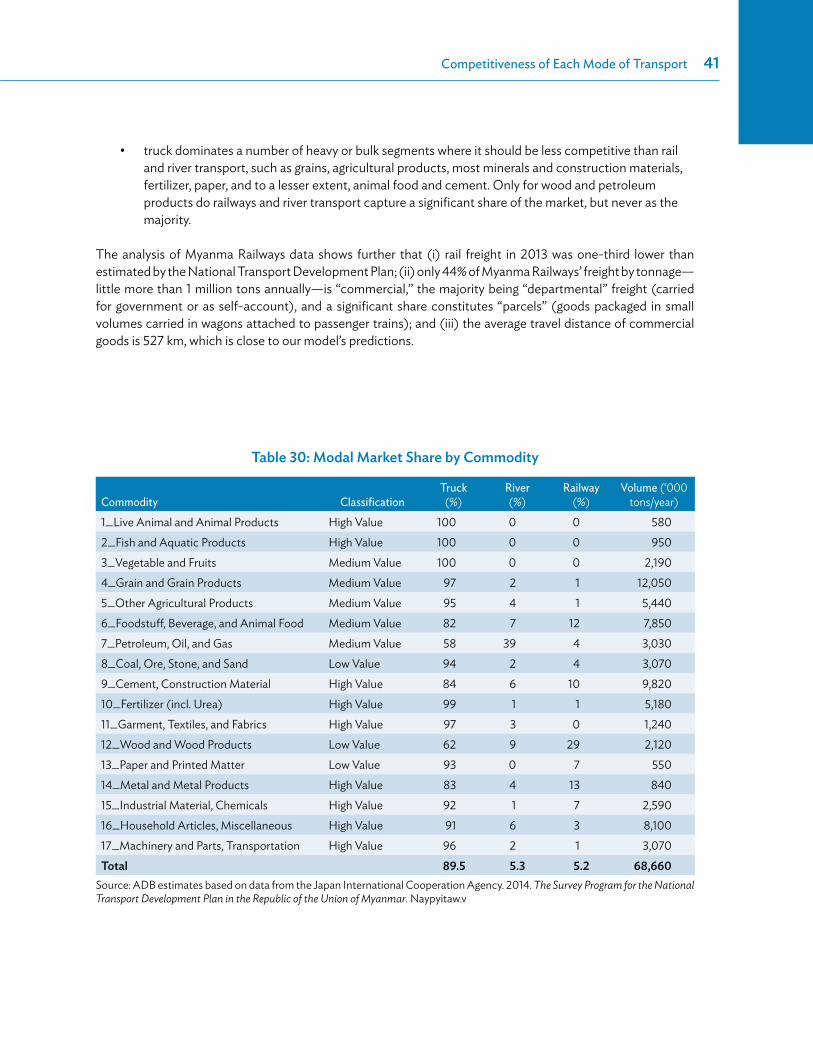
Competitiveness of Each Mode of Transport �41
truck dominates a number of heavy or bulk segments where it should be less competitive than rail and river transport, such as grains, agricultural products, most minerals and construction materials, fertilizer, paper, and to a lesser extent, animal food and cement. Only for wood and petroleum products do railways and river transport capture a significant share of the market, but never as the majority.
The analysis of Myanma Railways data shows further that (i) rail freight in 2013 was one-third lower than estimated by the National Transport Development Plan; (ii) only 44% of Myanma Railways’ freight by tonnage—little more than 1 million tons annually—is “commercial,” the majority being “departmental” freight (carried for government or as self-account), and a significant share constitutes “parcels” (goods packaged in small volumes carried in wagons attached to passenger trains); and (iii) the average travel distance of commercial goods is 527 km, which is close to our model’s predictions.
Table 30: Modal Market Share by Commodity
Commodity ClassificationTruck
(%)River (%)
Railway (%)
Volume (‘000 tons/year)
1_Live Animal and Animal Products High Value 100 0 0 5802_Fish and Aquatic Products High Value 100 0 0 9503_Vegetable and Fruits Medium Value 100 0 0 2,1904_Grain and Grain Products Medium Value 97 2 1 12,0505_Other Agricultural Products Medium Value 95 4 1 5,4406_Foodstuff, Beverage, and Animal Food Medium Value 82 7 12 7,8507_Petroleum, Oil, and Gas Medium Value 58 39 4 3,0308_Coal, Ore, Stone, and Sand Low Value 94 2 4 3,0709_Cement, Construction Material High Value 84 6 10 9,82010_Fertilizer (incl. Urea) High Value 99 1 1 5,18011_Garment, Textiles, and Fabrics High Value 97 3 0 1,24012_Wood and Wood Products Low Value 62 9 29 2,12013_Paper and Printed Matter Low Value 93 0 7 55014_Metal and Metal Products High Value 83 4 13 84015_Industrial Material, Chemicals High Value 92 1 7 2,59016_Household Articles, Miscellaneous High Value 91 6 3 8,10017_Machinery and Parts, Transportation High Value 96 2 1 3,070Total 89.5 5.3 5.2 68,660
Source: ADB estimates based on data from the Japan International Cooperation Agency. 2014. The Survey Program for the National Transport Development Plan in the Republic of the Union of Myanmar. Naypyitaw.v

42�Myanmar Transport Sector Policy Note: How to Reduce Transport Costs
The difference between actual rail transport volumes and the potential market may be linked both to the low quality of the services provided by Myanma Railways—e.g., particularly their unreliability—and their limited availability outside of the Yangon–Mandalay corridor (low frequency of services, services not offered because Myanma Railways does not have the rolling stock). For further modeling, we constrain the market potential of rail freight by (i) assuming that one-third of the market can only be served by the road, because it is composed of too-small-scale shippers, and (ii) capping rail freight availability, i.e., we have to assume that rail freight is currently able to meet only 30% of its current potential market on the Yangon–Mandalay corridor and 10% on average in other areas.
Economic distortions. It is important to consider also how modal allocation would look if all prices were equal to economic costs. Under this ideal case, total transport costs for the economy would be optimized at their lower level. Differences between economic and perceived user costs because of subsidies or excessive
Figure 31: Freight Economic Costs and User Costs—Yangon–Mandalay, Low-Value Commodity ($ per ton/km)
0.00
0.01
0.02
0.03
0.04
0.05
0.06
0.07
0.08
0.09
0.10
0 200 400 600 800 1,000 1,200
Road (User costs)
Rail (User costs)
River (User costs)
Road (Economic costs)
Rail (Economic costs)
River (Economic costs)
$
kilometer
Source: ADB estimates based on model developed for the study.
Table 31: Myanma Railways Freight Transport Volumes, FY2013–2014
Distance of Travel (km) Million ton-km
Share of ton-km (%) Million Tons
Share of Tons (%)
Goods (commercial) 527 579 70 1.09 44Department ballast 113 66 8 0.58 23Parcel 289 149 18 0.51 21Others 125 35 4 0.28 11Total 336 829 2.47
km = kilometer.Source: ADB estimates based on Myanma Railways. 2014. Performance Indicators for FY1989–FY2013. Naypyitaw.

Competitiveness of Each Mode of Transport �43
competition may lead to distorting the choice of shippers toward less economical modes of transport. Figure 31 presents the economic cost and perceived user costs curves for a low-value commodity on the Yangon to Mandalay corridor. Rail and river transport underpricing causes them to appear competitive for distances above 300 km. However, under rail and river’s current low degree of efficiency, trucks appear to be the most economical mode of transport for any relevant distance on that corridor. That said, neither the underpricing of rail or river freight leads to significant economic costs to Myanmar. This is because river costs are actually close to the fares charged by the largest vessels, and because the longer distances by river than by road or rail limit its relevance to a few origins—destinations. The negative effect of rail freight underpricing is also counterbalanced by the limited availability of rail freight. These issues should still be considered, particularly in the case of new investments that would increase the availability of rail freight.
We note that pricing externalities—as analyzed in the separate note on road user charges8—would not affect the modal split. This is because vehicles fully cover their marginal external costs on national roads, which are tolled.
5.2 Passenger TransportPrices and speed. Rail offers the cheapest services on the Yangon–Mandalay corridor, with a train ride between the two cities in ordinary class being almost half the price of a bus ride. Rail, however, loses to buses on speed: a bus will take 9 hours to cross the distance, while an express train will take 15 hours. On other corridors, when available, river is the cheapest option, rates being moderately lower than rail rates. Speed strongly differentiates between modes: while a bus will run at 40 kilometers per hour (kph) on average, a train will only do 30 kph, and river vessels only 15 kph. Such differences become very significant on long distances. Cars are the fastest land mode, running slightly faster than buses. Car users perceive only toll rates and fuel expenses when deciding which mode to choose, but not vehicle depreciation or maintenance costs. These expenses are shared among passengers: occupancy rates are 2.9 on the Yangon–Mandalay corridor, and 3.1 on other corridors for small cars. Average occupancy is six for pickups and sport utility vehicles.
Access and/or egress costs. The main disadvantage of public transport modes against cars is the need to access the station and wait before boarding. Drawing from the surveys, we consider an average access and
8 ADB. 2016. Myanmar Transport Sector Policy Note: How to Improve Road User Charges. Manila.
Table 32: Passenger Transport Speed and Rates
Yangon–Mandalay Other CorridorsPrice
(¢/passenger-km)Commercial Speed
(kph)Price
(¢/passenger-km)Commercial Speed
(kph)Car and/or Pickup 2.8 78 3.4 30–60Bus 1.6 70 1.8-2.5 30–50Rail 0.9 40 0.9-1.5 20–40River 1.2 15-20 0.7-1.3 10–20Air 17 650 25 650
h = hour, km = kilometers, kph = kilometer per hour.
Source: ADB estimates based on data from the Japan International Cooperation Agency. 2014. The Survey Program for the National Transport Development Plan in the Republic of the Union of Myanmar. Naypyitaw.

44�Myanmar Transport Sector Policy Note: How to Reduce Transport Costs
egress cost per trip of $2.5 for buses for a total duration of 1.5 hours and a waiting time of 30 minutes, $2 for trains, $1.5 for river vessels (2 hours total trip time for both), and $7.5 for planes (3 hours).
Time costs. The value that users attach to time typically depends on their income and trip purpose. Preference surveys revealed very high value of times for any category of users, typically in the $8–$10 range per hour. These values are not in line with income levels, which are typically at $0.50 to $1.50 per hour. Still, revealed user choices are more compatible with values of time being twice higher than income per hour. While this may be a sign that the slower modes have also lower quality, we take this as our base assumption for further analysis. A similar divergence had been noted in the 1991 Comprehensive Transport Study. We, thus, consider the following four income groups:
Low-income. Average value of time of $0.90 per hour, with 33% of users and the bottom half of the population by having income levels of less than $150 per month.Medium-income. Average value of time of $2.40 per hour, about 53% of users and the next 45% of the population by having income levels of less than $400 per month.High-income. Average value of time of $5.60 per hour, about 12% of users and the next 4% of the population (income less than $750 per month).Very high-income. Average value of time of $11.0 per hour, about 3% of users and the top earning 1% of the population.
Competitiveness on the Yangon–Mandalay corridor. This framework lets us compare the total perceived costs for each category of users. We find that for low-income passengers, bus, car, and railways are equivalent options, and that for medium-income passengers, car and bus are about equivalent. Car is the preferred option for the high-income group. Air is the preferred transport mode for those with very high-income. Very low-income users (i.e., with value of time of $0.50 per hour) would choose rail over bus or river transport. River is not competitive generally on long distances for any category of users.
Car travel is generally the preferred mode of transport for shorter distances, such as less than 400 km for low-income travelers, 700 km for medium-income travelers, and any distance for high-income travelers. Car ownership is a constraint to mode choice: surveys reveals that only about 5% of low-income households own cars, 12% for medium-income ones, 30% for high-income ones, and about 60% for the very-high-income households. This constraint is partly relieved by a common practice of car sharing among low- and medium-income groups (e.g., only 25% of low-income car travelers do actually own a car).
Table 33: Total Perceived User Costs per Passenger Category between Yangon and Mandalay
Distance (km)
User Fares, Tolls, and Fuel Costs
Access and Egress
CostsTotal Trip Time (h)
Time Costs ($) Perceived User Costs ($)
VLI LI MI HI VHI VLI LI MI HI VHICar 640 18 8 4 9 23 48 108 22 26 41 65 125Bus 640 10 2 11 5 12 31 65 146 18 25 44 78 159Rail 610 5 2 18 9 19 52 108 242 17 26 59 115 250River 910 11 1.5 120 60 125 336 698 1,573 73 137 348 710 1,585Air 550 94 7.5 1 0 1 3 6 11 102 102 103 106 112
Notes: h = hour, km = kilometer, VLI = very low-income (value of time = $0.50/hour), LI = low-income (value of time = $1/hour), MI = medium-income (value of time = $2.20), HI = high-income (value of time = $5.50/hour), VHI = very high-income (value of time = $11.00/hour).Source: ADB estimates based on model developed for the study.
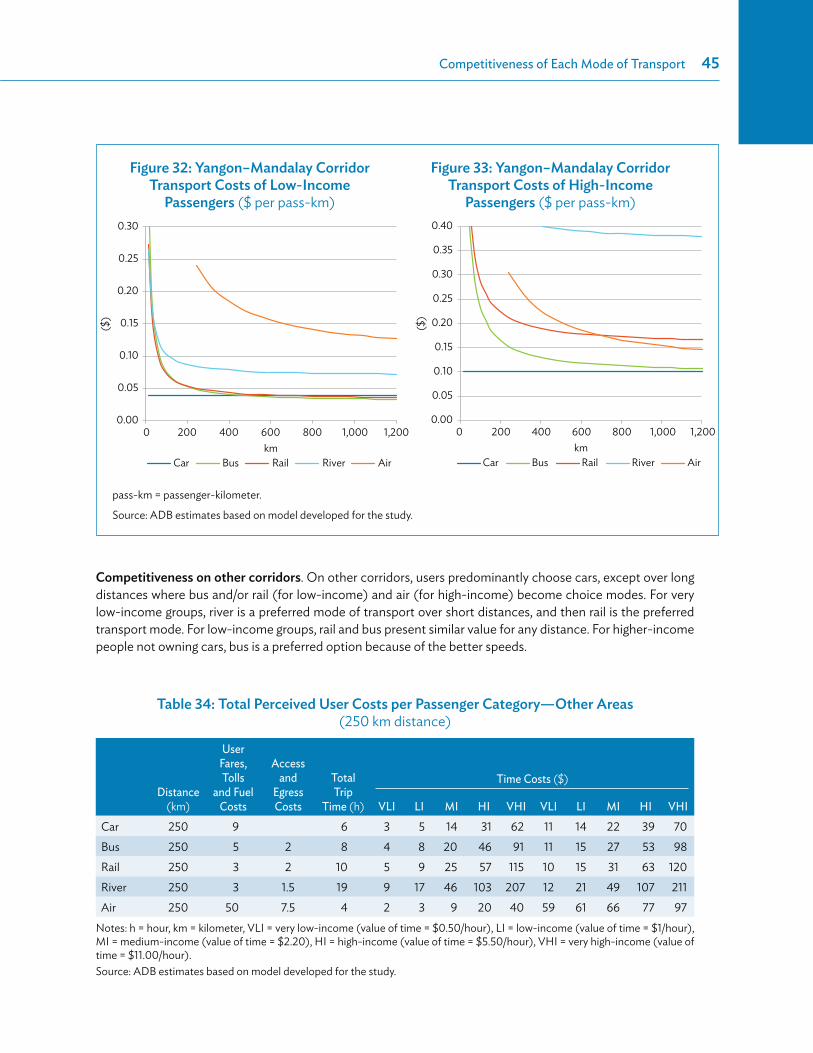
Competitiveness of Each Mode of Transport �45
Competitiveness on other corridors. On other corridors, users predominantly choose cars, except over long distances where bus and/or rail (for low-income) and air (for high-income) become choice modes. For very low-income groups, river is a preferred mode of transport over short distances, and then rail is the preferred transport mode. For low-income groups, rail and bus present similar value for any distance. For higher-income people not owning cars, bus is a preferred option because of the better speeds.
0.00
0.05
0.10
0.15
0.20
0.25
($)
0.30
0 200 400 600 800 1,000 1,200
Car Bus Rail River Airkm
0.00
0.05
0.10
0.15
0.20
0.25
($)
0.30
0.35
0.40
0 200 400 600 800 1,000 1,200
Car Bus Rail River Airkm
Figure 32: Yangon–Mandalay Corridor Transport Costs of Low-Income
Passengers ($ per pass-km)
Figure 33: Yangon–Mandalay Corridor Transport Costs of High-Income
Passengers ($ per pass-km)
pass-km = passenger-kilometer.
Source: ADB estimates based on model developed for the study.
Table 34: Total Perceived User Costs per Passenger Category—Other Areas (250 km distance)
Distance (km)
User Fares, Tolls
and Fuel Costs
Access and
Egress Costs
Total Trip
Time (h)
Time Costs ($)
VLI LI MI HI VHI VLI LI MI HI VHICar 250 9 6 3 5 14 31 62 11 14 22 39 70Bus 250 5 2 8 4 8 20 46 91 11 15 27 53 98Rail 250 3 2 10 5 9 25 57 115 10 15 31 63 120River 250 3 1.5 19 9 17 46 103 207 12 21 49 107 211Air 250 50 7.5 4 2 3 9 20 40 59 61 66 77 97
Notes: h = hour, km = kilometer, VLI = very low-income (value of time = $0.50/hour), LI = low-income (value of time = $1/hour), MI = medium-income (value of time = $2.20), HI = high-income (value of time = $5.50/hour), VHI = very high-income (value of time = $11.00/hour).Source: ADB estimates based on model developed for the study.
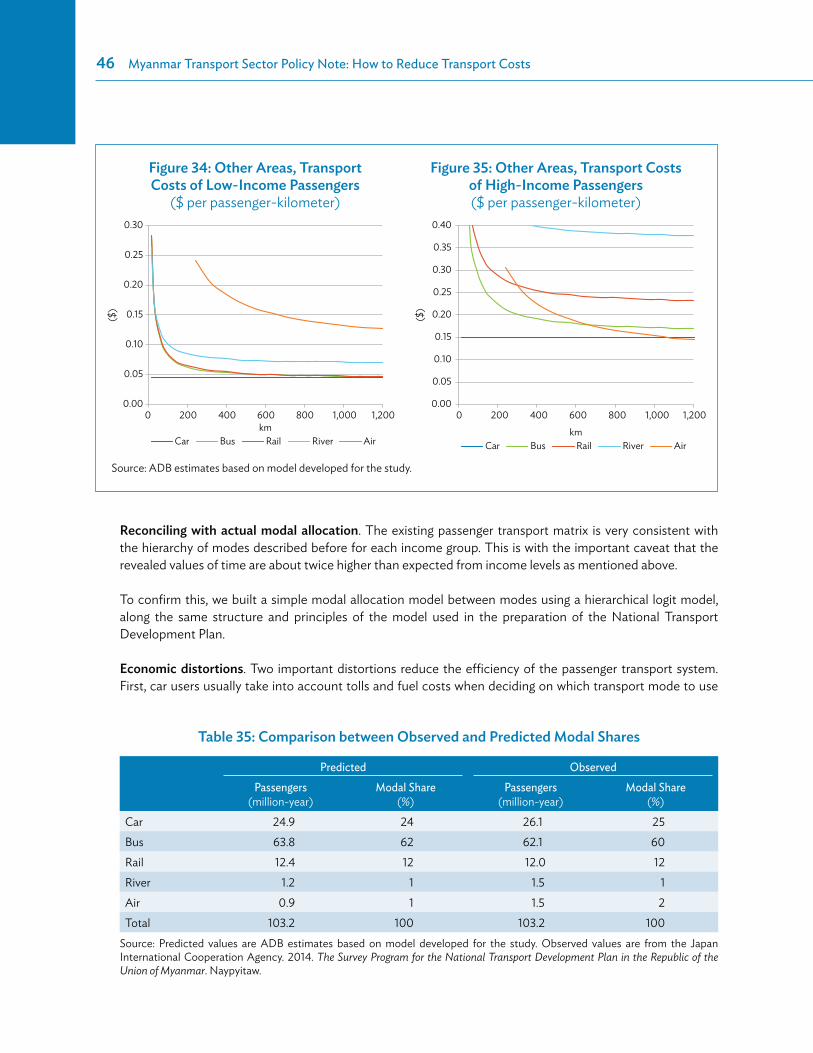
46�Myanmar Transport Sector Policy Note: How to Reduce Transport Costs
Reconciling with actual modal allocation. The existing passenger transport matrix is very consistent with the hierarchy of modes described before for each income group. This is with the important caveat that the revealed values of time are about twice higher than expected from income levels as mentioned above.
To confirm this, we built a simple modal allocation model between modes using a hierarchical logit model, along the same structure and principles of the model used in the preparation of the National Transport Development Plan.
Economic distortions. Two important distortions reduce the efficiency of the passenger transport system. First, car users usually take into account tolls and fuel costs when deciding on which transport mode to use
0.00
0.05
0.10
0.15
0.20
0.25
($)
0.30
0 200 400 600 800 1,000 1,200
Car Bus Rail River Airkm
0.00
0.05
0.10
0.15
0.20
0.25
0.30
0.35
0.40
0 200 400 600 800 1,000 1,200
Car Bus Rail River Airkm
($)
Figure 34: Other Areas, Transport Costs of Low-Income Passengers
($ per passenger-kilometer)
Figure 35: Other Areas, Transport Costs of High-Income Passengers ($ per passenger-kilometer)
Source: ADB estimates based on model developed for the study.
Table 35: Comparison between Observed and Predicted Modal Shares
Predicted ObservedPassengers
(million-year) Modal Share
(%)Passengers
(million-year) Modal Share
(%)Car 24.9 24 26.1 25Bus 63.8 62 62.1 60Rail 12.4 12 12.0 12River 1.2 1 1.5 1Air 0.9 1 1.5 2Total 103.2 100 103.2 100
Source: Predicted values are ADB estimates based on model developed for the study. Observed values are from the Japan International Cooperation Agency. 2014. The Survey Program for the National Transport Development Plan in the Republic of the Union of Myanmar. Naypyitaw.
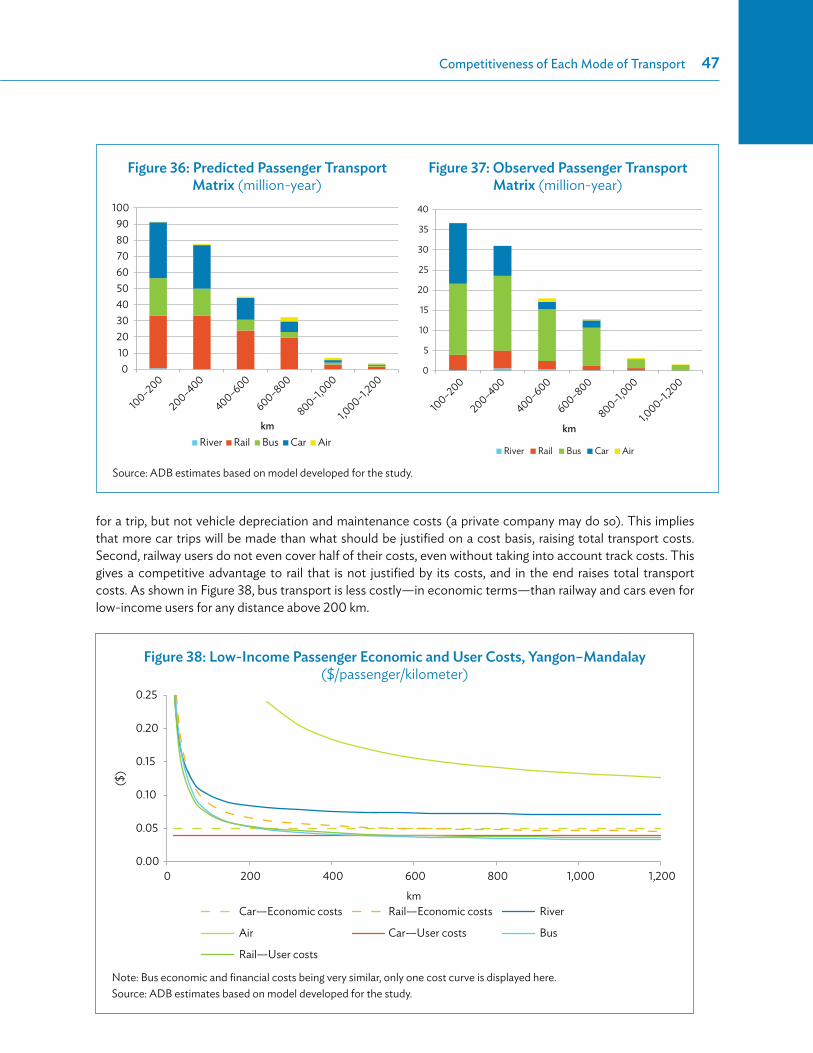
Competitiveness of Each Mode of Transport �47
for a trip, but not vehicle depreciation and maintenance costs (a private company may do so). This implies that more car trips will be made than what should be justified on a cost basis, raising total transport costs. Second, railway users do not even cover half of their costs, even without taking into account track costs. This gives a competitive advantage to rail that is not justified by its costs, and in the end raises total transport costs. As shown in Figure 38, bus transport is less costly—in economic terms—than railway and cars even for low-income users for any distance above 200 km.
0
100–200
200–400
400–600
600–800
800–1,000
1,000–1,2
00
102030405060708090
100
River Rail Bus Car Airkm
100–200
200–400
400–600
600–800
800–1,000
1,000–1,2
000
5
10
15
20
25
30
35
40
River Rail Bus Car Air
km
Figure 36: Predicted Passenger Transport Matrix (million-year)
Figure 37: Observed Passenger Transport Matrix (million-year)
Source: ADB estimates based on model developed for the study.
Figure 38: Low-Income Passenger Economic and User Costs, Yangon–Mandalay ($/passenger/kilometer)
0.00
0.05
0.10
0.15
0.20
0.25
0 200 400 600 800 1,000 1,200
Car—Economic costs Rail—Economic costs River
Air Car—User costs Bus
Rail—User costs
km
($)
Note: Bus economic and financial costs being very similar, only one cost curve is displayed here. Source: ADB estimates based on model developed for the study.

48
6 Outlook and Benefits from Operational Improvements and Policy Reforms
6.1 Analysis FrameworkTransport model. We built a simplified multimodal transport model to understand the underlying trends behind transport modal shares, and identify the likely benefits from priority medium-term policy measures or
Key FindingsMyanmar’s transport costs, at $4.8 billion annually, are low. While passenger mobility seems high, freight movements are about 3–5 times fewer than in other countries. We estimate that demand will grow strongly in the coming 15 years, potentially increasing by 300%.
The market share of passenger railways could become marginal if the rail system is not improved. Without improvement, rail share could be just 2%–4% in the passenger market by 2030. This is because as incomes rise, people will increasingly prefer faster transport modes and private cars.
We suggest launching a 5-Year Modernization Program of the Transport System. This program would combine policy reforms, investments in critical infrastructure, and institutional restructuring. Our suggested investment programs and policy measures are as follows:
Measure 1: Allow trucks on Yangon–Mandalay expressway.Measure 2: Improve the Greater Mekong Subregion (GMS) North Road corridor to the PRC.Measure 3: Improve the GMS East–West Road corridor to Thailand.Measure 4: Rehabilitate and/or pave with asphalt concrete the next 3,000 kilometers (km) highways with the highest traffic.Measure 5: Widen selectively about 1,000 km of narrow trunk highways.Measure 6: Improve the Yangon–Mandalay rail line.Measure 7: Rehabilitate selectively secondary rail lines.Measure 8: Develop rail freight.Measure 9: Improve Ayeyarwaddy riverbed and navigation conditions up to Mandalay.Measure 10: Develop river ports with mechanized loading.Measure 11: Increase legal axle loading.Measure 12: Improve the efficiency of the road user charging system.Measure 13: Reduce road accident rate.
This program would cost $6 billion, lower Myanmar’s transport costs by 29%, generate $84 billion in savings over 15 years, and increase Myanmar’s potential gross domestic product by $40 billion annually by 2030. It would give rail and river transport solid markets to develop sustainably.
Note: this program does not include rural road and urban transport, which are the object of separate policy notes.

Outlook and Benefits from Operational Improvements and Policy Reforms�49
types of investments recommended in other parts of this report. This is not a full-blown transport model. It was developed on a spreadsheet software. The basic elements of the model are the following:
Demand matrix. The model relies on a stripped-down version of the transport origin and/or destination matrix developed for the National Transport Development Plan. It does not attempt to model further traffic generation and distribution, but concentrates on modal split and transport costs. Two submodels are developed for the Yangon–Mandalay corridor9 and other areas. A very simplified zoning10 is used for freight on the Yangon–Mandalay corridor. For other areas and for passengers, the model aggregates demand for six distance ranges (i.e., 150 kilometers [km], 300 km, 500 km, 700 km, 900 km, and 1,100 km). The behavior or users in each of these categories is then analyzed.Transport costs. The cost curves established in the previous section are used to determine economic costs and perceived user costs. These include access and egress costs, and values of time. Road economic costs are determined using HDM-IV, depending on the average roughness of the highways and vehicles, and fares are based on actual amounts. Four categories of passengers are considered (low-income, medium-income, high-income and very high-income) and three categories of commodities (low-value, medium-value, and high-value). All cost and user parameters are derived by data analysis of the master plan survey data.11
Modal split. The model allocates freight volumes to the mode of transport (rail, road, river), which offers the least total transport cost for each category of distance, considering three categories of commodities (low-value, medium-value, and high-value) using an all-or-nothing approach.12 On the Yangon–Mandalay corridor, actual distances using the main road, rail, or river links for each mode of transport are used to determine the cheapest available mode between two zones. Since Myanma Railways policy has been to limit rail freight, the model is artificially constrained to fit the observed transport volumes. For passengers, the model also allocates traffic in function of total user costs for each user category—employing the hierarchical logit model described in the previous section and utilized in the master plan. The modal split is validated by comparing its predictions with the actual transport modal share by distance on the Yangon–Mandalay corridor and other corridors. The fit is generally good (i.e., total modal shares are 95% accurate, and the model generally correctly replicates modal split for each distance range and area).Forecasting. The model can be run for future years. The main parameters are the same as the National Transport Development Plan—an economic growth rate of 7% annually, a population growth rate of 1% annually, and elasticity of demand of 1.2 on the Yangon–Mandalay corridor and of 1.0 in other areas. We note that this leads to a high personal mobility by 2030 of Myanmar’s population, with about 4.5 long-distance trips per person, close to that of a developed country (baseline 2 is trips per person in 2013). The model forecasts changes in the distribution of the population by income group, and in average values of time by group, as the average gross domestic product (GDP) per capita rises using a fitted log-normal distribution of incomes. Car ownership is assumed simply to follow the changes in the distribution. Except for total transport volumes and value of time, no other adjustments are made to the parameters of the model. We do not model traffic generation—i.e., the impact on overall demand of a reduction in transport costs or
9 We include for the analysis the central North–South corridor (segments Yangon–Bago–Taungoo–Naypyitaw–Meiktila–Mandalay), and
the western North–South corridor (segments Yangon–Hinthada–Pyay–Magway–Pakokku–Mandalay). 10 This covers Yangon, Pyay, Magway, Bago, Naypyitaw, and Mandalay, which are the main points of origin and/or destination on the
corridor.11 This includes (i) cargo owners and cost structure surveys; (ii) roadside traffic counts and passenger car interviews; (ii) bus, rail, port, rest
areas, and airport terminal traffic counts and interviews; and (iv) freight terminal and roadside truck driver interviews. All were carried
out in early 2013.12 A standard hierarchical logit model, as used for the transport master plan, can replicate the current freight modal split in Myanmar but
cannot accurately model it because the importance of nonprice factors becomes excessive.

50�Myanmar Transport Sector Policy Note: How to Reduce Transport Costs
rates. We also do not attempt to model changes in the distribution of demand between origins and destinations but consider it fixed. This is not considered a major problem since this is a long-distance transport model where origins and destinations are largely imposed.Outputs. The model’s main outputs are modal shares, unit costs, and total transport costs. This data can be differentiated by corridor (Yangon–Mandalay and other areas), for passenger and/or freight, and by mode of transport. Because of the uncertainty over values of time, the model produces estimates of total vehicle operating costs—only considering the long distance trips, and of total transport costs—including value of time and access and/or egress costs. These are economic costs, not financial ones (modal allocation relies on perceived costs).Testing. It is possible to input policy options in the model, e.g., changes in road roughness, vehicle speeds, freight loading speed, river depth and availability, user taxes, axle loading, and waiting times. These changes modify the user cost curves, affecting perceived costs and modal allocation. The model predicts the economic benefit of the changes (which may be brought about by investments or policy reforms) for various years, and by comparing them with the associated costs, gives rough estimates of the economic viability (we compute benefit-to-cost ratio for a 15-year period using a 12% discount rate).
6.2 Baseline and Outlook without ImprovementsCosts of transport in Myanmar in 2013. We estimate that long-distance transport costs for Myanmar are about $2.5 billion annually in directs costs ($1.1 billion for freight, and $1.3 billion for passengers), which is 4.2% of Myanmar’s GDP. If including time costs at the level people value them and handling and access costs, the total cost reaches $4.8 billion ($1.2 billion for freight and $3.6 billion for passengers), which is 8.0% of Myanmar’s GDP (Figure 42).
Myanmar seems particularly to move few goods for an economy of its size: Myanmar’s freight transport costs are 2.3% of GDP, while transport costs are 5.3% of GDP for the United States, 6.75% of GDP for South Africa, 9.5% of GDP for Brazil, and 12% of GDP for Indonesia. Freight rates being within the same range as in these comparator countries, Myanmar’s economy likely moves 2.5–5.0 times less goods per unit of GDP than what would be expected. This has links with the structure of Myanmar’s economy, e.g., a history of local self-sufficiency, limited economic exchanges with other countries, low manufacturing base (and construction effort), and a lack of the type of mining products consuming much long-distance transport, such as coal or ore.
Table 36: Passenger Transport Costs and Modal Shares, 2013
Trunk Corridor Other Corridors Total
PassengerVolume (million)
Share (%)
VOCs ($)
All Costs
($)Volume (million)
Share (%)
VOCs ($)
All Costs
($)Volume (million)
Share (%)
VOCs ($)
All Costs
($)Car 14.3 22.1 311 534 10.6 27.6 334 645 24.9 24.2 645 1,179 Bus 43.8 67.7 311 1,132 20.0 51.9 201 800 63.8 61.8 511 1,932 Rail 6.0 9.3 31 126 6.3 16.5 55 187 12.4 12.0 86 314 River 0.4 0.7 1 12 0.7 1.9 1 12 1.2 1.1 2 24 Air 0.1 0.1 6 9 0.8 2.1 84 119 0.9 0.9 89 129 Total 64.6 100.0 659 1,812 38.5 100.0 674 1,765 103.2 100.0 1,333 3,577
VOC = vehicle operating costs.Source: ADB estimates based on model developed for the study.

Outlook and Benefits from Operational Improvements and Policy Reforms�51
Table 37: Freight Transport Costs and Modal Shares, 2013
Trunk Corridor Other Corridors Total
FreightVolume (million)
Share (%)
VOCs ($)
All Costs
($)Volume (million)
Share (%)
VOCs ($)
All Costs
($)Volume (million)
Share (%)
VOCs ($)
All Costs
($)Truck 42.9 92.6 520 541 19.8 88.9 505 538 62.7 91.4 1,025 1,079 Rail 1.7 3.6 39 47 1.3 5.8 25 36 2.9 4.3 64 83 River 1.8 3.8 28 37 1.2 5.3 5 13 2.9 4.3 33 50 Total 46.3 100.0 587 625 22.2 100.0 535 587 68.6 100.0 1,122 1,213
VOC = Vehicle operating costs.
Source: ADB estimates based on model developed for the study.
Figure 39: Myanmar’s Long-Distance Transport Costs ($ million)
Total: $4.8 billion
Freight$1.2 billion
1,080 1,200
1,930310 25
130
85 50
River River AirRail RailBusCarRoad
Passengers$3.6 billion
Other costs (time, access, terminal)
Vehicle operating costs
Source: ADB estimates based on model developed for the study.
Outlook with no operational improvements or policy reforms. The model forecasts a sustained increase in freight and passenger transport volumes at an average rate of 7.9% (8.4% on the Yangon–Mandalay corridor, and 7% on other corridors (Table 38 and Table 39). By 2030, Myanmar’s transport system would move 376 million long-distance passengers and 270 million tons. There is a possibility for freight transport to increase faster, if Myanmar’s economy changes its structure.
For passengers, this increase would mainly benefit the road and air modes, which will become more attractive as users’ incomes and values of time rise (Figure 40 and Figure 41). By 2030, car travel would account for 42% of all trips (11.5% annual growth rate) and bus would take a 45% modal share (6% annual growth rate). Air transport would develop quickly (22% annual growth rate). This would be particularly outside of the Yangon–Mandalay corridor where it would then account for 20% of all long-distance trips,

52�Myanmar Transport Sector Policy Note: How to Reduce Transport Costs
12.4 12.5
12.8
13.3
14.2 12% 10%
7%
5% 4%
0
2
4
6
8
10
(%)
12
14
0
50
100
150
200
250
300
350
400
2013 2015 2020 2025 2030
Car Bus
Rail River
Air Rail modal share
3.5 3.4
3.0
2.7
2.6 10%
8%
5%
3%2%
0
2
4
6
(%)
8
10
12
0
20
40
60
80
100
120
140
2013 2015 2020 2025 2030
Car Bus
Rail River
Air Rail modal share
Figure 40: Passenger Transport Volumes (million passengers/year)
Figure 41: Passenger Transport Production (million passenger-km/ year)
km = kilometer.Source: ADB estimates based on model developed for the study.
Table 39: Long-Distance Transport Volumes (million tons/year)
2013 2015 2020 2025 2030Yangon-Mandalay corridor 46.3 54.4 81.5 122.0 182.6Other areas 22.2 26.1 39.1 58.6 87.7Total 68.6 80.6 120.6 180.5 270.2
Source: ADB estimates based on model developed for the study.
Table 38: Long-Distance Transport Volumes (million passengers/year)
2013 2015 2020 2025 2030Yangon-Mandalay corridor 64.6 76.0 113.7 170.2 254.7Other areas 38.5 44.1 61.8 86.7 121.7Total 103.2 120.1 175.5 256.9 376.4
Source: ADB estimates based on model developed for the study.
where the speed advantage over road or rail is the clearer. Passenger rail would suffer a long decline. Traffic volumes would increase at 0.8% annually, but average distances would fall, so that the total passenger-km by railway would drop by 25% by 2030. Rail transport’s market share would collapse to 4% (by volume, 2% by passenger-km).
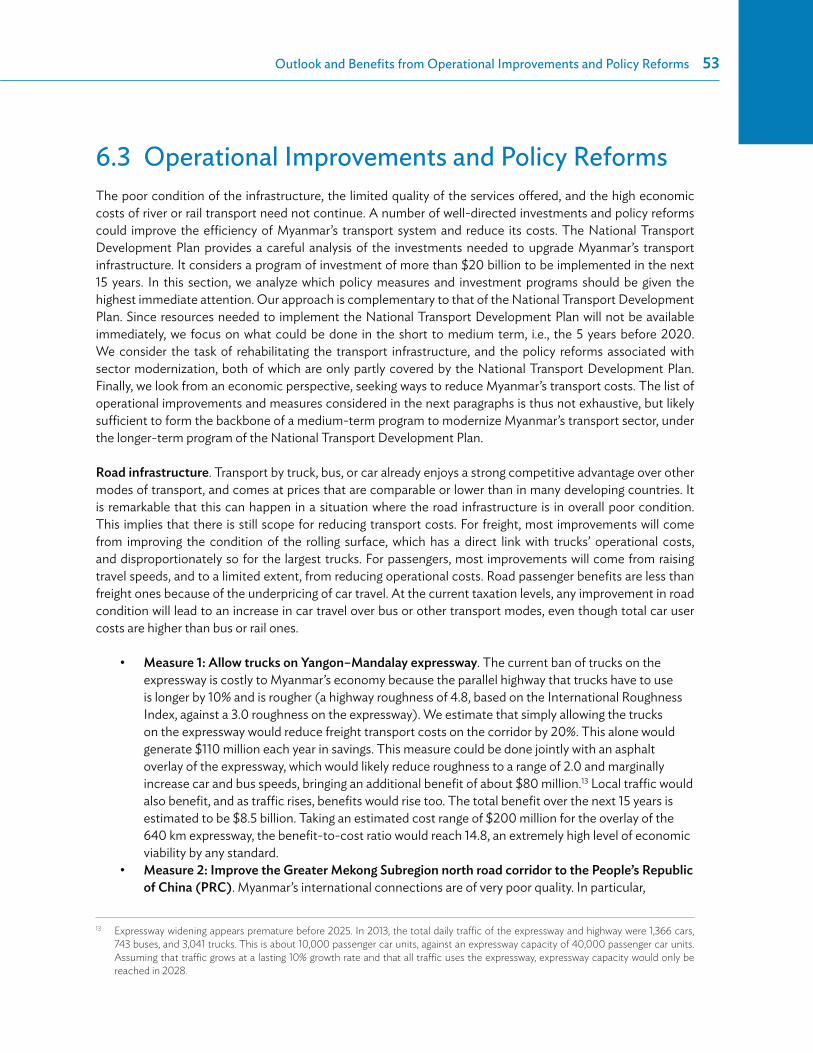
Outlook and Benefits from Operational Improvements and Policy Reforms�53
6.3 Operational Improvements and Policy ReformsThe poor condition of the infrastructure, the limited quality of the services offered, and the high economic costs of river or rail transport need not continue. A number of well-directed investments and policy reforms could improve the efficiency of Myanmar’s transport system and reduce its costs. The National Transport Development Plan provides a careful analysis of the investments needed to upgrade Myanmar’s transport infrastructure. It considers a program of investment of more than $20 billion to be implemented in the next 15 years. In this section, we analyze which policy measures and investment programs should be given the highest immediate attention. Our approach is complementary to that of the National Transport Development Plan. Since resources needed to implement the National Transport Development Plan will not be available immediately, we focus on what could be done in the short to medium term, i.e., the 5 years before 2020. We consider the task of rehabilitating the transport infrastructure, and the policy reforms associated with sector modernization, both of which are only partly covered by the National Transport Development Plan. Finally, we look from an economic perspective, seeking ways to reduce Myanmar’s transport costs. The list of operational improvements and measures considered in the next paragraphs is thus not exhaustive, but likely sufficient to form the backbone of a medium-term program to modernize Myanmar’s transport sector, under the longer-term program of the National Transport Development Plan.
Road infrastructure. Transport by truck, bus, or car already enjoys a strong competitive advantage over other modes of transport, and comes at prices that are comparable or lower than in many developing countries. It is remarkable that this can happen in a situation where the road infrastructure is in overall poor condition. This implies that there is still scope for reducing transport costs. For freight, most improvements will come from improving the condition of the rolling surface, which has a direct link with trucks’ operational costs, and disproportionately so for the largest trucks. For passengers, most improvements will come from raising travel speeds, and to a limited extent, from reducing operational costs. Road passenger benefits are less than freight ones because of the underpricing of car travel. At the current taxation levels, any improvement in road condition will lead to an increase in car travel over bus or other transport modes, even though total car user costs are higher than bus or rail ones.
Measure 1: Allow trucks on Yangon–Mandalay expressway. The current ban of trucks on the expressway is costly to Myanmar’s economy because the parallel highway that trucks have to use is longer by 10% and is rougher (a highway roughness of 4.8, based on the International Roughness Index, against a 3.0 roughness on the expressway). We estimate that simply allowing the trucks on the expressway would reduce freight transport costs on the corridor by 20%. This alone would generate $110 million each year in savings. This measure could be done jointly with an asphalt overlay of the expressway, which would likely reduce roughness to a range of 2.0 and marginally increase car and bus speeds, bringing an additional benefit of about $80 million.13 Local traffic would also benefit, and as traffic rises, benefits would rise too. The total benefit over the next 15 years is estimated to be $8.5 billion. Taking an estimated cost range of $200 million for the overlay of the 640 km expressway, the benefit-to-cost ratio would reach 14.8, an extremely high level of economic viability by any standard.Measure 2: Improve the Greater Mekong Subregion north road corridor to the People’s Republic of China (PRC). Myanmar’s international connections are of very poor quality. In particular,
13 Expressway widening appears premature before 2025. In 2013, the total daily traffic of the expressway and highway were 1,366 cars,
743 buses, and 3,041 trucks. This is about 10,000 passenger car units, against an expressway capacity of 40,000 passenger car units.
Assuming that traffic grows at a lasting 10% growth rate and that all traffic uses the expressway, expressway capacity would only be
reached in 2028.
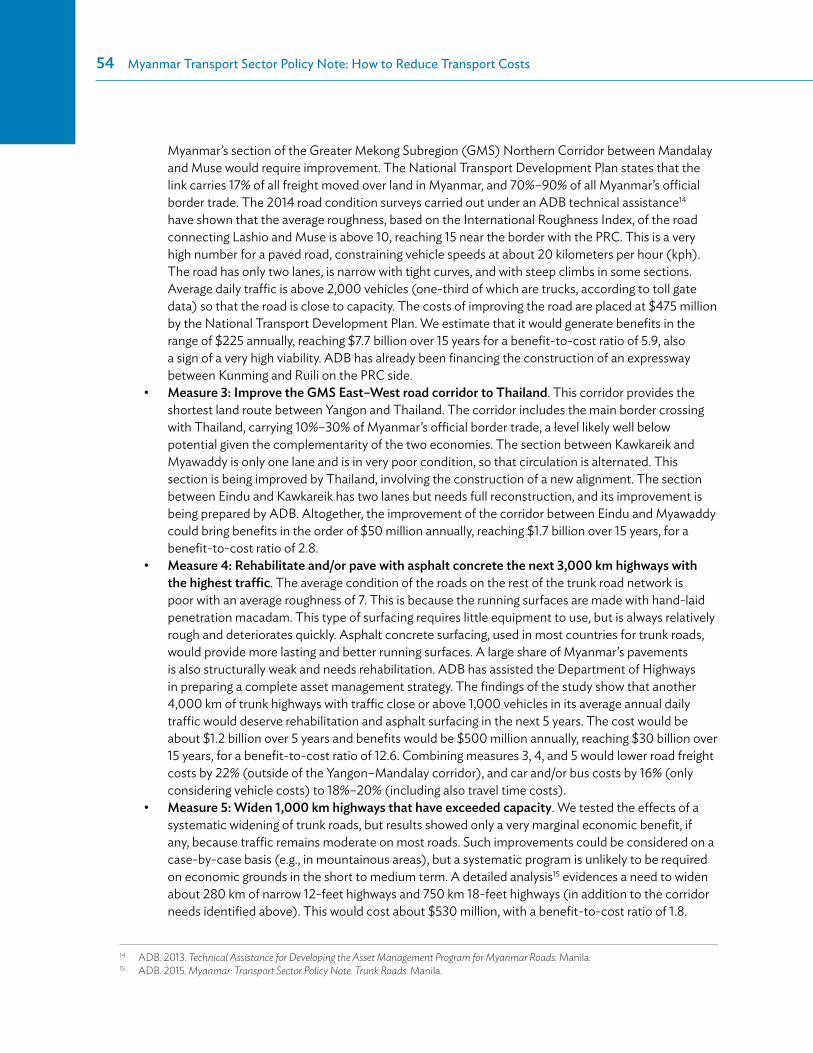
54�Myanmar Transport Sector Policy Note: How to Reduce Transport Costs
Myanmar’s section of the Greater Mekong Subregion (GMS) Northern Corridor between Mandalay and Muse would require improvement. The National Transport Development Plan states that the link carries 17% of all freight moved over land in Myanmar, and 70%–90% of all Myanmar’s official border trade. The 2014 road condition surveys carried out under an ADB technical assistance14 have shown that the average roughness, based on the International Roughness Index, of the road connecting Lashio and Muse is above 10, reaching 15 near the border with the PRC. This is a very high number for a paved road, constraining vehicle speeds at about 20 kilometers per hour (kph). The road has only two lanes, is narrow with tight curves, and with steep climbs in some sections. Average daily traffic is above 2,000 vehicles (one-third of which are trucks, according to toll gate data) so that the road is close to capacity. The costs of improving the road are placed at $475 million by the National Transport Development Plan. We estimate that it would generate benefits in the range of $225 annually, reaching $7.7 billion over 15 years for a benefit-to-cost ratio of 5.9, also a sign of a very high viability. ADB has already been financing the construction of an expressway between Kunming and Ruili on the PRC side.Measure 3: Improve the GMS East–West road corridor to Thailand. This corridor provides the shortest land route between Yangon and Thailand. The corridor includes the main border crossing with Thailand, carrying 10%–30% of Myanmar’s official border trade, a level likely well below potential given the complementarity of the two economies. The section between Kawkareik and Myawaddy is only one lane and is in very poor condition, so that circulation is alternated. This section is being improved by Thailand, involving the construction of a new alignment. The section between Eindu and Kawkareik has two lanes but needs full reconstruction, and its improvement is being prepared by ADB. Altogether, the improvement of the corridor between Eindu and Myawaddy could bring benefits in the order of $50 million annually, reaching $1.7 billion over 15 years, for a benefit-to-cost ratio of 2.8.Measure 4: Rehabilitate and/or pave with asphalt concrete the next 3,000 km highways with the highest traffic. The average condition of the roads on the rest of the trunk road network is poor with an average roughness of 7. This is because the running surfaces are made with hand-laid penetration macadam. This type of surfacing requires little equipment to use, but is always relatively rough and deteriorates quickly. Asphalt concrete surfacing, used in most countries for trunk roads, would provide more lasting and better running surfaces. A large share of Myanmar’s pavements is also structurally weak and needs rehabilitation. ADB has assisted the Department of Highways in preparing a complete asset management strategy. The findings of the study show that another 4,000 km of trunk highways with traffic close or above 1,000 vehicles in its average annual daily traffic would deserve rehabilitation and asphalt surfacing in the next 5 years. The cost would be about $1.2 billion over 5 years and benefits would be $500 million annually, reaching $30 billion over 15 years, for a benefit-to-cost ratio of 12.6. Combining measures 3, 4, and 5 would lower road freight costs by 22% (outside of the Yangon–Mandalay corridor), and car and/or bus costs by 16% (only considering vehicle costs) to 18%–20% (including also travel time costs).Measure 5: Widen 1,000 km highways that have exceeded capacity. We tested the effects of a systematic widening of trunk roads, but results showed only a very marginal economic benefit, if any, because traffic remains moderate on most roads. Such improvements could be considered on a case-by-case basis (e.g., in mountainous areas), but a systematic program is unlikely to be required on economic grounds in the short to medium term. A detailed analysis15 evidences a need to widen about 280 km of narrow 12-feet highways and 750 km 18-feet highways (in addition to the corridor needs identified above). This would cost about $530 million, with a benefit-to-cost ratio of 1.8.
14 ADB. 2013. Technical Assistance for Developing the Asset Management Program for Myanmar Roads. Manila.15 ADB. 2015. Myanmar: Transport Sector Policy Note. Trunk Roads. Manila.

Outlook and Benefits from Operational Improvements and Policy Reforms�55
Railway infrastructure and services. Transport by railways is constrained by Myanma Railways’ de facto strategic positioning on the transport of low-income passengers at a low level of quality, with low fares and high public subsidies. Improving the competitiveness of passenger railways requires raising traffic speeds closer or above that of competition (bus and/or road), while reducing operational costs. As discussed in the sections on costs and competitiveness, freight is an area where rail could catch a significant share of the market—but also after investments to reduce operational costs.
Measure 6: Improve the Yangon–Mandalay rail line. The Yangon–Mandalay line carries half of Myanma Railways’ long-distance passengers and most of its freight. It is the backbone of Myanmar’s rail network. The size and the distance between the cities it serves (Bago, Mandalay, Naypyitaw, and Yangon) make this corridor ideal for rail transport. With assistance from the Japan International Cooperation Agency, the government is rehabilitating and improving this dual track rail line, at a cost estimated to be $1.75 billion. Planning documents contemplate a commercial speed of 85 kph (60 miles/hour). The railway could catch up to half of the market, if the fares are not increased (85 million passengers by 2025), and one-third of the market (50 million passengers by 2025) if they increase moderately. Benefits would be in the range of $450 million annually. At this speed, capturing 50% of the passenger market (85 million passengers by 2025) may become possible if fares are not increased. The benefit-to-cost ratio would be high for an investment of this scale, at 2.9. Our model shows that operational speeds are key to the viability of the investment. A moderately lower commercial speed of 65 kph (also quoted in some documents) would prevent the railway from overtaking cars and buses. The market share would be smaller and the investment would then be just marginally economically viable.Measure 7: Selectively rehabilitate secondary rail lines. About 1,500 km of secondary rail lines carry more than 1 million passengers annually (e.g., Yangon–Pyay, Naypyitaw–Chauk, Bago-Mawlamyine, and Mandalay–Miytkina). We considered the impact of their rehabilitation, assuming that traffic speeds could be raised on average to 50 kph for passenger trains. The overall benefit of such improvements is estimated to be in the range of $150 million, but it would decrease over time, as road travel becomes an increasingly preferred option due to higher speeds. Because of this effect, the benefit-to-cost ratio is only 0.8, assuming a cost per km of $500,000. This level is just below our viability threshold. While some secondary lines could deserve rehabilitation, a case-by-case approach is needed to ensure economic viability.Measure 8: Develop rail freight. Rail freight has been constrained by current operational practices favoring passenger transport, lack of investments in rolling stock, and manual loading. We simulate the impact of a new policy to develop rail freight, by removing the model’s constraints on freight and reducing its operational costs through use of mechanical loading, shorter turnover, and new rolling stock. We estimate that rail freight could capture a share of the market comprised between 7% and 15%, putting its potential market by 2025 between 12.5 and 27 million tons of commercial freight—a scale jump from the 2013 levels (1 million ton). This improvement would only moderately reduce Myanmar’s transport costs by $40 million annually, a total benefit of $2.3 billion over 15 years. However, costs would likely be small. Assuming that initial investments in rolling stock and facilities would reach $100 million, the benefit-to-cost ratio of this measure would be 8.2, showing robust viability.
Altogether, these measures reduce the costs of passenger rail by 37%, and of freight by 40%.
River infrastructure and services. River transport in Myanmar has low cost, but is not as inexpensive as observed in other countries, where it is by far the cheapest transport mode. Several factors strongly constrain river transport efficiency. Navigation conditions restrict the use of most vessels, except the smaller ones,
56�Myanmar Transport Sector Policy Note: How to Reduce Transport Costs
to about 70% of the year on the segment between Yangon and Mandalay, and the lack of a defined channel limit operational speeds. The absence of port facilities (i.e., only beach landing with planks) makes loading and unloading operations very slow, and creates long waiting times in port. These two factors lead to a low vessel utilization, and prevent the use of large vessels (which are more strongly penalized). Large reductions in costs seem therefore possible, but the small size of the potential market limits the scale of investments that would be economically viable.
Measure 9: Improve Ayeyarwaddy riverbed and navigation conditions up to Mandalay. With the assistance of the World Bank, Myanmar has started a program of moderate improvements of the Ayeyarwaddy navigation channel, to bring its minimum depth to about 2 meters on the section between Bagan and Mandalay, and introduce modern navigation facilities on the entire segment between Yangon and Mandalay. Our model estimates that this program would raise the increase the share of the year the river can be navigated from 70%–75% to 92%–100% depending on the vessel class. Better navigation marks would raise speeds (we consider an average speed of 18 kph instead of 5 kph based on navigation speeds on the Rhine for bulk vessels), and in the long term, enable longer navigation hours (we consider an increase from 12 hours to 18 hours a day). Altogether, the annual benefit would reach $80 million annually, and $3.1 billion over 15 years. We assume that the initial costs for such small improvements would only be in the range of $100 million, implying that the benefit-to-cost ratio would reach 11. Measure 10: Develop river ports with mechanized loading. Mechanized loading in river ports would reduce loading and unloading times by 40%, and reduce waiting times. This would have a major effect on utilization rates, enabling the use of larger vessels or barges, of 500–1,000 tons. Because most river landing areas are only beaches, this could be implemented only in a few ports (Yangon, Mandalay, and maybe Pyay, Magway, Pakokku, and Monywa). The annual benefit would be in the range of $20 million annually, and $700 million over 15 years. Assuming a cost of $100 million for this program, the benefit-to-cost ratio would reach 2.5.
Altogether, this set of investments slash river transport costs by almost a factor three (–64%). With such a drastic reduction in costs, river transport could capture up to 18% of the freight market, moving about 30 million tons annually on the Ayeyarwaddy by 2025.
Policy measures. Changes in the sector’s policies and regulations can also lead to lesser transport costs, by affecting utilization rates, orienting demand through taxes, or reducing externalities through regulations.
Measure 11: Increase legal axle loading. The allowed maximum axle load is 10 tons, which is low in comparison with developed countries. A recent study in India showed that a legal axle load of 11–13 tons was optimal in reducing user costs at the price of a modest increase in road agency maintenance costs.16 We simulate the impact of an increase by 15% of the legal axle load, specifically benefiting large trucks, bringing Myanmar’s standards in line with European ones (11.5 tons per axle). This alone would reduce Myanmar’s road freight transport costs by 13% for an annual benefit of $75 million, reaching $2.75 billion over 15 years. Higher loading would require stronger pavements. An increase by 15% of the standard axle load would raise the total loading damage from trucks by 75%. However, a moderate increase in pavement thickness (during improvements and rehabilitation) would be sufficient to address the increased stress. We estimate that this would raise pavement rehabilitation costs by 10% and new road investment and reconstruction by only 5%.
16 World Bank. 2005. India Road Transport Service Efficiency Study. Washington, DC.

Outlook and Benefits from Operational Improvements and Policy Reforms�57
Considering merely the road investments described in the earlier section, the total cost comes only to $260 million, for a benefit-to-cost ratio of 3.8.Measure 12: Improve the efficiency of the road user charging system. A separate note on the road user charging system argues for an increase in road tolls on vehicles, particularly cars, and to a lesser extent, buses, and introducing a fuel tax at a rate of 10 cents per liter and an axle loading tax.17 The effect of these measures on the transport matrix is moderate but positive (it reduces by car demand 5%–10% and shifts it to bus and railways, and it increases the share of heavy trucks in road transport). The model estimates benefits to be $70 million annually, reaching $3.1 billion over 15 years, not including positive impacts on reduced transport externalities. Measure 13: Reduce road accident rate. This last measure is not a product of the model, but we thought it was meaningful to include it so that its benefits could be weighed in parallel to that of other policy measures. Myanmar’s road accident rate is very high, and total road safety costs to the economy were estimated to be $800 million annually in 2013 (see note on road user charging system).18 A 20% reduction in road accident rate would bring an annual benefit of $160 million. This benefit would rise faster than demand because the value of life is typically assumed to rise in line with GDP per capita. Altogether, the benefit over 15 years of a set of policy, regulatory measures, or investments reducing accident rates in such proportion is $5.7 billion. More importantly, such policy would save 40,000 lives over 15 years.
Cost reduction. Altogether, the operational improvements and policy measures described above reduce Myanmar’s total transport costs by 29%. Annual benefits would be about $1.9 billion annually, reaching $5 billion by 2025. Freight transport costs are reduced by 36%, and passenger transport costs are reduced by 20%. The benefits associated with these reductions are $84 billion over 15 years ($30 billion when discounted at a 12% rate). Table 40 and shows the relative benefits of each measure on Myanmar’s transport costs.
17 ADB. 2015. Myanmar: Transport Sector Policy Note. Review of Road User Charges. Manila.18 Footnote 17.
Table 40: Reducing Myanmar’s Transport Costs: Benefits of Selected Measures ($ million)
Cost
Economic Benefits
NPV (at 12%)
NPV / Cost
Annual 2013
Annual 2025
Total 2015–2030
Allow trucks on the expressway 200 190 620 8,540 2,960 14.8Improve the Northern corridor to the PRC 480 225 550 7,700 2,830 5.9Improve the East–West corridor to Thailand 230 50 120 1,700 650 2.8Rehabilitate to AC 3,000 km highways 1,200 510 2,200 30,200 9,960 8.3Widen 1,000 km of narrow highways 520 100 230 2,400 940 1.8Total 2,630 770 2,570 50,600 17,340 6.6Railway Investments Improve Yangon–Mandalay railway line 1,800 440 960 13,700 5,220 2.9Rehabilitate 2,000 km secondary rail lines 1,000 140 100 1,800 800 0.8Develop rail freight 100 60 160 2,300 820 8.2Total Railway 2,900 640 1,230 17,780 6,840 2.3
continued on next page
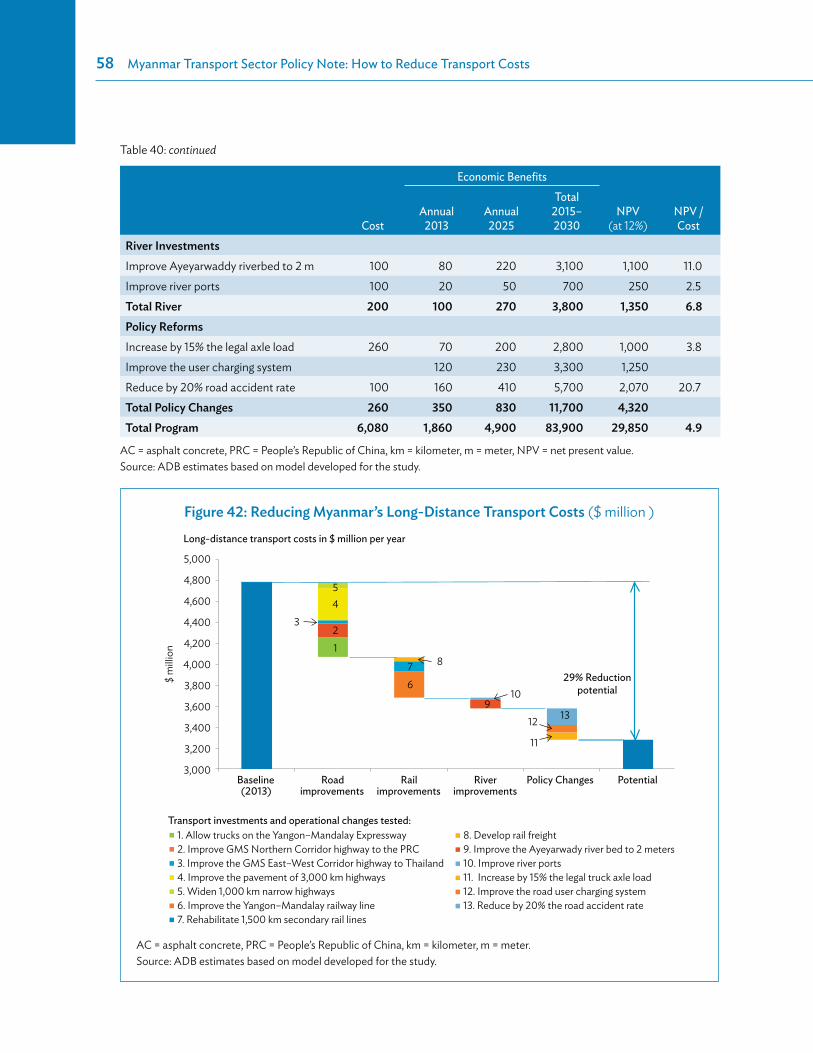
58�Myanmar Transport Sector Policy Note: How to Reduce Transport Costs
Figure 42: Reducing Myanmar’s Long-Distance Transport Costs ($ million )
5,000
4,800
4,600
4,400
4,200
4,000
3,800
3,600
3,400
3,200
3,000Baseline Road
54
321
8
910
12
11
13
76
improvements(2013) improvements improvementsRail River Policy Changes Potential
29% Reductionpotential
$ m
illion
Long-distance transport costs in $ million per year
1. Allow trucks on the Yangon–Mandalay Expressway2. Improve GMS Northern Corridor highway to the PRC3. Improve the GMS East–West Corridor highway to Thailand4. Improve the pavement of 3,000 km highways5. Widen 1,000 km narrow highways6. Improve the Yangon–Mandalay railway line7. Rehabilitate 1,500 km secondary rail lines
8. Develop rail freight9. Improve the Ayeyarwady river bed to 2 meters10. Improve river ports11. Increase by 15% the legal truck axle load12. Improve the road user charging system13. Reduce by 20% the road accident rate
Transport investments and operational changes tested:
AC = asphalt concrete, PRC = People’s Republic of China, km = kilometer, m = meter.Source: ADB estimates based on model developed for the study.
Table 40: continued
Cost
Economic Benefits
NPV (at 12%)
NPV / Cost
Annual 2013
Annual 2025
Total 2015–2030
River Investments Improve Ayeyarwaddy riverbed to 2 m 100 80 220 3,100 1,100 11.0Improve river ports 100 20 50 700 250 2.5Total River 200 100 270 3,800 1,350 6.8Policy Reforms Increase by 15% the legal axle load 260 70 200 2,800 1,000 3.8Improve the user charging system 120 230 3,300 1,250 Reduce by 20% road accident rate 100 160 410 5,700 2,070 20.7Total Policy Changes 260 350 830 11,700 4,320Total Program 6,080 1,860 4,900 83,900 29,850 4.9
AC = asphalt concrete, PRC = People’s Republic of China, km = kilometer, m = meter, NPV = net present value.Source: ADB estimates based on model developed for the study.

Outlook and Benefits from Operational Improvements and Policy Reforms�59
Impacts on economic growth. We estimate that this program alone would raise Myanmar’s GDP growth potential by 0.6% annually (i.e., from 7% to 7.6%) and its GDP in 2030 by $40 billion annually (a 13% increase over a baseline scenario). This estimate is based on the assumption that transport cost reductions are reinvested in Myanmar’s economy at a 12% rate of return. It is very consistent in magnitude with the macro estimates presented in the ADB country diagnostic study of Myanmar.19
Modal shares. These measures would strongly raise the modal share of rail and river transport. By 2025, rail’s share could reach 34% in passenger transport and 7% in freight transport. River’s share would keep shrinking for passenger transport to 0.3%, but would rise for freight transport to 18%.
Table 41: Potential Passenger Transport Costs and Modal Shares, 2025
Trunk Corridor Other Corridors Total
PassengerVolume (million)
Share (%)
VOCs ($)
All Costs
($)Volume (million)
Share (%)
VOCs ($)
All Costs
($)Volume (million)
Share (%)
VOCs ($)
All Costs
($)Car 54.7 32 1,204 2,763 35.4 41 810 2,282 90.13 35 2,014 5,045Bus 52.6 31 348 2,055 19.2 22 137 857 71.78 28 485 2,912Rail 60.4 35 230 1,975 27.3 31 141 1,158 87.70 34 371 3,133River 0.7 0 1 35 0.1 0 0 2 0.79 0 1 37Air 1.8 1 135 235 4.7 5 484 790 6.52 3 619 1,024Total 170.2 100 1,919 7,063 86.7 100 1,571 5,089 256.92 100 3,490 12,152
VOC = vehicle operating costs.Source: ADB estimates based on model developed for the study.
Table 42: Potential Freight Transport Costs and Modal Shares, 2025
Trunk Corridor Other Corridors Total
FreightVolume (million)
Share (%)
VOCs ($)
All Costs
($)Volume (million)
Share (%)
VOCs ($)
All Costs
($)Volume (million)
Share (%)
VOCs ($)
All Costs
($)Truck 86.9 71 659 695 48.27 82 816 885 135.22 75 1,475 1,579Rail 5.2 4 69 90 7.18 12 81 127 12.39 7 151 217River 29.8 24 125 240 3.11 5 5 22 32.93 18 131 262Total 122.0 100 854 1,025 58.56 100 903 1,034 180.54 100 1,757 2,059
VOC = vehicle operating costs.Source: ADB estimates based on model developed for the study.
19 ADB. 2014. Myanmar. Unlocking the Potential. Country Diagnostic Study. Manila.

60�Myanmar Transport Sector Policy Note: How to Reduce Transport Costs
0
10
20
30
40
50
60
70
100–200 200–400 400–600 600–800
Car Bus Rail River Airkm
milli
on to
ns
0
2
4
6
8
10
12
14
100–200 200–400 400–600 600–800
Road Rail Riverkm
milli
on to
ns
Figure 43: Yangon–Mandalay Passenger Transport Volumes, 2025 (million passengers/year)
Figure 44: Yangon–Mandalay Freight Transport Volumes, 2025
(million tons/year)
km = kilometer.Source: ADB estimates based on model developed for the study.
0
5
10
15
20
25
30
35
Car Bus Rail River Air
100–200
200–400
400–600
600–800
800–1,000
1,000–1,2
00
km
milli
on to
ns
02468
1012141618
Truck Rail River
100–200
200–400
400–600
600–800
800–1,000
1,000–1,2
00
km
Figure 45: Other Areas, Passenger Transport Volumes, 2025 (million passengers/year)
Figure 46: Other Areas, Freight Transport Volumes, 2025
(million tons/year)
km = kilometer.Source: ADB estimates based on model developed for the study.
Outlook and Benefits from Operational Improvements and Policy Reforms�61
Part of these results is sensitive to assumptions. Particularly, rail’s passenger share is sensitive to speed and to pricing. This is because the rail services after improvements are very comparable with bus services so that a moderate speed advantage (such as 10 kph) and change in pricing policy could lead to large changes in modal shares. Also, rail and river freight have the potential to strongly compete for the low- and medium-value freight market on the Yangon–Mandalay corridor. In particular, the benefits of developing rail freight are reduced (but remain positive) if the government develops river freight in parallel.
Myanma Railways fares. The model also lets us analyze the scope for Myanma Railways to increase fares to align with costs. For freight, because the current market share seems below potential, there should be scope for increasing fares (while river transport competition remains moderate), as long as quality and reliability are ensured. For passenger transport, the elasticity of passenger traffic volumes to a fare increase in the current situation is estimated to be –1.02. This means that an increase in fares by 10% would lead to a reduction in passenger traffic by 10.2%, so that revenues would decrease (profitability may still rise). After improvements of the rail lines, the model calculates an elasticity of –0.50. By then, an increase in fares by 10% would lead to a reduction in traffic by only 5%, so that revenues would rise by 5%.

ASIAN DEVELOPMENT BANK6 ADB Avenue, Mandaluyong City1550 Metro Manila, Philippineswww.adb.org
Myanmar Transport Sector Policy NoteHow to Reduce Transport Costs
Better transport is essential to Myanmar’s development. After decades of underinvestment, Myanmar’s transport infrastructure lags behind other regional countries. Sixty percent of trunk highways and most of the railways need maintenance or rehabilitation. River infrastructure does not exist, while 20 million people lack basic road access. Can the transport sector deliver upon the master plan’s objectives? What is needed to improve the quality of the infrastructure and services for the industry? How can basic transport services be provided to all? How can Myanmar reduce the economic and social cost of transport? This report is an attempt to answer these questions.
About the Asian Development Bank
ADB’s vision is an Asia and Pacific region free of poverty. Its mission is to help its developing member countries reduce poverty and improve the quality of life of their people. Despite the region’s many successes, it remains home to the majority of the world’s poor. ADB is committed to reducing poverty through inclusive economic growth, environmentally sustainable growth, and regional integration.
Based in Manila, ADB is owned by 67 members, including 48 from the region. Its main instruments for helping its developing member countries are policy dialogue, loans, equity investments, guarantees, grants, and technical assistance.