myanmar opium survey 2018 - unodc.org · pol. col. oke soe tun head of project management...
TRANSCRIPT
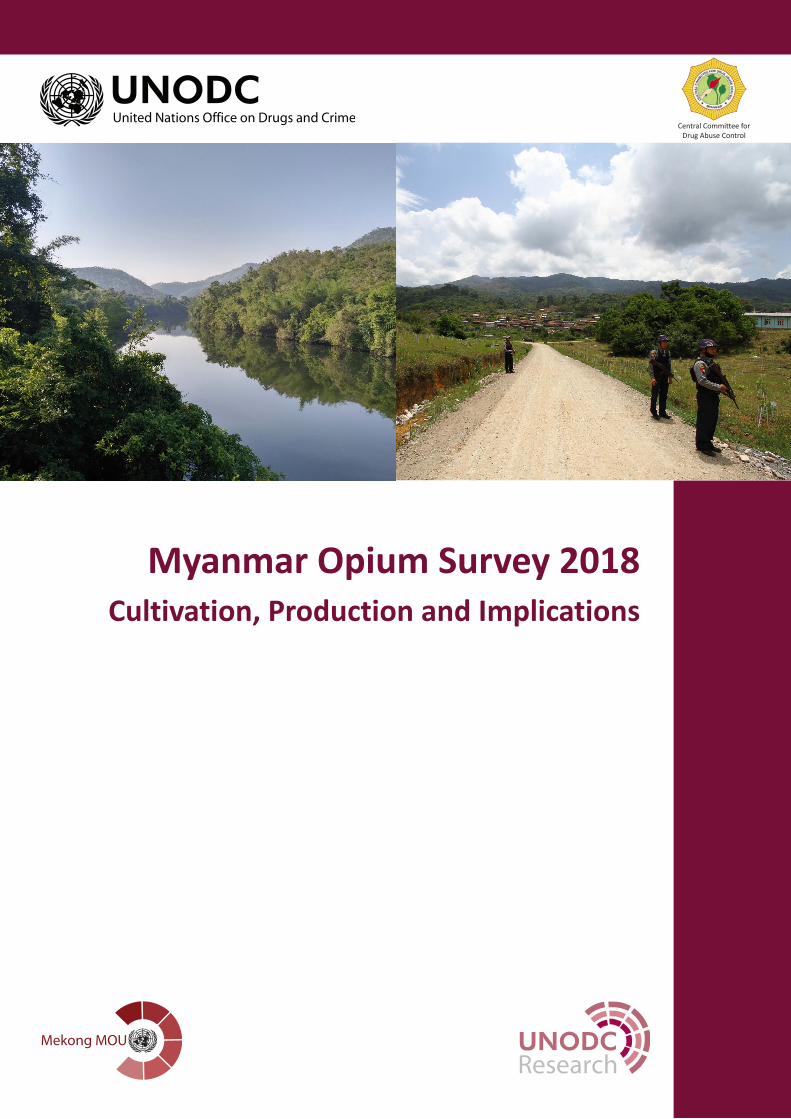
Myanmar Opium Survey 2018Cultivation, Production and Implications
Central Committee for Drug Abuse Control
Research
In Southeast Asia, UNODC supports Member States to develop and implement evidence‐based rule of law, drug control and related criminal justice responses through the Regional Programme 2014‐2018 and aligned country programmes including the Myanmar Country Programme 2014‐2018. This study is connected to the Mekong MOU on Drug Control which UNODC actively supports through the Regional Programme, including the commitment to develop data and evidence as the basis for countries of the Mekong region to respond to challenges of drug production, trafficking and use. UNODC’s Research and Trend Analysis Branch promotes and supports the development and implementation of surveys globally, including through its Illicit Crop Monitoring Programme (ICMP).
The implementation of Myanmar opium survey was made possible thanks to the financial
support of the Governments of Japan, the United States of America and China.
UNODC Regional Office for Southeast Asia and the Pacific Telephone: +6622882100 Fax: +6622812129 Email: unodc‐[email protected] Website: www.unodc.org/southeastasiaandpacific Twitter: @UNODC_SEAP
The designations employed and the presentation of material in this publication do not imply the expression of any opinion whatsoever on the part of UNODC concerning the legal status of any country, territory or city, or its authorities, or concerning the delimitation of its frontiers or boundaries.
Front cover photos: Jeremy Douglas and Akara Umapornsakula, United Nations Office on Drugs and Crime
Contents
Acknowledgments .............................................................................................................. i
Abbreviations ..................................................................................................................... i
Key findings ....................................................................................................................... iii
Fact Sheet ...........................................................................................................................v
1. Introduction ............................................................................................................... 3
2. Findings .................................................................................................................... 11
2.1 Estimated area under opium poppy cultivation ...................................................... 11 2.2 Opium yield and production estimates ................................................................... 15 2.3 Opium farm‐gate price ............................................................................................ 18 2.4 Opium economy in Myanmar .................................................................................. 19
3. Eradication and Seizures ........................................................................................... 25
3.1 Eradication ............................................................................................................... 25 3.2 Seizures .................................................................................................................... 27
4. Methodology ........................................................................................................... 31
4.1 Area estimation ....................................................................................................... 31 4.2 Yield and potential opium production estimation .................................................. 42 4.3 Estimating the value of opium economy in Myanmar ............................................ 47

Myanmar Opium Survey 2018
i
Acknowledgments Central Committee for Drug Abuse Control Pol. Lt. Gen. Aung Win Oo Chief of Myanmar Police Force, Secretary of CCDAC Pol. Brig. Gen. Win Naing Commander of Drug Enforcement Division, Joint Secretary
of CCDAC Pol. Col. Oke Soe Tun Head of Project Management Department, CCDAC Forest Department
Dr. Nyi Nyi Kyaw Director General, Forest Department
U Saw Daniel Assistant Director, Forest Department UNODC Southeast Asia and the Pacific Jeremy Douglas Regional Representative, Southeast Asia and the Pacific Akara Umapornsakula Graphic Designer Katherine North UNAC International Development Programme Troels Vester Country Manager, Myanmar San Lwin Htwe GIS Specialist and Survey Coordinator Naing Lin Aung Data Analyst UNODC Headquarters Angela Me Chief, Research and Trend Analysis Branch (RAB) Anja Korenblik Chief, Programme and Development Unit (PDMU) Coen Bussink Programme Officer, Team Leader, PDMU Iban Ameztoy Aramendi Programme Officer, Remote Sensing and GIS, PDMU Lorenzo Vita Research Officer, PDMU Irmgard Zeiler Statistician, PDMU
Abbreviations BGF Border Guard Force CCDAC Central Committee for Drug Abuse Control GOUM Government of the Republic of the Union on Myanmar HR High Resolution ICMP UNODC Illicit Crop Monitoring Programme KIA Kachin Independence Army KNLP Kayan New Land Party KNPLF Karenni National People’s Liberation Front KNPP Karenni National Progressive Party LCLU Land Cover Land Use MNDAA Myanmar National Democratic Alliance Army (Kokant) NDAA National Democratic Alliance Army (Mongla Special Region) PDMU Programme Management and Development Programme PMF People’s Militia Force (Local Militia Forces) PNLA Pa‐O National Liberation Army QA/QC Quality Assurance/Quality Control RAB Research and Trend Analysis Branch RCSS Restoration Council of Shan State (Shan State Army‐South) SR Special Region SSPP Shan State Progress Party (Shan State Army‐North) SSS Shan State South (Homein) TNLA Ta’ang National Liberation Army UNODC United Nations Office on Drugs and Crime UWSA United Wa State Army (Wa Special Region) VHR Very High Resolution

Myanmar Opium Survey 2018
ii
Myanmar Opium Survey 2018
iii
Key findings
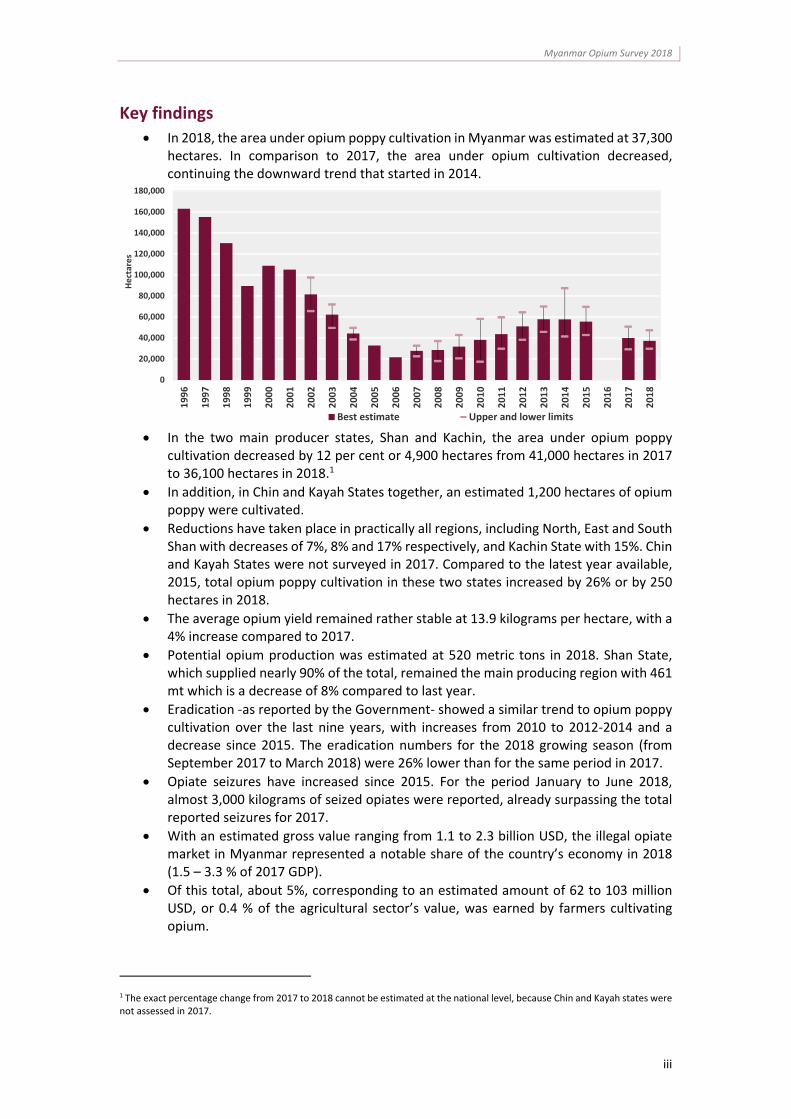
In 2018, the area under opium poppy cultivation in Myanmar was estimated at 37,300 hectares. In comparison to 2017, the area under opium cultivation decreased, continuing the downward trend that started in 2014.
In the two main producer states, Shan and Kachin, the area under opium poppy
cultivation decreased by 12 per cent or 4,900 hectares from 41,000 hectares in 2017 to 36,100 hectares in 2018.1
In addition, in Chin and Kayah States together, an estimated 1,200 hectares of opium poppy were cultivated.
Reductions have taken place in practically all regions, including North, East and South Shan with decreases of 7%, 8% and 17% respectively, and Kachin State with 15%. Chin and Kayah States were not surveyed in 2017. Compared to the latest year available, 2015, total opium poppy cultivation in these two states increased by 26% or by 250 hectares in 2018.
The average opium yield remained rather stable at 13.9 kilograms per hectare, with a 4% increase compared to 2017.
Potential opium production was estimated at 520 metric tons in 2018. Shan State, which supplied nearly 90% of the total, remained the main producing region with 461 mt which is a decrease of 8% compared to last year.
Eradication ‐as reported by the Government‐ showed a similar trend to opium poppy cultivation over the last nine years, with increases from 2010 to 2012‐2014 and a decrease since 2015. The eradication numbers for the 2018 growing season (from September 2017 to March 2018) were 26% lower than for the same period in 2017.
Opiate seizures have increased since 2015. For the period January to June 2018, almost 3,000 kilograms of seized opiates were reported, already surpassing the total reported seizures for 2017.
With an estimated gross value ranging from 1.1 to 2.3 billion USD, the illegal opiate market in Myanmar represented a notable share of the country’s economy in 2018 (1.5 – 3.3 % of 2017 GDP).
Of this total, about 5%, corresponding to an estimated amount of 62 to 103 million USD, or 0.4 % of the agricultural sector’s value, was earned by farmers cultivating opium.
1 The exact percentage change from 2017 to 2018 cannot be estimated at the national level, because Chin and Kayah states were not assessed in 2017.
0
20,000
40,000
60,000
80,000
100,000
120,000
140,000
160,000
180,0001996
1997
1998
1999
2000
2001
2002
2003
2004
2005
2006
2007
2008
2009
2010
2011
2012
2013
2014
2015
2016
2017
2018
Hectares
Best estimate Upper and lower limits
Myanmar Opium Survey 2018
iv
The largest share of the 2018 opiate market value was income generated by heroin manufacturing and trafficking. Domestic heroin consumption of 7.6 tons was valued at 238 ‐ 401 million USD, whereas the export of heroin (20 ‐ 45 tons) was worth between 782 and 1,798 million USD
Between 2015 and 2018, farm‐gate prices2 of fresh and dry opium decreased by 34 and 45 %, respectively. Decreasing prices together with a reduced supply of opium can be an indication of a decreased demand for opiates from Myanmar in the country and the region.
2Average farm‐gate prices. Average is weighted based on production. Prices are inflation adjusted for the analysis of trends.
Myanmar Opium Survey 2018
v
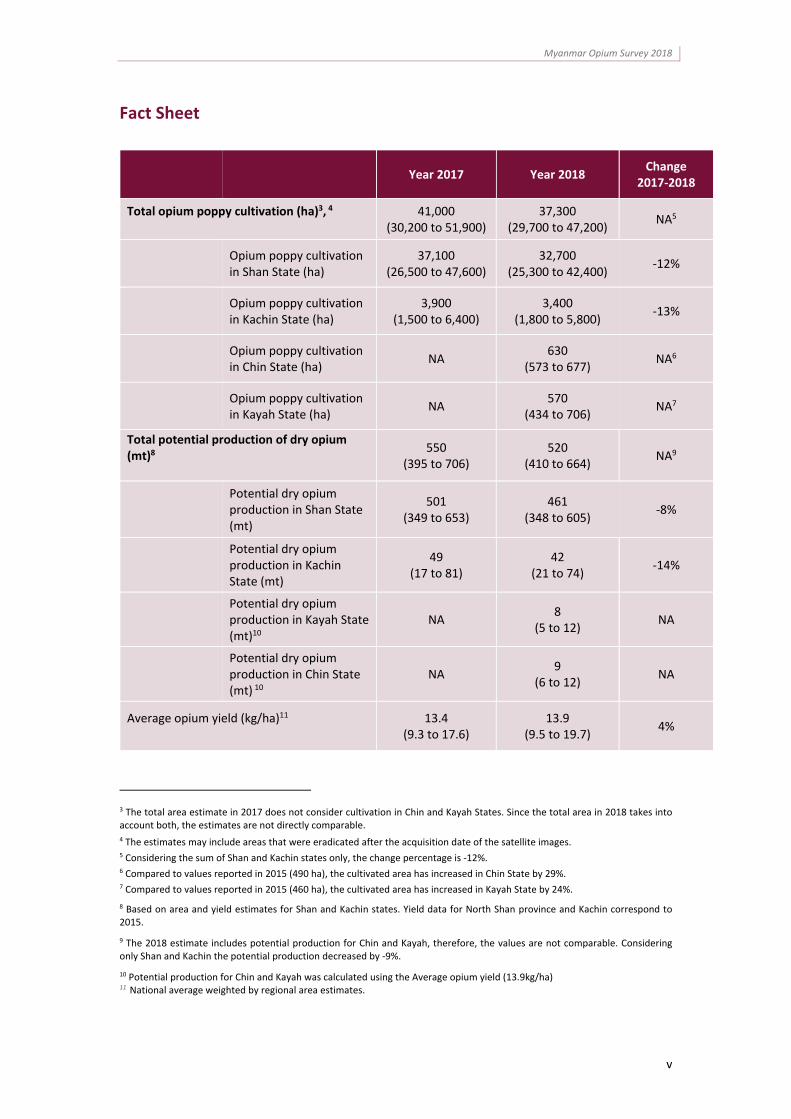
Fact Sheet
Year 2017 Year 2018
Change 2017‐2018
Total opium poppy cultivation (ha)3, 4
41,000 (30,200 to 51,900)
37,300 (29,700 to 47,200)
NA5
Opium poppy cultivation in Shan State (ha)
37,100 (26,500 to 47,600)
32,700 (25,300 to 42,400)
‐12%
Opium poppy cultivation in Kachin State (ha)
3,900 (1,500 to 6,400)
3,400 (1,800 to 5,800)
‐13%
Opium poppy cultivation in Chin State (ha)
NA 630
(573 to 677) NA6
Opium poppy cultivation in Kayah State (ha)
NA 570
(434 to 706) NA7
Total potential production of dry opium (mt)8
550 (395 to 706)
520 (410 to 664)
NA9
Potential dry opium production in Shan State (mt)
501 (349 to 653)
461 (348 to 605)
‐8%
Potential dry opium production in Kachin State (mt)
49 (17 to 81)
42 (21 to 74)
‐14%
Potential dry opium production in Kayah State (mt)10
NA 8
(5 to 12) NA
Potential dry opium production in Chin State (mt) 10
NA 9
(6 to 12) NA
Average opium yield (kg/ha)11
13.4 (9.3 to 17.6)
13.9 (9.5 to 19.7)
4%
3 The total area estimate in 2017 does not consider cultivation in Chin and Kayah States. Since the total area in 2018 takes into account both, the estimates are not directly comparable. 4 The estimates may include areas that were eradicated after the acquisition date of the satellite images. 5 Considering the sum of Shan and Kachin states only, the change percentage is ‐12%. 6 Compared to values reported in 2015 (490 ha), the cultivated area has increased in Chin State by 29%. 7 Compared to values reported in 2015 (460 ha), the cultivated area has increased in Kayah State by 24%.
8 Based on area and yield estimates for Shan and Kachin states. Yield data for North Shan province and Kachin correspond to 2015.
9 The 2018 estimate includes potential production for Chin and Kayah, therefore, the values are not comparable. Considering only Shan and Kachin the potential production decreased by ‐9%.
10 Potential production for Chin and Kayah was calculated using the Average opium yield (13.9kg/ha) 11 National average weighted by regional area estimates.
Myanmar Opium Survey 2018
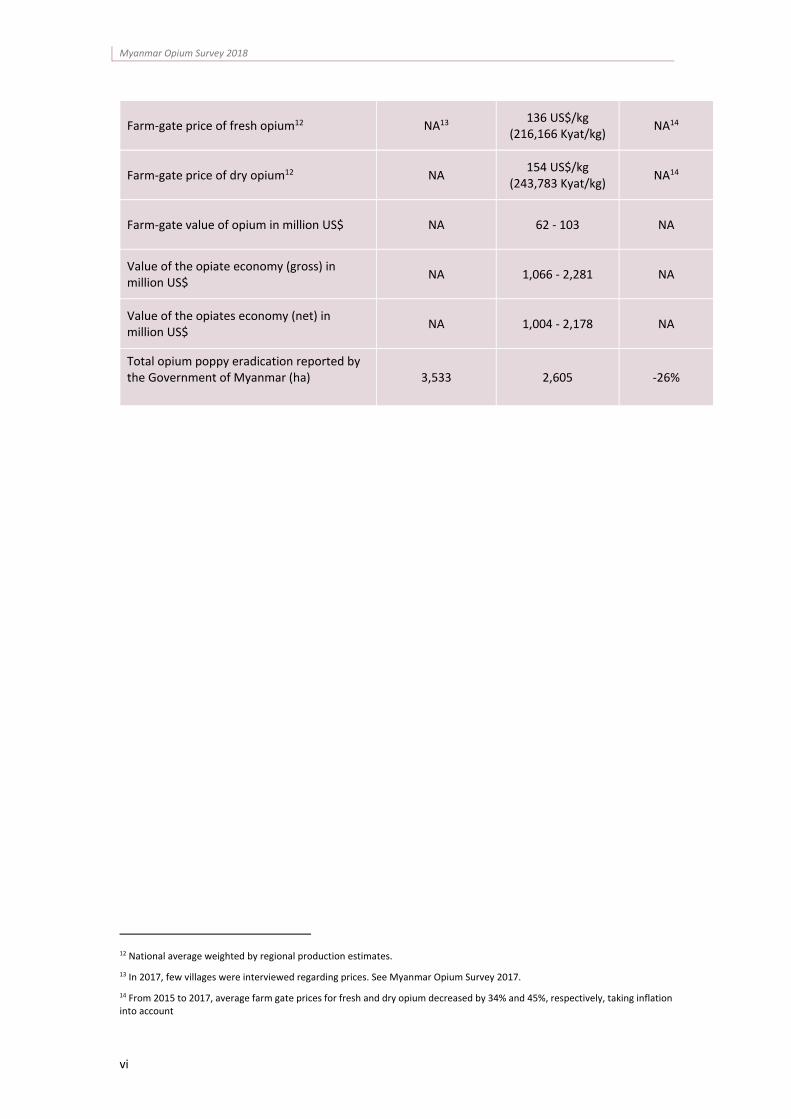
vi
Farm‐gate price of fresh opium12 NA13 136 US$/kg
(216,166 Kyat/kg) NA14
Farm‐gate price of dry opium12 NA 154 US$/kg
(243,783 Kyat/kg) NA14
Farm‐gate value of opium in million US$ NA 62 ‐ 103 NA
Value of the opiate economy (gross) in million US$
NA 1,066 ‐ 2,281 NA
Value of the opiates economy (net) in million US$
NA 1,004 ‐ 2,178 NA
Total opium poppy eradication reported by the Government of Myanmar (ha)
3,533 2,605 ‐26%
12 National average weighted by regional production estimates.
13 In 2017, few villages were interviewed regarding prices. See Myanmar Opium Survey 2017.
14 From 2015 to 2017, average farm gate prices for fresh and dry opium decreased by 34% and 45%, respectively, taking inflation into account
1. INTRODUCTION

Myanmar Opium Survey 2018
3
1. Introduction This report presents the results of the sixteenth opium survey in Myanmar. It was conducted jointly by the Central Committee for Drug Abuse Control (CCDAC) of the Ministry of Home Affairs and UNODC, which has been collecting statistical information on illicit crop cultivation in Myanmar within the framework of its Illicit Crop Monitoring Programme. The methodology used in this report combines satellite imagery and a yield survey to evaluate the extent of opium poppy cultivation and production. The 2018 survey builds on years of data regarding illicit opium production in Myanmar, estimating and comparing the area under cultivation, and assessing yield and production. In 1996 over 160,000 hectares (ha) were used for cultivating opium poppy, making Myanmar temporarily the most prominent country with cultivation in the world. However, cultivation decreased significantly over the following ten years, reaching a low of just over 20,000 ha in 2006. The area of opium cultivation increased again between 2006 and 2014 to just under 60,000 ha, but it has subsequently been in sharp decline. In 2017, the total area of opium poppy consisted of 41,000 ha, a 25% decrease from the 55,000 ha recorded in 2015. The downward trend has continued in 2018 with 37,300 ha of opium poppy. In the two main producing states, Shan and Kachin, the cultivation area decreased by 12 percent from 41,000 hectares in 2017 to 36,100 hectares in 2018. As in previous years, the majority of opium poppy is again cultivated in Shan State ‐nearly 90%‐ followed at a distance by Kachin State 9%, with negligible cultivation in Chin and Kayah states. The biggest drops in cultivation have been seen in areas that have had relatively good security. However, in parts of Shan and Kachin experiencing a protracted state of conflict, high concentrations of poppy cultivation have continued – a clear correlation between conflict and opium production. For example: in Kachin State, the highest density of poppy cultivation took place in areas under the control or influence of the Kachin Independence Army (KIA); in North Shan, in areas of the Myanmar National Democratic Alliance Army (MNDAA); in South Shan, of the Pa‐O National Liberation Army (PNLA), and the Restoration Council of Shan State (RCSS) Shan State Army South (SSA‐S); and in East Shan, the People Militia’s Force (PMF); with each engaged in conflicts of varying intensity and frequency. A ceasefire agreement providing a degree of self‐administration has been concluded with most of the armed groups in Myanmar, and the Government has limited access to, and limited influence in, territories controlled by many militias. There are also several drivers for the illicit cultivation of opium poppy in Myanmar. The most recent UNODC socio‐economic survey identified insecurity, lack of employment opportunities, income inequality, and lack of infrastructure (access to markets, availability of clinics) as conditions associated with the cultivation of opium poppy. Illicit cultivation is also linked to limitations on access to areas of cultivation and the absence of a process for independently monitoring compliance with ceasefire provisions which include, among other conditions, the non‐engagement in drug production. The presence of organized crime groups in the same areas is also associated with the manufacturing and trafficking of heroin. According to the Government of Myanmar, criminal activity in the country is estimated to generate US$15 billion per year – the equivalent
Myanmar Opium Survey 2018
4
of approximately 24% of Gross Domestic Product (GDP)15 – with 84% or US$12.6 billion related to organized crime of which a significant portion would be transnational and drug related. However, the illicit drug economy is increasingly diverse and revenue is not only generated from opiates. There has been a sharp increase in the supply of, and demand for, synthetic drugs and particularly methamphetamine across East and Southeast Asia and neighbouring regions, and the downward trend in opium cultivation and related heroin production in Myanmar needs to be understood in this context. Of the 11 countries in the region systematically sharing drug data and information with UNODC, 9 are now reporting methamphetamine as their primary drug of concern, as opposed to 10 years ago when there were 4 countries reporting methamphetamine and 7 reporting heroin. Even countries with traditionally large heroin markets, including China and Malaysia, have reported this dramatic change. Most countries in the region do not have reliable data on drug use making it difficult to determine if the rapid expansion of methamphetamine and synthetic drugs has happened at the expense of, or in addition to, heroin, but findings of the opium survey point to the shrinking of the market for opiates originating from Myanmar: between 2015 and 2018, farm‐gate prices of fresh and dry opium have decreased by 34 and 45 % respectively. Declining prices considered together with a reduction in the supply of opium and heroin are a possible indication of decreased demand for opiates from Myanmar, although data on other opioids which may be in the regional market are limited. The 2018 opium survey report finds that the current value of Myanmar’s opiate economy is a noticeable share of the overall national economy, ranging from 1.5%‐3.3% of GDP.16 with geographic pockets of Shan and Kachin where the opiate economy dominates. Where drug‐related proceeds comprise a sizeable portion of the total economy of an area or community, dynamics are distorted with unfair competition, skewed income and wealth distributions, and increased corruption. Myanmar is the major supplier of opium and heroin in East and Southeast Asia, and Australia, and the value of opiates in the region is much higher than the US$1.1‐$2.3 billion estimated inside the country given the escalation of value as it approaches retail level. Manufacture and trafficking of heroin within the borders of Myanmar constitutes the largest value of the Myanmar opiate economy with a value range of US$1.0 to $2.2 billion – although this estimate does not take into account certain input costs including smuggled precursor chemicals. Traffickers and organized crime groups are the main beneficiaries of the opiate economy in Myanmar, with farming’ income, or the farm‐gate value of opium, comparatively small and estimated between US$62 and $103 million. Efforts to eradicate opium poppy decreased in 2018, with a reported total of 2,605 ha eradicated. This is 26% less than in 2017, and follows a continuous annual decline in the hectares of opium poppy eradicated since 2015. The slowdown in eradication efforts is reportedly linked to the existence of protracted conflict and limited access to areas under the
15 Executive Summary, Report on Money Laundering and Financing of Terrorism, the National Risk Assessment Committee on Money Laundering & Financing of Terrorism, the Myanmar Financial Intelligence Unit, the Republic of the Union of Myanmar, 2018. The report does not provide a breakdown of different forms of organized crime and associated revenue.
16 The estimated value includes opiates (raw opium and heroin) destined to domestic consumption and opiates for export. The range reflects uncertainties related to both production and heroin’s purity. For further details see chapter 2.4 and the methodology section.
Myanmar Opium Survey 2018
5
control of non‐state armed groups. Opium poppy is now mainly concentrated in areas where government action against cultivation and organized crime groups is inhibited. Opium cultivation, heroin manufacturing and the drug economy are important elements to consider in the context of the peace process and the establishment of long‐term stability in Myanmar. There is a direct connection between drugs and conflict in the country, with the drug economy supporting the conflict and in‐turn the conflict facilitating the drug economy. Providing solutions to the conflict requires breaking this cycle. The influence of the drug economy can be mitigated through, among other things, scaling‐up alternative development programmes that provide viable sources of legitimate income, as well as by addressing the presence of transnational organized crime groups that continue to produce and traffic heroin and that have significantly scaled‐up the production of methamphetamine and synthetic drugs for the Asia Pacific market. Countering drug production and organized crime networks active in Myanmar are also vital for providing sustainable peace and security to Shan and Kachin states, and border areas of the surrounding Mekong region. The annual opium survey remains an essential tool for assessing the extent of opium poppy cultivation in Myanmar, as well as understanding changes in patterns and the links between drugs and the economy. This information is useful for understanding farming techniques and rural livelihoods, and for designing effective alternative development options and programmes. It is also essential for supporting decision makers to develop effective strategies to sustain the transition from an illicit to a licit economy, and as a basis for understanding the connection between the drug economy and ongoing conflict.
Myanmar Opium Survey 2018
6
Map 1: Cultivation density map (2013‐2018) with reported conflicts in Myanmar, June 2017‐ May 2018
Myanmar Opium Survey 2018
7
Map 2: Armed groups in Myanmar, 2017‐2018 opium poppy growing season

Myanmar Opium Survey 2018
8
2. FINDINGS

Myanmar Opium Survey 2018
11
2. Findings
2.1 Estimated area under opium poppy cultivation
In 2018, the total amount of opium poppy cultivation area in Myanmar was estimated at 37,300 ha. Contrary to the survey in 2017, this year’s survey covered not only the major producing states, Shan and Kachin, but also Chin and Kayah. Therefore, the total 2018 estimate cannot directly be compared with the 2017 estimate (41,000 ha). The comparison can be made for Shan and Kachin states only.
Considering only Shan and Kachin, a decrease in cultivation of 12% was recorded, from 41,000 ha in 2017 to 36,000 ha in 2018.
Opium poppy cultivation in Myanmar, 1996‐2018 (ha)*
*Sources: from 1996 to 2001 USG, from 2002 to 2018 GOUM ‐UNODC. The surveys in 2014, 2015 and 2018 included satel l i te image est imates for Kayah and Chin States .
Regional distribution of opium poppy cultivation areas in Myanmar, 2018*
*Chin and Kayah States were surveyed in 2018 but not in 2017. Comparisons between the years should therefore only consider the Shan regions and Kachin State.
0
20,000
40,000
60,000
80,000
100,000
120,000
140,000
160,000
180,000
1996
1997
1998
1999
2000
2001
2002
2003
2004
2005
2006
2007
2008
2009
2010
2011
2012
2013
2014
2015
2016
2017
2018
Hectares
Best estimate Upper and lower limits
South Shan38%
East Shan27%
North Shan23%
Kachin 9%
Chin and Kayah3%
Myanmar Opium Survey 2018
12
Compared to 2017, moderate decreases were observed in practically all surveyed regions. In Shan State alone, cultivation decreased by 4,400 hectares (‐12%). In South Shan the reduction was of 2,800 hectares (‐17%). Decreases of 900 ha (‐8%) and 700 ha (‐7%) were also observed in East and North Shan, respectively. In the same line, an area reduction of 600 hectares (‐15%) was observed in Kachin State. In contrast, compared to the survey carried out in 2015, Kayah and Chin are the only estates where cultivated area was larger, with increases of 110 ha (+24%) and 140 ha (+29%) respectively.
All in all, Shan continued to be by far the major cultivating state in Myanmar, accounting for almost 90% of the total opium poppy area. Within Shan state, the sub‐regions of South, East and North Shan accounted for 38%, 27% and 23% of total cultivation. Kachin State accounted for 9% (3,300 ha) and Chin and Kayah States for 3% (1200 ha).
Table 1: Areas under opium poppy cultivation in Myanmar (ha), 2018*
* Values in brackets indicate the 95% conf idence interval . ** +24% compared to the area in 2015 (460 ha) *** +29% compared to the area in 2015 (490 ha) **** ‐12% for the comparable areas, considering the sum of Shan and Kachin States only.
Opium poppy cultivation is now concentrated in areas characterized by a combination of specific topographical conditions, socio‐economic circumstances and security. For example, from a geographic perspective the south‐western mountains in South Shan provide a good environment for opium poppy cultivation (Figure 3). In this region large areas with high to very high density of opium poppy cultivation has been reported in 2018 (see map 1). The northern area of Kyaing Tong city in East Shan and the areas near the boundaries of East and South Shan, on both sides of the Than Lwin river, also present some extensive areas of poppy, although the cultivation is dispersed, and the density is slightly lower than in South Shan region.
As in the former survey, most of the reduction in cultivation between 2017 and 2018 took place in areas well‐suited for opium cultivation but with a relatively good security situation (South Shan, see Map 1). Although, decreases were also observed in major growing regions
2017 2018 Change 2017 ‐2018
East Shan 11,000
(6,900 to 15,100) 10,100
(6,900 to 14,000) ‐8%
North Shan 9,400
(5,200 to 13,600) 8,700
(4,400 to 14,200) ‐7%*
South Shan 16,700
(7,900 to 25,400) 13,900
(8,800 to 20,900) ‐17%
Shan State Total 37,100
(26,500 to 47,600) 32,700
(25,300 to 42,400)‐12%
Kachin 3,900
(1,500 to 6,400) 3,400
(1,800 to 5,800) ‐13%
Kayah NA 570
(434 to 706) NA**
Chin NA 630
(573 to 677) NA***
National Total (rounded) 41,000
(30,200 to 51,900) 37,300
(29,700 to 47,200)NA****
Myanmar Opium Survey 2018
13
with security incidents (North Shan and Kachin). The only increases in cultivation this year were observed outside the major growing regions, in Kayah and Chin state, where no security problems were reported.
Until 2005, Special Region 2 ‐ or Wa region ‐ showed high levels of poppy cultivation, but after 2005 there has been few poppy fields due to the ban on opium poppy cultivation. In 2018, the eastern part of North Shan, bordering the Wa region, showed high concentrations of poppy, similarly to the border with Kachin State. The latter is probably related to the insecurity situation that is reflected by the number of conflicts in this area (see Map 1). The majority of North Shan region presents areas with medium cultivation levels, but also some high cultivation density areas are observed, especially along the border with Wa. Finally, the north‐western zone of Tanai town, in Kachin State present some areas with very high cultivation density.
Poppy field in South Shan, 2018
Myanmar Opium Survey 2018
14
Map 3: Opium poppy cultivation trends in Myanmar, 2013‐2018
Myanmar Opium Survey 2018
15
2.2 Opium yield and production estimates
In 2018, several field studies were carried out to measure opium yields in three different regions of Shan State. North Shan was the region with highest yield values (16.1ha/kg) followed by East Shan (13.5ha/kg) and South Shan (13.3ha/kg). The average yield was estimated at 14ha/kg, a 4% increase compared to 2017. However, it should be noted that the 2017 field work was not carried out in North Shan due to security constraints. For the opium production calculation in Kachin state the 2015 yield estimate was used, which was estimated at 12.5 kg/ha.
Average opium yield in Myanmar, 2002 – 2018
National average weighted by regional area est imates.
Table 2: Potential opium yield by region (kg/ha), 2017 and 2018
Region 2017 2018 Change
2015‐2017
East Shan 12.8
(11.4 ‐ 14.1) 13.5
(12.3 ‐ 14.6) 5%
North Shan NA 16.1
(14.7 – 17.5) NA
South Shan 14.2
(12.7 – 15.6) 13.3
(12.3 ‐ 14.3) ‐6%
Average yield 13.4
(9.3 – 17.6) 14
(9.5 – 19.7) 4%
Values in brackets indicate the 95% conf idence interval . For Kachin state yie ld survey could not be implemented and for the product ion calculat ion yield data from 2015 was used (12.5kg/ha, 95% conf idence interval : 9.7 ‐15.3kg/ha)
The resulting estimate of potential dry opium production in 2018 was 520 metric tons. Shan State, with 461 mt accounted for nearly 90% of the total.17 However, the estimates for this state are not equally distributed; whilst the East and South regions showed small to moderate decreases of 3% (‐4mt) and 21% (‐51 mt), North Shan showed an increase of 12% (+15mt), even though a decrease in the area estimate was observed. This was caused by the yield that
17 The 2017 production figure did not include the potential production in Chin and Kayah States, hence this figure is not directly comparable with the values in 2018.
10.0
13.0
8.0
9.5
14.6
16.6
14.4
10.4
15.114.0
13.5
15.0
11.7 11.7
13.414.0
0.0
2.0
4.0
6.0
8.0
10.0
12.0
14.0
16.0
18.0
20.0
2002 2003 2004 2005 2006 2007 2008 2009 2010 2011 2012 2013 2014 2015 2016 2017 2018
Yield (kg/ha)
Myanmar Opium Survey 2018
16
increased by almost 3kg/ha compared to the value of 2015. The production in Kachin State decreased by 14% (‐7mt). The total opium production in Shan and Kachin States together resulted in a decrease of 9%, from 550 mt to 503 mt. The other states (counting for 3% of the national production) produced almost equal amounts, Chin state with 8 mt and Kayah with 9 mt. Compared to the production calculated in 2015,18 these values represented increases of 2 (+33%) and 4 mt (+80%) respectively.
Table 3: Potential opium production by region (mt), 2017 and 2018
Region Potential
production 2017 Potential
production 2018 Change
2017‐2018
Share of production by
state (%)
East Shan 140 136 ‐3% 26%
North Shan 125 140 12% 27%
South Shan 236 185 ‐21% 36%
Shan state total
501 461 ‐8% 89%
Kachin state 49 42 ‐14% 8%
Kayah state NA 8 ‐ 2%
Chin state NA 9 ‐ 1%
Total (rounded)
550 (395 – 706)
520 (410 – 664)
NA* 100%
* Chin and Kayah were included in the 2018 est imate, but not in 2017 therefore the totals are not direct ly comparable. Their product ion est imates were calculated with the average yield for 2018 (14kg/ha) **Consider ing only Shan and Kachin the potential product ion decreased by 9%.
18 Kaya State: 5 mt and Chin State: 6 mt See Myanmar Opium Survey 2017 for further references.
Myanmar Opium Survey 2018
17
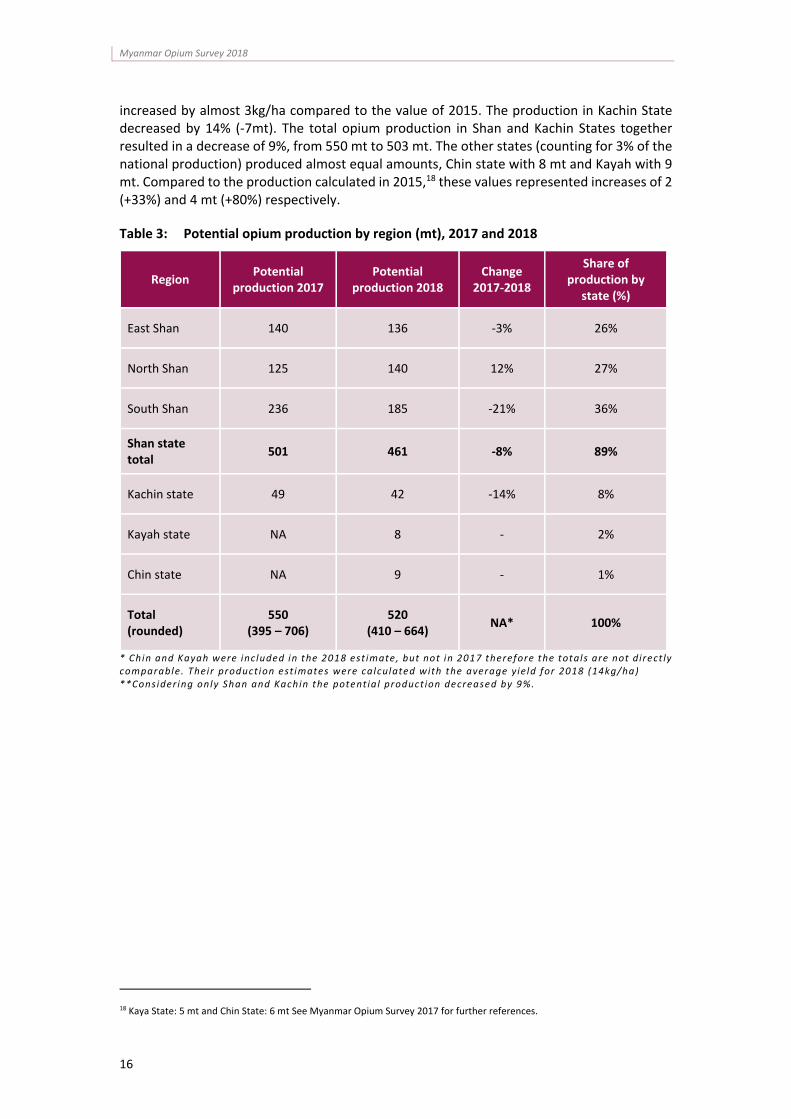
Irrigated poppy field as seen on the satellite images and in the field, at different growing stages
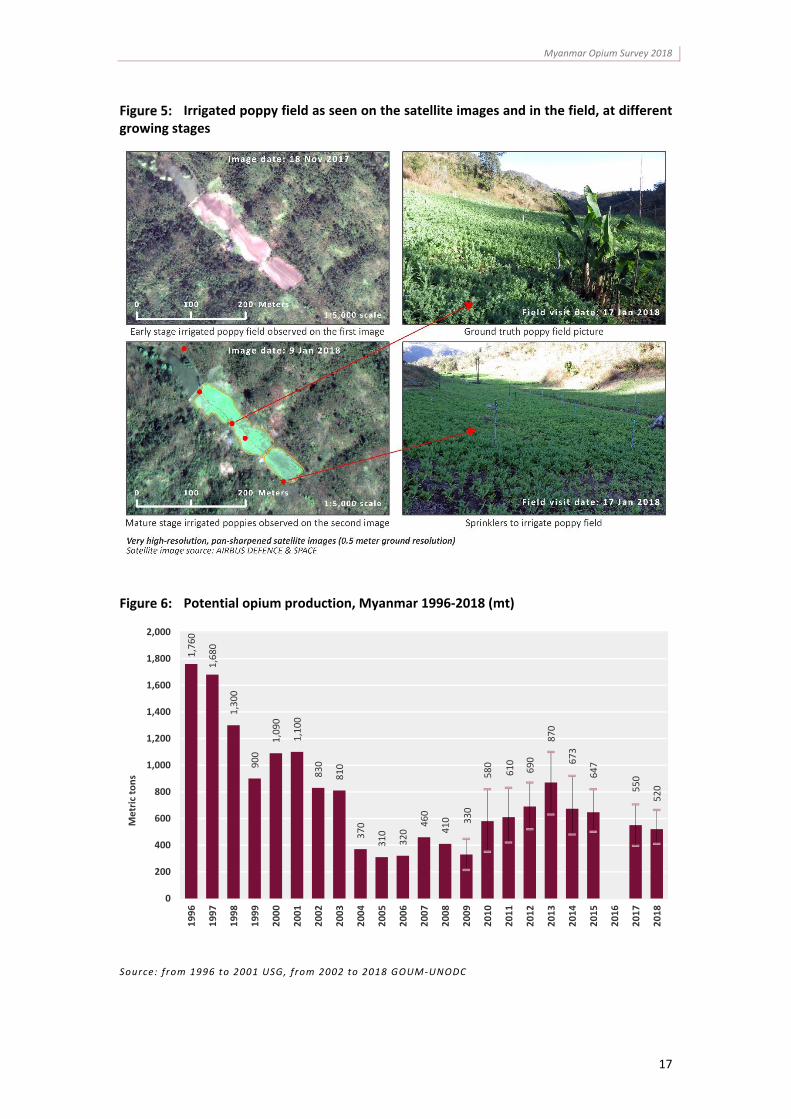
Potential opium production, Myanmar 1996‐2018 (mt)
Source: from 1996 to 2001 USG, from 2002 to 2018 GOUM ‐UNODC
1,760
1,680
1,300
900
1,090
1,100
830
810
370
310
320 460
410
330
580
610
690
870
673
647
550
520
0
200
400
600
800
1,000
1,200
1,400
1,600
1,800
2,000
1996
1997
1998
1999
2000
2001
2002
2003
2004
2005
2006
2007
2008
2009
2010
2011
2012
2013
2014
2015
2016
2017
2018
Metric tons
Myanmar Opium Survey 2018
18
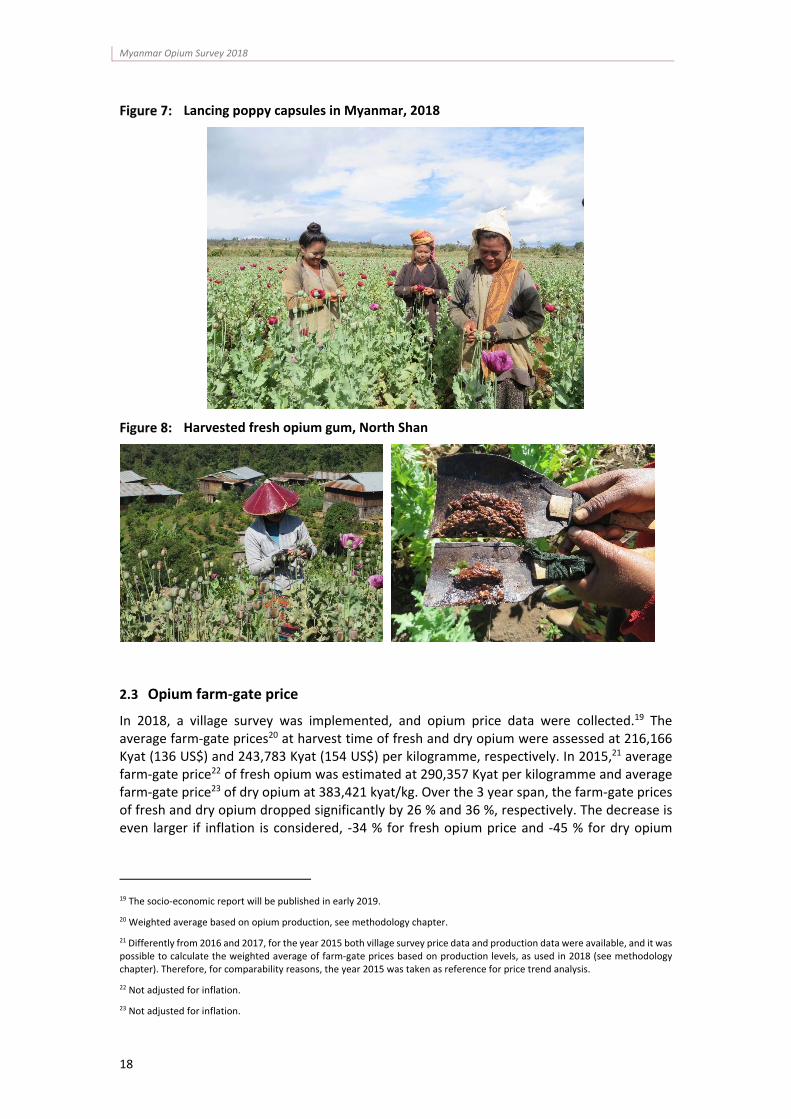
Lancing poppy capsules in Myanmar, 2018
Harvested fresh opium gum, North Shan
2.3 Opium farm‐gate price
In 2018, a village survey was implemented, and opium price data were collected.19 The average farm‐gate prices20 at harvest time of fresh and dry opium were assessed at 216,166 Kyat (136 US$) and 243,783 Kyat (154 US$) per kilogramme, respectively. In 2015,21 average farm‐gate price22 of fresh opium was estimated at 290,357 Kyat per kilogramme and average farm‐gate price23 of dry opium at 383,421 kyat/kg. Over the 3 year span, the farm‐gate prices of fresh and dry opium dropped significantly by 26 % and 36 %, respectively. The decrease is even larger if inflation is considered, ‐34 % for fresh opium price and ‐45 % for dry opium
19 The socio‐economic report will be published in early 2019.
20 Weighted average based on opium production, see methodology chapter.
21 Differently from 2016 and 2017, for the year 2015 both village survey price data and production data were available, and it was possible to calculate the weighted average of farm‐gate prices based on production levels, as used in 2018 (see methodology chapter). Therefore, for comparability reasons, the year 2015 was taken as reference for price trend analysis.
22 Not adjusted for inflation.
23 Not adjusted for inflation.
Myanmar Opium Survey 2018
19
price.24 The fact that farm‐gate opium prices are falling so steeply, despite the concurrent reduction of opium supply, suggests that the demand for opiates in Myanmar is lower than before and endorses the hypothesis that the heroin market has declined in the region.
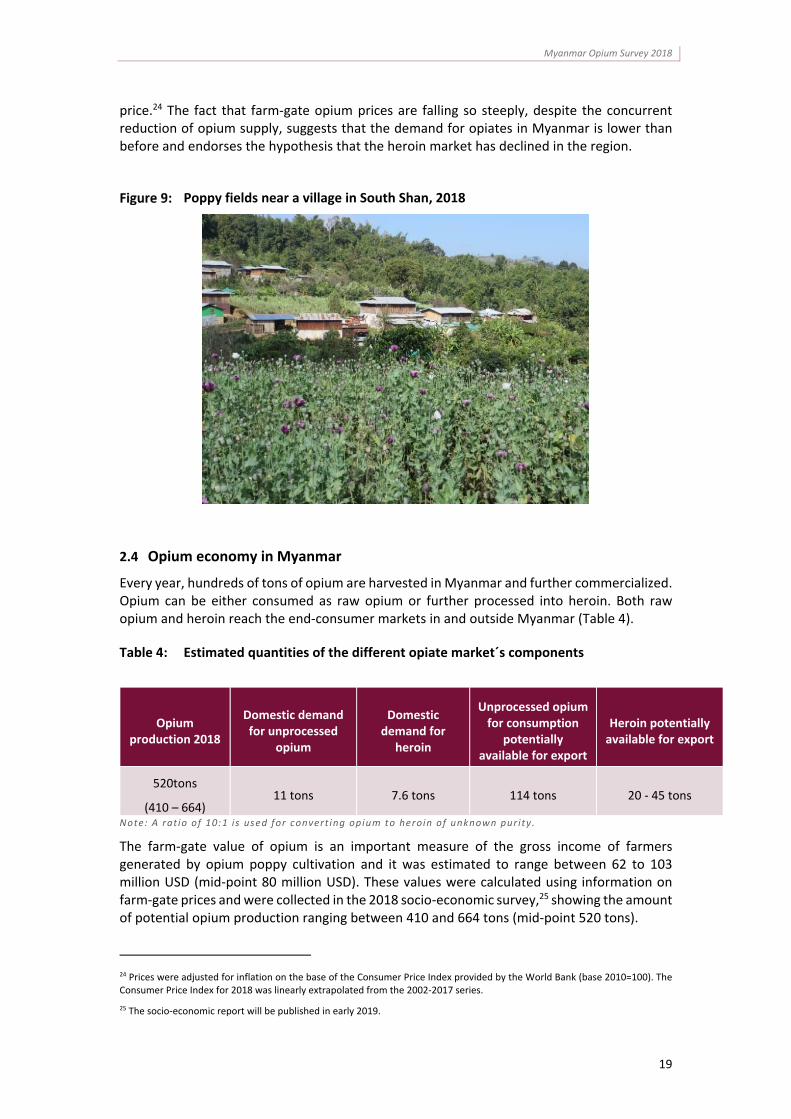
Poppy fields near a village in South Shan, 2018
2.4 Opium economy in Myanmar
Every year, hundreds of tons of opium are harvested in Myanmar and further commercialized. Opium can be either consumed as raw opium or further processed into heroin. Both raw opium and heroin reach the end‐consumer markets in and outside Myanmar (Table 4).
Table 4: Estimated quantities of the different opiate market´s components
Opium production 2018
Domestic demand for unprocessed
opium
Domestic demand for
heroin
Unprocessed opium for consumption
potentially available for export
Heroin potentially available for export
520tons
(410 – 664) 11 tons 7.6 tons 114 tons 20 ‐ 45 tons
Note: A rat io of 10:1 i s used for convert ing opium to heroin of unknown purity.
The farm‐gate value of opium is an important measure of the gross income of farmers generated by opium poppy cultivation and it was estimated to range between 62 to 103 million USD (mid‐point 80 million USD). These values were calculated using information on farm‐gate prices and were collected in the 2018 socio‐economic survey,25 showing the amount of potential opium production ranging between 410 and 664 tons (mid‐point 520 tons).
24 Prices were adjusted for inflation on the base of the Consumer Price Index provided by the World Bank (base 2010=100). The Consumer Price Index for 2018 was linearly extrapolated from the 2002‐2017 series.
25 The socio‐economic report will be published in early 2019.
Myanmar Opium Survey 2018
20
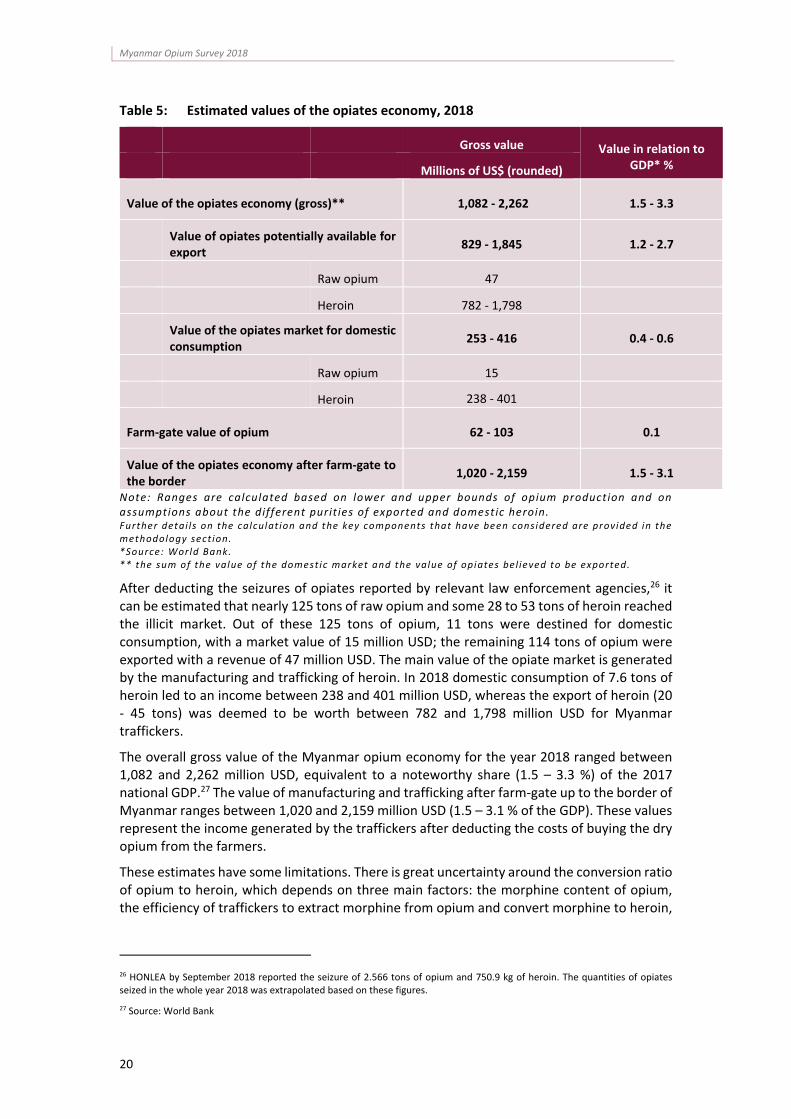
Table 5: Estimated values of the opiates economy, 2018
Gross value Value in relation to GDP* % Millions of US$ (rounded)
Value of the opiates economy (gross)** 1,082 ‐ 2,262 1.5 ‐ 3.3
Value of opiates potentially available for export
829 ‐ 1,845 1.2 ‐ 2.7
Raw opium 47
Heroin 782 ‐ 1,798
Value of the opiates market for domestic consumption
253 ‐ 416 0.4 ‐ 0.6
Raw opium 15
Heroin 238 ‐ 401
Farm‐gate value of opium 62 ‐ 103 0.1
Value of the opiates economy after farm‐gate to the border
1,020 ‐ 2,159 1.5 ‐ 3.1
Note: Ranges are calculated based on lower and upper bounds of opium production and on assumptions about the different purit ies of exported and domestic heroin. Further detai ls on the calculat ion and the key components that have been considered are provided in the methodology sect ion. *Source: World Bank. ** the sum of the value of the domestic market and the value of opiates bel ieved to be exported.
After deducting the seizures of opiates reported by relevant law enforcement agencies,26 it can be estimated that nearly 125 tons of raw opium and some 28 to 53 tons of heroin reached the illicit market. Out of these 125 tons of opium, 11 tons were destined for domestic consumption, with a market value of 15 million USD; the remaining 114 tons of opium were exported with a revenue of 47 million USD. The main value of the opiate market is generated by the manufacturing and trafficking of heroin. In 2018 domestic consumption of 7.6 tons of heroin led to an income between 238 and 401 million USD, whereas the export of heroin (20 ‐ 45 tons) was deemed to be worth between 782 and 1,798 million USD for Myanmar traffickers.
The overall gross value of the Myanmar opium economy for the year 2018 ranged between 1,082 and 2,262 million USD, equivalent to a noteworthy share (1.5 – 3.3 %) of the 2017 national GDP.27 The value of manufacturing and trafficking after farm‐gate up to the border of Myanmar ranges between 1,020 and 2,159 million USD (1.5 – 3.1 % of the GDP). These values represent the income generated by the traffickers after deducting the costs of buying the dry opium from the farmers.
These estimates have some limitations. There is great uncertainty around the conversion ratio of opium to heroin, which depends on three main factors: the morphine content of opium, the efficiency of traffickers to extract morphine from opium and convert morphine to heroin,
26 HONLEA by September 2018 reported the seizure of 2.566 tons of opium and 750.9 kg of heroin. The quantities of opiates seized in the whole year 2018 was extrapolated based on these figures.
27 Source: World Bank
Myanmar Opium Survey 2018
21
and the purity of the heroin estimated.28 None of these factors are well researched in the context of Myanmar, but can have a strong impact on the estimated values of the opiate economy. Estimates on demand in the region are based on 2011 data and may have changed since then. Moreover, the estimates presented are gross estimates before deducting any cost, e.g. costs for precursor substances, such as acetic anhydride, which can substantially reduce the profits of manufacturers and traffickers of heroin. To assess the profits made, other cost components such as transportation, labour costs and costs of bribery also need to be considered.
The estimates presented here need to be understood as an indication of the order of magnitude rather than as precise measurements. UNODC, in collaboration with CCDAC of Myanmar, are working on improving the accuracy of the estimates.
28 For a detailed description of the calculation of conversion ratios see “UNODC/MCN Afghanistan opium survey 2014” and “UNODC/MCN Afghanistan opium survey 2017 – Challenges to sustainable development, peace and security”.

Myanmar Opium Survey 2018
22
3. ERADICATION AND SEIZURES

Myanmar Opium Survey 2018
25
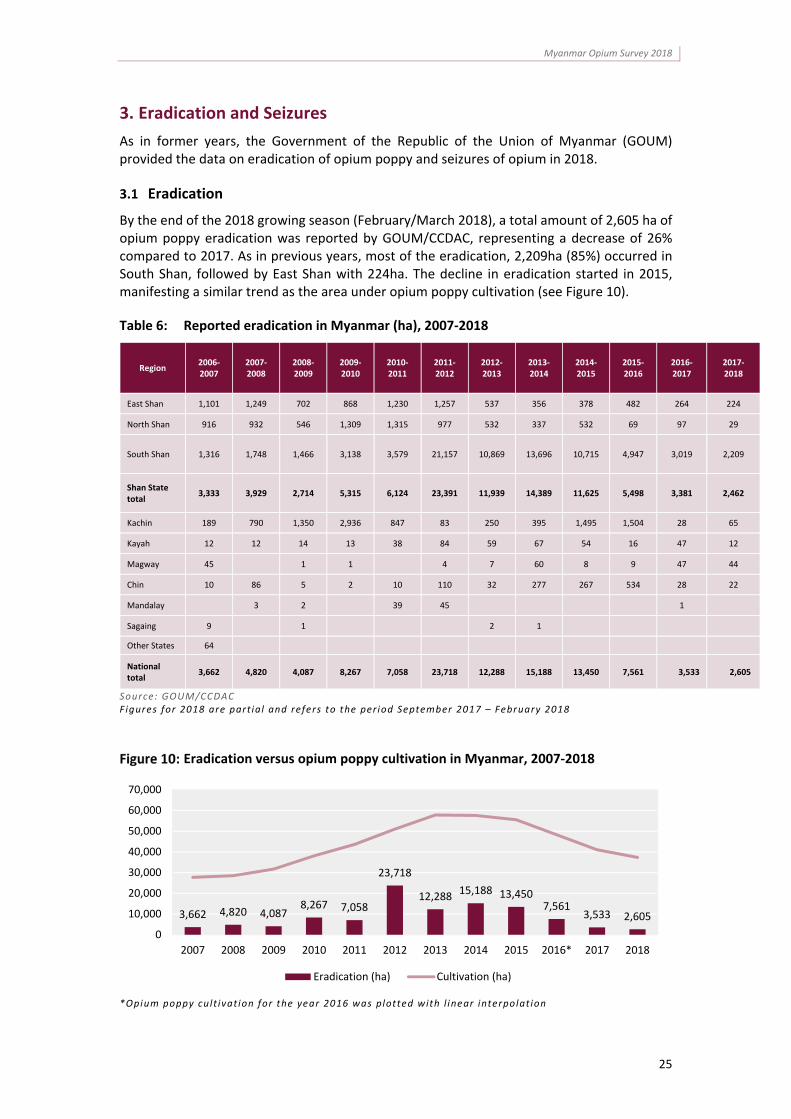
3. Eradication and Seizures As in former years, the Government of the Republic of the Union of Myanmar (GOUM) provided the data on eradication of opium poppy and seizures of opium in 2018.
3.1 Eradication
By the end of the 2018 growing season (February/March 2018), a total amount of 2,605 ha of opium poppy eradication was reported by GOUM/CCDAC, representing a decrease of 26% compared to 2017. As in previous years, most of the eradication, 2,209ha (85%) occurred in South Shan, followed by East Shan with 224ha. The decline in eradication started in 2015, manifesting a similar trend as the area under opium poppy cultivation (see Figure 10).
Table 6: Reported eradication in Myanmar (ha), 2007‐2018
Region 2006‐2007
2007‐2008
2008‐2009
2009‐2010
2010‐2011
2011‐2012
2012‐2013
2013‐2014
2014‐2015
2015‐2016
2016‐2017
2017‐2018
East Shan 1,101 1,249 702 868 1,230 1,257 537 356 378 482 264 224
North Shan 916 932 546 1,309 1,315 977 532 337 532 69 97 29
South Shan 1,316 1,748 1,466 3,138 3,579 21,157 10,869 13,696 10,715 4,947 3,019 2,209
Shan State total
3,333 3,929 2,714 5,315 6,124 23,391 11,939 14,389 11,625 5,498 3,381 2,462
Kachin 189 790 1,350 2,936 847 83 250 395 1,495 1,504 28 65
Kayah 12 12 14 13 38 84 59 67 54 16 47 12
Magway 45 1 1 4 7 60 8 9 47 44
Chin 10 86 5 2 10 110 32 277 267 534 28 22
Mandalay 3 2 39 45 1
Sagaing 9 1 2 1
Other States 64
National total
3,662 4,820 4,087 8,267 7,058 23,718 12,288 15,188 13,450 7,561 3,533 2,605
Source: GOUM/CCDAC Figures for 2018 are part ial and refers to the period September 2017 – February 2018
Eradication versus opium poppy cultivation in Myanmar, 2007‐2018
*Opium poppy cult ivat ion for the year 2016 was plotted with l inear interpolat ion
3,662 4,820 4,0878,267 7,058
23,718
12,28815,188 13,450
7,5613,533 2,605
0
10,000
20,000
30,000
40,000
50,000
60,000
70,000
2007 2008 2009 2010 2011 2012 2013 2014 2015 2016* 2017 2018
Eradication (ha) Cultivation (ha)

Myanmar Opium Survey 2018
26
Map 4: Reported eradication of opium poppy and seizures of opium products and processing laboratories, Myanmar (2017‐2018)
Myanmar Opium Survey 2018
27
Most of the locations in South Shan where eradication took place overlapped with areas with high to very high opium poppy density. Map 4 shows eradication patterns in South Shan which follow the high to very high‐density cultivation in mountainous areas. On the contrary, eradication activities in East Shan presented a more irregular and dispersed pattern, covering different density levels, from low to very high.
In North Shan only very little eradication was reported, equivalent to 29ha. This was concentrated in the south, near the border with Wa State. The lower reporting of GOUM activities in North Shan is probably related to the presence of different armed groups and numerous security incidents (Maps 1 and 2).
In Kachin State, only some eradication was reported at the border with China (65ha), whilst there was no reporting from other medium to high density areas, like the region surrounding Tanai town. Finally, in the north of Chin state a few eradication points (22ha) were reported, located at the eastern side of the Manipur River.
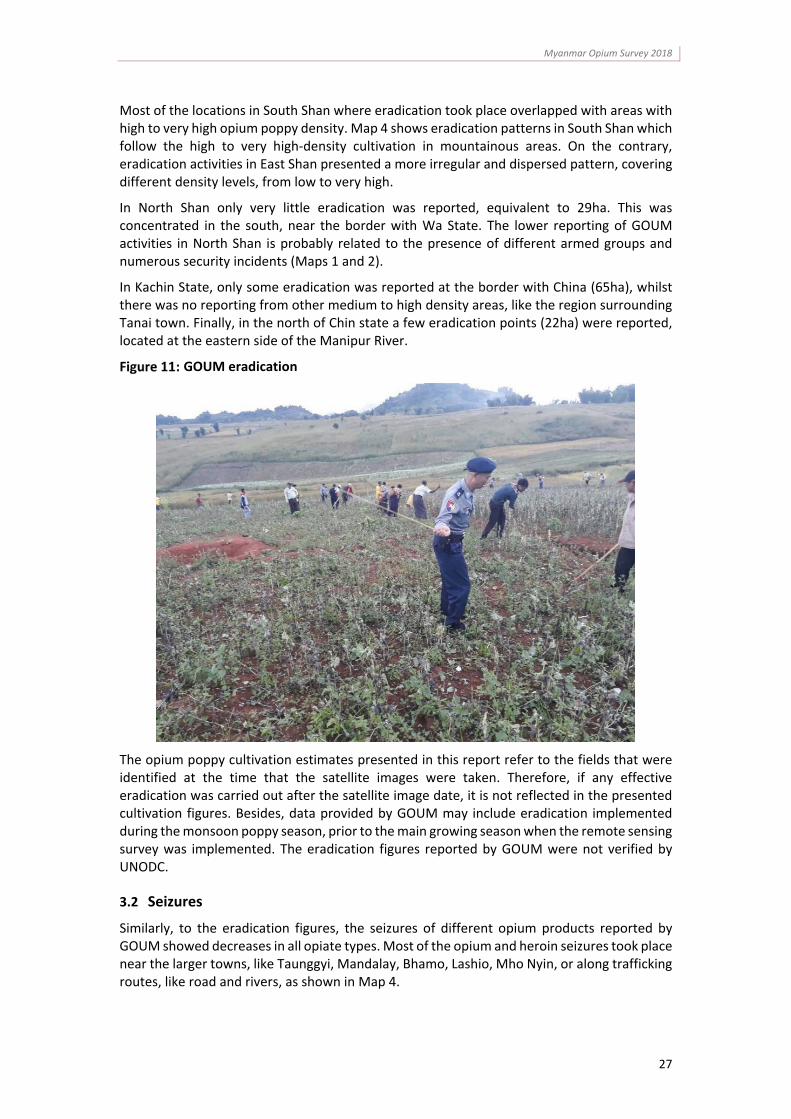
GOUM eradication
The opium poppy cultivation estimates presented in this report refer to the fields that were identified at the time that the satellite images were taken. Therefore, if any effective eradication was carried out after the satellite image date, it is not reflected in the presented cultivation figures. Besides, data provided by GOUM may include eradication implemented during the monsoon poppy season, prior to the main growing season when the remote sensing survey was implemented. The eradication figures reported by GOUM were not verified by UNODC.
3.2 Seizures
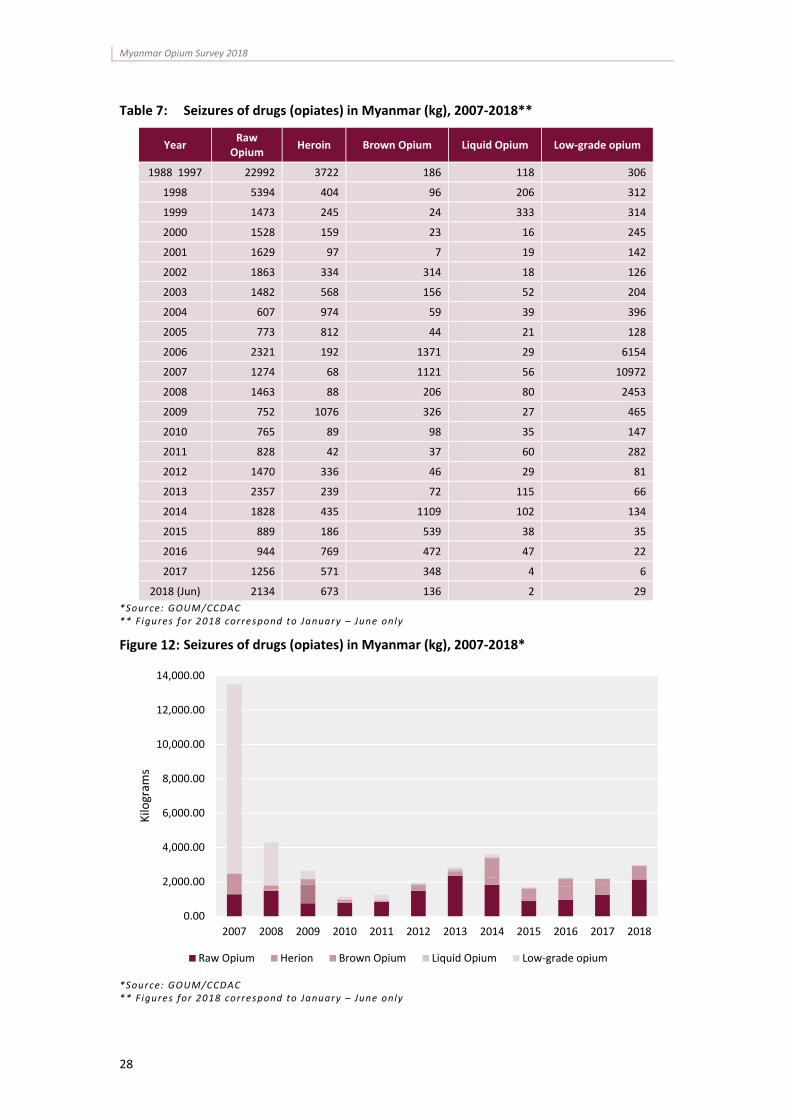
Similarly, to the eradication figures, the seizures of different opium products reported by GOUM showed decreases in all opiate types. Most of the opium and heroin seizures took place near the larger towns, like Taunggyi, Mandalay, Bhamo, Lashio, Mho Nyin, or along trafficking routes, like road and rivers, as shown in Map 4.
Myanmar Opium Survey 2018
28
Table 7: Seizures of drugs (opiates) in Myanmar (kg), 2007‐2018**
Year Raw Opium
Heroin Brown Opium Liquid Opium Low‐grade opium
1988 1997 22992 3722 186 118 306
1998 5394 404 96 206 312
1999 1473 245 24 333 314
2000 1528 159 23 16 245
2001 1629 97 7 19 142
2002 1863 334 314 18 126
2003 1482 568 156 52 204
2004 607 974 59 39 396
2005 773 812 44 21 128
2006 2321 192 1371 29 6154
2007 1274 68 1121 56 10972
2008 1463 88 206 80 2453
2009 752 1076 326 27 465
2010 765 89 98 35 147
2011 828 42 37 60 282
2012 1470 336 46 29 81
2013 2357 239 72 115 66
2014 1828 435 1109 102 134
2015 889 186 539 38 35
2016 944 769 472 47 22
2017 1256 571 348 4 6
2018 (Jun) 2134 673 136 2 29
*Source: GOUM/CCDAC ** Figures for 2018 correspond to January – June only
Seizures of drugs (opiates) in Myanmar (kg), 2007‐2018*
*Source: GOUM/CCDAC ** Figures for 2018 correspond to January – June only
0.00
2,000.00
4,000.00
6,000.00
8,000.00
10,000.00
12,000.00
14,000.00
2007 2008 2009 2010 2011 2012 2013 2014 2015 2016 2017 2018
Kilogram
s
Raw Opium Herion Brown Opium Liquid Opium Low‐grade opium

4. METHODOLOGY

Myanmar Opium Survey 2018
31
4. Methodology
The 2018 opium survey included three components:
1. Estimation of opium poppy cultivation area throughout North Shan, East Shan, South Shan, Kachin, Kayah and Chin states. The area estimation survey was based on the use of satellite images as the primary source of data, which was supplemented by field surveys to provide ground‐truthing that supports the interpretation of opium poppy fields;
2. Crop yield estimation survey throughout South Shan, North Shan and East Shan. Due to ongoing conflicts and insecurity, crop yield measurements could not be conducted in Kachin state;
3. A socio‐economic (village) survey in poppy growing areas of North Shan, East Shan and South Shan. An in‐depth analysis of the results will be presented in a separate report, expected to be ready in early 2019.
4.1 Area estimation
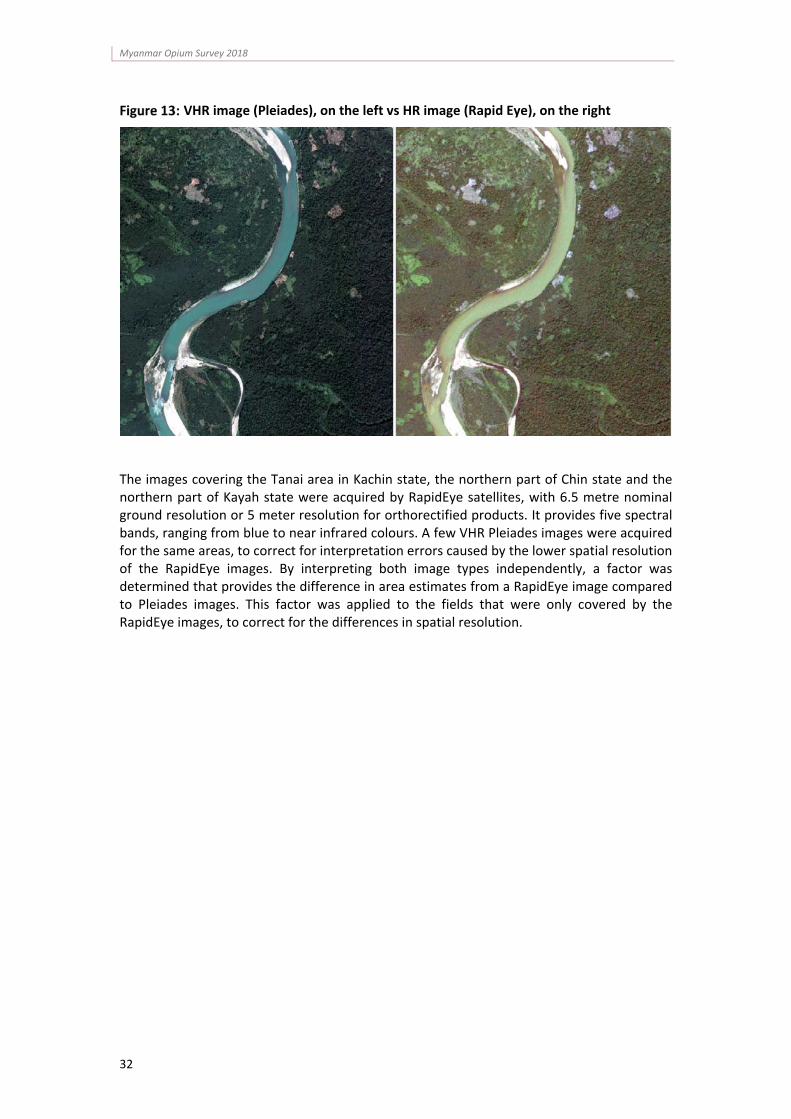
Remote sensing imagery
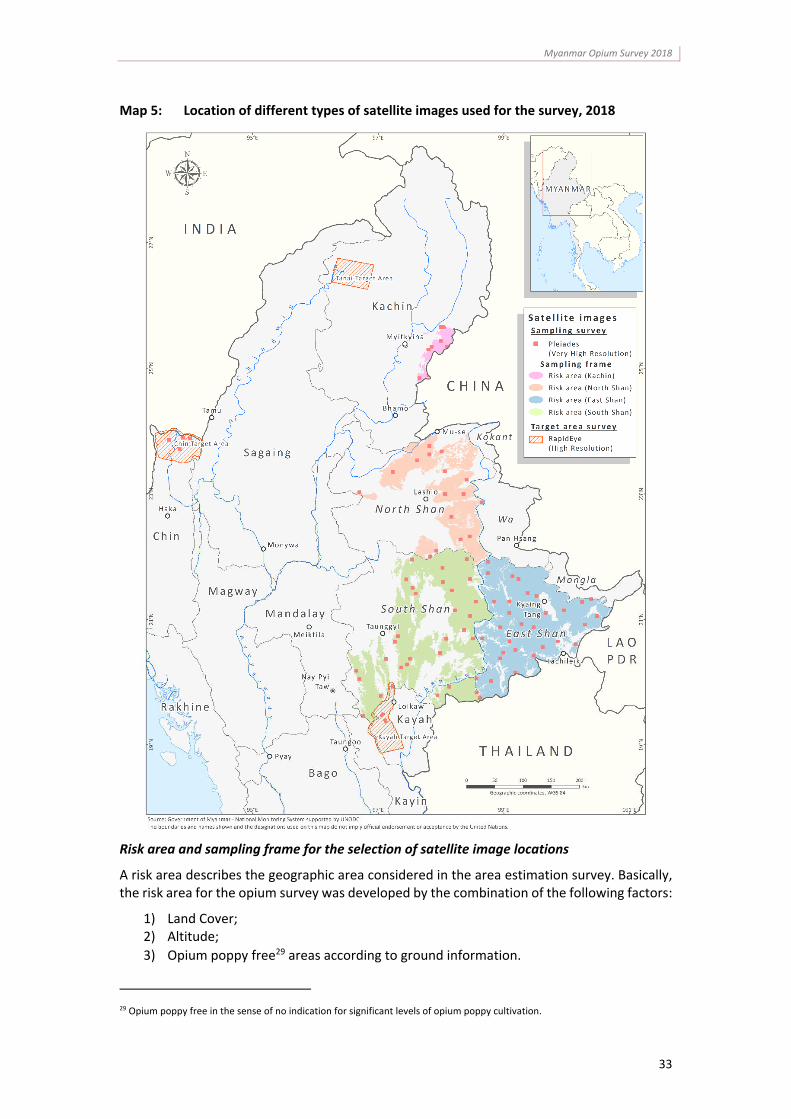
The area estimation to monitor the extent of opium poppy cultivation in Myanmar was carried out by means of remote sensing techniques. North, East and South Shan in Shan State, the eastern zone of Kachin State as well as the northern regions of Kayah and Chin States were surveyed. Satellite imagery were acquired following two approaches (Map 5):
1) A sampling approach with a selection of randomly selected squared segments; this was used for the three Shan regions and the south‐eastern part of Kachin (see Sample approach section);
2) A full coverage approach with larger, targeted images; this was applied for the Tanai area of Kachin state, the northern part of Chin state and the northern part of Kayah (see Target area selection and Interpretation section).
The images used for the sampling areas were Very High Resolution (VHR) satellite images, whilst a combination of VHR and High‐resolution images were used for the targeted areas.
The VHR images at the sample locations were taken by Pleiades satellites, which provides images of 2 metre ground resolution with four spectral bands (blue, green, red and infra‐red) and a 50‐centimetre panchromatic band. For every location (sample segment), two images were acquired with an approximate five‐week interval; one image was taken in December or January and the other between February and March. These two dates correspond to the pre‐ and post‐harvest periods of poppy, thus facilitating the identification and discrimination from other land cover classes. To determine the image acquisition dates, the regional differences between the crop calendars were considered.
Myanmar Opium Survey 2018
32
VHR image (Pleiades), on the left vs HR image (Rapid Eye), on the right
The images covering the Tanai area in Kachin state, the northern part of Chin state and the northern part of Kayah state were acquired by RapidEye satellites, with 6.5 metre nominal ground resolution or 5 meter resolution for orthorectified products. It provides five spectral bands, ranging from blue to near infrared colours. A few VHR Pleiades images were acquired for the same areas, to correct for interpretation errors caused by the lower spatial resolution of the RapidEye images. By interpreting both image types independently, a factor was determined that provides the difference in area estimates from a RapidEye image compared to Pleiades images. This factor was applied to the fields that were only covered by the RapidEye images, to correct for the differences in spatial resolution.
Myanmar Opium Survey 2018
33
Map 5: Location of different types of satellite images used for the survey, 2018
Risk area and sampling frame for the selection of satellite image locations
A risk area describes the geographic area considered in the area estimation survey. Basically, the risk area for the opium survey was developed by the combination of the following factors:
1) Land Cover; 2) Altitude;
3) Opium poppy free29 areas according to ground information.
29 Opium poppy free in the sense of no indication for significant levels of opium poppy cultivation.
Myanmar Opium Survey 2018
34
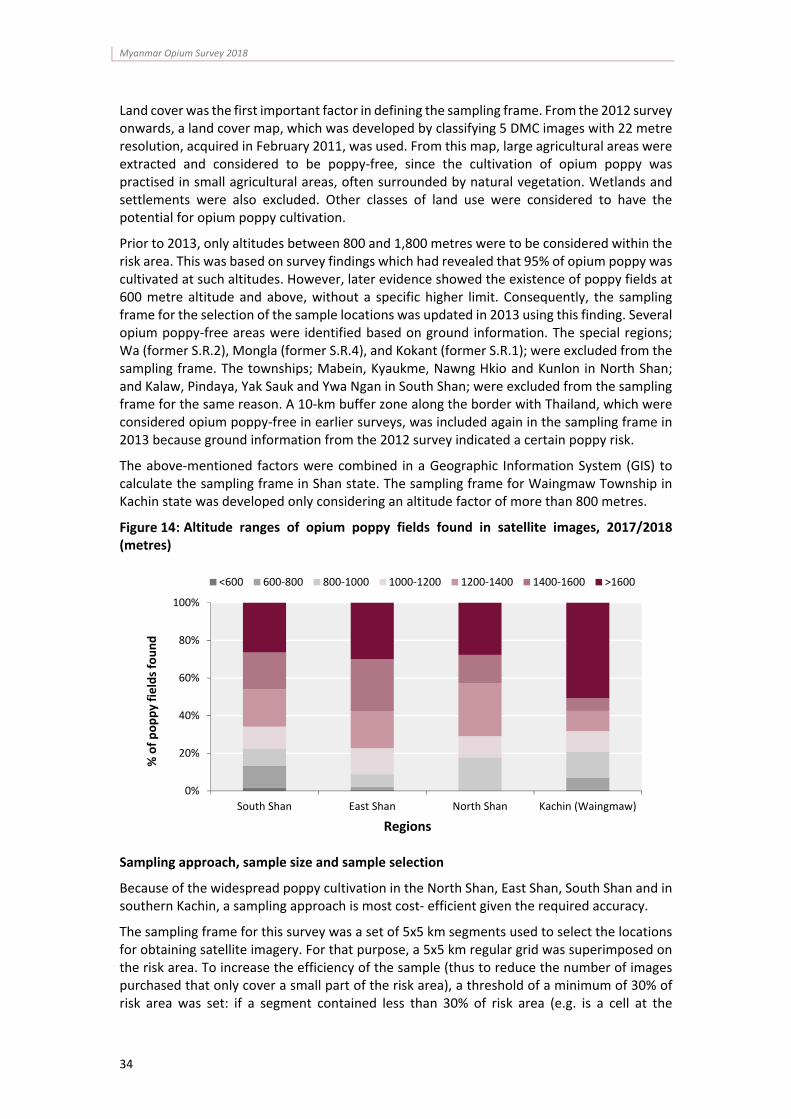
Land cover was the first important factor in defining the sampling frame. From the 2012 survey onwards, a land cover map, which was developed by classifying 5 DMC images with 22 metre resolution, acquired in February 2011, was used. From this map, large agricultural areas were extracted and considered to be poppy‐free, since the cultivation of opium poppy was practised in small agricultural areas, often surrounded by natural vegetation. Wetlands and settlements were also excluded. Other classes of land use were considered to have the potential for opium poppy cultivation.
Prior to 2013, only altitudes between 800 and 1,800 metres were to be considered within the risk area. This was based on survey findings which had revealed that 95% of opium poppy was cultivated at such altitudes. However, later evidence showed the existence of poppy fields at 600 metre altitude and above, without a specific higher limit. Consequently, the sampling frame for the selection of the sample locations was updated in 2013 using this finding. Several opium poppy‐free areas were identified based on ground information. The special regions; Wa (former S.R.2), Mongla (former S.R.4), and Kokant (former S.R.1); were excluded from the sampling frame. The townships; Mabein, Kyaukme, Nawng Hkio and Kunlon in North Shan; and Kalaw, Pindaya, Yak Sauk and Ywa Ngan in South Shan; were excluded from the sampling frame for the same reason. A 10‐km buffer zone along the border with Thailand, which were considered opium poppy‐free in earlier surveys, was included again in the sampling frame in 2013 because ground information from the 2012 survey indicated a certain poppy risk.
The above‐mentioned factors were combined in a Geographic Information System (GIS) to calculate the sampling frame in Shan state. The sampling frame for Waingmaw Township in Kachin state was developed only considering an altitude factor of more than 800 metres.
Altitude ranges of opium poppy fields found in satellite images, 2017/2018 (metres)
Sampling approach, sample size and sample selection
Because of the widespread poppy cultivation in the North Shan, East Shan, South Shan and in southern Kachin, a sampling approach is most cost‐ efficient given the required accuracy.
The sampling frame for this survey was a set of 5x5 km segments used to select the locations for obtaining satellite imagery. For that purpose, a 5x5 km regular grid was superimposed on the risk area. To increase the efficiency of the sample (thus to reduce the number of images purchased that only cover a small part of the risk area), a threshold of a minimum of 30% of risk area was set: if a segment contained less than 30% of risk area (e.g. is a cell at the
0%
20%
40%
60%
80%
100%
South Shan East Shan North Shan Kachin (Waingmaw)
% of poppy fields found
Regions
<600 600‐800 800‐1000 1000‐1200 1200‐1400 1400‐1600 >1600
Myanmar Opium Survey 2018
35
boundary of the risk area), it was not included in the sampling frame. Nevertheless, in the extrapolation, the whole risk area is considered, with the underlying assumption that the area outside of the frame behaves on average as the area inside the sampling frame.
In 2018, the same samples were used as selections for the survey of 2015, totalling 84 segments. Due to budget constraints, in 2017, only half of this number were sampled, however taken from the same sample set (see Myanmar Opium Survey 2017).
Table 8: Sample size allocation in 2018
Region Sample size 2017 Sample size 2018 Number of geo‐strata 2017
Number of geo‐strata 2018
East Shan 14 30 7 15
South Shan 16 30 8 15
North Shan 8 16 4 8
Kachin 8 8 4 4
Total 46 84 23 42
Since the same samples are used in 2015 and 2018, the 2015 selection method is explained. Firstly, the frame was separated by region. Here, each segment had to be assigned to exactly one per region: if the majority of the risk area is within that region, the segment was assigned to that region. Therefore, regional boundaries were in some sense generalized to fit the 5x5 km grid. Secondly, each sub frame (region) was divided into compact geographical strata of approximately equal area. In former surveys the definition of the strata was done manually but a clustering algorithm (“k‐means”) in the statistical software R30 package spcosa was applied in the 2014 Survey. In each stratum, two sampling locations were selected by simple random sampling. This sampling method provides a geographically well distributed sample and allowed the variance (uncertainty) to be estimated in an unbiased manner. See for more details the Myanmar Opium Survey of 2015.31
30 http://www.r‐project.org/ and package http://cran.r‐project.org/web/packages/spcosa/index.html
31 https://www.unodc.org/documents/crop‐monitoring/sea/Southeast_Asia_Opium_Survey_2015_web.pdf

Myanmar Opium Survey 2018
36
Map 6: Sampling frame and selected samples, 2018
Ground truth data collection
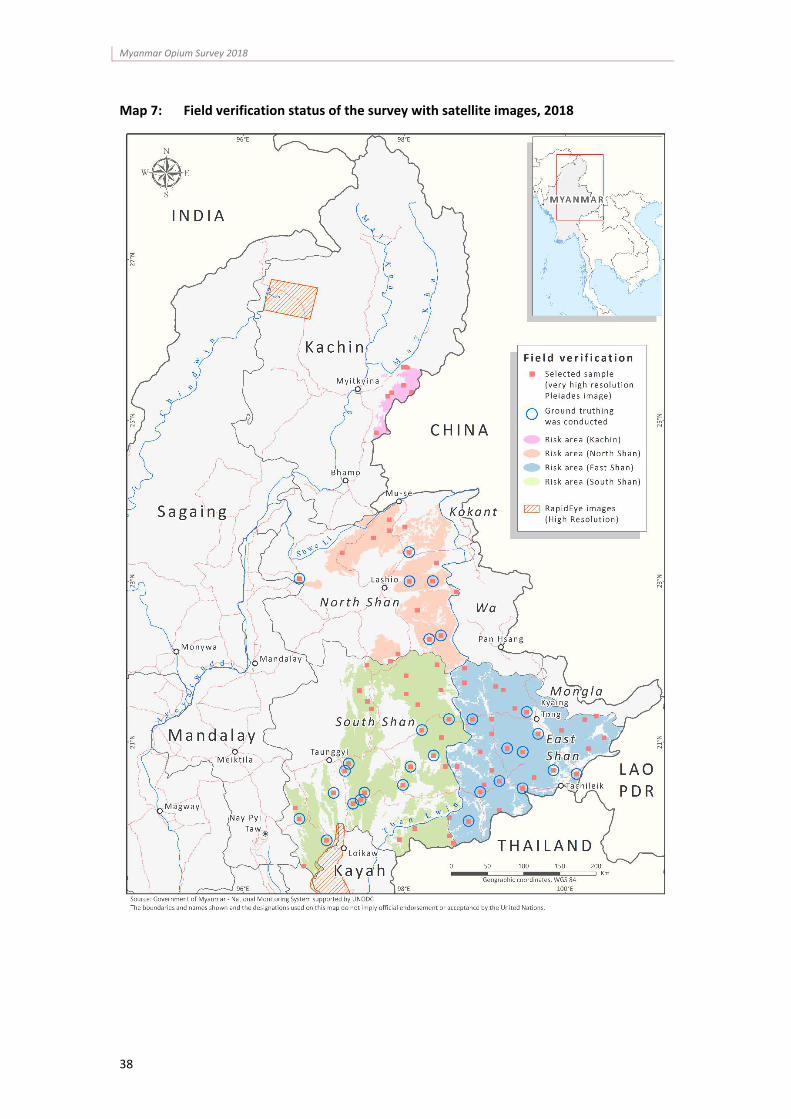
The opium poppy planted area estimation was conducted in collaboration with the Remote Sensing and GIS Section of the Forest Department, Ministry of Natural Resources and Environmental Conservation. Each year, field teams organized by the Department carried out ground truthing at the selected sample locations. In the 2018 survey, three teams organized by the Department carried out ground data collection in South Shan, East Shan and North Shan. All teams, each comprising two surveyors from the Forest Department and one officer from the local drug enforcement police, visited selected satellite sample sites during
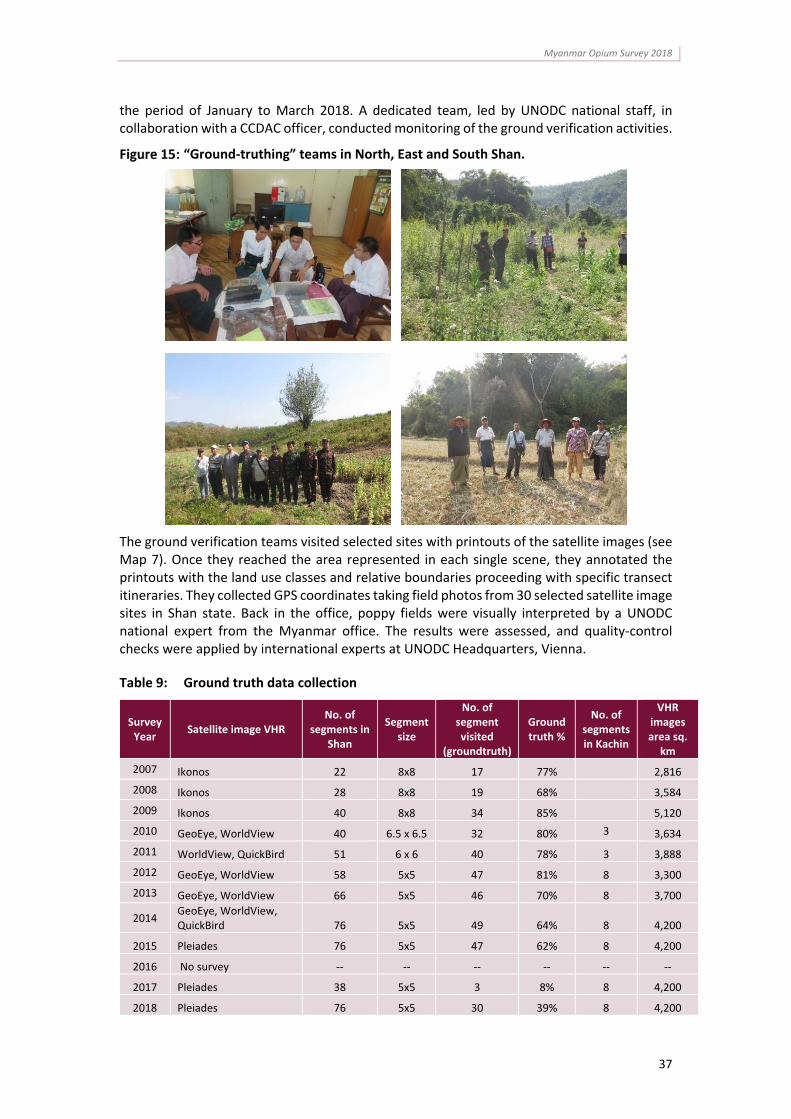
Myanmar Opium Survey 2018
37
the period of January to March 2018. A dedicated team, led by UNODC national staff, in collaboration with a CCDAC officer, conducted monitoring of the ground verification activities.
“Ground‐truthing” teams in North, East and South Shan.
The ground verification teams visited selected sites with printouts of the satellite images (see Map 7). Once they reached the area represented in each single scene, they annotated the printouts with the land use classes and relative boundaries proceeding with specific transect itineraries. They collected GPS coordinates taking field photos from 30 selected satellite image sites in Shan state. Back in the office, poppy fields were visually interpreted by a UNODC national expert from the Myanmar office. The results were assessed, and quality‐control checks were applied by international experts at UNODC Headquarters, Vienna.
Table 9: Ground truth data collection
Survey Year
Satellite image VHR No. of
segments in Shan
Segment size
No. of segment visited
(groundtruth)
Ground truth %
No. of segments in Kachin
VHR images area sq. km
2007 Ikonos 22 8x8 17 77% 2,816
2008 Ikonos 28 8x8 19 68% 3,584
2009 Ikonos 40 8x8 34 85% 5,120
2010 GeoEye, WorldView 40 6.5 x 6.5 32 80% 3 3,634
2011 WorldView, QuickBird 51 6 x 6 40 78% 3 3,888
2012 GeoEye, WorldView 58 5x5 47 81% 8 3,300
2013 GeoEye, WorldView 66 5x5 46 70% 8 3,700
2014 GeoEye, WorldView, QuickBird 76 5x5 49 64% 8 4,200
2015 Pleiades 76 5x5 47 62% 8 4,200
2016 No survey ‐‐ ‐‐ ‐‐ ‐‐ ‐‐ ‐‐
2017 Pleiades 38 5x5 3 8% 8 4,200
2018 Pleiades 76 5x5 30 39% 8 4,200
Myanmar Opium Survey 2018
38
Map 7: Field verification status of the survey with satellite images, 2018
Myanmar Opium Survey 2018
39
Target area selection and interpretation
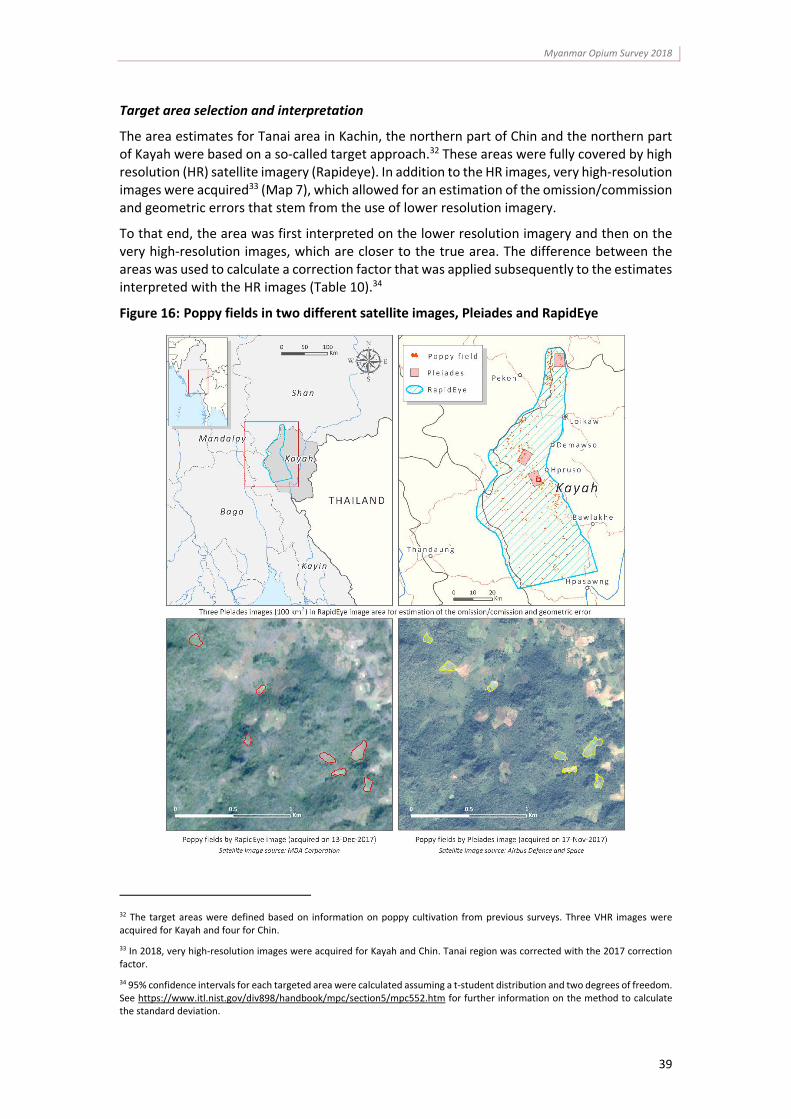
The area estimates for Tanai area in Kachin, the northern part of Chin and the northern part of Kayah were based on a so‐called target approach.32 These areas were fully covered by high resolution (HR) satellite imagery (Rapideye). In addition to the HR images, very high‐resolution images were acquired33 (Map 7), which allowed for an estimation of the omission/commission and geometric errors that stem from the use of lower resolution imagery.
To that end, the area was first interpreted on the lower resolution imagery and then on the very high‐resolution images, which are closer to the true area. The difference between the areas was used to calculate a correction factor that was applied subsequently to the estimates interpreted with the HR images (Table 10).34
Poppy fields in two different satellite images, Pleiades and RapidEye
32 The target areas were defined based on information on poppy cultivation from previous surveys. Three VHR images were acquired for Kayah and four for Chin.
33 In 2018, very high‐resolution images were acquired for Kayah and Chin. Tanai region was corrected with the 2017 correction factor.
34 95% confidence intervals for each targeted area were calculated assuming a t‐student distribution and two degrees of freedom. See https://www.itl.nist.gov/div898/handbook/mpc/section5/mpc552.htm for further information on the method to calculate the standard deviation.
Myanmar Opium Survey 2018
40
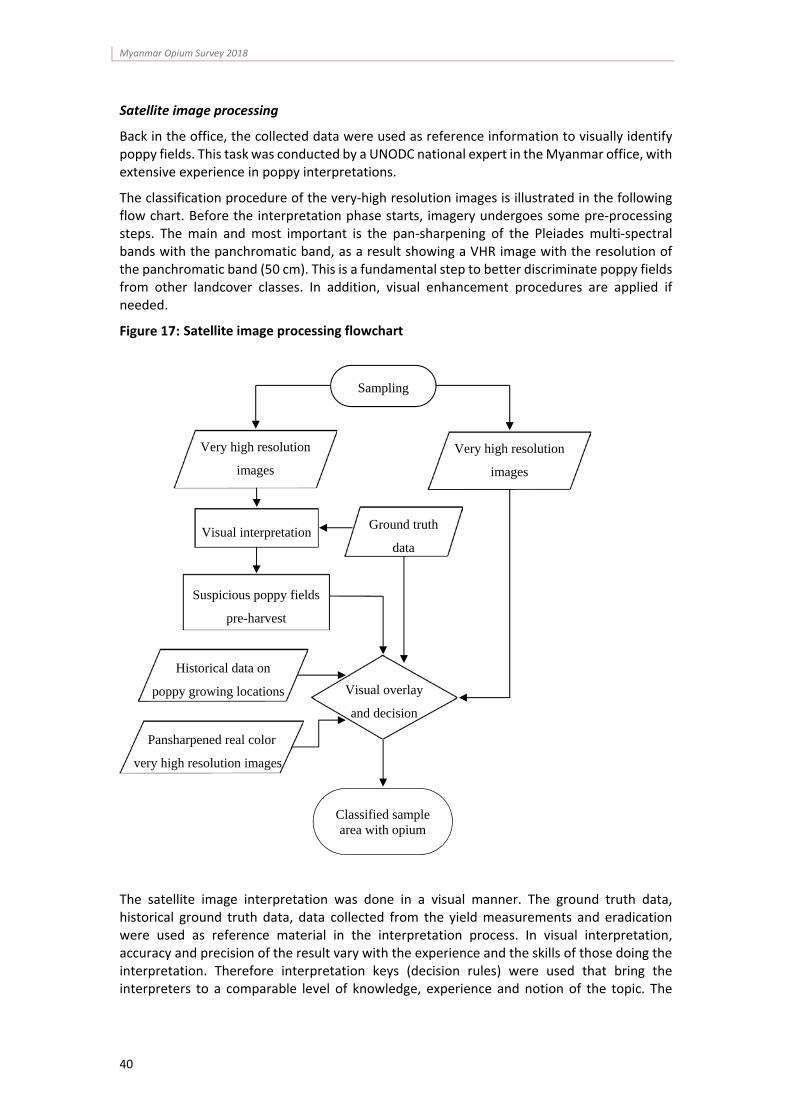
Satellite image processing
Back in the office, the collected data were used as reference information to visually identify poppy fields. This task was conducted by a UNODC national expert in the Myanmar office, with extensive experience in poppy interpretations.
The classification procedure of the very‐high resolution images is illustrated in the following flow chart. Before the interpretation phase starts, imagery undergoes some pre‐processing steps. The main and most important is the pan‐sharpening of the Pleiades multi‐spectral bands with the panchromatic band, as a result showing a VHR image with the resolution of the panchromatic band (50 cm). This is a fundamental step to better discriminate poppy fields from other landcover classes. In addition, visual enhancement procedures are applied if needed.
Satellite image processing flowchart
The satellite image interpretation was done in a visual manner. The ground truth data, historical ground truth data, data collected from the yield measurements and eradication were used as reference material in the interpretation process. In visual interpretation, accuracy and precision of the result vary with the experience and the skills of those doing the interpretation. Therefore interpretation keys (decision rules) were used that bring the interpreters to a comparable level of knowledge, experience and notion of the topic. The
Sampling
Very high resolution
images
Visual interpretation
Visual overlay
and decision
Classified sample area with opium
Very high resolution
images
Suspicious poppy fields
pre-harvest
Ground truth
data
Historical data on
poppy growing locations
Pansharpened real color
very high resolution images
Myanmar Opium Survey 2018
41
interpretation keys use features of poppy fields such as tone, colour, shape or texture, in addition to context information and knowledge about the area.
The images taken in the second round were used to observe changes in possible poppy‐growing fields. If there was an apparent change that corresponded to the harvesting of the poppy, it was used to confirm that the field was indeed a poppy field. Since the images were not geometrically corrected an automation was not possible due to the possible displacements of the fields in question.
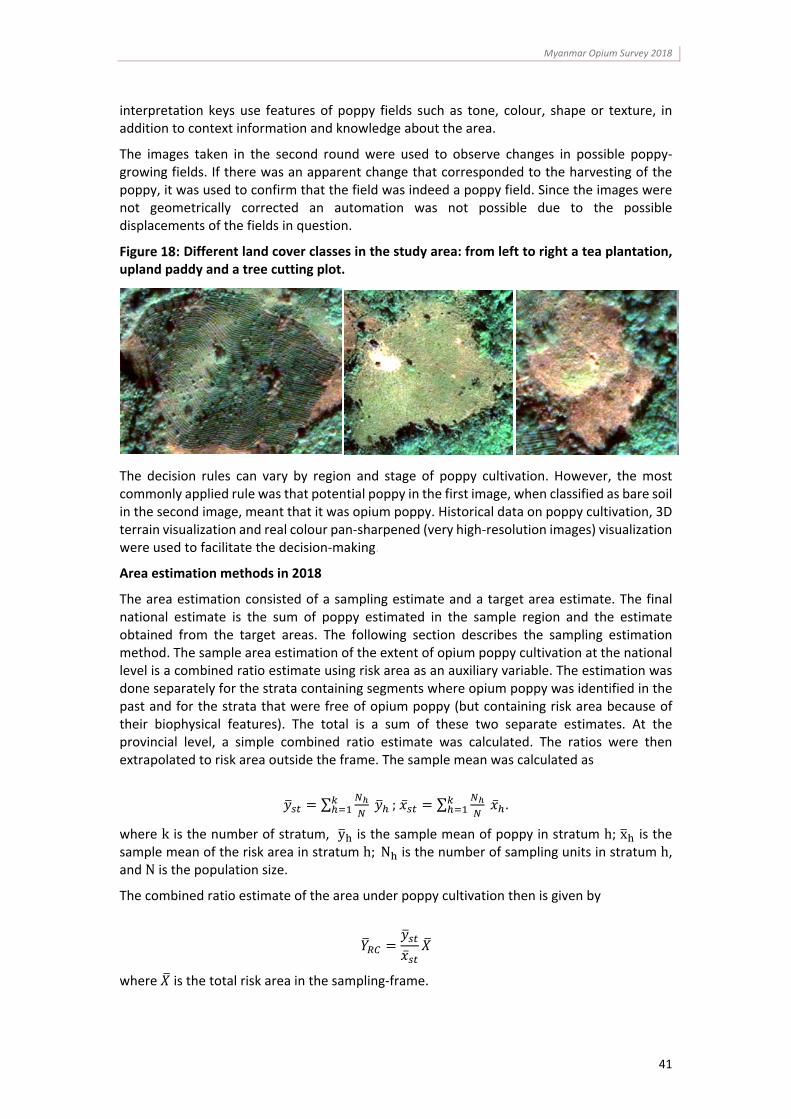
Different land cover classes in the study area: from left to right a tea plantation, upland paddy and a tree cutting plot.
The decision rules can vary by region and stage of poppy cultivation. However, the most commonly applied rule was that potential poppy in the first image, when classified as bare soil in the second image, meant that it was opium poppy. Historical data on poppy cultivation, 3D terrain visualization and real colour pan‐sharpened (very high‐resolution images) visualization were used to facilitate the decision‐making.
Area estimation methods in 2018
The area estimation consisted of a sampling estimate and a target area estimate. The final national estimate is the sum of poppy estimated in the sample region and the estimate obtained from the target areas. The following section describes the sampling estimation method. The sample area estimation of the extent of opium poppy cultivation at the national level is a combined ratio estimate using risk area as an auxiliary variable. The estimation was done separately for the strata containing segments where opium poppy was identified in the past and for the strata that were free of opium poppy (but containing risk area because of their biophysical features). The total is a sum of these two separate estimates. At the provincial level, a simple combined ratio estimate was calculated. The ratios were then extrapolated to risk area outside the frame. The sample mean was calculated as
∑ ; ∑ .
where k is the number of stratum, y is the sample mean of poppy in stratum h; x is the sample mean of the risk area in stratum h;N is the number of sampling units in stratum h, and N is the population size.
The combined ratio estimate of the area under poppy cultivation then is given by
where is the total risk area in the sampling‐frame.
Myanmar Opium Survey 2018
42
The confidence intervals for the national estimate were calculated by using standard statistical methods for combined ratio estimators.
Bootstrapping35 was performed to estimate the confidence intervals of the provincial estimates. This was necessary as the heavily skewed distribution of opium poppy in the samples led to unrealistic confidence intervals when applying the standard methods. Although bootstrapping is considered to be an appropriate choice in such situations, UNODC is undertaking further research to assess if this is the case in all situations.
Table 10: Estimated poppy cultivation areas for the sampled areas, by region, 2017 and 2018
2017 2018 Difference
2017‐2018
East Shan 11,003 10,095 ‐8%
Kachin 2,860 2,417 ‐15%*
North Shan 9,399 8,691 ‐8%*
South Shan 16,672 13,880 ‐17%
Total 39,933 36,021 ‐10%
Table 11: Estimated poppy cultivation areas for the targe areas, by region, 2018
Target area Survey Poppy Area before
correction factor Correction factor 2018
Survey Poppy Area (ha) after correction
factor
Tanai (Kachin State) 1,016 ‐7.64% 938
Chin 734 ‐14.85% 630
Kayah 613 ‐7.01% 570
Correct ion factor for Tanai corresponds to the value calculated in 2017. In 2018, VHR images were acquired for Chin and Kayah providing correct ion factors for 2018.
Opium poppy cultivation density map
The opium poppy cultivation density map was created combining two different approaches. For the targeted area (i.e., Tanai region) the density was directly calculated from the full coverage cultivation data of 2018, whereas for the sampled areas historical data from 2012 to 2018 were interpolated using the inverse distance weighting method (IDW). A total of 208 segments (5 x 5 km) were considered in the analysis, which have been assessed since 2012. In case of multiple observations for the same segment, the most recent data was applied.
4.2 Yield and potential opium production estimation
Collection of yield data
The 2018 field work campaign was conducted in North, South and East regions of Shan state and it was implemented by UNODC with support of local Drug Enforcement Units (former Anti‐Narcotic Task Forces). The teams were organized by CCDAC and formed by three UNODC national staff members from the Myanmar office as well as by an officer from the local Drug Enforcement Unit. Besides crop yield data, different socio‐economic variables were also collected by local survey teams.
35 http://cran.r‐project.org/web/packages/boot/index.html.
Myanmar Opium Survey 2018
43
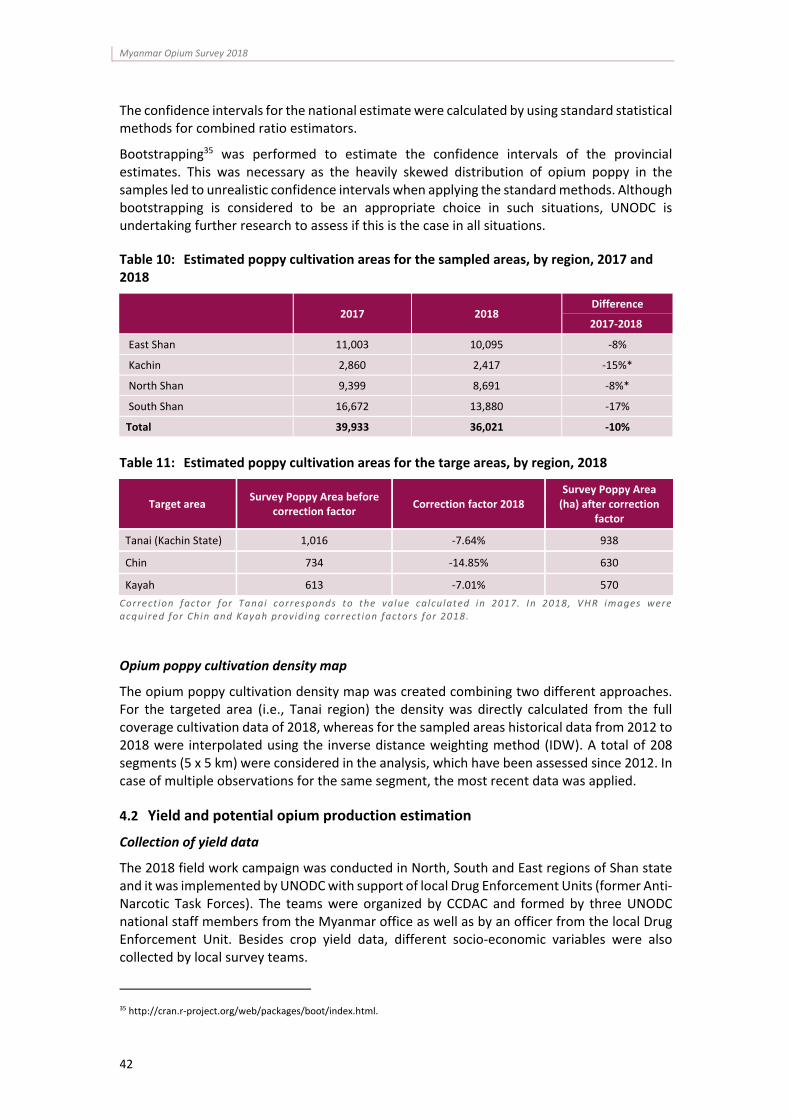
The villages were selected by opportunistic‐sampling method, considering the area accessibility and security as main determinant factors. A total number of 86 villages were visited in 15 different townships and 4 sub‐townships between the 3rd of December 2017 and March 2018. The field team followed the UNODC Guidelines for yield assessments. Field measurements were normally taken from three poppy fields in each village. The team selected mature opium poppy fields close to the village and selected fields with good, average and bad conditions from those mature fields. Once a field was selected, a transect was drawn through the field, along which three 1 m2 sample plots were defined (figure 18).
Yield data collection in the field.
In each plot, the numbers of flower buds, flowers, immature capsules and mature capsules expected to yield opium were counted, and the diameter and height of 10 to 14 lanced capsules were measured with a digital calliper (Figure 19). All the measurements were recorded by digital cameras for future QA/QC. Field data of a total 257 poppy fields were collected in the 2018 yield survey and a total of 7,547 poppy capsules were measured.

Myanmar Opium Survey 2018
44
Measuring poppy capsule diameter and height in Mauk Mai township, South Shan.
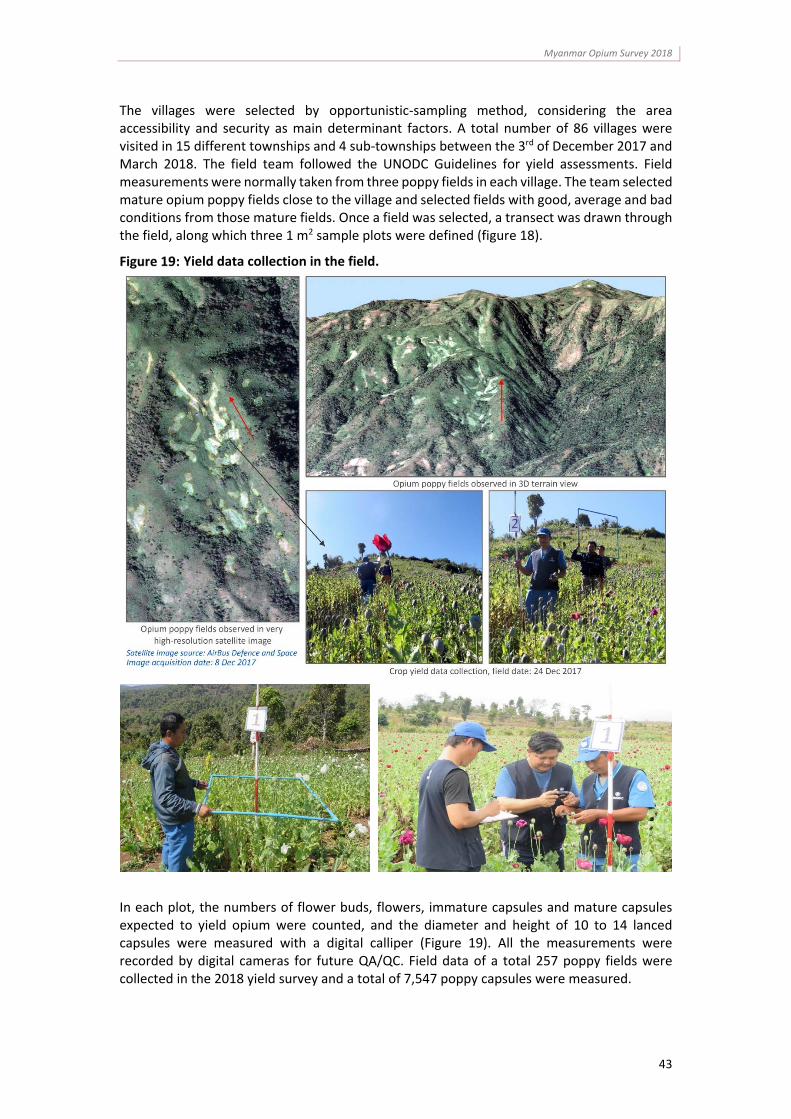
Data in South Shan was collected in 40 poppy growing villages located in 7 different townships (Hopong, Hsi Hseng, Pinlaung, Pekon, Mawkmai, Monae and Loilem). Yield data was taken from 119 poppy fields and 3513 capsules were measured.
In East Shan, yield data was collected in 38 poppy growing villages in 7 townships (Kyaing Tong, Mong Hpyat, Mong Khat, Metman, Mong Hsat, Mong Ton and Mong Pyin townships) from 16 Jan 2018 to 18 Feb 2018. Field measurement was carried out in 111 poppy fields and 3074 capsules were measured.
Finally, due to armed conflict issues in North Shan, the field team collected yield data in one township only. Data was collected from 9 poppy growing villages in Tang Yang township from 26 Feb 2018 to 4 Mar 2018. A total of 27 poppy fields were visited and 823 capsules measured.
Myanmar Opium Survey 2018
45
Map 8: Location of field visited in the framework of the yield survey in Myanmar, 2018
Myanmar Opium Survey 2018
46
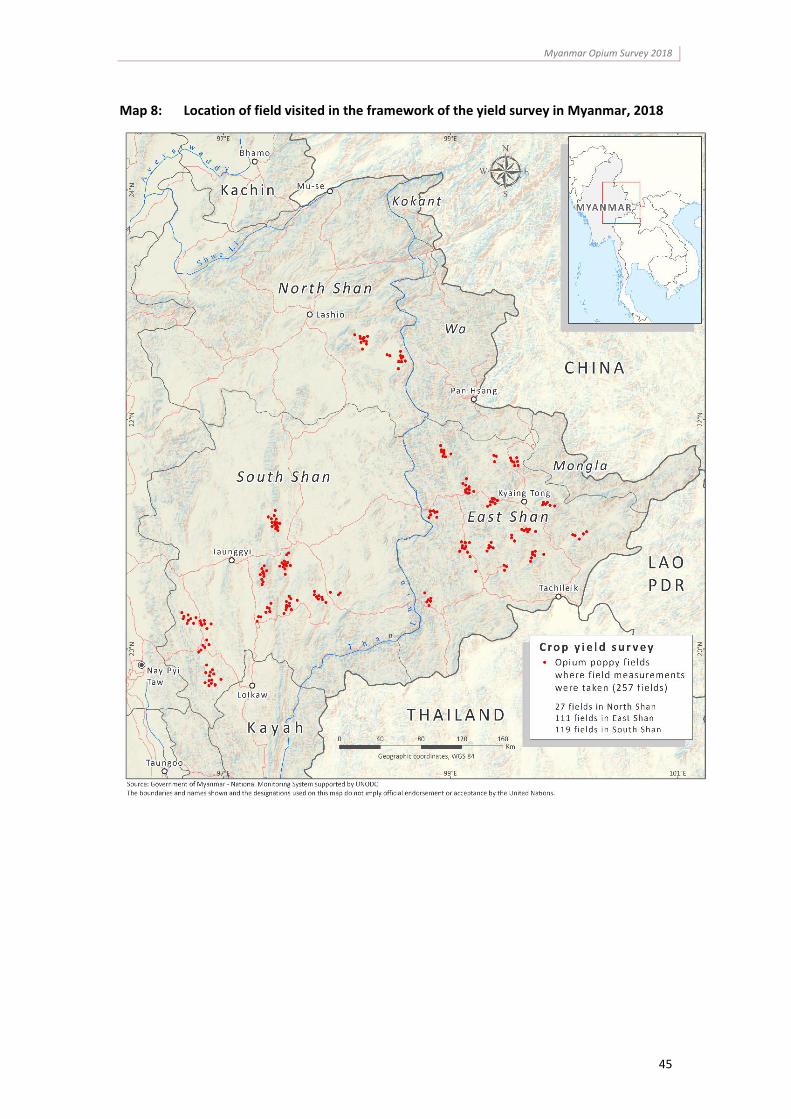
Table 12: Opium cultivation calendar Myanmar, 2017‐2018
Estimating potential opium yield
For the 2018 survey, the capsule volume per square metre was calculated and entered into the formula for the yield calculation. Each plot thus provided one yield observation. The simple average of the three plots in a field was the field yield. The yield by state was calculated as the simple average of all fields in a state.
For the 2018 survey, the capsule volume per square metre was calculated with these data and entered into the formula for the yield calculation. Each plot thus provided one yield observation. The simple average of the three plots in a field was the field yield. The yield by state was calculated as the simple average of all fields in a state.
Region Township Jun Jul Aug Sep Oct Nov Dec Jan Feb Mar Apr May
1. Pekon,
2. Pinlaung,
3.Hs i Hseng,
4.Nyaung Shwe
Round 2
Chin
1.TunzanRound 2
Round 1
2.TanaiRound 1
Round 2
Round 3
Kachin
1.Waingmaw
Round 1
7.Moemit, 8.Nam
Hsang, 9.Namtu,
10.Kutkai, 11.Manton,
12.Kunlon, 13.Muse,
14.Nam Hkam
Round 1
Round 2
Round 3
Round 3
Irrigated late crop
North Shan
1.Tang Yang, 2.Mong
Yai , 3.Thibaw,
4.Kyaukme, 5.Lashio,
6.Theinne
Round 1
Round 2
Round 3
Round 2
Round 1East Shan
1.Mong Ton, 2.Mong
Hsat, 3.Tachi leik,
4.Mong Hpyat
Round 1
Round 2
Irrigated late crop
5.Kyaing Tong,
6.Mong Yawng,
7.Mong Pyin, 8.Mong
Hkat, 9.Metman
Irrigated late crop
10.Mong Pan,
11.Loilem, 12.Kun
Heing, 13.Leicha,
14.Mong Shu, 15.Kyae
Thee, 16.Mong Kaing
Round 1
Round 2
Round 3
Round 2
Irrigated late crop
Round 2
South Shan
Monsoon cultivation
Round 1
5.Maukmai ,
6.Hopong, 7.Monae,
8.Nam Sang,
9.Linkhay
Round 1
Kayah 1.Loikaw,
2.Demawso, 3.Fruso
Monsoon cultivation
Round 1
Round 2
Myanmar Opium Survey 2018
47
For estimating potential opium yield, a relationship between poppy capsule volume per square metre and dry opium yield is used. The relationship is based on extensive field research and is described as:
1.89 0.0412
where Y is dry opium weight (kg/ha) and V is the mature capsule volume (cm3/m2).
This formula has been developed based on data collected in Thailand and emphasizes the lower end of observed capsule volume. It is based on data varying between 0 and 900 cm3/m2.
However, high volumes exceeding 900 cm3/m2 were observed (particularly in Kachin). The formula was not validated for these ranges and would supposedly overestimate yields. To avoid overestimation, an alternative formula was used for fields where at least one plot exceeded said volume. This formula was calibrated with combined data from Pakistan and Thailand, and reads as
1,495 – 1,495 – 395.259 .
1.795
A range was calculated to express the uncertainty of the yield estimate due to sampling with the 95% confidence interval.36
Estimating opium production
Opium production was calculated by region as the product between the estimated area under opium cultivation and the corresponding opium yield.
All opium estimates in this report are expressed in oven‐dry opium equivalent, i.e. the opium is assumed to contain 0% moisture. The same figure expressed in air‐dry opium, i.e. opium under “normal” conditions as traded, would be higher as such air‐dry opium contains some moisture.
The uncertainties of the opium production estimate combine those due to sampling for the area under poppy cultivation and those related to the yield estimate. These uncertainties were calculated by using the standard method for error propagation. The point estimates and uncertainties of the area under poppy cultivation and yield can be expressed as ap ±Δa and yp ± Δy respectively, where the uncertainty is determined from the 95% confidence intervals. These uncertainties will impact on the estimate of production (pp ± Δp, or equivalently expressed as the range [pp ‐ Δp, pp+Δp]), where the best estimate is pp = ap yp. Therefore,
Δppp
Δaap
Δyyp
expresses the error in production (Δp), resulting from uncertainty in the estimates for cultivation area and yield.
4.3 Estimating the value of opium economy in Myanmar
Estimating the value of the Myanmar opium economy implies evaluating the amounts of raw opium and heroin which are used either for the domestic consumption or for export, along with their prices at every link of the chain. This means estimating and then combining multiple factors, using the best available data.
36 1.96√ , where Y is the point estimate, n is the number of samples and σ is the standard deviation.
Myanmar Opium Survey 2018
48
Due to the scarcity of reliable and/or updated data, especially on purity and conversion factors, the degree of uncertainties is significant and infers the use of range rather than point estimates.
The key components of the opium economy which have been estimated to derive the gross and net values of the opium economy in Myanmar are:
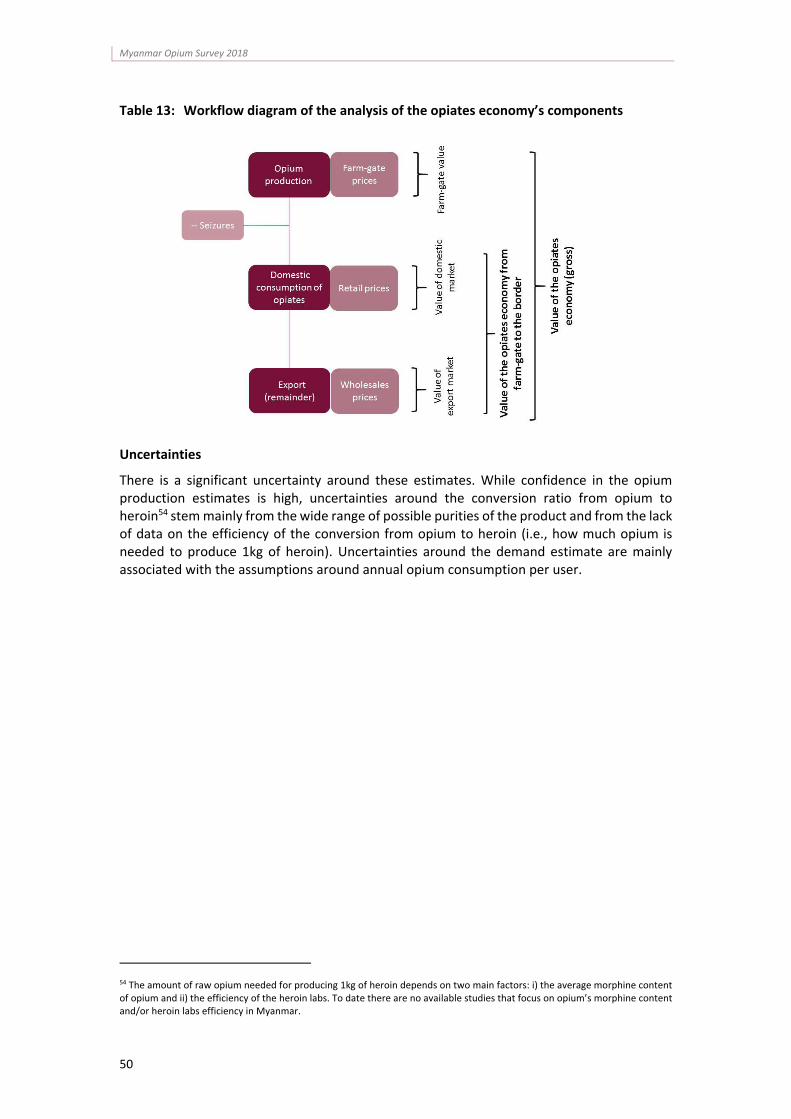
The farm‐gate value
The amounts of raw opium and heroin reaching the illicit end‐consumer markets
The value of opiates market for domestic use
The value of opiates potentially available for export
The farm‐gate value
It is derived directly from the potential production of dry opium. The price per kg of dry opium used for the calculation is the weighted average of the farm‐gate prices at harvest time of the three main producing regions of Shan state.37 The lower and upper bounds of the farm‐gate value reflect the range of the opium production estimate.
The amounts of raw opium and heroin reaching the illicit end‐consumer markets
Opium can be either consumed as raw opium or further processed into heroin. Starting from the production figures, the estimate of the share of unprocessed opium entering the illicit markets is based on the direct opium consumption in the East Asia region38 and the comparison of the opium production levels between Myanmar and Laos,39 which are supposedly the only opium providing countries in the region.40 The remaining opium, after discounting opium seizures,41 is deemed to be processed into heroin. A ratio of 10:1 is used for converting opium to heroin of unknown purity42 and, after subtracting the reported heroin seizures,43 the amount of heroin reaching the end‐consumer markets is obtained.
The value of opiates market for domestic use
The value of the domestic opiates market is given by:
(annual estimated domestic opium consumption x typical retail opium price)
+
(annual estimated domestic heroin consumption x typical retail heroine price adjusted for purity)
37 Farm‐gate prices at harvest time of dry opium in North, East and South Shan were collected during the 2018 socio‐economic survey.
38 Source: Transnational Organized Crime in East Asia and the Pacific – A Threat Assessment (TOCTA‐EAP), (UNODC, 2013).
39 Source: Southeast Asia Opium Survey 2015 – Lao PDR, Myanmar (UNODC, 2015).
40 See World Drug Report 2018. The assumption is that the ratio between total opium production and unprocessed opium is the same for the two countries.
41 HONLEA by September 2018 reported the seizure of 2.566 tons of opium, the annual figure was extrapolated multiplying by 4/3.
42 For countries other than Afghanistan, a traditional conversion ratio of opium to heroin of 10:1 is used (cfr. World Drug Report 2018, vol.2, p.51).
43 HONLEA by September 2018 reported the seizure of 751 kg of heroin, the annual figure was extrapolated multiplying by 4/3.
Myanmar Opium Survey 2018
49
The estimates of opium and heroin consumed in Myanmar are based on:
The prevalence of opiates use44 in the country.
The respective proportions of opium and heroin users.45
The Myanmar population between 15 and 64 years old.46
The annual heroin47 and opium48 average consumption rates.
The retail prices of opium49 and heroin50 are taken from the Myanmar Annual Reports Questionnaire (ARQ). Heroin’s street price has been adjusted for purity, resulting in a range due to the uncertainties related to the purity of the retail market’s heroin.51
The value of opiates potentially available for export
The amounts of opiates potentially available for export are derived by subtracting the domestic consumption from the opiates reaching the illicit market. The obtained opium and heroin quantities are then multiplied by the respective wholesale prices52 and summed to each other to find the value of the opiates export.
Gross and net values of opiates economy in Myanmar
The gross value of the opiate economy is the sum of the value of the domestic market and the value of opiates believed to be exported.53 The estimate of the value of manufacture and trafficking of opiates to the border excludes the farm‐gate value, which is paid by first level traffickers to the farmers. A detailed analysis of the profits made at each stage need to consider other costs associated to the illicit drug business, for instance those related to manufacture and distribution, most importantly precursor substances. Due to lack of data it was not possible to include the above‐mentioned components in this analysis.
44Annual prevalence for opiates is 0.8%. Source: World Drug Report 2018 (UNODC, 2018).
45 Derived from 2017 treatment data provided by the Central Committee on Drug Abuse control of Myanmar. Heroin users represent the 94.9% of opiates users, opium users the 5.1%.
46 Source: World Bank.
47 The global annual average value of 28g of heroin is used. Source: World Drug Report 2005, vol.1, chapter 2. (UNODC, 2005)
48 A value of 770g of opium for yearly consumption is used. Source: Drug Use in Afghanistan (Afghanistan Ministry of Counter‐narcotics/ Afghanistan Ministry of Health/ UNODC, 2009).
49 Source: ARQ 2010.
50 Source: ARQ 2017.
51 Due to the lack of data on street heroin’s purity in Myanmar, Cambodia 2016 ARQ data are used, which recorded a retail purity ranging from 42 to 80%.
52 Wholesale opium price is taken from the Myanmar 2014 ARQ. Wholesale heroin price is taken from the Myanmar 2012 ARQ.
53 The gross value of opiates economy includes several components (e.g., costs associated to precursor substances, transports, processing, etc.), which are not considered in this analysis.
Myanmar Opium Survey 2018
50
Table 13: Workflow diagram of the analysis of the opiates economy’s components
Uncertainties
There is a significant uncertainty around these estimates. While confidence in the opium production estimates is high, uncertainties around the conversion ratio from opium to heroin54 stem mainly from the wide range of possible purities of the product and from the lack of data on the efficiency of the conversion from opium to heroin (i.e., how much opium is needed to produce 1kg of heroin). Uncertainties around the demand estimate are mainly associated with the assumptions around annual opium consumption per user.
54 The amount of raw opium needed for producing 1kg of heroin depends on two main factors: i) the average morphine content of opium and ii) the efficiency of the heroin labs. To date there are no available studies that focus on opium’s morphine content and/or heroin labs efficiency in Myanmar.

Back cover photo: Akara Umapornsakula, United Nations Office on Drugs and Crime
Regional Office for Southeast Asia and the Pacific United Nations Building, 3rd floor B Block, Secretariat Building, Raj Damnern Nok Avenue, Bangkok 10200, ThailandTel. (66-2) 288-2100 Fax. (66-2) 281-2129 E-mail: [email protected] Website: http://www.unodc.org/southeastasiaandpacific Twitter: @UNODC_SEAP