my life in twenty graphs (tom scott)
TRANSCRIPT

My Life in Twenty Graphs
Tom Scott

Number of times per dayyou post toTwitter
Arat’s ass
Two hoots
A damn
A monkey’s
A hootAmount I could give
0 51 2 3 4
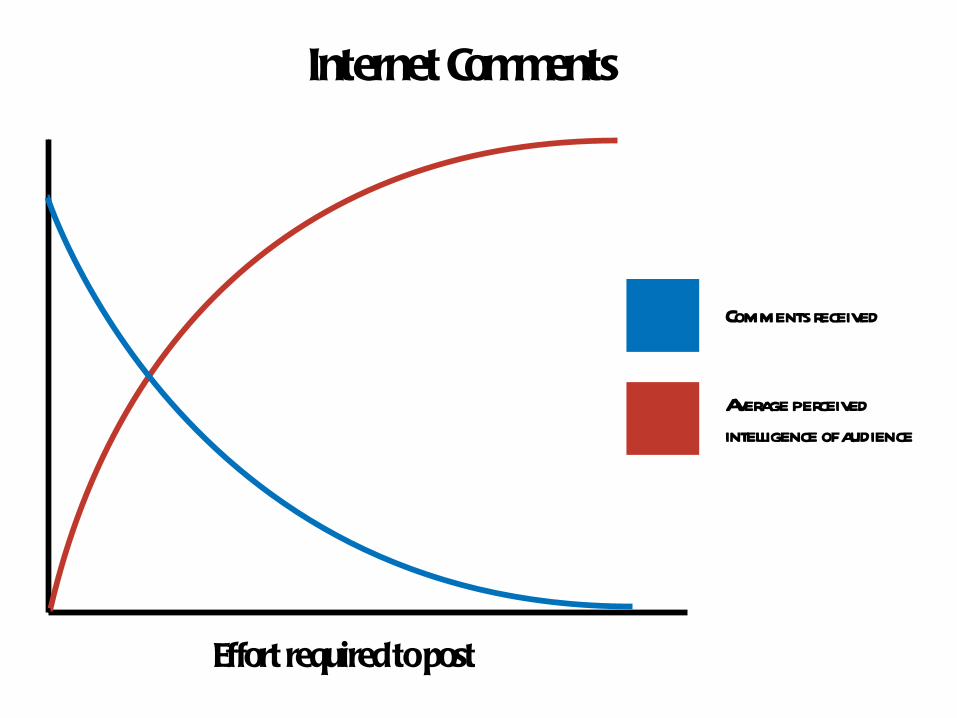
Effort requiredto post
Commentsreceived
Average perceived
intelligence of audience
InternetComments

Hours per day spentatwork
Probabili
ty ofm
yresign
ation
0 963 12
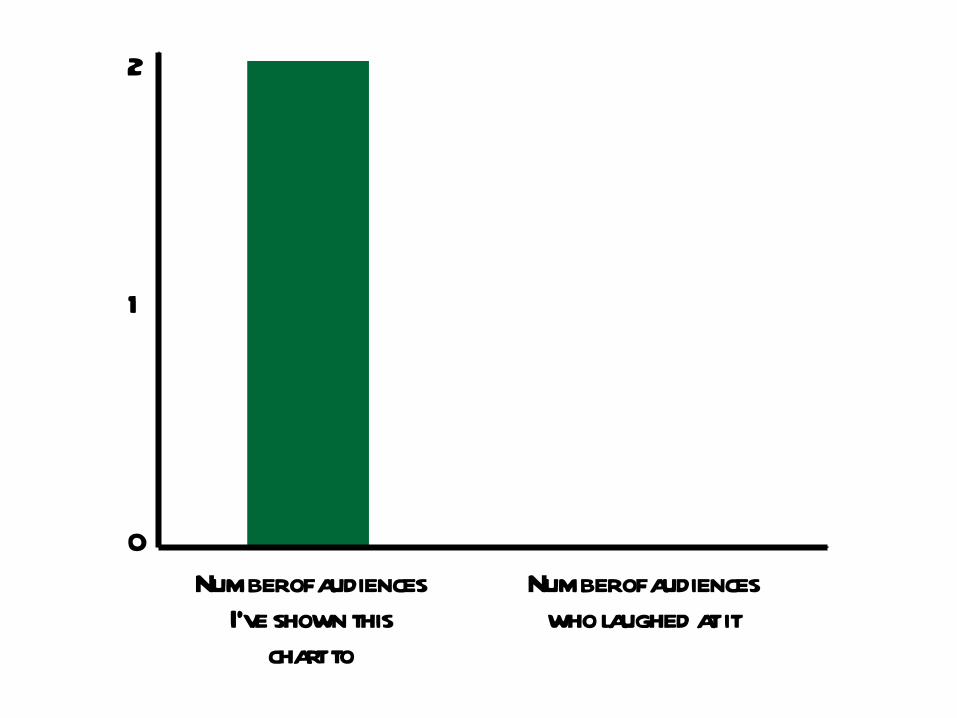
2
0
1
Number of audiences
I’ve shown this
chartto
Number of audiences
who laughed at it
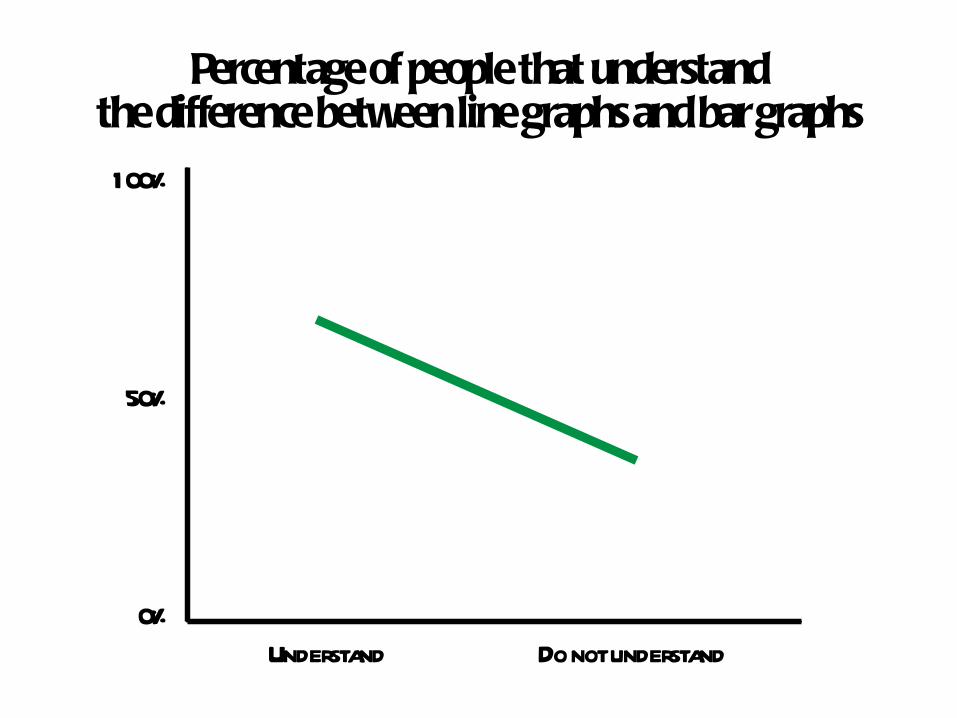
Percentage of people that understandthe difference between line graphs and bar graphs100%
0%
50%
Understand Do not understand
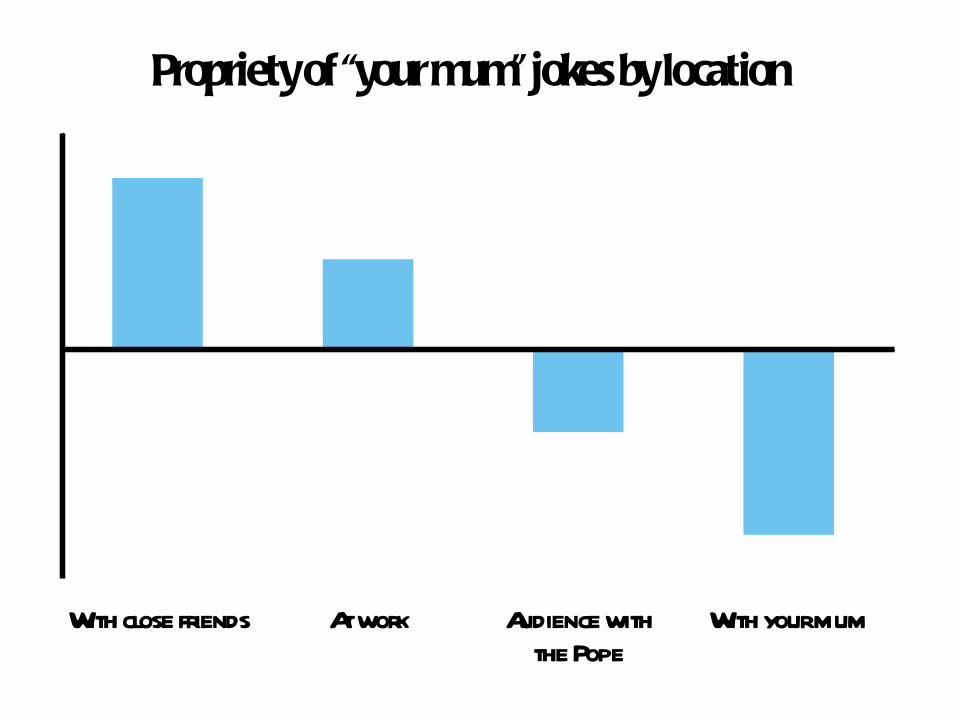
Propriety of“your mum” jokesby location
With close friends Atwork Audience with
thePope
Withyour mum

Pantomime
Ohyes
it is
Oh no
it isn’t
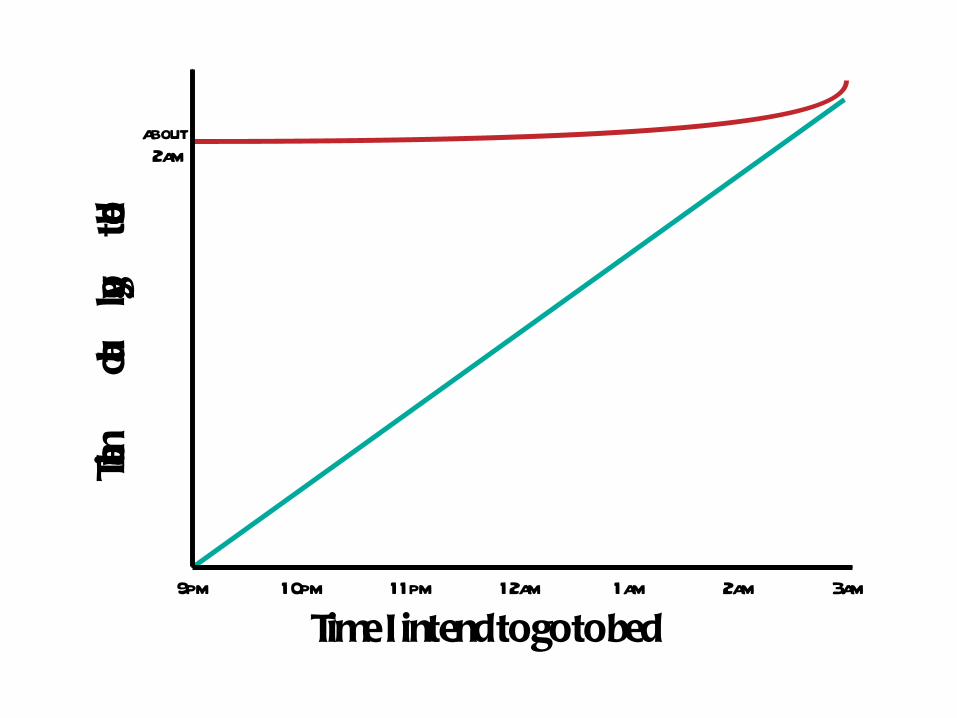
Time I intendto goto bed
Time I actual
ly goto bed
9pm 10pm 11pm 12am 1am 2am 3am
about2am

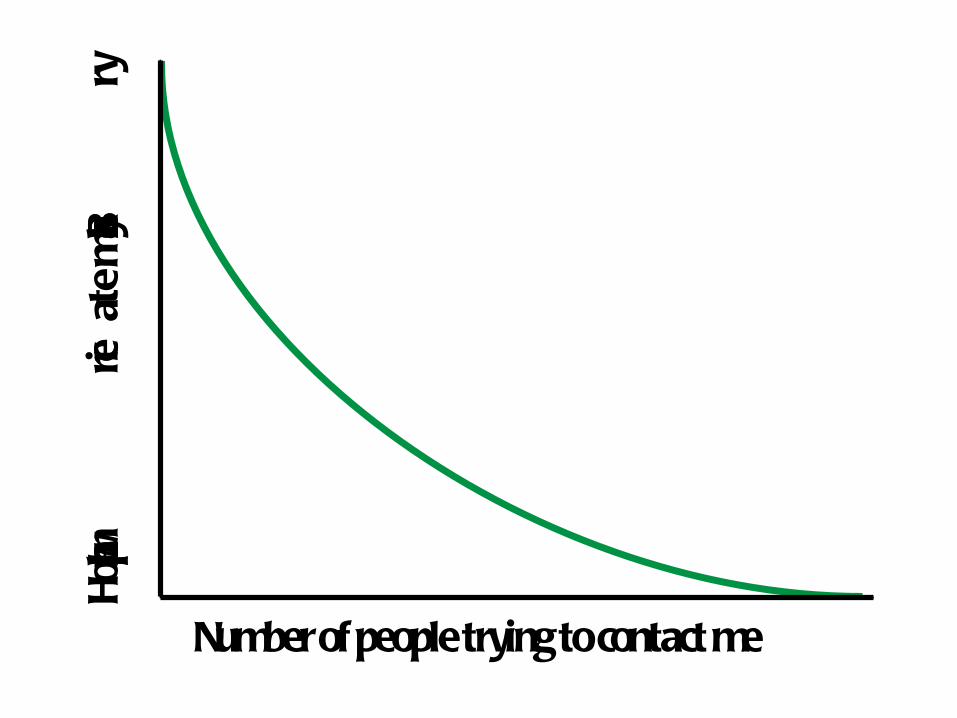
How much I app
reciat
emy BlackBer
ry
Number of people tryingto contact me

Time spent in academia
Chance of being
known as“that guy”
Procrastination
Willingnessto
leave
Actualreal-world
achievement

2am
“I should really
goto bed.”
Check RSSfeeds
one last time
“Ooh, that’s
quitecool.”
Look it up
onWikipedia
Click links in
articletext
“Noway, that
can’t bereal”
Lookforrelated
video onYouTube
“Aww, lookat the
littlekitten”

Danger
Awesome
Real Life
YouTube

Amount of flashy graphics
Inform
ation conv
eyed
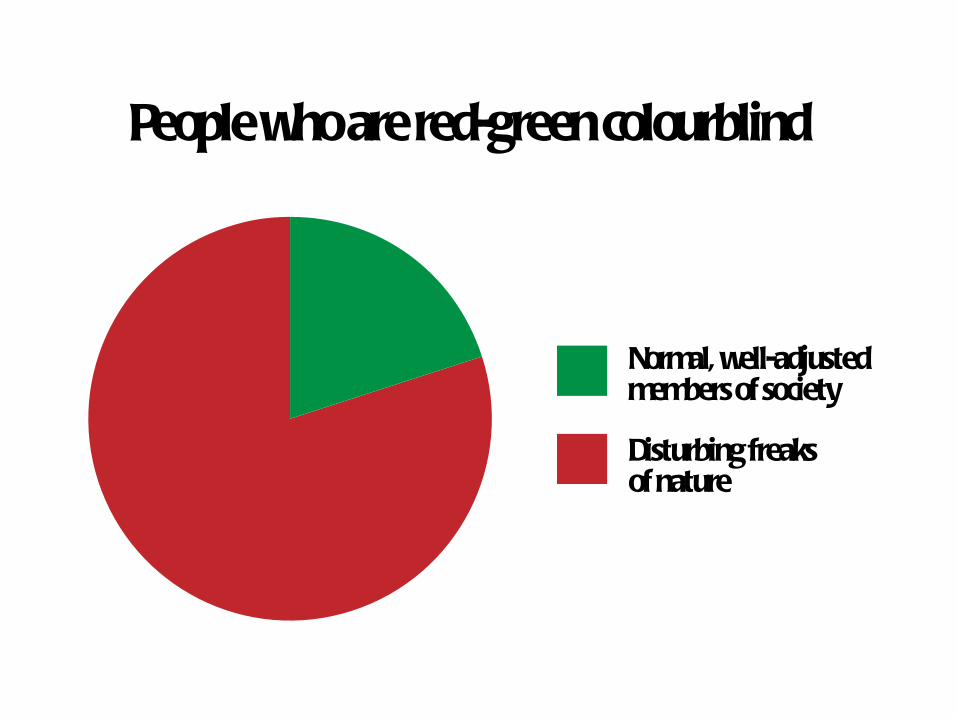
Disturbing freaksof nature
Normal, well-adjustedmembers of society
People who arered-green colourblind
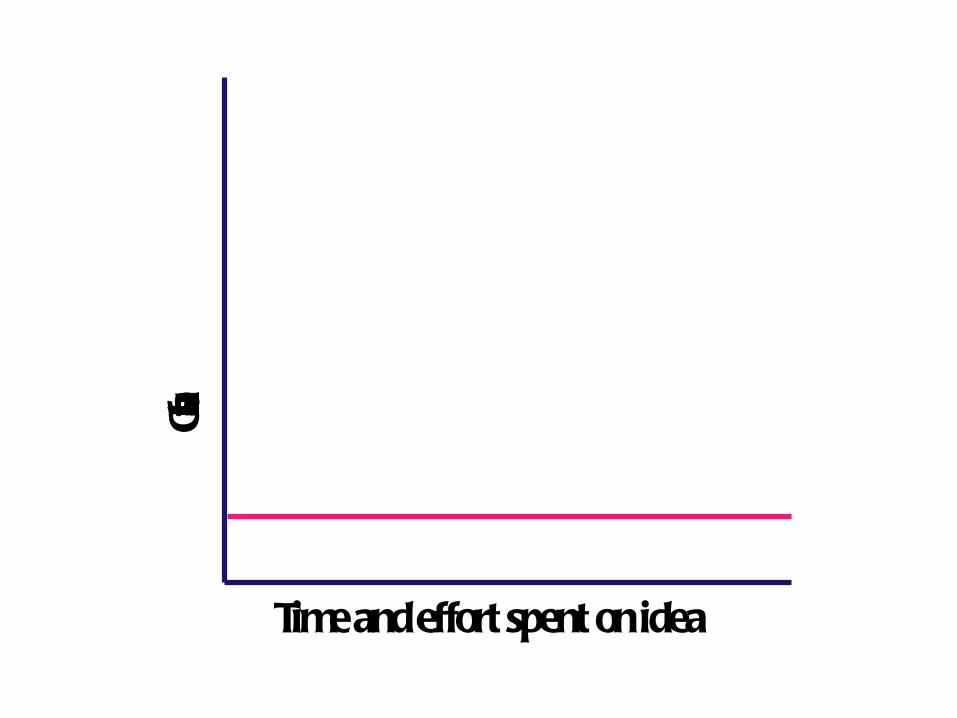
Time and effort spent on idea
Chance of success

How much theDJ talks
How much I
want them
to die
Me
Morrissey

Time spent in America
Probability of
using thewords
“cell phone”
“Ohmygod, like,
your accent is,
like,totallycool”
Expectation of
freerefillsat
diners
Weight
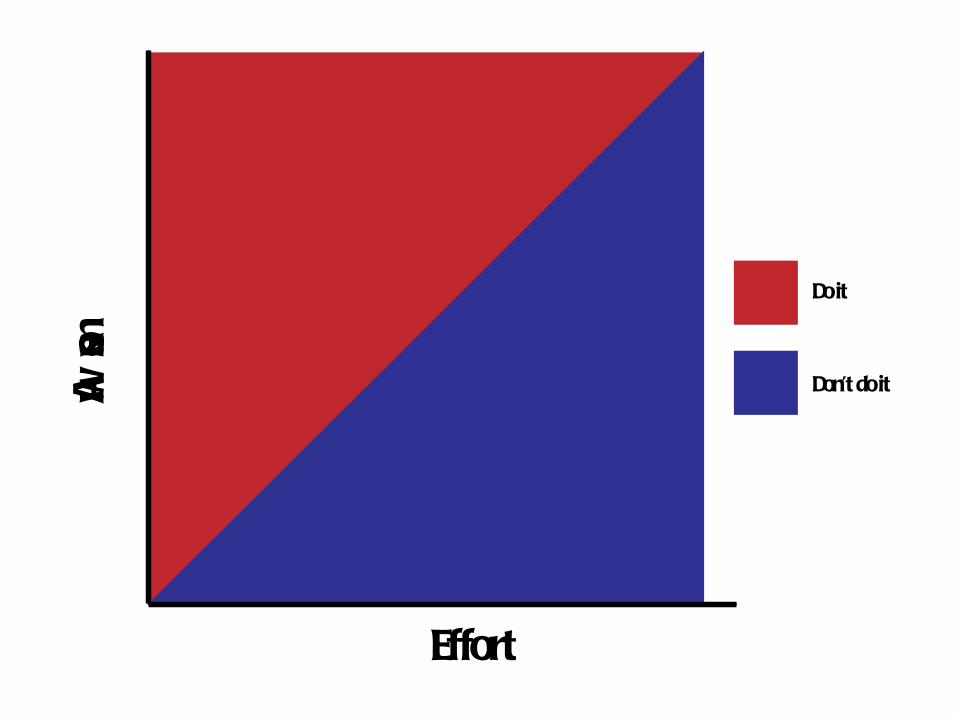
Do it
Don’t do itAwesome
Effort


2
0
1
Number of audiences
I’ve shown this
chartto
Number of audiences
who laughed at it

Dicks
Hecklers

People with
lives
People who
care about
the difference
between“graph”
and “chart”