mutual fund recommendation – q4 2015 - quant capital. mutual funds research | our philosophy 3 2....
TRANSCRIPT
1 Friday, November 6, 2015
Mutual Fund Recommendation – Q4 2015
Amit Jain + 91 22 4088 0191

2
Table of Contents
1. Mutual Funds Research | Our Philosophy 3 2. Mutual Funds Research | Our Process | Equity Funds 4 Large Cap Funds
Birla SL Frontline Equity Fund 5 Reliance Focused Large Cap Fund 7 SBI Bluechip Fund 9 BNP Paribas Equity Fund 11 NAV Movement | Large Cap Portfolio 13
Mid Cap Funds BNP Paribas Mid Cap Fund 14 Franklin India Prima Fund 16 SBI Small and Midcap Fund 18 Kotak Emerging Equity Fund 20 NAV Movement | Mid Cap Portfolio 22
Multi Cap Funds UTI Equity Fund 23 Kotak Select Focus Fund 25 L&T Value Fund 27 DSP BR Focus 25 Fund 29
NAV Movement | Multi Cap Portfolio 31 Hybrid Funds – Equity
ICICI Prudential Balanced Advantage Fund 32 SBI Magnum Balanced Fund 34
Tax Saving Funds Axis Long Term Equity Fund 36 BNP Paribas LT Equity Fund 38
Thematic Funds UTI MNC Fund 40
3. Mutual Funds Research | Our Process | Debt Funds 41 Long Term Funds
ICICI Prudential Income Fund 42 HDFC High Interest Fund-Dynamic Plan 43
Medium Term Funds Birla SL Medium Term Fund 44 Kotak Medium Term Fund 45
Short Term Fund Franklin India Short Term Income Plan 46 HDFC Short Term Plan 47
Ultra Short Term Funds Franklin India Ultra Short Bond Fund 48 DWS Cash Opportunities Fund 49
4. External Rating Comparison 50 5. Factor’s Description 51

3
Mutual Funds Research | Our Philosophy
Which are the best ones? – It is to do with more than just past performance
The primary objective of the quantitative analysis is to evaluate funds on the basis of ‘Alpha Consistency’ and ‘Alpha Frequency’
In-house proprietary model [quant Fund Selection Indicator (QFSI)] has been created to generate a recommended list of funds under various categories
Higher emphasis is given on the quantitative parameters to evaluate and filter the entire universe of the funds
Qualitative factors act in defining a broader framework and helps us to keep a check on how is the portfolio being managed vis-à-vis the stated portfolio’s stated objective and strategy

4
Mutual Funds Research | Our Process | Equity Funds
Due diligence on AMCs
quantitative factors – AAUM over 6 months – INR 1000 crores or 1% market share
Qualitative factor – AMCs pedigree, sponsors’ background, investment team’s experience, service capabilities, etc.
Scheme filtering criteria’s
Classifying open ended equity schemes on the basis of – their investment objective & strategy into various categories
Minimum AUM criteria for open ended equity & hybrid funds – INR 200 crores (average of last 6 months AUM) or 1% market share (based on average of last 6 months AUM)
Minimum age criteria – The fund has to be in existence for at least 3 years before it comes up in our filtered list for research
Risk – adjusted return analysis for equity & hybrid funds
Risk-adjusted returns to be estimated on the basis of quant Fund Selection Indicator (QFSI)
The top 10% percentile of funds to be recommended to clients across different categories

5
Birla SL Frontline Equity Fund– Large Cap Fund
NAV Growth Plan – Rs. 158.57 Dividend Plan – Rs. 27.54
Inception Date August 30, 2002
Benchmark CNX Nifty Index (quant) S&P BSE 200 (fund)
Load Structure(Exit) 1% w/n 1 Year
Expense Ratio 1.75
Fund Manager Mr. Mahesh Patil
Investment Objective The scheme aims to generate long-term capital growth, income generation and distribution of dividend. It would target the same sectoral weights as BSE 200, subject to flexibility of selecting stocks within a particular sector.
Parameter Value
Information Ratio 2.03
Slope (Beta) 1.23
R-Squared 0.99
Standard Deviation (%) 16.10
Treynor Ratio 14.85
Sharpe Ratio 1.13
Jensen's Alpha (%) 5.89
Period Return CNX Nifty Relative Return
1 Yr 9.10 -0.20 9.29
2 Yr 27.92 17.73 10.20
3 Yr 19.78 11.68 8.10
5 Yr 11.13 5.68 5.46
Since Inception 23.50 17.06 6.44
This is the sort of fund whose stated strategy could be called index with a garnish. The fund house has chosen to define the strategy as a variation on the BSE 200 benchmark. It says that the fund would aim for the same sector weights as the index and try to get all the advantage by having a different stock selection within those sectors. The fund manager’s objective is to beat the benchmark incrementally and consistently taking measured individual stock bets in the portfolio
Investment Style
Growth Blend Value
Large M
arket Cap
Medium
Small
Top 3 Sector 43.62%
Top 5 Sector 51.90%
Top 10 Holdings 38.98%
Trend of QFSI over last 3 years
AUM (Crs.) 9792
A++ Market Cap Amount(Cr.) % Holding
Large Cap 9033 92
Mid Cap 128 1
Others 631 6
0.00
0.50
1.00
1.50
2.00
2.50
Sep-
12
Dec
-12
Mar
-13
Jun-
13
Sep-
13
Dec
-13
Mar
-14
Jun-
14
Sep-
14
Dec
-14
Mar
-15
Jun-
15
Sep-
15
Data as of 30th September 2015

6
Quarter on Quarter return vis‐à‐vis quant’s benchmark and category average Positive months in the last 3 year v/s negative months relative to quant’s benchmark
Top 10 holdings for the fund Sectoral movement of the portfolio over the last 4 quarters
Birla SL Frontline Equity Fund– Large Cap Fund
Company Sector %age
HDFC Bank Ltd. Bank - Private 6.46
Infosys Ltd. IT - Software 6.16
ICICI Bank Ltd. Bank - Private 4.29
ITC Ltd. Cigarettes/Tobacco 3.38
Reliance Industries Ltd. Refineries 3.37
Larsen & Toubro Ltd. Engineering - Construction 3.34
IndusInd Bank Ltd. Bank - Private 3.14
Axis Bank Ltd. Bank - Private 3.05
Tech Mahindra Ltd. IT - Software 2.90
HCL Technologies Ltd. IT - Software 2.89
-2%
-1%
-1%
0%
1%
1%
2%
2%
3%
3%
4%
0%
10%
20%
30%
40%
50%
60%
70%
80%
90%
100%
Dec-14 Mar-15 Jun-15 Sep-15
Cash & Cash Equivalent
Other Sector
Finance - Housing
Automobiles-Trucks/Lcv
Finance - NBFC
Cigarettes/Tobacco
Engineering - Construction
Automobiles - Passenger Cars
Refineries
Pharmaceuticals & Drugs
IT - Software
Bank - Private
Data as of 30th September 2015
-10%
-5%
0%
5%
10%
15%
20%
Sep-
12
Dec-
12
Mar
-13
Jun-
13
Sep-
13
Dec-
13
Mar
-14
Jun-
14
Sep-
14
Dec-
14
Mar
-15
Jun-
15
Sep-
15
Fund Return Bechmark Return Category Average
7
Reliance Focused Large Cap Fund – Large Cap Fund
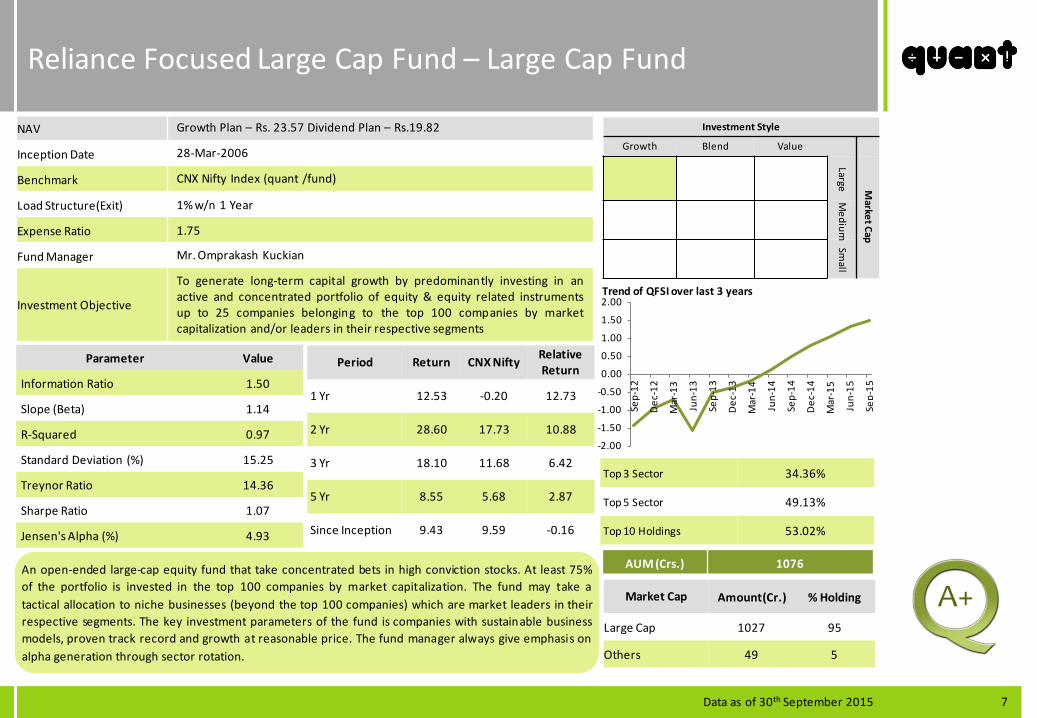
NAV Growth Plan – Rs. 23.57 Dividend Plan – Rs.19.82
Inception Date 28-Mar-2006
Benchmark CNX Nifty Index (quant /fund)
Load Structure(Exit) 1% w/n 1 Year
Expense Ratio 1.75
Fund Manager Mr. Omprakash Kuckian
Investment Objective
To generate long-term capital growth by predominantly investing in an active and concentrated portfolio of equity & equity related instruments up to 25 companies belonging to the top 100 companies by market capitalization and/or leaders in their respective segments
Parameter Value
Information Ratio 1.50
Slope (Beta) 1.14
R-Squared 0.97
Standard Deviation (%) 15.25
Treynor Ratio 14.36
Sharpe Ratio 1.07
Jensen's Alpha (%) 4.93
Period Return CNX Nifty Relative Return
1 Yr 12.53 -0.20 12.73
2 Yr 28.60 17.73 10.88
3 Yr 18.10 11.68 6.42
5 Yr 8.55 5.68 2.87
Since Inception 9.43 9.59 -0.16
An open-ended large-cap equity fund that take concentrated bets in high conviction stocks. At least 75% of the portfolio is invested in the top 100 companies by market capitalization. The fund may take a tactical allocation to niche businesses (beyond the top 100 companies) which are market leaders in their respective segments. The key investment parameters of the fund is companies with sustainable business models, proven track record and growth at reasonable price. The fund manager always give emphasis on alpha generation through sector rotation.
Investment Style
Growth Blend Value
Large M
arket Cap
Medium
Small
Top 3 Sector 34.36%
Top 5 Sector 49.13%
Top 10 Holdings 53.02%
AUM (Crs.) 1076
A+
Trend of QFSI over last 3 years
Market Cap Amount(Cr.) % Holding
Large Cap 1027 95
Others 49 5
-2.00
-1.50
-1.00
-0.50
0.00
0.50
1.00
1.50
2.00
Sep-
12
Dec
-12
Mar
-13
Jun-
13
Sep-
13
Dec
-13
Mar
-14
Jun-
14
Sep-
14
Dec
-14
Mar
-15
Jun-
15
Sep-
15
Data as of 30th September 2015

8
Quarter on Quarter return vis‐à‐vis quant’s benchmark and category average Positive months in the last 3 year v/s negative months relative to quant’s benchmark
Top 10 holdings for the fund Sectoral movement of the portfolio over the last 4 quarters
Reliance Focused Large Cap Fund – Large Cap Fund
Company Sector %age
HDFC Bank Ltd. Bank - Private 7.45
Infosys Ltd. IT - Software 6.48
Cummins India Ltd. Diesel Engines 6.11
Reliance Industries Ltd. Refineries 5.61
Ultratech Cement Ltd. Cement & Construction Materials 4.97
Larsen & Toubro Ltd. Engineering - Construction 4.77
Lupin Ltd. Pharmaceuticals & Drugs 4.73
State Bank Of India Bank - Public 4.41
Maruti Suzuki India Ltd. Automobiles - Passenger Cars 4.35
Divis Laboratories Ltd. Pharmaceuticals & Drugs 4.14
-4%
-3%
-2%
-1%
0%
1%
2%
3%
4%
0%
10%
20%
30%
40%
50%
60%
70%
80%
90%
100%
Dec-14 Mar-15 Jun-15 Sep-15
Cash & Cash Equivalent
Other Sector
Automobiles - Passenger Cars
Engineering - Construction
Cement & Construction Materials
Refineries
Diesel Engines
Bank - Public
Electric Equipment
IT - Software
Bank - Private
Pharmaceuticals & Drugs
Data as of 30th September 2015
-10%
-5%
0%
5%
10%
15%
20%
Sep-
12
Dec-
12
Mar
-13
Jun-
13
Sep-
13
Dec-
13
Mar
-14
Jun-
14
Sep-
14
Dec-
14
Mar
-15
Jun-
15
Sep-
15
Fund Return Bechmark Return Category Average
9
SBI Bluechip Fund – Large Cap Fund
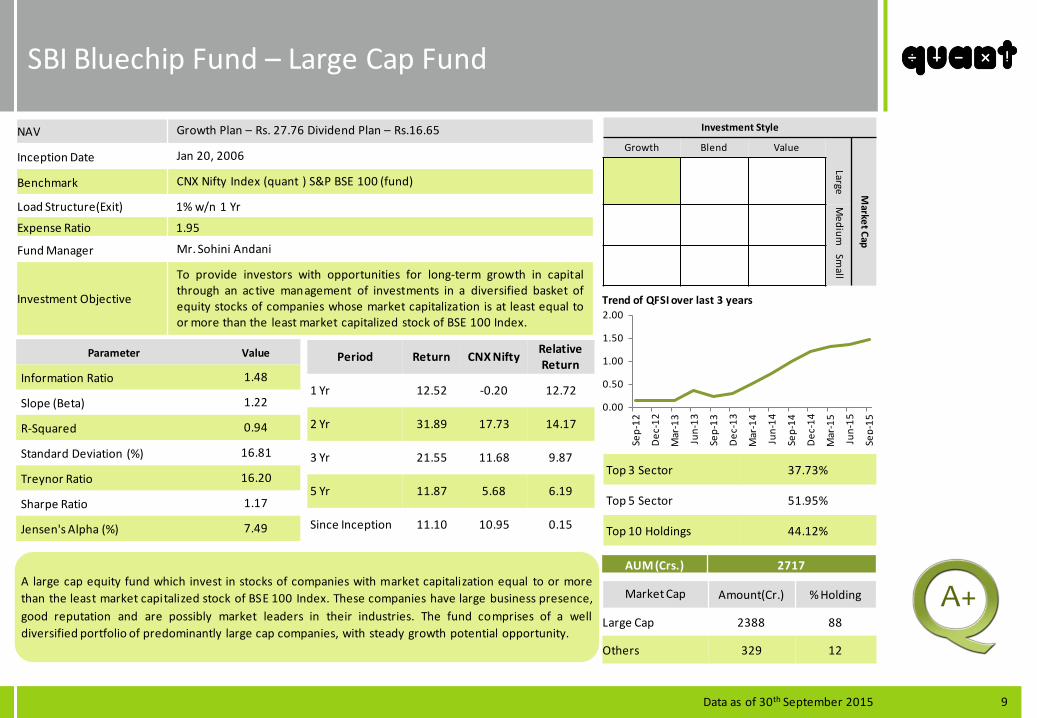
NAV Growth Plan – Rs. 27.76 Dividend Plan – Rs.16.65
Inception Date Jan 20, 2006
Benchmark CNX Nifty Index (quant ) S&P BSE 100 (fund)
Load Structure(Exit) 1% w/n 1 Yr
Expense Ratio 1.95
Fund Manager Mr. Sohini Andani
Investment Objective
To provide investors with opportunities for long-term growth in capital through an ac tive management of investments in a diversified basket of equity stocks of companies whose market capitalization is at least equal to or more than the least market capitalized stock of BSE 100 Index.
Parameter Value
Information Ratio 1.48
Slope (Beta) 1.22
R-Squared 0.94
Standard Deviation (%) 16.81
Treynor Ratio 16.20
Sharpe Ratio 1.17
Jensen's Alpha (%) 7.49
Period Return CNX Nifty Relative Return
1 Yr 12.52 -0.20 12.72
2 Yr 31.89 17.73 14.17
3 Yr 21.55 11.68 9.87
5 Yr 11.87 5.68 6.19
Since Inception 11.10 10.95 0.15
A large cap equity fund which invest in stocks of companies with market capitalization equal to or more than the least market capitalized stock of BSE 100 Index. These companies have large business presence, good reputation and are possibly market leaders in their industries. The fund comprises of a well diversified portfolio of predominantly large cap companies, with steady growth potential opportunity.
Investment Style
Growth Blend Value
Large M
arket Cap
Medium
Small
Top 3 Sector 37.73%
Top 5 Sector 51.95%
Top 10 Holdings 44.12%
Market Cap Amount(Cr.) % Holding
Large Cap 2388 88
Others 329 12
AUM (Crs.) 2717
A+
Trend of QFSI over last 3 years
0.00
0.50
1.00
1.50
2.00
Sep-
12
Dec
-12
Mar
-13
Jun-
13
Sep-
13
Dec
-13
Mar
-14
Jun-
14
Sep-
14
Dec
-14
Mar
-15
Jun-
15
Sep-
15
Data as of 30th September 2015

10
Quarter on Quarter return vis‐à‐vis quant’s benchmark and category average Positive months in the last 3 year v/s negative months relative to quant’s benchmark
Top 10 holdings for the fund Sectoral movement of the portfolio over the last 4 quarters
SBI Bluechip Fund – Large Cap Fund
Company Sector %age
HDFC Bank Ltd. Bank - Private 7.77
Maruti Suzuki India Ltd. Automobiles - Passenger Cars 6.29
Infosys Ltd. IT - Software 6.14
Reliance Industries Ltd. Refineries 5.18
Sun Pharmaceutical Industries Ltd. Pharmaceuticals & Drugs 5.14
Tata Consultancy Services Ltd. IT - Software 4.19
Axis Bank Ltd. Bank - Private 2.92
Divis Laboratories Ltd. Pharmaceuticals & Drugs 2.28
Strides Arcolab Ltd. Pharmaceuticals & Drugs 2.11
IndusInd Bank Ltd. Bank - Private 2.10
-2%
-1%
0%
1%
2%
3%
4%
5%
-20%
0%
20%
40%
60%
80%
100%
Dec-14 Mar-15 Jun-15 Sep-15
Cash & Cash Equivalent
Other Sector
Bearings
Engineering - Construction
Cement & Construction Materials
Bank - Public
Finance - NBFC
Refineries
Automobiles - Passenger Cars
IT - Software
Pharmaceuticals & Drugs
Bank - Private
Data as of 30th September 2015
-10%
-5%
0%
5%
10%
15%
20%
Sep-
12
Dec-
12
Mar
-13
Jun-
13
Sep-
13
Dec-
13
Mar
-14
Jun-
14
Sep-
14
Dec-
14
Mar
-15
Jun-
15
Sep-
15
Fund Return Bechmark Return Category Average

11
BNP Paribas Equity Fund – Large Cap Fund
NAV Growth Plan – Rs. 66.23 Dividend Plan – Rs.16.32
Inception Date Sep 23, 2004
Benchmark CNX Nifty Index (quant / fund)
Load Structure(Exit) 1% w/n 1 Yr
Expense Ratio 2.40
Fund Manager Mr. Shreyash Devalkar
Investment Objective The scheme aims to generate regular long term capital growth from a diversified and actively managed portfolio of equity and equity related securities
Parameter Value
Information Ratio 1.17
Slope (Beta) 1.23
R-Squared 0.92
Standard Deviation (%) 17.27
Treynor Ratio 15.03
Sharpe Ratio 1.07
Jensen's Alpha (%) 6.15
Period Return CNX Nifty Relative Return
1 Yr 10.88 -0.20 11.08
2 Yr 28.79 17.73 11.06
3 Yr 21.45 11.68 9.77
5 Yr 12.83 5.68 7.16
Since Inception 18.71 14.86 3.85
An open-ended large-cap equity fund that invests in leading companies across sectors to give the advantage of size to your portfolio. A systematic top down approach towards sector allocation based on overall macro economic factors and a detailed bottom up stock selection is done to arrive at the final portfolio. The Large Cap portion of the portfolio will seek to generate beta while the mid cap allocation would seek to generate alpha over the benchmark. The portfolio construct has allocation to off benchmark stocks to generate alpha. This scheme is ideal for first time equity investors and investors who are convinced about the value of investing in equities.
Investment Style
Growth Blend Value
Large M
arket Cap
Medium
Small
Top 3 Sector 48.90%
Top 5 Sector 63.57%
Top 10 Holdings 48.87%
AUM (Crs.) 1044
A
Trend of QFSI over last 3 years
-0.50
0.00
0.50
1.00
1.50
2.00
Sep-
12
Dec
-12
Mar
-13
Jun-
13
Sep-
13
Dec
-13
Mar
-14
Jun-
14
Sep-
14
Dec
-14
Mar
-15
Jun-
15
Sep-
15
Market Cap Amount(Cr.) % Holding
Large Cap 874 84 Mid Cap 101 10 Small Cap 11 1 Others 57 5
Data as of 30th September 2015

12
Quarter on Quarter return vis‐à‐vis quant’s benchmark and category average Positive months in the last 3 year v/s negative months relative to quant’s benchmark
Top 10 holdings for the fund Sectoral movement of the portfolio over the last 4 quarters
BNP Paribas Equity Fund – Large Cap Fund
Company Sector %age
HDFC Bank Ltd. Bank - Private 7.83
Idea Cellular Ltd. Telecommunication - Service 7.16
Bharti Airtel Ltd. Telecommunication - Service 6.72
IndusInd Bank Ltd. Bank - Private 5.52
Kotak Mahindra Bank Ltd. Bank - Private 4.41
Lupin Ltd. Pharmaceuticals & Drugs 4.09
Infosys Ltd. IT - Software 3.62
Axis Bank Ltd. Bank - Private 3.32
Maruti Suzuki India Ltd. Automobiles - Passenger Cars 3.13
Ultratech Cement Ltd. Cement & Construction Materials 3.07
Data as of 30th September 2015
-3%
-2%
-1%
0%
1%
2%
3%
4%
5%
6%
0%
10%
20%
30%
40%
50%
60%
70%
80%
90%
100%
Dec-14 Mar-15 Jun-15 Sep-15
Cash & Cash Equivalent
Other Sector
Miscellaneous
Paints
Finance - NBFC
Automobiles - Passenger Cars
Household & Personal Products
Cement & Construction Materials
IT - Software
Pharmaceuticals & Drugs
Telecommunication - Service
Bank - Private
-10%
-5%
0%
5%
10%
15%
20%
25%
Sep-
12
Dec-
12
Mar
-13
Jun-
13
Sep-
13
Dec-
13
Mar
-14
Jun-
14
Sep-
14
Dec-
14
Mar
-15
Jun-
15
Sep-
15
Fund Return Bechmark Return Category Average

13
NAV Movement | Large Cap Portfolio
Portfolio NAV movement of large cap portfolio on the basis of quant Fund Selection Indicator (QFSI) against CNX Nifty Index(quant benchmark) and category average of large cap funds for the period Apr 05 to Sep 15 selected for the portfolio holds highest rank as per QFSI. The portfolio NAV is calculated taking in account exit load and tax implication, as applicable
Portfolio Outperformance vis-à-vis
category average
50
150
250
350
450
550
650 CNX Nifty Index Category Average Large Cap
14
BNP Paribas Mid Cap Fund – Mid Cap Fund
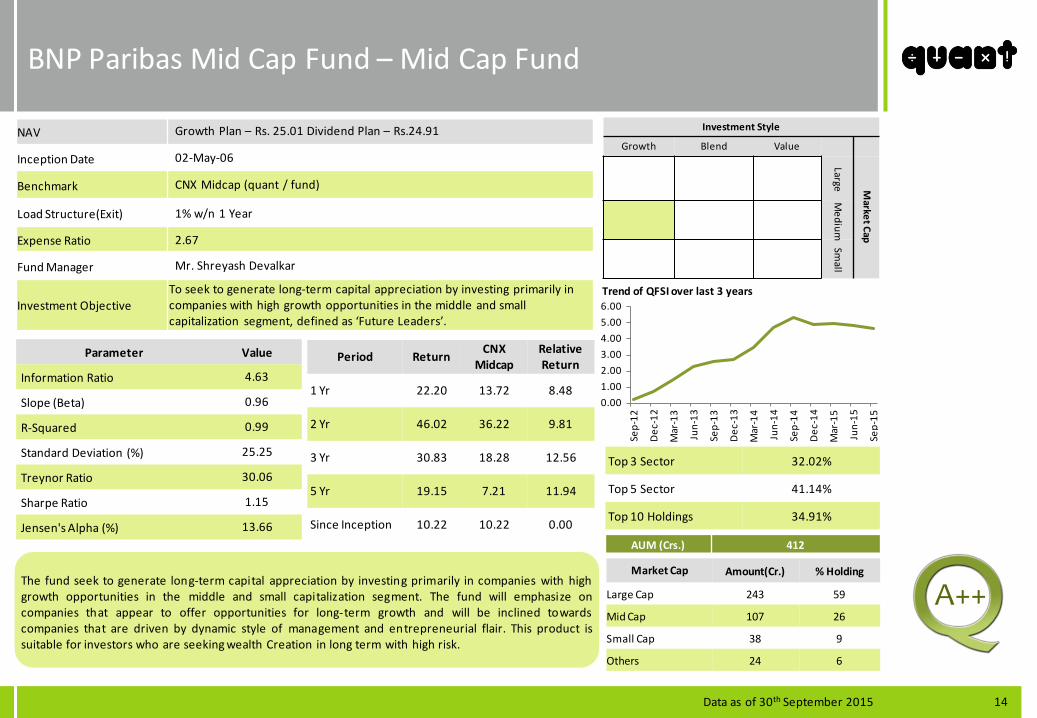
NAV Growth Plan – Rs. 25.01 Dividend Plan – Rs.24.91
Inception Date 02-May-06
Benchmark CNX Midcap (quant / fund)
Load Structure(Exit) 1% w/n 1 Year
Expense Ratio 2.67
Fund Manager Mr. Shreyash Devalkar
Investment Objective To seek to generate long-term capital appreciation by investing primarily in companies with high growth opportunities in the middle and small capitalization segment, defined as ‘Future Leaders’.
Parameter Value
Information Ratio 4.63
Slope (Beta) 0.96
R-Squared 0.99
Standard Deviation (%) 25.25
Treynor Ratio 30.06
Sharpe Ratio 1.15
Jensen's Alpha (%) 13.66
Period Return CNX Midcap
Relative Return
1 Yr 22.20 13.72 8.48
2 Yr 46.02 36.22 9.81
3 Yr 30.83 18.28 12.56
5 Yr 19.15 7.21 11.94
Since Inception 10.22 10.22 0.00
Investment Style
Growth Blend Value
Large M
arket Cap
Medium
Small
Top 3 Sector 32.02%
Top 5 Sector 41.14%
Top 10 Holdings 34.91%
Market Cap Amount(Cr.) % Holding
Large Cap 243 59
Mid Cap 107 26
Small Cap 38 9
Others 24 6
AUM (Crs.) 412
The fund seek to generate long-term capital appreciation by investing primarily in companies with high growth opportunities in the middle and small capitalization segment. The fund will emphasize on companies that appear to offer opportunities for long-term growth and will be inclined towards companies that are driven by dynamic style of management and entrepreneurial flair. This product is suitable for investors who are seeking wealth Creation in long term with high risk.
A++
Trend of QFSI over last 3 years
0.00 1.00 2.00 3.00 4.00 5.00 6.00
Sep-
12
Dec
-12
Mar
-13
Jun-
13
Sep-
13
Dec
-13
Mar
-14
Jun-
14
Sep-
14
Dec
-14
Mar
-15
Jun-
15
Sep-
15
Data as of 30th September 2015

15
Quarter on Quarter return vis‐à‐vis quant’s benchmark and category average Positive months in the last 3 year v/s negative months relative to quant’s benchmark
Top 10 holdings for the fund Sectoral movement of the portfolio over the last 4 quarters
BNP Paribas Mid Cap Fund – Mid Cap Fund
Company Sector %age
Idea Cellular Ltd. Telecommunication - Service 6.17
IndusInd Bank Ltd. Bank – Private 5.04
Bharti Airtel Ltd. Telecommunication - Service 4.47
Wabco India Ltd. Auto Ancillary 3.17
The Federal Bank Ltd. Bank - Private 3.11
Just Dial Ltd. Miscellaneous 2.87
Welspun India Ltd. Textile 2.67
PVR Ltd. Film Production, Dist. & Enter. 2.50
VRL Logistics Ltd. Logistics 2.49
Bharat Electronics Ltd. Electronics - Components 2.42
-4%
-3%
-2%
-1%
0%
1%
2%
3%
4%
5%
6%
0%
10%
20%
30%
40%
50%
60%
70%
80%
90%
100%
Dec-14 Mar-15 Jun-15 Sep-15
Cash & Cash Equivalent
Other Sector
Cement & Construction Materials
Auto Ancillary
Finance - NBFC
Logistics
Textile
Consumer Food
Engineering - Construction
Pharmaceuticals & Drugs
Telecommunication - Service
Bank - Private
Data as of 30th September 2015
-20%
-15%
-10%
-5%
0%
5%
10%
15%
20%
25%
30%
35%
Sep-
12
Dec-
12
Mar
-13
Jun-
13
Sep-
13
Dec-
13
Mar
-14
Jun-
14
Sep-
14
Dec-
14
Mar
-15
Jun-
15
Sep-
15
Fund Return Bechmark Return Category Average

16
Franklin India Prima Fund – Mid Cap Fund
NAV Growth Plan – Rs. 654.73 Dividend Plan – Rs.55.41
Inception Date 1-Dec-93
Benchmark CNX Midcap (quant) / S&P BSE 500 (fund)
Load Structure(Exit) 1% w/n 1 Yr
Expense Ratio 2.34
Fund Manager Mr. R. Janakiraman
Investment Objective The primary objective of the fund is capital appreciation and secondary objective is income generation by focusing on mid and small cap industry.
Parameter Value
Information Ratio 3.12
Slope (Beta) 1.04
R-Squared 0.99
Standard Deviation (%) 27.51
Treynor Ratio 28.51
Sharpe Ratio 1.08
Jensen's Alpha (%) 13.17
Period Return CNX Midcap
Relative Return
1 Yr 19.16 13.72 5.44
2 Yr 46.82 36.22 10.61
3 Yr 30.21 18.28 11.94
5 Yr 16.80 7.21 9.58
Since Inception 21.1 - -
An open ended diversified equity fund focusing primarily on small and mid cap companies that exhibit higher growth rates than their well established large cap companies. The fund aims to identify companies at an early stage of business life cycle as they have a greater potential for the upside. The fund tries to minimize risk by diversifying across sectors and across stocks within a sector. This fund is suitable for investors that prefer fund that has potential to deliver high capital appreciation over time but with relatively higher volatility over a 3-5 year investment time horizon.
Investment Style
Growth Blend Value
Large M
arket Cap
Medium
Small
Top 3 Sector 29.93%
Top 5 Sector 38.46%
Top 10 Holdings 28.10%
Market Cap Amount(Cr.) % Holding
Large Cap 2801 74
Mid Cap 645 17
Others 335 9
AUM (Crs.) 3781
Trend of QFSI over last 3 years
A++
Data as of 30th September 2015
0.00
1.00
2.00
3.00
4.00
Sep-
12
Dec
-12
Mar
-13
Jun-
13
Sep-
13
Dec
-13
Mar
-14
Jun-
14
Sep-
14
Dec
-14
Mar
-15
Jun-
15
Sep-
15

17
Quarter on Quarter return vis‐à‐vis quant’s benchmark and category average Positive months in the last 3 year v/s negative months relative to quant’s benchmark
Top 10 holdings for the fund Sectoral movement of the portfolio over the last 4 quarters
Franklin India Prima Fund – Mid Cap Fund
Company Sector %age
Yes Bank Ltd. Bank - Private 4.34
Torrent Pharmaceuticals Ltd. Pharmaceuticals & Drugs 3.28
Amara Raja Batteries Ltd. Batteries 2.97
HDFC Bank Ltd. Bank - Private 2.64
IndusInd Bank Ltd. Bank - Private 2.58
Repco Home Finance Ltd. Finance - Housing 2.54
Finolex Cables Ltd. Cable 2.54
Mindtree Ltd. IT - Software 2.54
FAG Bearings India Ltd. Bearings 2.44
Kansai Nerolac Paints Ltd. Paints 2.24
Data as of 30th September 2015
-4%
-3%
-2%
-1%
0%
1%
2%
3%
4%
5%
0%
10%
20%
30%
40%
50%
60%
70%
80%
90%
100%
Dec-14 Mar-15 Jun-15 Sep-15
Cash & Cash Equivalent
Other Sector
Tyres & Allied
Cable
Pesticides & Agrochemicals
Cement & Construction Materials
Batteries
Bearings
Finance - Housing
IT - Software
Pharmaceuticals & Drugs
Bank - Private
-20%
-15%
-10%
-5%
0%
5%
10%
15%
20%
25%
30%
35%
Sep-
12
Dec-
12
Mar
-13
Jun-
13
Sep-
13
Dec-
13
Mar
-14
Jun-
14
Sep-
14
Dec-
14
Mar
-15
Jun-
15
Sep-
15
Fund Return Bechmark Return Category Average

18
SBI Small and Midcap Fund – Mid Cap Fund
NAV Growth Plan – Rs. 31.11 Dividend Plan – Rs.23.40
Inception Date 09-Sep-09
Benchmark CNX Midcap (quant) / S&P BSE Small-Cap (fund)
Load Structure(Exit) 1% w/n 12 Months
Expense Ratio 2.20
Fund Manager Mr. R. Srinivasan
Investment Objective To generate income and long term capital appreciation by investing in a diversified portfolio of predominantly in equity and equity related securities of small & midcap Companies
Parameter Value
Information Ratio 1.34
Slope (Beta) 1.34
R-Squared 0.95
Standard Deviation (%) 36.85
Treynor Ratio 26.69
Sharpe Ratio 0.97
Jensen's Alpha (%) 14.47
Period Return CNX Midcap
Relative Return
1 Yr 29.69 13.72 15.97
2 Yr 60.68 36.22 24.46
3 Yr 37.26 18.28 18.98
5 Yr 20.26 7.21 13.05
Since Inception 20.6 12.92 7.68
Investment Style
Growth Blend Value
Large M
arket Cap
Medium
Small
Top 3 Sector 26.94%
Top 5 Sector 39.11%
Top 10 Holdings 48.90%
Market Cap Amount(Cr.) % Holding
Large Cap 126 21
Mid Cap 103 17
Small Cap 334 55
Others 50 8
AUM (Crs.) 613
SBI Small & Midcap Fund is an open ended equity scheme and primarily invests in Small and Midcap equity and equity related securities of the companies in the small and midcap segment. The portfolio will comprise of a maximum of 30 stocks.
A+
Trend of QFSI over last 3 years
Data as of 30th September 2015
0.00
0.50
1.00
1.50
Sep-
12
Dec
-12
Mar
-13
Jun-
13
Sep-
13
Dec
-13
Mar
-14
Jun-
14
Sep-
14
Dec
-14
Mar
-15
Jun-
15
Sep-
15

19
Quarter on Quarter return vis‐à‐vis quant’s benchmark and category average Positive months in the last 3 year v/s negative months relative to quant’s benchmark
Top 10 holdings for the fund Sectoral movement of the portfolio over the last 4 quarters
SBI Small and Midcap Fund – Mid Cap Fund
Company Sector %age
MRF Ltd. Tyres & Allied 7.54
Relaxo Footwears Ltd. Leather 6.05
Atul Ltd. Chemicals 5.34
Solar Industries (India) Ltd. Chemicals 5.09
TV Today Network Ltd. TV Broadcasting & Software 4.93
Manpasand Beverages Ltd. Consumer Food 4.76
Nesco Ltd. Engineering - Industrial 3.86
Indian Terrain Fashions Ltd. Textile 3.79
Radico Khaitan Ltd. Breweries & Distilleries 3.79
Gabriel India Ltd. Auto Ancillary 3.75
-8%
-6%
-4%
-2%
0%
2%
4%
6%
8%
10%
0%
10%
20%
30%
40%
50%
60%
70%
80%
90%
100%
Dec-14 Mar-15 Jun-15 Sep-15
Cash & Cash Equivalent
Other Sector
Breweries & Distilleries
Engineering - Industrial Equipments
Engineering - Construction
Consumer Food
TV Broadcasting & Software Production
Leather
Auto Ancillary
Textile
Tyres & Allied
Chemicals
-20%
-15%
-10%
-5%
0%
5%
10%
15%
20%
25%
30%
35%
Sep-
12
Dec-
12
Mar
-13
Jun-
13
Sep-
13
Dec-
13
Mar
-14
Jun-
14
Sep-
14
Dec-
14
Mar
-15
Jun-
15
Sep-
15
Fund Return Bechmark Return Category Average

20
Kotak Emerging Fund – Mid Cap Fund
NAV Growth Plan – Rs. 26.03 Dividend Plan – Rs.20.19
Inception Date 30-Mar-07
Benchmark CNX Midcap (quant) / S&P BSE MidSmall-Cap (fund)
Load Structure(Exit) 1% w/n 1 Yrs
Expense Ratio 2.33
Fund Manager Mr. Pankaj Tibrewal
Investment Objective To generate long-term capital appreciation from a portfolio of equity and equity related securities by investing predominantly in mid and small cap companies..
Parameter Value
Information Ratio 1.04
Slope (Beta) 1.41
R-Squared 0.98
Standard Deviation (%) 37.31
Treynor Ratio 20.44
Sharpe Ratio 0.77
Jensen's Alpha (%) 6.46
Period Return CNX Midcap
Relative Return
1 Yr 22.74 13.72 9.03
2 Yr 56.13 36.22 19.92
3 Yr 27.98 18.28 9.71
5 Yr 14.30 7.21 7.08
Since Inception 11.9 12.27 -0.37
Investment Style
Growth Blend Value
Large M
arket Cap
Medium
Small
Top 3 Sector 25.62%
Top 5 Sector 37.87%
Top 10 Holdings 26.68%
Market Cap Amount(Cr.) % Holding
Large Cap 455 58
Mid Cap 182 23
Small Cap 122 15
Others 28 4
AUM (Crs.) 787 The fund invest in companies which are either at their nascent or developing stage and are under researched. Although relatively volatile in the short run, small and mid cap companies have the potential to deliver higher growth in the long term. The portfolio continues to be pro-cyclical and tilted towards economic recovery. As a result the fund continue to be Overweight on sectors such as cement, capital goods, auto ancillary and consumer discretionary. During the months the fund increased weightage to financials (mainly private sector banks) post the correction and also increased stock specific names in the infrastructure sector.
A
Trend of QFSI over last 3 years
Data as of 30th September 2015
0.00 0.20 0.40 0.60 0.80 1.00 1.20
Sep-
12
Dec
-12
Mar
-13
Jun-
13
Sep-
13
Dec
-13
Mar
-14
Jun-
14
Sep-
14
Dec
-14
Mar
-15
Jun-
15
Sep-
15

21
Quarter on Quarter return vis‐à‐vis quant’s benchmark and category average Positive months in the last 3 year v/s negative months relative to quant’s benchmark
Top 10 holdings for the fund Sectoral movement of the portfolio over the last 4 quarters
Kotak Emerging Fund – Mid Cap Fund
Company Sector %age
IndusInd Bank Ltd. Bank - Private 3.61
Whirlpool Of India Ltd. Consumer Durables - Domestic 3.45
The Ramco Cements Ltd. Cement & Construction Materials 2.94
Persistent Systems Ltd. IT - Software 2.50
Solar Industries (India) Ltd. Chemicals 2.48
The Federal Bank Ltd. Bank - Private 2.45
Strides Arcolab Ltd. Pharmaceuticals & Drugs 2.38
Shriram City Union Finance Ltd. Finance - NBFC 2.36
V-Guard Industries Ltd. Electronics - Components 2.32
Hawkins Cookers Ltd. Consumer Durables - Domestic 2.19
-4%
-3%
-2%
-1%
0%
1%
2%
3%
4%
5%
0%
10%
20%
30%
40%
50%
60%
70%
80%
90%
100%
Dec-14 Mar-15 Jun-15 Sep-15
Cash & Cash Equivalent
Other Sector
Plastic Products
IT - Software
Chemicals
Printing And Publishing
Cement & Construction Materials
Finance - NBFC
Consumer Durables - Domestic
Engineering - Construction
Pharmaceuticals & Drugs
Bank - Private
-20%
-15%
-10%
-5%
0%
5%
10%
15%
20%
25%
30%
35%
Sep-
12
Dec-
12
Mar
-13
Jun-
13
Sep-
13
Dec-
13
Mar
-14
Jun-
14
Sep-
14
Dec-
14
Mar
-15
Jun-
15
Sep-
15
Fund Return Bechmark Return Category Average

22
NAV Movement | Mid Cap Portfolio
Portfolio NAV movement of mid cap portfolio on the basis of quant Fund Selection Indicator (QFSI) against CNX Midcap (quant benchmark) and category average of mid cap funds for the period Apr 05 to Sep 15. The fund selected for the portfolio holds highest rank as per QFSI. The portfolio NAV is calculated taking in account exit load and tax implication, as applicable
Portfolio Outperformance vis-à-
vis category average
50
150
250
350
450
550
650
750
850
950
Apr-05 Apr-06 Apr-07 Apr-08 Apr-09 Apr-10 Apr-11 Apr-12 Apr-13 Apr-14 Apr-15
CNX Midcap Category Average Mid Cap
23
Investment Style Growth Blend Value
Large M
arket Cap
Medium
Small
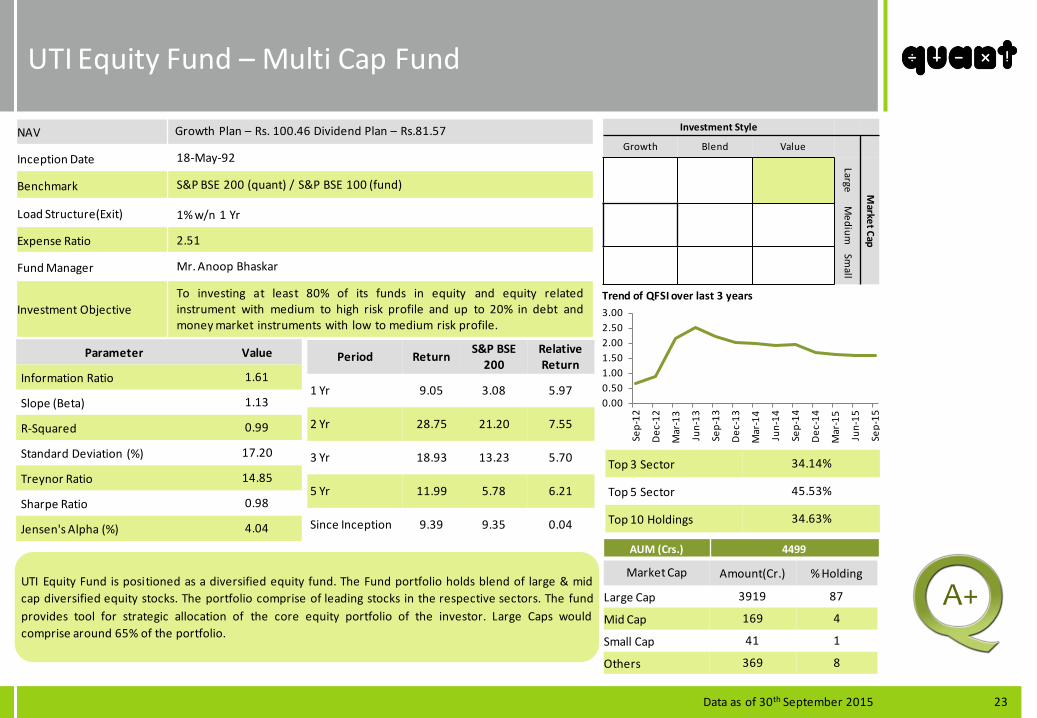
UTI Equity Fund – Multi Cap Fund
Parameter Value
Information Ratio 1.61
Slope (Beta) 1.13
R-Squared 0.99
Standard Deviation (%) 17.20
Treynor Ratio 14.85
Sharpe Ratio 0.98
Jensen's Alpha (%) 4.04
Period Return S&P BSE 200
Relative Return
1 Yr 9.05 3.08 5.97
2 Yr 28.75 21.20 7.55
3 Yr 18.93 13.23 5.70
5 Yr 11.99 5.78 6.21
Since Inception 9.39 9.35 0.04
UTI Equity Fund is positioned as a diversified equity fund. The Fund portfolio holds blend of large & mid cap diversified equity stocks. The portfolio comprise of leading stocks in the respective sectors. The fund provides tool for strategic allocation of the core equity portfolio of the investor. Large Caps would comprise around 65% of the portfolio.
Top 3 Sector 34.14%
Top 5 Sector 45.53%
Top 10 Holdings 34.63%
Market Cap Amount(Cr.) % Holding
Large Cap 3919 87
Mid Cap 169 4
Small Cap 41 1
Others 369 8
AUM (Crs.) 4499
NAV Growth Plan – Rs. 100.46 Dividend Plan – Rs.81.57
Inception Date 18-May-92
Benchmark S&P BSE 200 (quant) / S&P BSE 100 (fund)
Load Structure(Exit) 1% w/n 1 Yr
Expense Ratio 2.51
Fund Manager Mr. Anoop Bhaskar
Investment Objective To investing at least 80% of its funds in equity and equity related instrument with medium to high risk profile and up to 20% in debt and money market instruments with low to medium risk profile.
Trend of QFSI over last 3 years
A+
0.00 0.50 1.00 1.50 2.00 2.50 3.00
Sep-
12
Dec
-12
Mar
-13
Jun-
13
Sep-
13
Dec
-13
Mar
-14
Jun-
14
Sep-
14
Dec
-14
Mar
-15
Jun-
15
Sep-
15
Data as of 30th September 2015

24
Quarter on Quarter return vis‐à‐vis quant’s benchmark and category average Positive months in the last 3 year v/s negative months relative to quant’s benchmark
Top 10 holdings for the fund Sectoral movement of the portfolio over the last 4 quarters
UTI Equity Fund – Multi Cap Fund
Company Sector %age
HDFC Bank Ltd. Bank - Private 6.09
Infosys Ltd. IT - Software 5.28
Tata Consultancy Services Ltd. IT - Software 3.95
Reliance Industries Ltd. Refineries 3.35
ICICI Bank Ltd. Bank - Private 3.28
Shree Cement Ltd. Cement & Construction Materials 3.25
Sun Pharmaceutical Industries Ltd. Pharmaceuticals & Drugs 2.66
Maruti Suzuki India Ltd. Automobiles - Passenger Cars 2.42
Lupin Ltd. Pharmaceuticals & Drugs 2.21
Axis Bank Ltd. Bank - Private 2.15
Data as of 30th September 2015
-3%
-2%
-1%
0%
1%
2%
3%
-10%
-5%
0%
5%
10%
15%
20%
25%
Sep-
12
Dec-
12
Mar
-13
Jun-
13
Sep-
13
Dec-
13
Mar
-14
Jun-
14
Sep-
14
Dec-
14
Mar
-15
Jun-
15
Sep-
15
Fund Return Bechmark Return Category Average
0%
10%
20%
30%
40%
50%
60%
70%
80%
90%
100%
Dec-14 Mar-15 Jun-15 Sep-15
Cash & Cash Equivalent
Other Sector
Telecommunication - Service
Auto Ancillary
Automobiles-Trucks/Lcv
Engineering - Construction
Bank - Public
Cement & Construction Materials
Refineries
Pharmaceuticals & Drugs
IT - Software
Bank - Private
25
Investment Style Growth Blend Value
Large M
arket Cap
Medium
Small
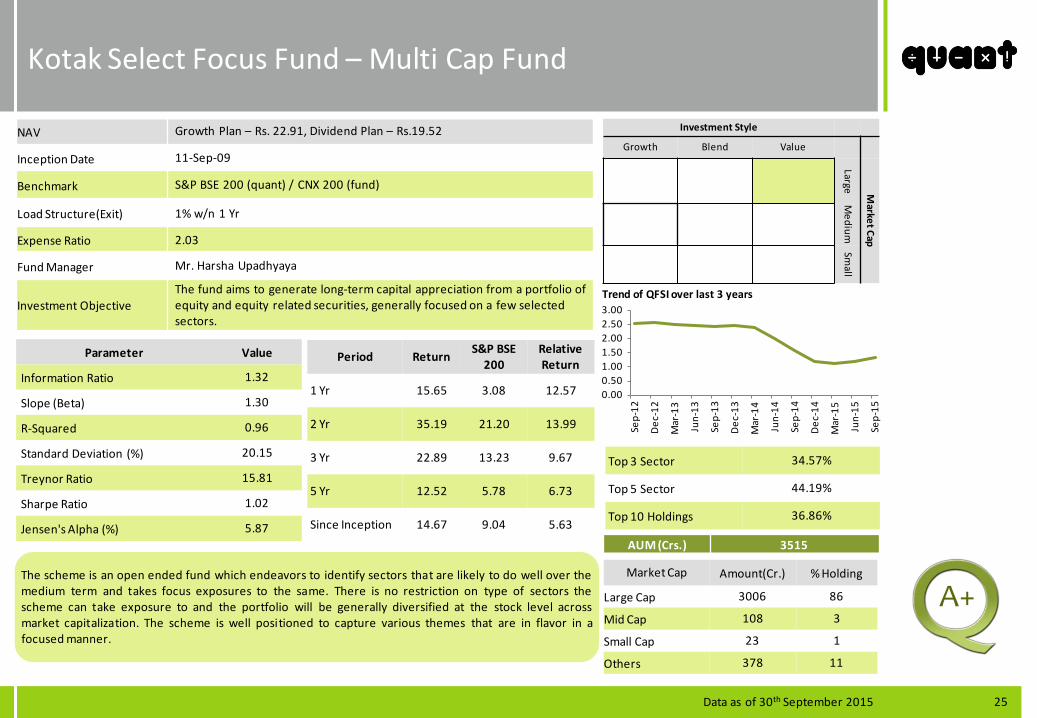
Kotak Select Focus Fund – Multi Cap Fund
NAV Growth Plan – Rs. 22.91, Dividend Plan – Rs.19.52
Inception Date 11-Sep-09
Benchmark S&P BSE 200 (quant) / CNX 200 (fund)
Load Structure(Exit) 1% w/n 1 Yr
Expense Ratio 2.03
Fund Manager Mr. Harsha Upadhyaya
Investment Objective The fund aims to generate long-term capital appreciation from a portfolio of equity and equity related securities, generally focused on a few selected sectors.
Parameter Value
Information Ratio 1.32
Slope (Beta) 1.30
R-Squared 0.96
Standard Deviation (%) 20.15
Treynor Ratio 15.81
Sharpe Ratio 1.02
Jensen's Alpha (%) 5.87
Period Return S&P BSE 200
Relative Return
1 Yr 15.65 3.08 12.57
2 Yr 35.19 21.20 13.99
3 Yr 22.89 13.23 9.67
5 Yr 12.52 5.78 6.73
Since Inception 14.67 9.04 5.63
The scheme is an open ended fund which endeavors to identify sectors that are likely to do well over the medium term and takes focus exposures to the same. There is no restriction on type of sectors the scheme can take exposure to and the portfolio will be generally diversified at the stock level across market capitalization. The scheme is well positioned to capture various themes that are in flavor in a focused manner.
Top 3 Sector 34.57%
Top 5 Sector 44.19%
Top 10 Holdings 36.86%
AUM (Crs.) 3515
A+
Trend of QFSI over last 3 years
Market Cap Amount(Cr.) % Holding
Large Cap 3006 86
Mid Cap 108 3
Small Cap 23 1
Others 378 11
0.00 0.50 1.00 1.50 2.00 2.50 3.00
Sep-
12
Dec
-12
Mar
-13
Jun-
13
Sep-
13
Dec
-13
Mar
-14
Jun-
14
Sep-
14
Dec
-14
Mar
-15
Jun-
15
Sep-
15
Data as of 30th September 2015
26
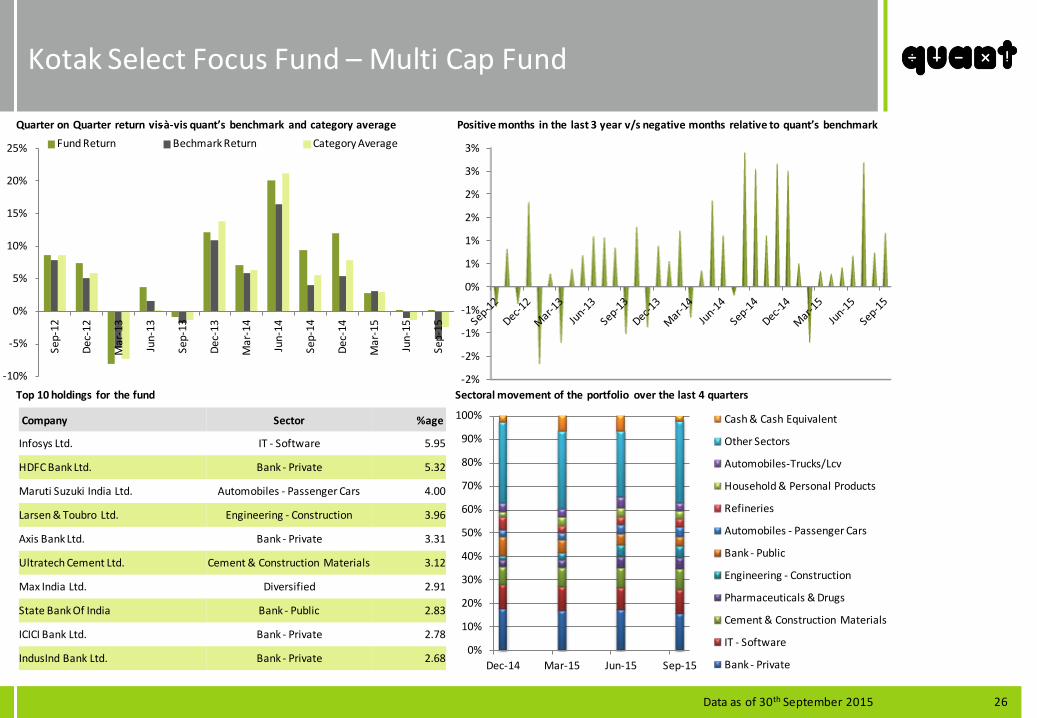
Quarter on Quarter return vis‐à‐vis quant’s benchmark and category average Positive months in the last 3 year v/s negative months relative to quant’s benchmark
Top 10 holdings for the fund Sectoral movement of the portfolio over the last 4 quarters
Kotak Select Focus Fund – Multi Cap Fund
Company Sector %age
Infosys Ltd. IT - Software 5.95
HDFC Bank Ltd. Bank - Private 5.32
Maruti Suzuki India Ltd. Automobiles - Passenger Cars 4.00
Larsen & Toubro Ltd. Engineering - Construction 3.96
Axis Bank Ltd. Bank - Private 3.31
Ultratech Cement Ltd. Cement & Construction Materials 3.12
Max India Ltd. Diversified 2.91
State Bank Of India Bank - Public 2.83
ICICI Bank Ltd. Bank - Private 2.78
IndusInd Bank Ltd. Bank - Private 2.68
-10%
-5%
0%
5%
10%
15%
20%
25%
Sep-
12
Dec-
12
Mar
-13
Jun-
13
Sep-
13
Dec-
13
Mar
-14
Jun-
14
Sep-
14
Dec-
14
Mar
-15
Jun-
15
Sep-
15
Fund Return Bechmark Return Category Average
-2%
-2%
-1%
-1%
0%
1%
1%
2%
2%
3%
3%
0%
10%
20%
30%
40%
50%
60%
70%
80%
90%
100%
Dec-14 Mar-15 Jun-15 Sep-15
Cash & Cash Equivalent
Other Sectors
Automobiles-Trucks/Lcv
Household & Personal Products
Refineries
Automobiles - Passenger Cars
Bank - Public
Engineering - Construction
Pharmaceuticals & Drugs
Cement & Construction Materials
IT - Software
Bank - Private
Data as of 30th September 2015

27
Investment Style Growth Blend Value
Large M
arket Cap
Medium
Small
L&T Value Fund – Multi Cap Fund
NAV Growth Plan – Rs. 24.73 Dividend Plan – Rs.21.30
Inception Date 08-Jan-10
Benchmark S&P BSE 200 (quant / fund)
Load Structure(Exit) 1% w/n 1 Yr
Expense Ratio 2.47
Fund Manager Mr. Venugopal M.
Investment Objective
To generate long-term capital appreciation from a diversified portfolio of predominantly equity and equity related securities, in the Indian markets with higher focus on undervalued securities. The Scheme could also additionally invest in Foreign Securities in international markets.
Parameter Value
Information Ratio 1.05
Slope (Beta) 1.83
R-Squared 0.96
Standard Deviation (%) 28.59
Treynor Ratio 14.76
Sharpe Ratio 0.94
Jensen's Alpha (%) 6.29
Period Return S&P BSE 200
Relative Return
1 Yr 21.83 3.08 18.75
2 Yr 46.76 21.20 25.56
3 Yr 29.53 13.23 16.31
5 Yr 15.18 5.78 9.40
Since Inception 17.12 7.52 9.60
The fund is diversified equity fund with strong value bias that aims to deliver long term superior risk adjusted returns. The fund focus on identifying valuation anomalies versus the economic potential of the business over the medium term. This approach not only helps in identifying undervalued stocks but also factor-in the risk elements while picking stocks.
Top 3 Sector 24.62%
Top 5 Sector 35.77%
Top 10 Holdings 30.45%
Market Cap Amount(Cr.) % Holding
Large Cap 227 56
Mid Cap 78 19
Small Cap 78 19
Others 20 5
AUM (Crs.) 403
A
Trend of QFSI over last 3 years
Data as of 30th September 2015
0.00 0.20 0.40 0.60 0.80 1.00 1.20
Sep-
12
Dec
-12
Mar
-13
Jun-
13
Sep-
13
Dec
-13
Mar
-14
Jun-
14
Sep-
14
Dec
-14
Mar
-15
Jun-
15
Sep-
15
28
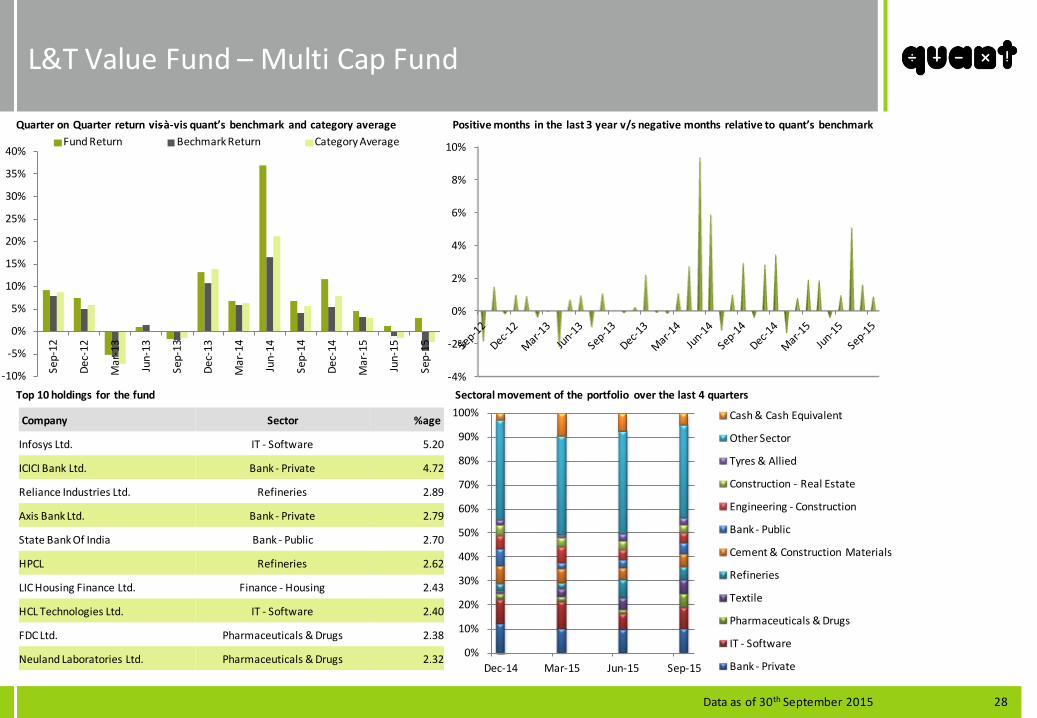
Quarter on Quarter return vis‐à‐vis quant’s benchmark and category average Positive months in the last 3 year v/s negative months relative to quant’s benchmark
Top 10 holdings for the fund Sectoral movement of the portfolio over the last 4 quarters
L&T Value Fund – Multi Cap Fund
Company Sector %age
Infosys Ltd. IT - Software 5.20
ICICI Bank Ltd. Bank - Private 4.72
Reliance Industries Ltd. Refineries 2.89
Axis Bank Ltd. Bank - Private 2.79
State Bank Of India Bank - Public 2.70
HPCL Refineries 2.62
LIC Housing Finance Ltd. Finance - Housing 2.43
HCL Technologies Ltd. IT - Software 2.40
FDC Ltd. Pharmaceuticals & Drugs 2.38
Neuland Laboratories Ltd. Pharmaceuticals & Drugs 2.32
-10%
-5%
0%
5%
10%
15%
20%
25%
30%
35%
40%
Sep-
12
Dec-
12
Mar
-13
Jun-
13
Sep-
13
Dec-
13
Mar
-14
Jun-
14
Sep-
14
Dec-
14
Mar
-15
Jun-
15
Sep-
15
Fund Return Bechmark Return Category Average
-4%
-2%
0%
2%
4%
6%
8%
10%
0%
10%
20%
30%
40%
50%
60%
70%
80%
90%
100%
Dec-14 Mar-15 Jun-15 Sep-15
Cash & Cash Equivalent
Other Sector
Tyres & Allied
Construction - Real Estate
Engineering - Construction
Bank - Public
Cement & Construction Materials
Refineries
Textile
Pharmaceuticals & Drugs
IT - Software
Bank - Private
Data as of 30th September 2015

29
Investment Style Growth Blend Value
Large M
arket Cap
Medium
Small
DSP BR Focus 25 Fund – Multi Cap Fund
NAV Growth Plan – Rs. 17.23, Dividend Plan – Rs.15.46
Inception Date 10-Jun-10
Benchmark S&P BSE 200 (quant / fund)
Load Structure(Exit) 1% w/n 12 Months
Expense Ratio 2.60
Fund Manager Mr. Harish Zaveri
Investment Objective The primary investment objective of the Scheme is to generate long-term capital growth from a portfolio of equity and equity-related securities including equity derivatives
Parameter Value
Information Ratio 0.48
Slope (Beta) 1.35
R-Squared 0.93
Standard Deviation (%) 21.62
Treynor Ratio 11.69
Sharpe Ratio 0.73
Jensen's Alpha (%) 0.55
Period Return S&P BSE 200
Relative Return
1 Yr 13.72 3.08 10.64
2 Yr 33.03 21.20 11.83
3 Yr 19.77 13.23 6.54
5 Yr 8.78 5.78 3.00
Since Inception 10.79 8.67 2.12
The Portfolio strategy is a blend of Value and active fund manage ment keeping in line with the current volatile markets. The portfolio largely consist of companies, which are amongst the top 200 companies by market capitalization. The portfolio will limit exposure to companies beyond the top 200 companies by market capitalization up to 20% of the net asse t value. The Scheme will normally hold equity and equity-related securities including equity derivatives, of up to 25 companies.
Top 3 Sector 39.63%
Top 5 Sector 54.15%
Top 10 Holdings 60.67%
Market Cap Amount(Cr.) % Holding
Large Cap 784 97
Small Cap 9 1
Others 16 2
AUM (Crs.) 809
A
Trend of QFSI over last 3 years
Data as of 30th September 2015
-0.30 -0.20 -0.10 0.00 0.10 0.20 0.30 0.40 0.50 0.60
Sep-
12
Dec
-12
Mar
-13
Jun-
13
Sep-
13
Dec
-13
Mar
-14
Jun-
14
Sep-
14
Dec
-14
Mar
-15
Jun-
15
Sep-
15

30
Quarter on Quarter return vis‐à‐vis quant’s benchmark and category average Positive months in the last 3 year v/s negative months relative to quant’s benchmark
Top 10 holdings for the fund Sectoral movement of the portfolio over the last 4 quarters
DSP BR Focus 25 Fund – Multi Cap Fund
Company Sector %age
Maruti Suzuki India Ltd. Automobiles - Passenger Cars 9.42
HDFC Bank Ltd. Bank - Private 8.53
IndusInd Bank Ltd. Bank - Private 5.93
Infosys Ltd. IT - Software 5.90
Cadila Healthcare Ltd. Pharmaceuticals & Drugs 5.55
Tata Consultancy Services Ltd. IT - Software 5.53
State Bank Of India Bank - Public 5.53
Cummins India Ltd. Diesel Engines 5.41
Bharat Petroleum Corporation Ltd. Refineries 4.52
Larsen & Toubro Ltd. Engineering - Construction 4.35
Data as of 30th September 2015
-15%
-10%
-5%
0%
5%
10%
15%
20%
25%
Sep-
12
Dec-
12
Mar
-13
Jun-
13
Sep-
13
Dec-
13
Mar
-14
Jun-
14
Sep-
14
Dec-
14
Mar
-15
Jun-
15
Sep-
15
Fund Return Bechmark Return Category Average
-3%
-2%
-1%
0%
1%
2%
3%
4%
0%
10%
20%
30%
40%
50%
60%
70%
80%
90%
100%
Dec-14 Mar-15 Jun-15 Sep-15
Cash & Cash Equivalent
Other Sectors
Engineering - Construction
Diesel Engines
Bank - Public
Pharmaceuticals & Drugs
Cement & Construction Materials
Refineries
Automobiles-Trucks/Lcv
Automobiles - Passenger Cars
IT - Software
Bank - Private

31
NAV Movement | Multi Cap Portfolio
Portfolio NAV movement of multi cap portfolio on the basis of quant Fund Selection Indicator (QFSI) against S&P BSE 200 (quant benchmark) and category average of multi cap funds for the period Apr 05 to Sep 15. The fund selected for the portfolio holds highest rank as per QFSI. The portfolio NAV is calculated taking in account exit load and tax implication, as applicable
Portfolio Outperformance vis-à-vis
category average
Portfolio Outperformance vis-à-vis
benchmark
50
150
250
350
450
550
650
750 S&P BSE 200 Category Average Multi Cap

32
ICICI Prudential Balanced Advantage Fund – Hybrid Fund
NAV Growth Plan – Rs. 25.89 Dividend Plan – Rs.16.85
Inception Date 30-Dec-2006
Benchmark Crisil Balanced Fund Index (quant / fund)
Load Structure(Exit) 1% w/n 18 Months
Expense Ratio 1.75
Fund Manager Mr. Manish Banthia
Investment Objective The scheme seeks to provide capital appreciation and income distribution to the investors by using equity derivatives strategies, arbitrage opportunities and pure equity investments.
Parameter Value
Information Ratio 2.04
Slope (Beta) 0.99
R-Squared 0.95
Standard Deviation (%) 9.30
Treynor Ratio 13.07
Sharpe Ratio 1.38
Jensen's Alpha (%) 6.00
Period Return Crisil
Balanced Fund Index
Relative Return
1 Yr 10.22 4.38 5.84
2 Yr 22.30 15.99 6.31
3 Yr 16.93 11.07 5.86
5 Yr 13.25 6.99 6.27
Since Inception 11.48 8.79 2.69
ICICI Prudential Balanced Advantage Fund is an Open ended Equity Fund that aims to make investing easy and less stressful, by allocating between different investment options as per changing market conditions. It invests in a judicious mix of cash equities, equity derivatives and debt & money market securities. It is structured to control volatility and has an equity related tax status. It uses multiple strategies to allow flexibility and allows you to participate in equity markets at a controlled risk
Investment Style
Growth Blend Value
Large M
arket Cap
Medium
Small
Top 3 Sector 27.86%
Top 5 Sector 34.73%
Top 10 Holdings 26.33%
AUM (Crs.) 9019
A++
Trend of QFSI over last 3 years
Data as of 30th September 2015
Market Cap Amount(Cr.) % Holding
Large Cap 5853 65
Mid Cap 124 1
Small Cap 50 1
Others 2992 33
0.00
0.50
1.00
1.50
2.00
2.50
Sep-
12
Dec
-12
Mar
-13
Jun-
13
Sep-
13
Dec
-13
Mar
-14
Jun-
14
Sep-
14
Dec
-14
Mar
-15
Jun-
15
Sep-
15

33
Quarter on Quarter return vis‐à‐vis quant’s benchmark and category average Positive months in the last 3 year v/s negative months relative to quant’s benchmark
Top 10 holdings for the fund Sectoral movement of the portfolio over the last 4 quarters
ICICI Prudential Balanced Advantage Fund – Hybrid Fund
Company Sector %age
HDFC Bank Ltd. Bank - Private 5.44
Infosys Ltd. IT - Software 3.27
ITC Ltd. Cigarettes/Tobacco 3.05
HCL Technologies Ltd. IT - Software 2.98
Reliance Industries Ltd. Refineries 2.72
ICICI Bank Ltd. Bank - Private 2.68
Tech Mahindra Ltd. IT - Software 2.31
ACC Ltd. Cement & Construction Materials 1.93
Mahindra & Mahindra Ltd. Automobiles - Passenger Cars 1.76
NTPC Ltd. Power Generation/Distribution 1.72
Data as of 30th September 2015
0%
10%
20%
30%
40%
50%
60%
70%
80%
90%
100%
Dec-14 Mar-15 Jun-15 Sep-15
Cash & Cash Equivalent
Other Sector
Oil Exploration
Automobiles - Passenger Cars
Diversified
Cement & Construction Materials
Cigarettes/Tobacco
Power Generation/Distribution
Refineries
Pharmaceuticals & Drugs
IT - Software
Bank - Private
-10%
-5%
0%
5%
10%
15%
20%
Sep-
12
Dec-
12
Mar
-13
Jun-
13
Sep-
13
Dec-
13
Mar
-14
Jun-
14
Sep-
14
Dec-
14
Mar
-15
Jun-
15
Sep-
15
Fund Return Bechmark Return Category Average
-3%
-2%
-1%
0%
1%
2%
3%
34
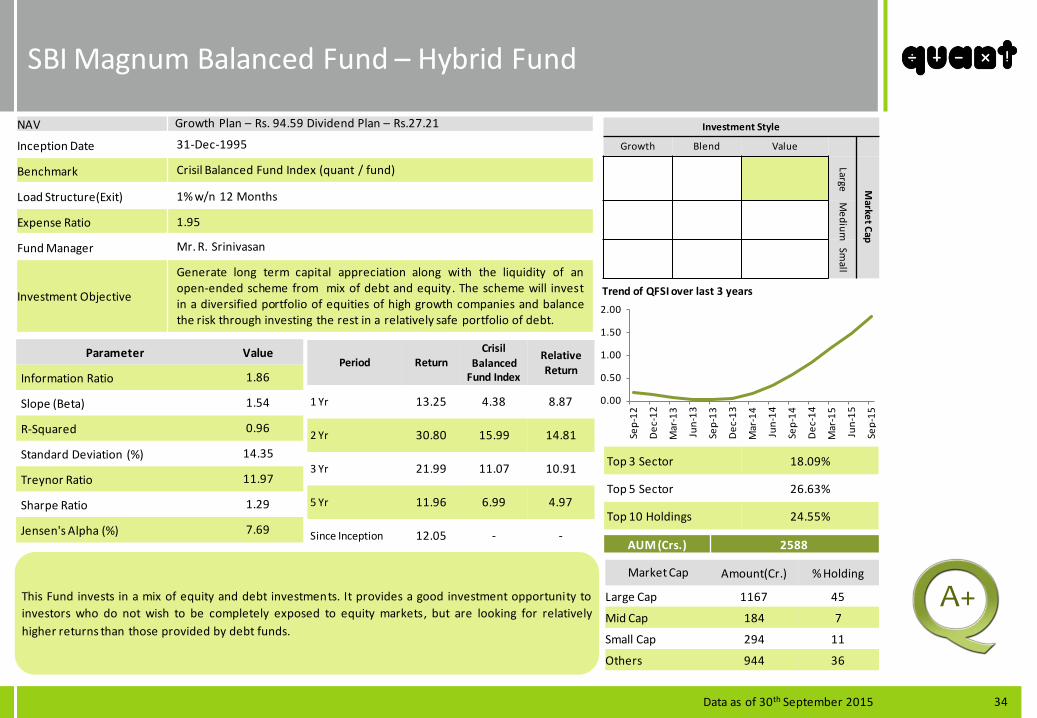
SBI Magnum Balanced Fund – Hybrid Fund
NAV Growth Plan – Rs. 94.59 Dividend Plan – Rs.27.21
Inception Date 31-Dec-1995
Benchmark Crisil Balanced Fund Index (quant / fund)
Load Structure(Exit) 1% w/n 12 Months
Expense Ratio 1.95
Fund Manager Mr. R. Srinivasan
Investment Objective
Generate long term capital appreciation along with the liquidity of an open-ended scheme from mix of debt and equity. The scheme will invest in a diversified portfolio of equities of high growth companies and balance the risk through investing the rest in a relatively safe portfolio of debt.
Parameter Value
Information Ratio 1.86
Slope (Beta) 1.54
R-Squared 0.96
Standard Deviation (%) 14.35
Treynor Ratio 11.97
Sharpe Ratio 1.29
Jensen's Alpha (%) 7.69
Period Return Crisil
Balanced Fund Index
Relative Return
1 Yr 13.25 4.38 8.87
2 Yr 30.80 15.99 14.81
3 Yr 21.99 11.07 10.91
5 Yr 11.96 6.99 4.97
Since Inception 12.05 - -
This Fund invests in a mix of equity and debt investments. It provides a good investment opportunity to investors who do not wish to be completely exposed to equity markets, but are looking for relatively higher returns than those provided by debt funds.
Investment Style
Growth Blend Value
Large M
arket Cap
Medium
Small
Top 3 Sector 18.09%
Top 5 Sector 26.63%
Top 10 Holdings 24.55%
AUM (Crs.) 2588
A+
Trend of QFSI over last 3 years
Data as of 30th September 2015
Market Cap Amount(Cr.) % Holding
Large Cap 1167 45
Mid Cap 184 7
Small Cap 294 11
Others 944 36
0.00
0.50
1.00
1.50
2.00
Sep-
12
Dec
-12
Mar
-13
Jun-
13
Sep-
13
Dec
-13
Mar
-14
Jun-
14
Sep-
14
Dec
-14
Mar
-15
Jun-
15
Sep-
15

35
Quarter on Quarter return vis‐à‐vis quant’s benchmark and category average Positive months in the last 3 year v/s negative months relative to quant’s benchmark
Top 10 holdings for the fund Sectoral movement of the portfolio over the last 4 quarters
SBI Magnum Balanced Fund – Hybrid Fund
Company Sector %age
HDFC Bank Ltd. Bank - Private 3.18
Maruti Suzuki India Ltd. Automobiles - Passenger Cars 3.08
SJVN Ltd. Power Generation/Distribution 3.00
Coal India Ltd. Mining & Minerals 2.40
Sun Pharmaceutical Industries Ltd. Pharmaceuticals & Drugs 2.35
Cadila Healthcare Ltd. Pharmaceuticals & Drugs 2.34
P&G Hygiene & Health Care Ltd. Household & Personal Products 2.16
3M India Ltd. Diversified 2.10
Sundaram Finance Ltd. Finance - NBFC 2.01
Kotak Mahindra Bank Ltd. Bank - Private 1.93
Data as of 30th September 2015
-10%
-5%
0%
5%
10%
15%
20%
Sep-
12
Dec-
12
Mar
-13
Jun-
13
Sep-
13
Dec-
13
Mar
-14
Jun-
14
Sep-
14
Dec-
14
Mar
-15
Jun-
15
Sep-
15
Fund Return Bechmark Return Category Average
-3%
-2%
-1%
0%
1%
2%
3%
4%
5%
-20%
0%
20%
40%
60%
80%
100%
Dec-14 Mar-15 Jun-15 Sep-15
Cash & Cash Equivalent
Other Sector
Diversified
Household & Personal Products
Mining & Minerals
Automobiles - Passenger Cars
Auto Ancillary
Finance - NBFC
Power Generation/Distribution
Pharmaceuticals & Drugs
IT - Software
Bank - Private
36
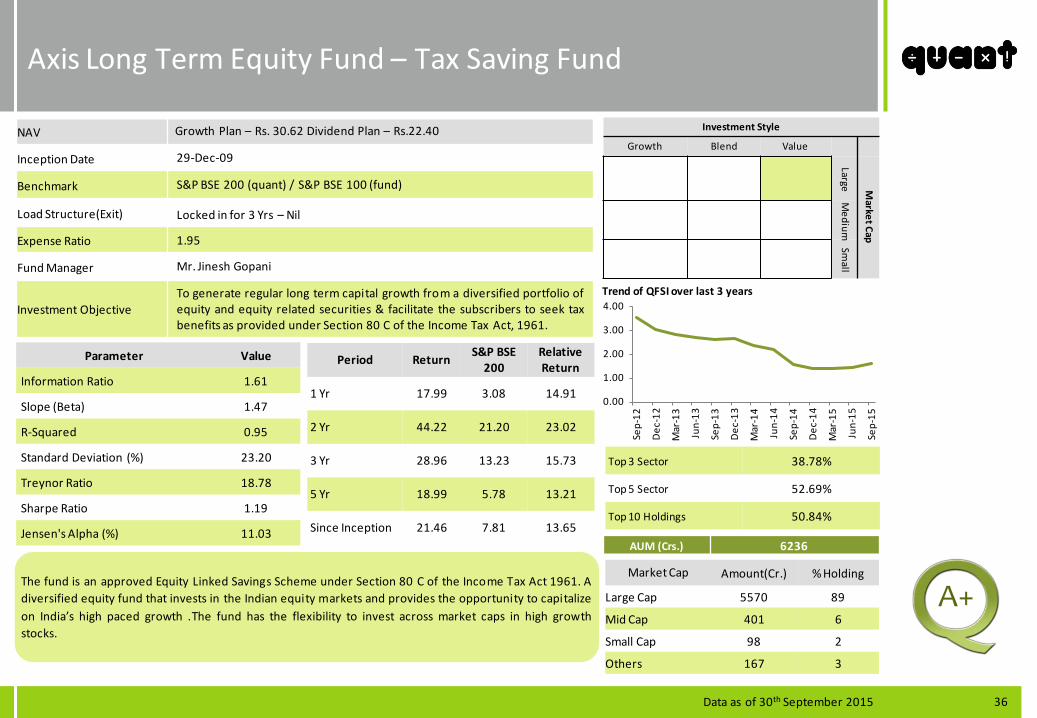
Axis Long Term Equity Fund – Tax Saving Fund
NAV Growth Plan – Rs. 30.62 Dividend Plan – Rs.22.40
Inception Date 29-Dec-09
Benchmark S&P BSE 200 (quant) / S&P BSE 100 (fund)
Load Structure(Exit) Locked in for 3 Yrs – Nil
Expense Ratio 1.95
Fund Manager Mr. Jinesh Gopani
Investment Objective To generate regular long term capital growth from a diversified portfolio of equity and equity related securities & facilitate the subscribers to seek tax benefits as provided under Section 80 C of the Income Tax Act, 1961.
Parameter Value
Information Ratio 1.61
Slope (Beta) 1.47
R-Squared 0.95
Standard Deviation (%) 23.20
Treynor Ratio 18.78
Sharpe Ratio 1.19
Jensen's Alpha (%) 11.03
Period Return S&P BSE 200
Relative Return
1 Yr 17.99 3.08 14.91
2 Yr 44.22 21.20 23.02
3 Yr 28.96 13.23 15.73
5 Yr 18.99 5.78 13.21
Since Inception 21.46 7.81 13.65
The fund is an approved Equity Linked Savings Scheme under Section 80 C of the Income Tax Act 1961. A diversified equity fund that invests in the Indian equity markets and provides the opportunity to capitalize on India’s high paced growth .The fund has the flexibility to invest across market caps in high growth stocks.
Investment Style
Growth Blend Value
Large M
arket Cap
Medium
Small
Top 3 Sector 38.78%
Top 5 Sector 52.69%
Top 10 Holdings 50.84%
Market Cap Amount(Cr.) % Holding
Large Cap 5570 89
Mid Cap 401 6
Small Cap 98 2
Others 167 3
AUM (Crs.) 6236
A+
Trend of QFSI over last 3 years
Data as of 30th September 2015
0.00
1.00
2.00
3.00
4.00
Sep-
12
Dec
-12
Mar
-13
Jun-
13
Sep-
13
Dec
-13
Mar
-14
Jun-
14
Sep-
14
Dec
-14
Mar
-15
Jun-
15
Sep-
15

37
Quarter on Quarter return vis‐à‐vis quant’s benchmark and category average Positive months in the last 3 year v/s negative months relative to quant’s benchmark
Top 10 holdings for the fund Sectoral movement of the portfolio over the last 4 quarters
Axis Long Term Equity Fund – Tax Saving Fund
Company Sector %age
HDFC Bank Ltd. Bank - Private 8.26
Kotak Mahindra Bank Ltd. Bank - Private 6.63
Tata Consultancy Services Ltd. IT - Software 6.58
HDFC Ltd. Finance - Housing 5.58
Sun Pharmaceutical Industries Ltd. Pharmaceuticals & Drugs 5.41
Maruti Suzuki India Ltd. Automobiles - Passenger Cars 4.09
Tech Mahindra Ltd. IT - Software 4.06
Pidilite Industries Ltd. Chemicals 3.91
Cummins India Ltd. Diesel Engines 3.21
TTK Prestige Ltd. Consumer Durables 3.11
Data as of 30th September 2015
-15%
-10%
-5%
0%
5%
10%
15%
20%
25%
Sep-
12
Dec-
12
Mar
-13
Jun-
13
Sep-
13
Dec-
13
Mar
-14
Jun-
14
Sep-
14
Dec-
14
Mar
-15
Jun-
15
Sep-
15
Fund Return Bechmark Return Category Average
-6%
-4%
-2%
0%
2%
4%
6%
0%
10%
20%
30%
40%
50%
60%
70%
80%
90%
100%
Dec-14 Mar-15 Jun-15 Sep-15
Cash & Cash Equivalent
Other Sectors
Diesel Engines
Chemicals
Automobiles - Passenger Cars
Finance - NBFC
Consumer Durables - Domestic
Auto Ancillary
Finance - Housing
Pharmaceuticals & Drugs
IT - Software
Bank - Private

38
BNP Paribas LT Equity Fund – Tax Saving Fund
NAV Growth Plan – Rs. 29.39 Dividend Plan – Rs.16.49
Inception Date 05-Jan-06
Benchmark S&P BSE 200 (quant) / CNX 200 (fund)
Load Structure(Exit) Locked in for 3 Yrs – Nil
Expense Ratio 2.67
Fund Manager Mr. Shreyash Devalkar
Investment Objective
The investment objective of the Scheme is to generate long-term capital growth from a diversified and actively managed portfolio of equity and equity related securities along with income tax rebate, as may be prevalent from time to time.
Parameter Value
Information Ratio 1.39
Slope (Beta) 1.27
R-Squared 0.96
Standard Deviation (%) 19.77
Treynor Ratio 16.40
Sharpe Ratio 1.05
Jensen's Alpha (%) 6.49
Period Return S&P BSE 200
Relative Return
1 Yr 13.63 3.08 10.55
2 Yr 33.39 21.20 12.19
3 Yr 23.32 13.23 10.09
5 Yr 14.20 5.78 8.42
Since Inception 11.70 10.94 0.76
The fund has active portfolio manage ment which enables the fund to capture suitable investment opportunities. The fund risk management is an integral part of the investment management process. This scheme also comes with a benefit of income tax exemption to the extent of money invested. The 3 years lock-in makes the fund less vulnerable to volatility in cash flows and the fund manager is able to manage the portfolio more efficiently
Investment Style
Growth Blend Value
Large M
arket Cap
Medium
Small
Top 3 Sector 47.45%
Top 5 Sector 61.07%
Top 10 Holdings 48.58%
AUM (Crs.) 408
A+
Trend of QFSI over last 3 years
Market Cap Amount(Cr.) % Holding
Large Cap 335 82
Mid Cap 51 13
Small Cap 9 2
Others 13 3
0.00
0.50
1.00
1.50
2.00
Sep-
12
Dec
-12
Mar
-13
Jun-
13
Sep-
13
Dec
-13
Mar
-14
Jun-
14
Sep-
14
Dec
-14
Mar
-15
Jun-
15
Sep-
15
Data as of 30th September 2015

39
Quarter on Quarter return vis‐à‐vis quant’s benchmark and category average Positive months in the last 3 year v/s negative months relative to quant’s benchmark
Top 10 holdings for the fund Sectoral movement of the portfolio over the last 4 quarters
BNP Paribas LT Equity Fund – Tax Saving Fund
Company Sector %age
HDFC Bank Ltd. Bank - Private 7.99
Idea Cellular Ltd. Telecommunication - Service 7.70
Bharti Airtel Ltd. Telecommunication - Service 7.37
IndusInd Bank Ltd. Bank - Private 5.36
Kotak Mahindra Bank Ltd. Bank - Private 3.98
Infosys Ltd. IT - Software 3.75
Lupin Ltd. Pharmaceuticals & Drugs 3.24
Axis Bank Ltd. Bank - Private 3.17
Maruti Suzuki India Ltd. Automobiles - Passenger Cars 3.04
Tata Consultancy Services Ltd. IT - Software 2.98
-15%
-10%
-5%
0%
5%
10%
15%
20%
25%
Sep-
12
Dec-
12
Mar
-13
Jun-
13
Sep-
13
Dec-
13
Mar
-14
Jun-
14
Sep-
14
Dec-
14
Mar
-15
Jun-
15
Sep-
15
Fund Return Bechmark Return Category Average
-3%
-2%
-1%
0%
1%
2%
3%
4%
5%
0%
10%
20%
30%
40%
50%
60%
70%
80%
90%
100%
Dec-14 Mar-15 Jun-15 Sep-15
Cash & Cash Equivalent
Other Sector
Film Production, Dist. & Enter.
Miscellaneous
Finance - NBFC
Automobiles - Passenger Cars
Cement & Construction Materials
Consumer Food
Pharmaceuticals & Drugs
IT - Software
Telecommunication - Service
Bank - Private
Data as of 30th September 2015

40
UTI MNC Fund – Thematic Fund
NAV Growth Plan – Rs. 151.55 Dividend Plan – Rs.90.32
Inception Date 14-Oct-1998
Benchmark CNX MNC (quant)
Load Structure(Exit) 1% w/n 1 Year
Expense Ratio 2.63
Fund Manager Mrs. Swati Kulkarni
Investment Objective
The Funds collected under the scheme shall be invested predominantly in stocks of Multinational Corporations and other liquid stocks. The funds collected under the scheme shall be invested in equities and equity related instruments. The risk profile of investment could be high
Period Return CNX MNC Relative Return
1 Yr 26.93 12.66 14.27
2 Yr 43.64 29.19 14.45
3 Yr 29.27 18.82 10.44
5 Yr 20.16 13.13 7.03
Since Inception 16,50 12.33 4.17
UTI MNC Fund is an open ended equity fund that provides access to investment opportunities across Multinational companies such as Eicher Motors Ltd., Bosch Ltd., Hindustan Unilever Ltd., Cummins India Ltd., Oracle Financial Services Software Ltd. and others. The fund is a diversified and differentiated equity fund with high growth potential.
Investment Style
Growth Blend Value
Large M
arket Cap
Medium
Small
Market Cap Amount(Cr.) % Holding
Large Cap 1382 86
Mid Cap 48 3
Small Cap 35 2
Others 141 9
AUM (Crs.) 1607
A+
Trend of Fund QFSI v/s CNX MNC over last 3 years
Top 10 Holding Sector %age
Maruti Suzuki India Ltd. Automobiles - Passenger 7.87 Bosch Ltd. Auto Ancillary 6.84 Hindustan Unilever Ltd. Household & Personal 6.30 United Spirits Ltd. Breweries & Distilleries 5.89 Cummins India Ltd. Diesel Engines 5.15 Ambuja Cements Ltd. Cement & Construction 4.81 Britannia Industries Ltd. Consumer Food 3.66 Sanofi India Ltd. Pharmaceuticals 3.39 Eicher Motors Ltd. Automobiles-Trucks/Lcv 3.33 Oracle Financial Services IT - Software 3.01
Data as of 30th September 2015
-20
0
20
40
60
80
100
120
Oct-12 Oct-13 Oct-14
41
Mutual Funds Research | Our Process | Debt Funds
Due diligence on AMCs
quantitative factors – AAUM over 6 months – INR 1000 crores or 1% market share
Qualitative factor – AMCs pedigree, sponsors’ background, investment team’s experience, service capabilities, etc.
Scheme filtering criteria’s
Classifying open ended debt schemes on the basis of – their investment objective & strategy into particular categories
Minimum Corpus – INR 100 crores (Short Term Fund) / INR 500 crores (Ultra Short Term Fund)
Risk – adjusted return analysis
Risk-adjusted returns to be estimated on the basis of quant Fund Selection Indicator (QFSI)
Focusing on credit rating and average maturity of the portfolio along with liquidity in the schemes
42
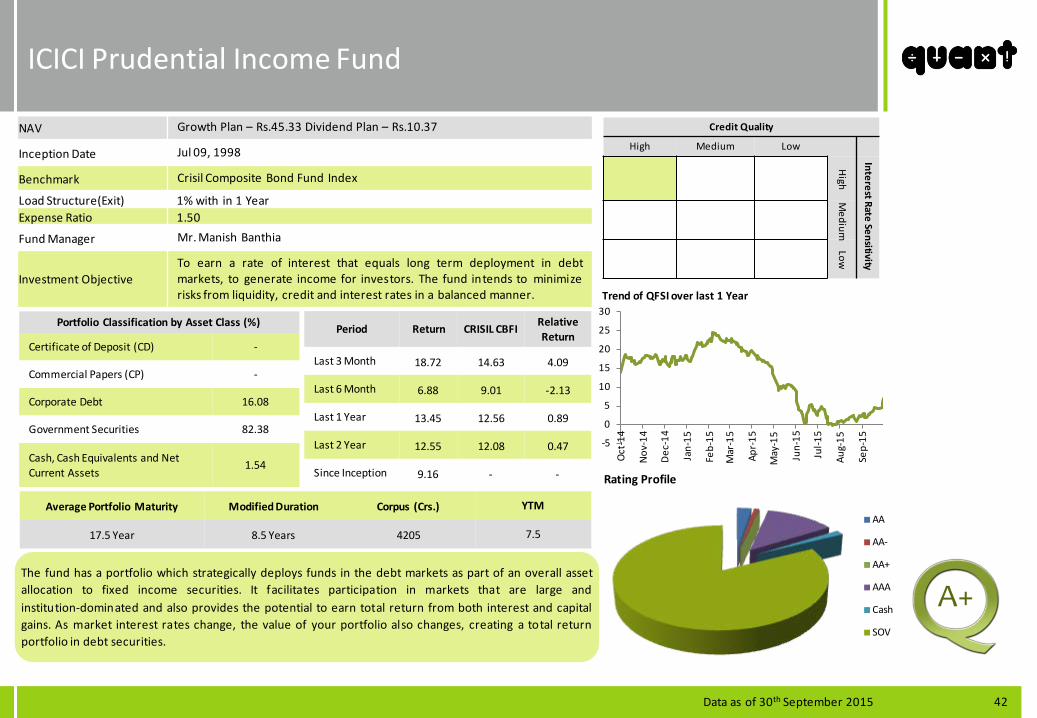
ICICI Prudential Income Fund
NAV Growth Plan – Rs.45.33 Dividend Plan – Rs.10.37
Inception Date Jul 09, 1998
Benchmark Crisil Composite Bond Fund Index
Load Structure(Exit) 1% with in 1 Year Expense Ratio 1.50
Fund Manager Mr. Manish Banthia
Investment Objective To earn a rate of interest that equals long term deployment in debt markets, to generate income for investors. The fund intends to minimize risks from liquidity, credit and interest rates in a balanced manner.
Portfolio Classification by Asset Class (%)
Certificate of Deposit (CD) -
Commercial Papers (CP) -
Corporate Debt 16.08
Government Securities 82.38
Cash, Cash Equivalents and Net Current Assets
1.54
Period Return CRISIL CBFI Relative Return
Last 3 Month 18.72 14.63 4.09
Last 6 Month 6.88 9.01 -2.13
Last 1 Year 13.45 12.56 0.89
Last 2 Year 12.55 12.08 0.47
Since Inception 9.16 - -
The fund has a portfolio which strategically deploys funds in the debt markets as part of an overall asset allocation to fixed income securities. It facilitates participation in markets that are large and institution-dominated and also provides the potential to earn total return from both interest and capital gains. As market interest rates change, the value of your portfolio also changes, creating a total return portfolio in debt securities.
Credit Quality
High Medium Low
H
igh
Interest Rate Sensitivity
Medium
Low
Average Portfolio Maturity Modified Duration Corpus (Crs.) YTM
17.5 Year 8.5 Years 4205 7.5
Trend of QFSI over last 1 Year
A+
Data as of 30th September 2015
-5
0
5
10
15
20
25
30
Oct
-14
Nov
-14
Dec
-14
Jan-
15
Feb-
15
Mar
-15
Apr-
15
May
-15
Jun-
15
Jul-1
5
Aug-
15
Sep-
15
Rating Profile
AA
AA-
AA+
AAA
Cash
SOV

43
HDFC High Interest Fund-Dynamic Plan
NAV Growth Plan – Rs. 49.69 ,Dividend Plan – Rs.10.67
Inception Date April 28, 1997
Benchmark Crisil Composite Bond Fund Index
Load Structure(Exit) 0.50% on or before 6 Months Expense Ratio 1.52
Fund Manager Mr. Anil Bamboli
Investment Objective To generate income by investing in a range of debt and money market instruments of various maturity dates with a view to maximizing income while maintaining the optimum balance of yield, safety and liquidity.
Portfolio Classification by Asset Class (%)
Certificate of Deposit (CD) -
Commercial Papers (CP) -
Corporate Debt 8.49
Government Securities 87.93
Cash, Cash Equivalents and Net Current Assets
3.58
Period Return CRISIL CBFI Relative Return
Last 3 Month 17.11 14.63 2.48
Last 6 Month 6.62 9.01 -2.39
Last 1 Year 13.51 12.56 0.95
Last 2 Year 12.22 12.08 0.14
Since Inception 9.09 - -
The Investment strategy involves investing in debt, money market and related instruments of various maturities on the basis of the expected interest rate scenarios over the short as well as medium term. The Plan shall follow an active duration management strategy by keeping a close watch on various domestic and global macro economic variables. It would take a tactical view on the interest rate outlook and accordingly change the allocation between gilt and other debt, money market instruments.
Credit Quality
High Medium Low
H
igh
Interest Rate Sensitivity
Medium
Low
Trend of QFSI over last 1 Year
A+
Average Portfolio Maturity Modified Duration Corpus (Crs.) YTM
16.4 Years 8.2 Years 2242 7.90
Data as of 30th September 2015
0
5
10
15
20
25
30
Oct
-14
Nov
-14
Dec
-14
Jan-
15
Feb-
15
Mar
-15
Apr-
15
May
-15
Jun-
15
Jul-1
5
Aug-
15
Sep-
15
Rating Profile
AA
AA+
AAA
AAA(SO)
Cash
SOV
44
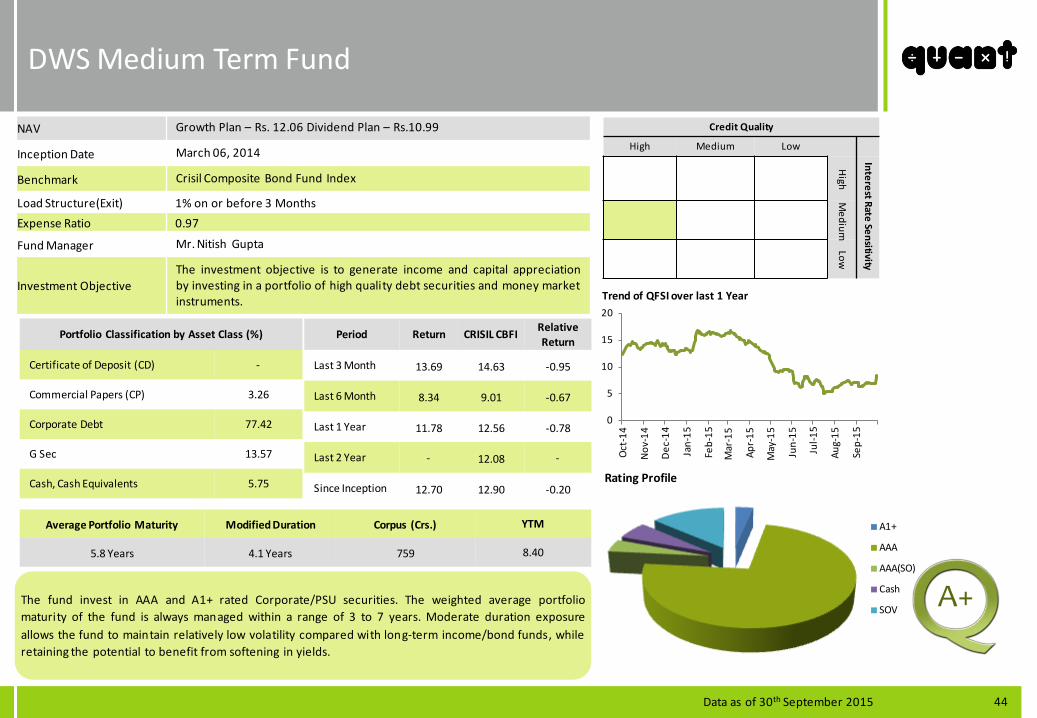
DWS Medium Term Fund
NAV Growth Plan – Rs. 12.06 Dividend Plan – Rs.10.99
Inception Date March 06, 2014
Benchmark Crisil Composite Bond Fund Index
Load Structure(Exit) 1% on or before 3 Months Expense Ratio 0.97
Fund Manager Mr. Nitish Gupta
Investment Objective The investment objective is to generate income and capital appreciation by investing in a portfolio of high quality debt securities and money market instruments.
Portfolio Classification by Asset Class (%)
Certificate of Deposit (CD) -
Commercial Papers (CP) 3.26
Corporate Debt 77.42
G Sec 13.57
Cash, Cash Equivalents 5.75
Period Return CRISIL CBFI Relative Return
Last 3 Month 13.69 14.63 -0.95
Last 6 Month 8.34 9.01 -0.67
Last 1 Year 11.78 12.56 -0.78
Last 2 Year - 12.08 -
Since Inception 12.70 12.90 -0.20
The fund invest in AAA and A1+ rated Corporate/PSU securities. The weighted average portfolio maturity of the fund is always managed within a range of 3 to 7 years. Moderate duration exposure allows the fund to maintain relatively low volatility compared with long-term income/bond funds, while retaining the potential to benefit from softening in yields.
Credit Quality
High Medium Low
H
igh
Interest Rate Sensitivity
Medium
Low
Trend of QFSI over last 1 Year
A+
Average Portfolio Maturity Modified Duration Corpus (Crs.) YTM
5.8 Years 4.1 Years 759 8.40
Data as of 30th September 2015
0
5
10
15
20
Oct
-14
Nov
-14
Dec
-14
Jan-
15
Feb-
15
Mar
-15
Apr-
15
May
-15
Jun-
15
Jul-1
5
Aug-
15
Sep-
15
Rating Profile
A1+
AAA
AAA(SO)
Cash
SOV

45
Kotak Medium Term Fund
NAV Growth Plan – Rs. 11.75 Dividend Plan – Rs.10.34
Inception Date March 21, 2014
Benchmark Crisil Composite Bond Fund Index
Load Structure(Exit) 2% on or before 18 Months Expense Ratio 1.75
Fund Manager Mr. Deepak Agrawal
Investment Objective The investment objective of the scheme is to generate regular income and capital appreciation by investing in a portfolio of medium term debt and money market instruments
Portfolio Classification by Asset Class (%)
Certificate of Deposit (CD) 8.77
Treasury Bill 1.71
Corporate Debt 87.89
Government Securities 2.36
Cash, Cash Equivalents -0.73
Period Return CRISIL CBFI Relative Return
Last 3 Month 11.28 14.63 -3.35
Last 6 Month 9.49 9.01 0.48
Last 1 Year 10.88 12.56 -1.68
Last 2 Year - 12.08 -
Since Inception 11.13 12.70 -1.57
The fund would invest in medium term debt & money market securities so as to generate regular income and capital appreciation. The fund will optimize returns by keeping its weighted average maturity anywhere between 3 years & 7 years. The fund seeks to generate income through investments in a range of debt & money market instruments with a view to maximize income while maintaining an optimum balance of yield, safety & liquidity.
Credit Quality
High Medium Low
H
igh
Interest Rate Sensitivity
Medium
Low
Trend of QFSI over last 1 Year
A+
Average Portfolio Maturity Modified Duration Corpus (Crs.) YTM
3.3 Years 2.4 Years 1128 10.1
Data as of 30th September 2015
0 2 4 6 8
10 12 14 16
Oct
-14
Nov
-14
Dec
-14
Jan-
15
Feb-
15
Mar
-15
Apr-
15
May
-15
Jun-
15
Jul-1
5
Aug-
15
Sep-
15
Rating Profile A
A-
A+
A1+
AA
AA-
AAA
AAA(SO)
BWR AA+
Cash
LAA-(SO)
SOV

46
Franklin India Short Term Income Plan
NAV Growth Plan – Rs. 2,998.59 Quarterly Dividend Plan – 1,245.23
Inception Date January 31, 2002
Benchmark CRISIL Short-Term Bond Fund Index
Load Structure(Exit) 0.50% with in 1 Year
Expense Ratio 1.56
Fund Manager Mr. Santosh Kamath
Investment Objective An open end income scheme with an objective to provide stable returns by investing in fixed income securities.
Portfolio Classification by Asset Class (%)
Certificate of Deposit (CD) -
Commercial Papers (CP) -
Corporate Debt 93.38
Treasury Bills 5.35
Cash, Cash Equivalents and Deposits
1.27
Period Return CRISIL STBFI Relative Return
Last 3 Month 10.17 10.26 -0.08
Last 6 Month 8.91 9.08 -0.17
Last 1 Year 10.79 9.90 0.89
Last 2 Year 10.97 10.01 0.96
Since Inception 8.36 - -
The scheme is an open ended income where fund manager primarily invests in corporate bonds with a focus on higher accrual income and focuses on investment oppor tunities at the short end of the yield curve by maintaining a low average maturity profile. The fund is positioned between a liquid fund and an income fund in terms of risk reward and is suitable for investors with a time horizon of 9-15 months with moderate risk profile who prefer higher accrual and credit quality focused debt fund.
Credit Quality
High Medium Low
H
igh
Interest Rate Sensitivity
Medium
Low
Average Portfolio Maturity Modified Duration Corpus (Crs.) YTM
2.4 Years 2.0 Years 10527 10.7
Trend of QFSI over last 6 months
A+
Data as of 30th September 2015
0
2
4
6
8
10
12
Apr-15 May-15 Jun-15 Jul-15 Aug-15 Sep-15
Rating Profile A
A(SO)
A+
A+(IND)
A+(SO)
A1
A1+
AA
AA-
AA-(SO)
AA+(SO)
AAA
BWR A+(SO)
Cash
SOV
UNRATED

47
HDFC Short Term Plan
NAV Growth Plan – Rs. 28.32 Dividend Plan – Rs.10.95
Inception Date February 28, 2002
Benchmark CRISIL Short-Term Bond Fund Index
Load Structure(Exit) 0.75% on or before 12 Months Expense Ratio 1.00
Fund Manager Mr. Anil Bamboli
Investment Objective The primary objective of the HDFC Short Term Plan is to generate regular income through investment in debt securities and money market instruments.
Portfolio Classification by Asset Class (%)
Certificate of Deposit (CD) 0.05
Commercial Paper (CP) 1.70
Corporate Debt 88.18
Government Securities 2.66
Cash, Cash Equivalents 7.41
Period Return CRISIL STBFI Relative Return
Last 3 Month 10.41 10.26 0.15
Last 6 Month 9.55 9.08 0.47
Last 1 Year 10.58 9.90 0.68
Last 2 Year 10.61 10.01 0.60
Since Inception 7.96 - -
With respect to the investment horizon profile, the fund is aimed to be positioned between the liquid scheme and the income scheme. The Scheme will invest in debt securities and money market instruments with a short to medium term maturity and aims to maintain an average maturity profile of 9 - 18 months under normal circumstances.
Credit Quality
High Medium Low
H
igh
Interest Rate Sensitivity
Medium
Low
Trend of QFSI over last 6 months
A+
Average Portfolio Maturity Modified Duration Corpus (Crs.) YTM
2.2 Years 1.7 Years 2802 9.80
Data as of 30th September 2015
0
2
4
6
8
10
12
Apr-15 May-15 Jun-15 Jul-15 Aug-15 Sep-15
Rating Profile A A- A+ A+(SO) A1 A1+ AA AA- AA-(SO) AA+ AAA AAA(SO) Cash SOV UNRATED

48
NAV Growth Plan – Rs. 18.74 Weekly Dividend Plan – Rs.10.13
Inception Date December 18, 2007
Benchmark Crisil Liquid Fund Index
Load Structure(Exit) Nil Expense Ratio 0.86
Fund Manager Mr. Sachin Padwal-Desai
Investment Objective An open-end income fund that seeks to provide a combination of regular income and high liquidity by investing primarily in a mix of short term debt and money market instruments.
Period Return CRISIL LFI Relative Return
Last 1 Month 9.56 8.18 1.38
Last 3 Month 9.50 7.90 1.60
Last 6 Month 9.74 8.29 1.44
Last 1 Year 9.87 8.56 1.31
Since Inception 8.40 7.69 0.70
Franklin India Ultra Short Bond Fund
Portfolio Classification by Asset Class (%)
Certificate of Deposit (CD) 2.70
Commercial Papers (CP) 10.57
Corporate Debt 73.99
Treasury Bill 11.99
Cash & Cash Equivalents 0.74
The fund manager strives to strike an optimum balance between regular income and high liquidity through a judicious mix of short term debt and money market instruments. The fund has been assigned a credit rating of (ICRA) A1+mfs that denotes this fund to have a very strong degree of safety regarding timely receipt of payments from the investments that they have made; this rating is applicable for debt funds with weighted average maturity up to 1 year . The fund is suitable for investors with an investment horizon of up to 3 months who prefer accrual based debt products
Credit Quality
High Medium Low
H
igh
Interest Rate Sensitivity
Medium
Low
Trend of QFSI over last 3 months
A+
Average Portfolio Maturity Modified Duration Corpus (Crs.) YTM
241 Days 208 Days 5745 9.70
Data as of 30th September 2015
0 2 4 6 8
10 12 14 16 18
Jul-15 Aug-15 Sep-15
Rating Profile A A(SO) A+ A+(IND) A+(SO) A1 A1+ AA AA- AA-(SO) AA+(SO) AAA BWR A+(SO) Cash SOV UNRATED
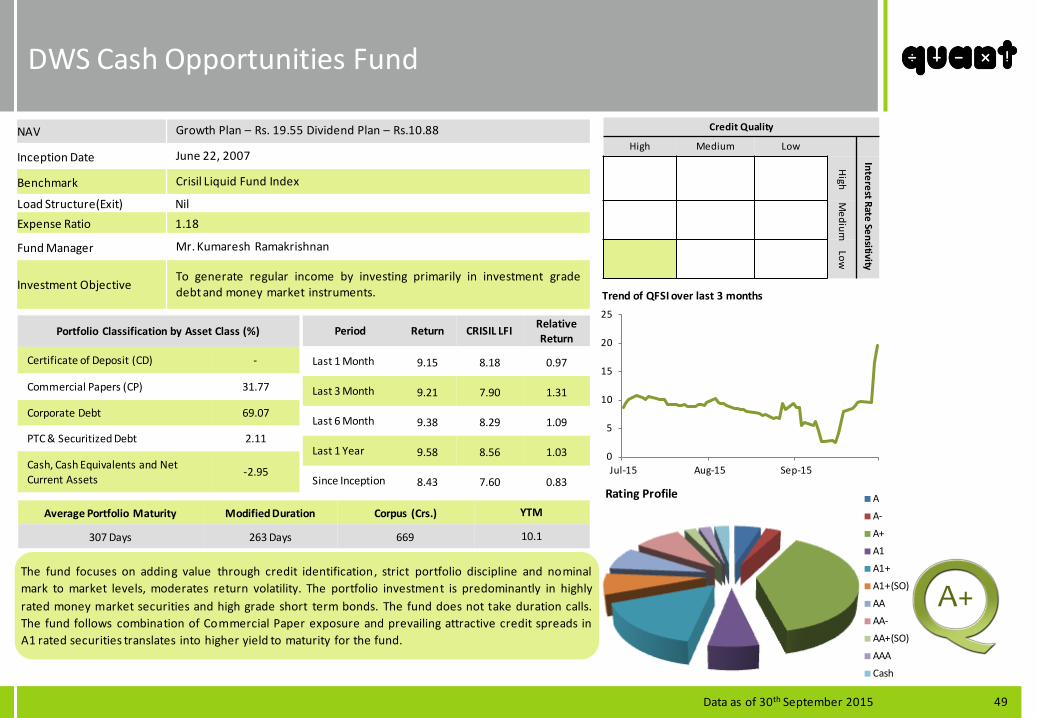
49
DWS Cash Opportunities Fund
Portfolio Classification by Asset Class (%)
Certificate of Deposit (CD) -
Commercial Papers (CP) 31.77
Corporate Debt 69.07
PTC & Securitized Debt 2.11
Cash, Cash Equivalents and Net Current Assets
-2.95
Period Return CRISIL LFI Relative Return
Last 1 Month 9.15 8.18 0.97
Last 3 Month 9.21 7.90 1.31
Last 6 Month 9.38 8.29 1.09
Last 1 Year 9.58 8.56 1.03
Since Inception 8.43 7.60 0.83
The fund focuses on adding value through credit identification, strict portfolio discipline and nominal mark to market levels, moderates return volatility. The portfolio investment is predominantly in highly rated money market securities and high grade short term bonds. The fund does not take duration calls. The fund follows combination of Commercial Paper exposure and prevailing attractive credit spreads in A1 rated securities translates into higher yield to maturity for the fund.
Credit Quality
High Medium Low
H
igh
Interest Rate Sensitivity
Medium
Low
Trend of QFSI over last 3 months
A+
Average Portfolio Maturity Modified Duration Corpus (Crs.) YTM
307 Days 263 Days 669 10.1
NAV Growth Plan – Rs. 19.55 Dividend Plan – Rs.10.88
Inception Date June 22, 2007
Benchmark Crisil Liquid Fund Index
Load Structure(Exit) Nil Expense Ratio 1.18
Fund Manager Mr. Kumaresh Ramakrishnan
Investment Objective To generate regular income by investing primarily in investment grade debt and money market instruments.
Data as of 30th September 2015
0
5
10
15
20
25
Jul-15 Aug-15 Sep-15
Rating Profile A
A-
A+
A1
A1+
A1+(SO)
AA
AA-
AA+(SO)
AAA
Cash
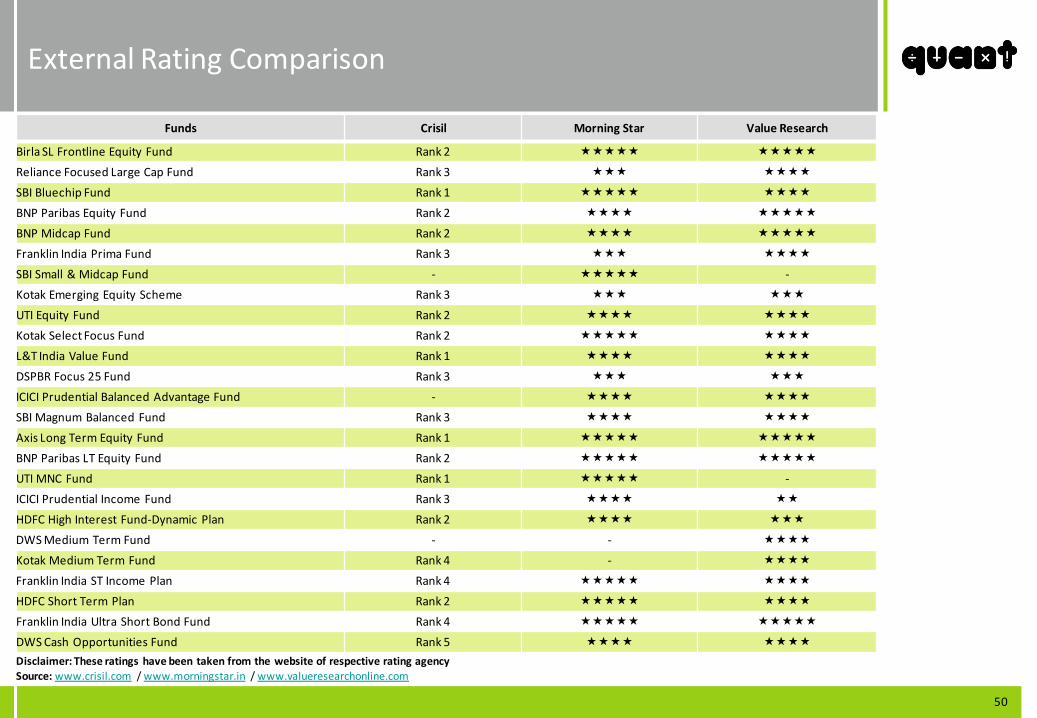
50
External Rating Comparison
Funds Crisil Morning Star Value Research
Birla SL Frontline Equity Fund Rank 2 Reliance Focused Large Cap Fund Rank 3 SBI Bluechip Fund Rank 1 BNP Paribas Equity Fund Rank 2 BNP Midcap Fund Rank 2 Franklin India Prima Fund Rank 3 SBI Small & Midcap Fund - - Kotak Emerging Equity Scheme Rank 3 UTI Equity Fund Rank 2 Kotak Select Focus Fund Rank 2 L&T India Value Fund Rank 1 DSPBR Focus 25 Fund Rank 3 ICICI Prudential Balanced Advantage Fund - SBI Magnum Balanced Fund Rank 3 Axis Long Term Equity Fund Rank 1 BNP Paribas LT Equity Fund Rank 2 UTI MNC Fund Rank 1 - ICICI Prudential Income Fund Rank 3 HDFC High Interest Fund-Dynamic Plan Rank 2 DWS Medium Term Fund - - Kotak Medium Term Fund Rank 4 - Franklin India ST Income Plan Rank 4 HDFC Short Term Plan Rank 2 Franklin India Ultra Short Bond Fund Rank 4 DWS Cash Opportunities Fund Rank 5 Disclaimer: These ratings have been taken from the website of respective rating agency Source: www.crisil.com / www.morningstar.in / www.valueresearchonline.com
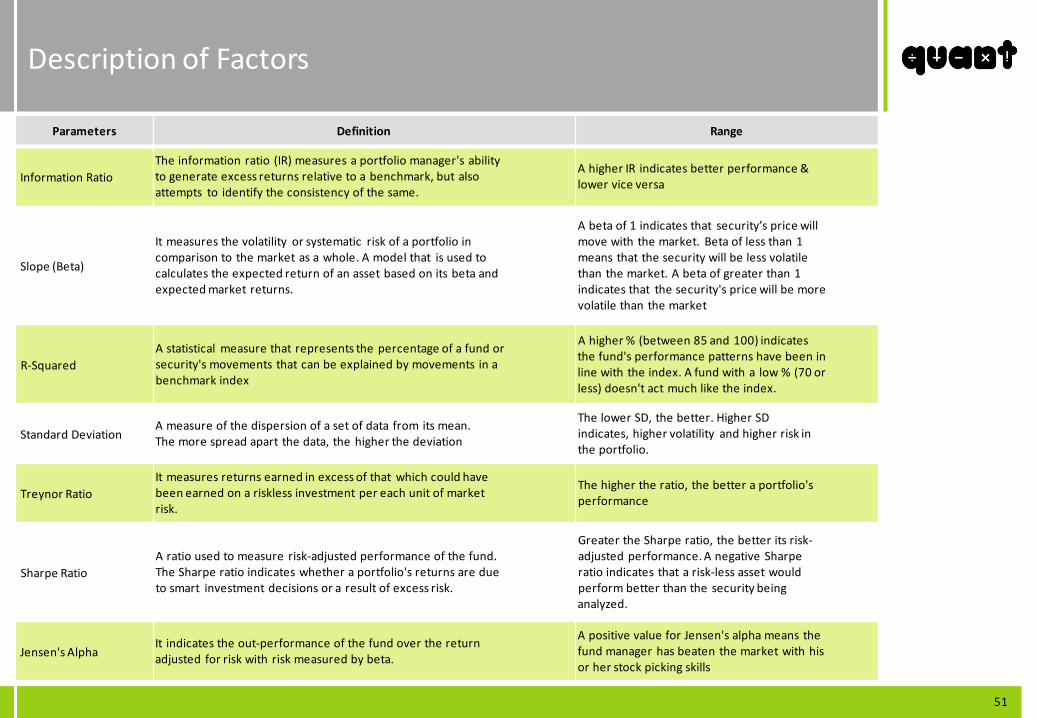
51
Description of Factors
Parameters Definition Range
Information Ratio The information ratio (IR) measures a portfolio manager's ability to generate excess returns relative to a benchmark, but also attempts to identify the consistency of the same.
A higher IR indicates better performance & lower vice versa
Slope (Beta)
It measures the volatility or systematic risk of a portfolio in comparison to the market as a whole. A model that is used to calculates the expected return of an asset based on its beta and expected market returns.
A beta of 1 indicates that security’s price will move with the market. Beta of less than 1 means that the security will be less volatile than the market. A beta of greater than 1 indicates that the security's price will be more volatile than the market
R-Squared A statistical measure that represents the percentage of a fund or security's movements that can be explained by movements in a benchmark index
A higher % (between 85 and 100) indicates the fund's performance patterns have been in line with the index. A fund with a low % (70 or less) doesn't act much like the index.
Standard Deviation A measure of the dispersion of a set of data from its mean. The more spread apart the data, the higher the deviation
The lower SD, the better. Higher SD indicates, higher volatility and higher risk in the portfolio.
Treynor Ratio It measures returns earned in excess of that which could have been earned on a riskless investment per each unit of market risk.
The higher the ratio, the better a portfolio's performance
Sharpe Ratio A ratio used to measure risk-adjusted performance of the fund. The Sharpe ratio indicates whether a portfolio's returns are due to smart investment decisions or a result of excess risk.
Greater the Sharpe ratio, the better its risk- adjusted performance. A negative Sharpe ratio indicates that a risk-less asset would perform better than the security being analyzed.
Jensen's Alpha It indicates the out-performance of the fund over the return adjusted for risk with risk measured by beta.
A positive value for Jensen's alpha means the fund manager has beaten the market with his or her stock picking skills

52
Disclaimer
This Information Package is distributed by quant Capital Advisors Pvt. Limited (hereinafter “quant”) on a strictly private and confidential and on a need to know basis exclusively to intended recipient. This Information Package and the information and projections contained herein may not be disclosed, reproduced or used in whole or in part for any purpose or furnished to any other person or persons. The Persons who are in possession of this Information package or may come in possession at a later day, hereby undertakes to observe the restrictions contained herein.
The information contained herein is of a general nature and is not intended to address the facts and figures of any particular individual or entity. The content provided here treats the subjects covered here in condensed form. It is intended to provide a general guide to the subject matter and should not be relied on as a basis for business decisions. No one should act upon such information without making appropriate additional professional advice after a thorough examination of the particular situation. This Information Package is distributed by quant upon the express understanding that no information herein contained has been independently verified. Further, no representation or warranty expressed or implied is made nor is any responsibility of any kind accepted with respect to the completeness or accuracy of any information as may be contained herein. Also no representation or warranty expressed or implied is made that such information remains unchanged in any respect as of any date or dates after those stated herein with respect to any matter concerning any statement made in this Information Package. quant and its directors, employees, agents and consultants shall have no liability (including liability to any person by reason of negligence or negligent misstatement) for any state ments, opinions, information or matters (express or implied) arising out of, contained in or derived from, or for any omissions from the Information Package and any liability whatsoever for any direct, indirect, consequential or other loss arising from any use of this information package and/or further communication in relation to this information package.
All recipients of the Information Package should make their own independent evaluations and should conduct their own investigation and analysis and should check the accuracy, reliability and completeness of the Information and obtain independent and specific advice from appropriate professional advisers, as they deem necessary. Where this Information Package summarizes the provisions of any other document, that summary should not be relied upon and the relevant. Mutual Fund Investments are subject to market risks. Please read the Scheme Information Document carefully before investing.
The information contained in this document is confidential in nature and the recipient is receiving all such information on the express condition of confidentiality unless expressly authorized in writing by quant.
If you are not the intended recipient, you must not disclose or use the information in this document in any way whatsoever. If you received it in error, please inform us immediately by return e-mail and delete the document with no intention of its being retrieved by you. We do not guarantee the integrity of any e-mails or attached files and are not responsible for any changes made to them by any other person.

53
Title
612, maker chambers IV, nariman point, mumbai 400 021, india
phone – 91 22 4088 0100 fax – 91 22 4088 0225
Email – [email protected]
Thank you