muskegon homeless continuum of care network...
TRANSCRIPT

Muskegon Homeless Continuum of Care Network
(MHCCN)
Data Report
Annual Report - 2007 to 2015
And
Quarterly Objectives Report -January 2013 to September 2016

Purpose: This document will provide annual and quarterly data from the Homeless Management Information System (HMIS) and annual data
from the McKinney Vento homeless student assistance data, and Domestic Violence data not on HMIS. This data report will be
updated quarterly and will be published on the Continuum of Care website. The report will provide information to assist the CoC in
making decisions regarding our goals and objectives for their 10 year plan to end homelessness. These goals and objective include
permanent supportive housing, low income and subsidized housing, funding of shelters, and funding of homeless service providers.
Basic Terms Annual Homeless Numbers- count of all homeless individuals and families entered into HMIS in a given calendar year.
MCAH (Michigan Coalition Against Homelessness) sends each local HMIS System Administrator these numbers each year.
These numbers are reported locally, regionally and for the State of Michigan. These numbers can also be located on The
Campaign to End Homelessness site at www.thecampaigntoendhomeless.org.
Point In Time (PIT) Count- Demonstrates home many individuals and families are homeless on any given day. Per HUD
guidelines the count is taken the last week in January. There are two different PIT counts: 1) through HMIS shelter* count only
and 2) HMIS & street outreach community effort. (*Domestic Violence submits hard copy of these numbers on that given
day.)
Housing Inventory Chart (HIC)- List of all Emergency Shelter (ES), Transitional Housing (TH), and Permanent Supportive
Housing (PSH) beds in our Continuum. This is used to identify need. (ex., what is the comparison of AHN and PIT compared
to inventory to serve?)

HUD Definitions of Homelessness
CATEGORY 1: Literally Homeless Individual or family who lacks a fixed, regular, and adequate nighttime residence, meaning:
(i) Has a primary nighttime residence that is a public or private place not meant for human habitation; or
(ii) Is living in a publicly or privately operated shelter designated to provide temporary living arrangements (including
congregate shelters, transitional housing, and hotels and motels paid for by charitable organizations or by federal, state
and local government programs).
(iii) Is exiting an institution where (s)he has resided for 90 days or less and who resided in an emergency shelter or place not
meant for human habitation immediately before entering that institution
**Categories 2 thru 4 are considered “homeless” on all the reports but are only eligible to receive Prevention funding.
CATEGORY 2: Imminent Risk of Homelessness
Individual or family who will imminently lose their primary nighttime residence, provided that:
(i) Residence will be lost within 14 days of the date of application for homeless assistance;
(ii) No subsequent residence has been identified; and
(iii) The individual or family lacks the resources or support networks needed to obtain other permanent housing.
CATEGORY 3: Homeless under Other Federal Statutes
Unaccompanied youth under 25 years of age, or families with children and youth, who do not otherwise qualify as homeless under this
definition, but who:
(i) Are defined as homeless under the other listed federal statutes;
(ii) Have not had a lease, ownership interest, or occupancy agreement in permanent housing during the 60 days prior to the
homeless assistance application;
(iii) Have experienced persistent instability as measured by 2 moves or more during the preceding 60 days; and
(iv) Can be expected to continue in such status for an extended period of time due to special needs or barriers.
CATEGORY 4: Fleeing/Attempting to Flee Domestic Violence
Any individual or family who:
(i) Is fleeing, or is attempting to flee, domestic violence;
(ii) Has no other residence; and
(iii) Lacks the resources or support networks to obtain other permanent housing

Annual Homeless Count
Includes all Categories of Homelessness in HMIS
Percentage Change
2007-2008- 43% increase
2008-2009- 22% decrease
2009-2010- 142% Increase
2010-2011- 9% Increase
2011-2012- 11% decrease
2012-2013- 3.53% decrease
2013-2014- 5.86% decrease
2014-2015- 13% Increase Homeless numbers include all HUD definitions of
homelessness not just literally homeless

Literally Homeless
Starting in 2012 the definition of homelessness was broken down into
categories based on the living situation. Literally homeless was now defined as living on the streets (place not meant for human habitation) or in
a shelter
Percentage Change
2012-2013- 3.4% increase 2013-2014- 7.56% decrease 2014-2015- 4.7% Increase

Chronic Homelessness
Chronic Homeless is defined as a person or family member who has been literally homeless 4 times in the past three
years or 1 year consecutively AND has a disabling condition.
Percentage Change
2007-2008 - 16.87% decrease 2008-2009 - 13.04 % decrease 2009-2010 – 200.33% increase 2010-2011- 18.96% decrease 2011-2012- 13.22% decrease 2012-2013- 1.17% increase 2013-2014- 27% decrease 2014-2015- 33% decrease

Annual School District McKinney Vento Data
McKinney-Vento
Muskegon County Consortium
2015/2016 Counts
District Goal Fall Spring EOY NOT in PS TOTAL
Covenant House Academy 16 45 23 4 72
Fruitport 134 56 26 8 3 93
Holton 60 42 35 9 9 95
Mona Shores 161 30 18 20 5 73
Montague 72 32 12 7 7 58
Muskegon 357 57 88 78 38 261
Muskegon Hts 48 25 14 2 14 55
Muskegon ISD 15 0 0 0 0
Muskegon Montessori 9 1 0 1 2
N. Muskegon 27 16 8 0 3 27
Oakridge 132 69 22 6 4 101
Orchard View 180 13 21 8 22 64
Ravenna 54 16 8 6 1 31
Reeths Puffer 185 36 20 8 8 72
Three Oaks 40 15 7 4 3 29
Timberland 69 6 13 4 23
Whitehall 98 37 27 25 54 143
TOTAL 1657 496 342 190 133 1199

Domestic Violence Shelter Data
Domestic Violence shelters and services are not allowed to enter their data into HMIS. Due to this their numbers are
not included in the HMIS data in this report. The numbers below come from the internal DV data system.
10/1/2013 to 9/30/2014
Shelter Nights
Adult Women 3028
Children 3350
Total 6378
Unduplicated Residential Clients (Count each client once per fiscal year)
Adult Women 180
Children 173
Total Unduplicated Residential Clients 353
Unduplicated Non-Residential Clients (Count each client once per fiscal year)
Adult Women 675
Adult Men 86
Children 64
Total Non-Residential Clients 825

Point in Time** See definition on page 2
145
325
459
225 234
176 166
0
50
100
150
200
250
300
350
400
450
500
2009 2010 2011 2012 2013 2014 2015
Sheltered Count
217
321
232
408
13
0
100
200
300
400
500
2007 2009 2011 2013 2015
Unsheltered Count

Housing Inventory Chart
0
100
200
300
400
500
600
700
800
ES TH PSH
148
254
326
146
261
372
122
365396
149133
451
141 137
439
154
93
480
162
44
705
Changes in Housing Inventory
2009
2010
2011
2012
2013
2014
2015

Objective 1
Track trends in the number of clients served through Emergency Shelters, Transitional Housing, Permanent
Supportive Housing, ESG Rapid Re-Housing and Prevention, SSVF and Services Only providers.
Breakdown for these numbers are singles, households, veterans and chronically homeless.
Q1 Q2 Q3 Q4 2013 Q1 Q2 Q3 Q4 2014 Q1 Q2 Q3 Q4 2015 Q1 Q2 Q3
CoC Totals
1/1/13
to
3/31/14
4/1/13
to
6/30/13
07/01/13
to
9/30/13
10/1/13
to
12/31/13
1/1/14
to
3/31/14
4/1/14
to
6/30/14
7/1/14
to
9/30/14
10/1/14
to
12/31/14
1/1/15
to
3/31/15
4/1/15
to
6/30/15
7/1/15
to
9/30/15
10/1/15
to
12/31/15
1/1/16
to
3/31/16
4/1/16
to
6/30/16
7/1/16
to
9/30/16
Total
Homeless653 882 921 875 712 601 818 888 662 668 813 618 751 569 790
Literally
Homeless495 702 758 771 592 503 673 569 505 541 650 484 620 478 608
Singles 412 529 483 491 434 336 405 401 374 341 383 363 406 345 400
Unaccompanie
d Youth16 24 22 16 13 15 8 15 10 16 13 11 9 9 8
Number of
households144 181 196 160 122 114 172 199 129 134 168 106 139 92 157
Person in
Households270 391 461 414 302 291 458 525 310 349 461 279 380 244 415
Chronically
Homeless86 97 99 109 90 54 62 74 42 59 73 60 53 36 48

*** Note, drop in numbers in Q2 2014 is attributed to the shift in the HARA at this time.

Objective 1 continued...
Track trends in the number of veteran clients served through Emergency Shelters, Transitional Housing, Permanent
Supportive Housing, ESG Rapid Re-Housing and Prevention, SSVF and Services Only providers.
Q1
2013
Q2
2013
Q3
2013
Q4
2013
Q1
2014
Q2
2014
Q3
2014
Q4
2014
Q1
2015
Q2
2015
Q3
2015
Q4
2015
Q1
2016
Q2
2016
Q3
2016
1/1/13
to
3/31/14
4/1/13
to
6/30/13
07/01/1
3 to
9/30/13
10/1/13
to
12/31/1
3
1/1/14
to
3/31/14
4/1/14
to
6/30/14
07/01/1
4 to
9/30/14
10/1/14
to
12/31/1
4
1/1/15
to
3/31/15
4/1/15
to
6/30/15
7/1/15
to
9/30/15
10/1/15
to
12/31/1
5
1/1/16
to
3/31/16
4/1/16
to
6/30/16
7/1/16
to
9/30/16
Total
Homeless29 33 42 48 55 45 31 34 34 35 56 41 47 31 42
Literally
Homeless23 30 37 46 51 38 25 25 30 28 38 22 32 21 25
Singles 25 31 35 43 48 36 23 24 23 25 28 29 36 25 33
Adult Vets
in Families4 4 8 6 9 11 12 11 5 17 30 11 9 7 9
Chronics 5 10 19 14 10 6 7 10 11 6 6 8 6 3 4


Objective 2
Increase the percentage of positive housing placements upon discharge from services. Positive housing placement is
defined as having permanent housing upon discharge.
(ES, TH, PSH, ESG, SSVF and Services Only)
Q1
2013
Q2
2013
Q3
2013Q4 2013
Q1
2014
Q2
2014
Q3
2014Q4 2014
Q1
2015
Q2
2015
Q3
2015Q4 2015
Q1
2016
Q2
2016
Q3
2016
1/1/13
to
3/31/14
4/1/13
to
6/30/13
7/01/13
to
9/30/13
10/1/13
to
12/31/13
1/1/14
to
3/31/14
4/1/14
to
6/30/14
7/01/14
to
9/30/14
10/1/14
to
12/31/14
1/1/15
to
3/31/15
4/1/15
to
6/30/15
7/1/15
to
9/30/15
10/1/15
to
12/31/15
1/1/16
to
3/31/16
4/1/16
to
6/30/16
7/1/16
to
9/30/16
CoC
Totals62.38% 58.21% 57.46% 57.62% 53.24% 61.21% 58.60% 52.78% 45.87% 55.77% 56.35% 49.79% 42.83% 50.57% 46.05%

** With the positive destinations declining, the data committee has recommended that additional HMIS training may be necessary to ensure this is an
accurate reflection of what is happening and not just a data entry error. The new HMIS system admin will set up these trainings in 2016.

Objective 3
Increase Engagement with clients. Engagement is measured by how many clients exited to known locations.
(ES, TH, PSH, ESG and SSVF)
** Client engagement is on the rise.
Q1
2013
Q2
2013
Q3
2013Q4 2013
Q1
2014
Q2
2014
Q3
2014Q4 2014
Q1
2015
Q2
2015
Q3
2015Q4 2015
Q1
2016
Q2
2016
Q3
2016
1/1/13
to
3/31/14
4/1/13
to
6/30/13
7/01/13
to
9/30/13
10/1/13
to
12/31/13
1/1/14
to
3/31/14
4/1/14
to
6/30/14
7/01/14
to
9/30/14
10/1/14
to
12/31/14
1/1/15
to
3/31/15
4/1/15
to
6/30/15
7/1/15
to
9/30/15
10/1/15
to
12/31/15
1/1/16
to
3/31/16
4/1/16
to
6/30/16
7/1/16
to
9/30/16
CoC
Totals94.23% 92.50% 94.70% 90.76% 93.86% 88.51% 84.78% 90.39% 87.71% 87.31% 76.72% 77.04% 92.17% 99.54% 98.19%

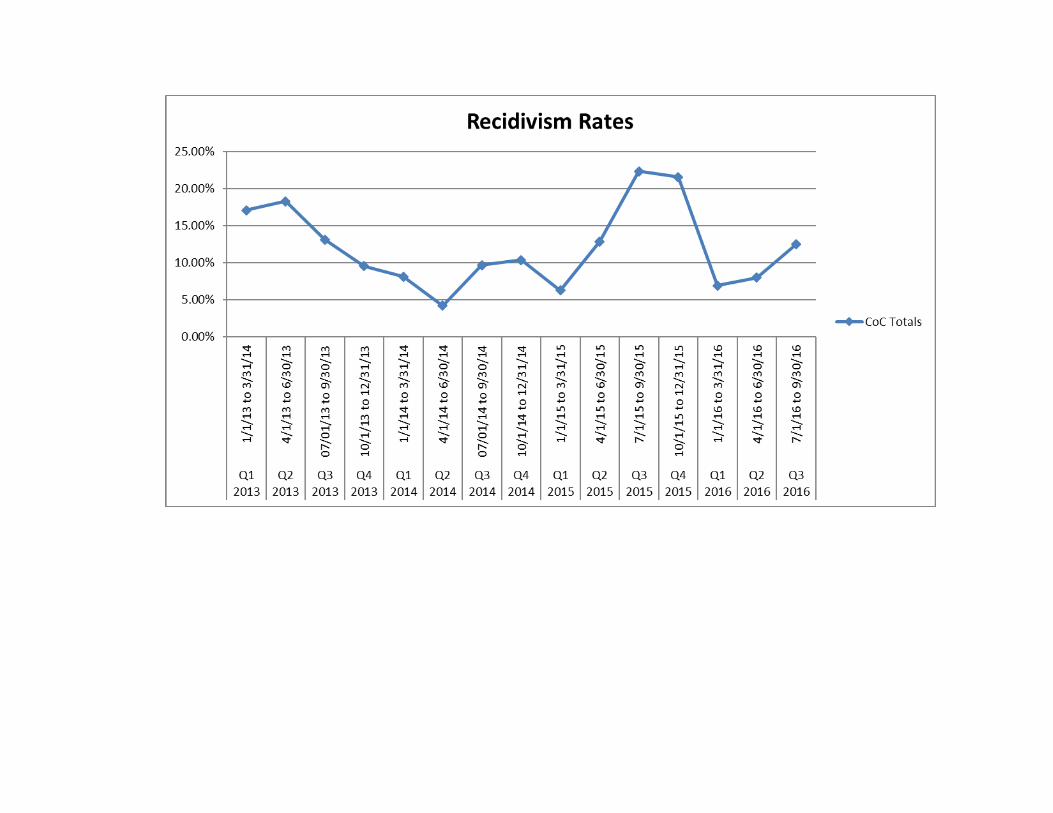
Objective 4
Reduce Recidivism. Recidivism is defined as a return visit to a shelter within a three-year time span
(ES)
Q1 2013 Q2 2013 Q3 2013 Q4 2013 Q1 2014 Q2 2014 Q3 2014 Q4 2014 Q1 2015 Q2 2015 Q3 2015 Q4 2015 Q1 2016 Q2 2016 Q3 2016
1/1/13 to
3/31/14
4/1/13 to
6/30/13
07/01/13
to
9/30/13
10/1/13
to
12/31/13
1/1/14 to
3/31/14
4/1/14 to
6/30/14
07/01/14
to
9/30/14
10/1/14
to
12/31/14
1/1/15 to
3/31/15
4/1/15 to
6/30/15
7/1/15 to
9/30/15
10/1/15
to
12/31/15
1/1/16 to
3/31/16
4/1/16 to
6/30/16
7/1/16
to
9/30/16
CoC
Totals17.10% 18.30% 13.12% 9.55% 8.09% 4.19% 9.66% 10.37% 6.25% 12.86% 22.38% 21.56% 6.89% 7.99% 12.46%

Objective 5
Increase the percentage of individuals that are discharging from shelter into stable housing in less than 30 days.
(ES)
Q1
2013
Q2
2013Q3 Q4 2013 Q1 2014 Q2 2014 Q3 2014 Q4 2014 Q1 2015 Q2 2015 Q3 2015 Q4 2015
Q1
2016Q2 2016 Q3 2016
1/1/13
to
3/31/14
4/1/13
to
6/30/13
07/01/1
3 to
9/30/13
10/1/13
to
12/31/13
1/1/14 to
3/31/14
4/1/14 to
6/30/14
07/01/14
to
9/30/14
10/1/14
to
12/31/14
1/1/15 to
3/31/15
4/1/15 to
6/30/15
7/1/15 to
9/30/15
10/1/15
to
12/31/15
1/1/16
to
3/31/16
4/1/16
to
6/30/16
7/1/16 to
9/30/16
CoC
Totals27.38% 30.86% 26.12% 27.59% 31.61% 36.30% 33.23% 38.86% 37.10% 39.60% 40.06% 36.60% 35.80% 41.42% 33.64%


Objective 6
Increase the percentage of clients that retain their housing longer than 7 months and monitor the average Length of
Stay in housing for exited clients. Length of stay based on discharges and those with exits longer than 7 months.
(PSH)
Q1
2013
Q2
2013Q3 2013 Q4 2013 Q1 2014 Q2 2014 Q3 2014 Q4 2014 Q1 2015
Q2
2015Q3 2015 Q4 2015
Q1
2016Q2 2016
Q3
2016
1/1/13
to
3/31/14
4/1/13
to
6/30/13
07/01/13
to
9/30/13
10/1/13
to
12/31/13
1/1/14 to
3/31/14
4/1/14 to
6/30/14
07/01/14
to
9/30/14
10/1/14
to
12/31/14
1/1/15
to
3/31/15
4/1/15
to
6/30/15
7/1/15 to
9/30/15
10/1/15
to
12/31/15
1/1/16
to
3/31/16
4/1/16
to
6/30/16
7/1/16
to
9/3016
LOS > 7
Months100% 100% 99.75% 100% 100% 100% 100% 100% 98.36% 96.83% 95.24% 92.13% 98.02% 92.31% 85.19%
Average
LOS in
days
exited
clients
811.25 1294.1 851.15 1020.25 791.25 1257 1415.83 943.67 1050.8 725.52 1138.9 820 752 768 761
Total
Dischar
ges
8 19 13 16 12 5 6 12 5 7 0 5 12 8 3

Objective 7
Increase Income and non-cash benefits upon exit. Income includes employment income, SSI/SDI or other entitlements,
cash benefits and non-cash benefits such as food stamps or health insurance.
(ES, TH, PSH, ESG, SSVF and Services Only)
Q1
2013
Q2
2013
Q3
2013Q4 2013
Q1
2014
Q2
2014
Q3
2014Q4 2014
Q1
2015Q2 2015 Q3 2015 Q4 2015 Q1 2016
Q2
2016
Q3
2016
1/1/13
to
3/31/14
4/1/13
to
6/30/13
7/01/13
to
9/30/13
10/1/13
to
12/31/13
1/1/14
to
3/31/14
4/1/14
to
6/30/14
07/01/1
4 to
9/30/14
10/1/14
to
12/31/14
1/1/15
to
3/31/15
4/1/15 to
6/30/15
7/1/15 to
9/30/15
10/1/15
to
12/31/15
1/1/16 to
3/31/16
4/1/16
to
6/30/16
7/1/201
6 to
9/30/16
Earned
Income15.77% 10.22% 11.92% 13.66% 11.99% 14.29% 13.88% 12.39% 12.39% 13.33% 15.15% 12.20% 15.29% 15.26% 17.15%
Entitlem
ents-
SSI,
SSDI or
TANF
30.06% 26.52% 31.09% 22.95% 24.80% 22.41% 21.77% 19.15% 19.87% 24.67% 30.98% 29.57% 24.71% 26.62% 28.16%
Non-
Cash
Benefits
65.16% 61.90% 70.80% 64.69% 53.46% 57.97% 52.08% 54.32% 54.42% 69.67% 65.99% 65.85% 67.35% 68.51% 76.05%
Adults-
Increase
d
Income
at Exit
11.17% 5.95% 8.97% 10.02% 10.83% 5.82% 7.29% 3.77% 1.99% 7.00% 2.75% 3.19% 3.06% 5.60% 3.96%

*Earned income is slightly on the rise. Data may be inaccurately represented at exit. Data committee will go over updates on income at exit, to ensure
agencies are adding necessary information. If you feel that a one on one training needs to be held at your agency, please contact the HMIS system
admin.

Our continuum feels a strongly about not only tracking those homeless per HUD definition but also those at
risk for homelessness. As such, the Data Committee has included those numbers in our quarterly report.
At Risk of Homelessness (HUD Definitions) CATEGORY 1: An individual or family: (must have income 30% below AMI, lack sufficient resources & meets 1 of the following
risk factors)
Risk 1: Persistent housing instability - has moved because of economic reasons 2 or more times during the 60 days immediately
preceding the application for assistance.
Risk 2: Living in the home of another person/individual because of economic.
Risk 3: Housing loss within 21 days – has been notified of their right to occupy their current housing or living situation will be
terminated within 21 days after the date of application for assistance: notification to leave within 21 days must be written and only
third party source/written is appropriate.
Risk 4: Living in a rented hotel or motel and cost is not paid for by charitable organization or by Federal, State, or local government
programs for low-income individuals.
Risk 5: Living in a severely over-crowded unit as defined by US Census Bureau: lives in an SRO or efficiency apartment unit in
which there reside more than 2 persons or lives in a larger housing unit in which there reside more than 1½ persons per room.
Risk 6: Exiting publicly funded institution or system of care.
Risk 7: Living in housing associated with instability and an increased risk of homelessness. For example: being a young household
with a young child, lacking transportation to work, or other circumstances or barriers as identified in your community.
CATEGORY 2: Unaccompanied Children and Youth
A child or youth who does not qualify as homeless under the homeless definition, but qualifies as homeless under another Federal
statute.
CATEGORY 3: Families with Children and Youth
An unaccompanied youth who does not qualify as homeless under the homeless definition, but qualifies as homeless under section
725(2) of the McKinney-Vento Homeless Assistance Act, and the parent(s) or guardian(s) or that child or youth if living with him or
her.