muse™ mitopotential kit user’s guide - blizard institute · muse™ mitopotential kit user’s...
TRANSCRIPT
Muse™ MitoPotential KitUser’s Guide
Catalog No. MCH100110 (100 Tests)
FOR RESEARCH USE ONLYNot for use in diagnostic procedures.
USA and Canada Phone: 1-800-645-5476Fax: 1-800-645-5439www.millipore.com


ApplicationThe Muse™ MitoPotential Assay allows for the simultaneous measurement of two important cell health parameters— change in mitochondrial potential (considered an early hallmark of apoptosis and cellular stress), and cellular plasma membrane permeabilization or cell death. Minimal sample preparation is required in this no-wash, assay to obtain accurate and precise results. The software provides:
• Percentage of live, depolarized, depolarized/dead, and dead cells • Concentrations (cells/mL) for total, live, depolarized, depolarized/dead, and dead cells
The Muse™ MitoPotential Assay is for use with the Muse™ Cell Analyzer. The Muse™ System makes sophisticated fluorescent-based analysis fast, easy, convenient, and affordable. Sample preparation is minimal, and after loading samples onto Muse™ Cell Analyzer, intuitive software provides detailed or summary analysis of your cell sample in a few short steps.
Sufficient reagent is provided for the preparation and analysis of 100 tests.
Test PrincipleMitochondria are important cellular organelles that maintain crucial cellular energy balance, are a primary site of production of free radicals, and in addition contain key regulators of cell death processes such as apoptosis. Mitochondria changes are thus highly sensitive indicators of cell health and stress. Cellular energy produced during mitochondrial respiration is stored as an electrochemical gradient across the mitochondrial membrane, and this accumulation of energy in healthy cells creates a mitochondrial trans-membrane potential, (∆Ψm) that enables the cell to drive the synthesis of ATP. Loss of the mitochondrial inner transmembrane potential is often,1-7 but not always,8,9 observed to be associated with the early stages of apoptosis. Collapse of this potential is believed to coincide with the opening of the mitochondrial permeability transition pores, leading to the release of cytochrome C into the cytosol, which then triggers the downstream events in the apoptotic cascade. Mitochondrial membrane potential changes have been implicated in apoptosis, necrotic cell death, and caspase-independent cell death processes. Depolarization of the inner mitochondrial membrane potential is thus a reliable indicator of mitochondrial dysfunction and cellular health, which has become increasingly important in the study of apoptosis, drug toxicity and multiple disease states.
The Muse™ MitoPotential Assay utilizes the MitoPotential Dye, a cationic, lipophilic dye to detect changes in the mitochondrial membrane potential and 7-AAD as an indicator of cell death.
• High membrane potential drives accumulation of MitoPotential dye within inner membrane of intact mitochondria resulting in high fluorescence. Cells with depolarized mitochondria demonstrate a decrease in fluorescence and a downward shift. This parameter is displayed in the MitoPotential axis.
• A dead cell marker (7-AAD) is also used as an indicator of cell membrane structural integrity and cell death. It is excluded from live, healthy cells, as well as early apoptotic cells. Dead cells thus show increased fluorescence in the Viability axis. Four populations of cells can be distinguished:
• (LL) Live cells with depolarized mitochondrial membrane: MitoPotential (-) and 7-AAD (-)
• (LR) Live cells with intact mitochondrial membrane: MitoPotential (+) and 7-AAD (-)
• (UR) Dead cells with depolarized mitochondrial membrane: MitoPotential (+) and 7-AAD (+)
• (UL) Dead cells with intact mitochondrial membrane: MitoPotential (-) and 7-AAD (+)
Figure 1. Representative plots from Muse MitoPotential Assay. The first plot has a threshold marker, allowing elimination of debris based on cell size, as well as a gate, allowing one to gate on cells. The second plot shows the gated cells with quadrant marker providing data on four cell populations—live, live/depolarized, dead/depolarized, and dead cells.
1

Summary of Protocol
Kit Components• Muse™ MitoPotential Dye (Part No.4700-1580, 100 tests/vial)• Muse™ MitoPotential 7-AAD (Part No. 4700-1585, 100 tests/vial)• 1X Assay Buffer (Part No. 4700-1330, 100 tests/bottle)
Materials Required but Not Supplied• Muse™ Cell Analyzer• Cell suspension• Tissue culture instruments and supplies (including 37°C incubator, growth media, detachment buffer, etc.)• Micropipettors• Disposable micropipettor tips• Microcentrifuge tubes with screw caps, 1.5 mL (VWR, Catalog No. 16466-030, or equivalent)• Vortex mixer• Disposable gloves• 20% bleach solution• Deionized water• Muse™ System Check Kit (Catalog No. MCH100101)• Muse™ Cell Dispersal Reagent (Catalog No. MCH100107), optional• Guava ICF Instrument Cleaning Fluid (Catalog No. 4200-0140), optional
Add 95 μL of Muse™ MitoPotential working
solution to 100 μL of cells.Add 5 μL of
Muse™ 7-AAD.
Incubate at 37°C for 20 minutes.
Mix thoroughly and run on Muse™ Cell Analyzer.
Culture cells, including negative and positive controls, by desired method.
Prepare cells for incubation with Muse™ MitoPotential working solution.
Prepare Muse™ MitoPotential working solution by diluting MitoPotential Dye
1:1000 with 1X Assay Buffer.Incubate at RT for 5 minutes.
2
Precautions• The Muse™ MitoPotential Kit is intended for research use only.• Wear proper laboratory attire (lab coat, gloves, safety glasses) when handling this reagent.• The Muse™ MitoPotential 7-AAD contains dyes that may be carcinogenic and/or mutagenic. Exercise standard
precautions when obtaining, handling, and disposing of potentially carcinogenic and mutagenic reagents. Refer to the MSDS for specific information on hazardous materials.
• The Muse MitoPotential 7-AAD Reagent contains sodium azide, which is toxic if ingested. Reagents containing sodium azide should be considered a poison. If products containing sodium azide are swallowed, seek medical advice immediately and show product container or label. (Refer to NIOSH, National Institute for Occupational Safety and Health; CAS#: 2628-22-8; and also to GHS, The Globally Harmonized System of Classification and Labeling of Chemicals.) Aqueous solutions of sodium azide, when mixed with acids, may liberate toxic gas. Any reagents containing sodium azide should be evaluated for proper disposal. Sodium azide may react with lead and copper plumbing to form highly explosive metal azides. Upon disposal, flush with large volumes of water to prevent build-up in plumbing. Check with regulatory agencies to determine at what concentration sodium azide may cause a product to be regulated as hazardous.
• 1X Assay Buffer does not contain any preservatives or anti-microbial agents. Avoid microbial contamination of the solution, which may cause erroneous results. Do not add sodium azide to this solution or it will negatively impact results.
• All biological specimens and materials should be handled as if capable of transmitting infection and disposed of with proper precautions in accordance with federal, state, and local regulations. Never pipette by mouth. Avoid specimen contact with skin and mucous membranes.
• Exercise care to avoid cross contamination of samples during all steps of this procedure, as this may lead to erroneous results.
• The fluorescent dyes in this kit (MitoPotential Dye and 7-AAD) are light sensitive. Store in the dark and shield from excessive exposure to light.
• The instructions provided have been designed to optimize the kit's performance. Deviation from the kit's instructions may result in suboptimal performance and may produce inaccurate data.
• During storage and shipment, small volumes of product may become entrapped in the seal of the product vial. For maximum recovery of the product, centrifuge the vial briefly prior to removing the cap.
• Do not use reagents beyond their expiration date.• Material Safety Data Sheets (MSDS) for kit reagents are available from our website (www.millipore.com/muse),
by contacting Millipore Technical Support, or from the Millipore technical library at www.millipore.com/ techlibrary.
Storage• Upon receipt store the Muse™ MitoPotential Dye at —20°C, desiccated and protected from light.• Store the Muse 7-AAD Reagent and 1X Assay Buffer at 2 to 8°C.
CAUTION: Any deviation in temperature for long periods of time may compromise the performance of the reagents.
CAUTION: Muse™ MitoPotential Dye is highly hydroscopic and needs to be stored desiccated.
3
Before You BeginThis protocol was developed to allow direct determination of the percent and count of cells with depolarized membrane potential in cell cultures. For optimal throughput, final cell concentrations should be between 2 x 10⁴ and 1 x 10⁵ cells/tube (or 1 x 10⁵ to 5 x 10⁵ cells/mL), although mitochondrial membrane depolarization can be detected in cultures with as few as 2 x 10³ cells/tube (or 1 x 10⁴ cells/mL). Care should be taken to keep cell concentrations as constant between samples of the same experiment.
Cells should be acquired shortly after the sample preparation had been completed. While some cell lines have been shown to yield stable results for up to 3 hours, others are stable for only 1 hour. This time variability is a consequence of using live, unfixed cells. Determine the stability of results for your own cells. Post-preparation stability may be increased by adding 1% BSA to the 1X Assay Buffer.
Time considerations: The process of staining cells with the Muse™ MitoPotential Kit takes approximately 25 minutes. Acquiring data on the Muse™ Cell Analyzer takes approximately 2 minutes per sample. However, preparing cells for testing requires periodic maintenance and cultivation several days in advance. Once you cultivate the proper number of cells for your experiment, it takes an additional 0.5 to 48 hours of culture with various inducers to stimulate detectable loss of mitochondrial membrane potential.
NOTE: For details on how to culture and prepare cell samples, including positive and negative control samples, see “Appendix A: Cell Sample Preparation” on page 13.
Always run a System Check prior to performing the assay. For details refer to the Muse™ Cell Analyzer User's Guide.
Reagent Preparation
Preparation of Muse™ MitoPotential Working SolutionMitoPotential working solution must be made fresh each day of use.
NOTE: Muse™ MitoPotential Dye is in DMSO and therefore solid at –20°C. Allow the reagent to completely thaw prior to making the working solution.
CAUTION: Avoid more than two freeze-thaw cycles of the MitoPotential Dye. We recommend storing 10-μL aliquots at –20°C, desiccated and protected from light.
1. Prepare a working solution by diluting the Muse™ MitoPotential Dye 1:1000 in 1X Assay Buffer. Each sample to be tested requires 100 μL of the MitoPotential working solution.
• Dilute the Muse™ MitoPotential stock solution with 1X Assay Buffer as suggested in the following table:
• Muse™ MitoPotential working solution must be used the same day it is prepared. Store at room temperature, protected from light until ready for use.
Preparation of MitoPotential Dye Working Solution
Component 20 Tests 50 Tests 100 Tests
Muse™ MitoPotential Dye 2 μL 5 μL 10 μL
1X Assay Buffer 1998 μL 4995 μL 9990 μL
4
Staining Protocol1. Prepare Muse™ MitoPotential Working Solution as described in “Reagent Preparation” on page 4.
2. Culture cells including positive and negative controls by desired method. For instructions on making cell suspensions, see “Appendix A: Cell Sample Preparation” on page 13.
3. Centrifuge and resuspend cells at 1 x 10⁵ to 5 x 10⁵ cells/mL in 1X Assay Buffer.
4. Add 100 μL of cells in suspension to each well or tube.
5. Add 95 μL of MitoPotential working solution to each well or tube. Mix thoroughly by pipetting up and down or vortexing for 3 to 5 seconds.
6. Incubate the cells for 20 minutes in a 37°C CO2 incubator.
7. Add 5 μL of Muse MitoPotential 7-AAD reagent to each well. Mix thoroughly by pipetting up and down or vortexing for 3 to 5 seconds.
8. Incubate samples for 5 minutes at room temperature.
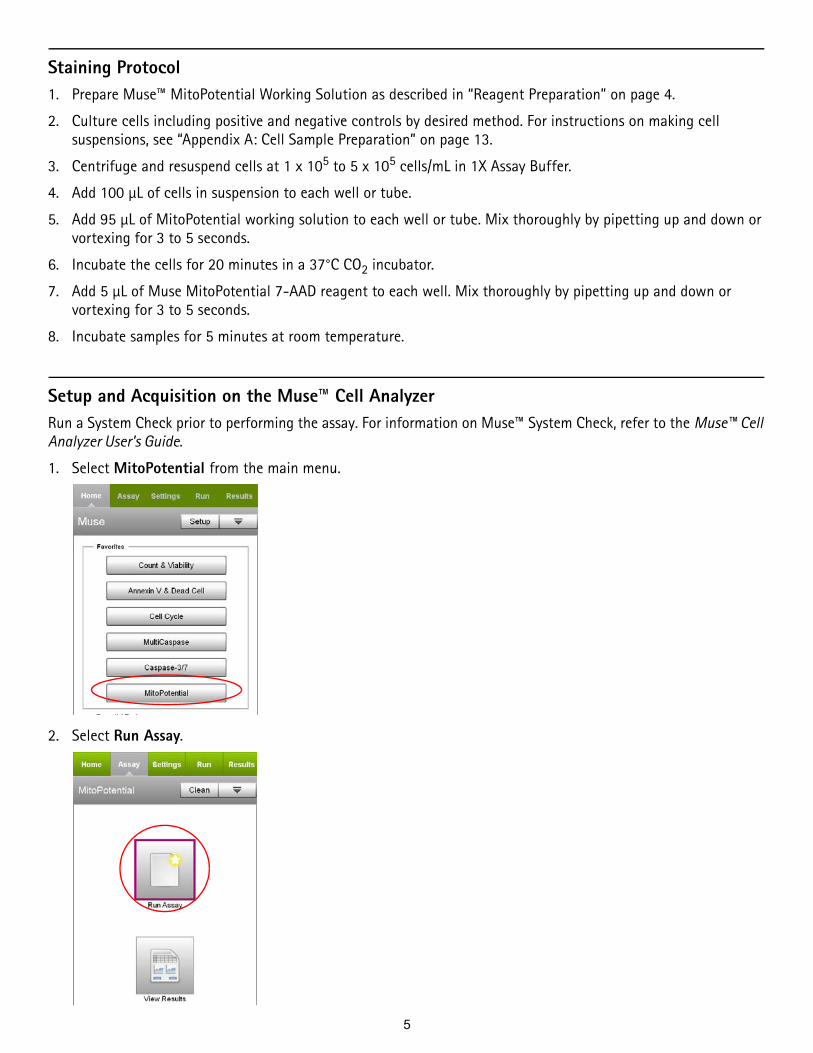
Setup and Acquisition on the Muse™ Cell AnalyzerRun a System Check prior to performing the assay. For information on Muse™ System Check, refer to the Muse™ Cell Analyzer User’s Guide.
1. Select MitoPotential from the main menu.
2. Select Run Assay.
5

3. Adjust the instrument settings.
• Load the negative control sample for adjusting the settings and select Run.
NOTE: Perform the adjust settings using a negative control, then verify the settings using a positive control.
• Or, to retrieve previously saved instrument settings, select Retrieve Settings. For more information on retrieving settings, see the Muse™ Cell Analyzer User’s Guide.
4. Fine tune the settings for the MITOPOTENTIAL vs CELL SIZE INDEX plot, if necessary.
• Adjust the CELL SIZE INDEX slider to the left of the plot to move the cellular population into the green region.
• Drag the threshold to exclude any cellular debris. Touch the threshold and drag to make large changes. Touch the arrow buttons located below the plot to make small changes. The arrow buttons appear after you touch the threshold.
NOTE: If the acquisition times out (after 2 minutes), remove the tube and mix well before reloading and continuing. Then, select either Back to restart the adjust settings step, or Next to accept the settings and continue to the next step.
5. Select Next when you've completed the adjustments.
6. Fine tune the settings for the MITOPOTENTIAL vs VIABILITY plot, if necessary.
• Adjust the Viability slider to place all populations (live, apoptotic and dead) on scale.
• Adjust the quadrant markers. You can move the marker intersection in any direction, as well as adjust the angle of each line. To move the markers as they are, touch the open circle at the intersection and drag the
This example data show typical gate and marker settings. The threshold was raised to remove debris.
Touch threshold to move up/down.
Touch and drag upper-left or lower-right corner to adjust the gate.
Negative control sample Positive control sample
6
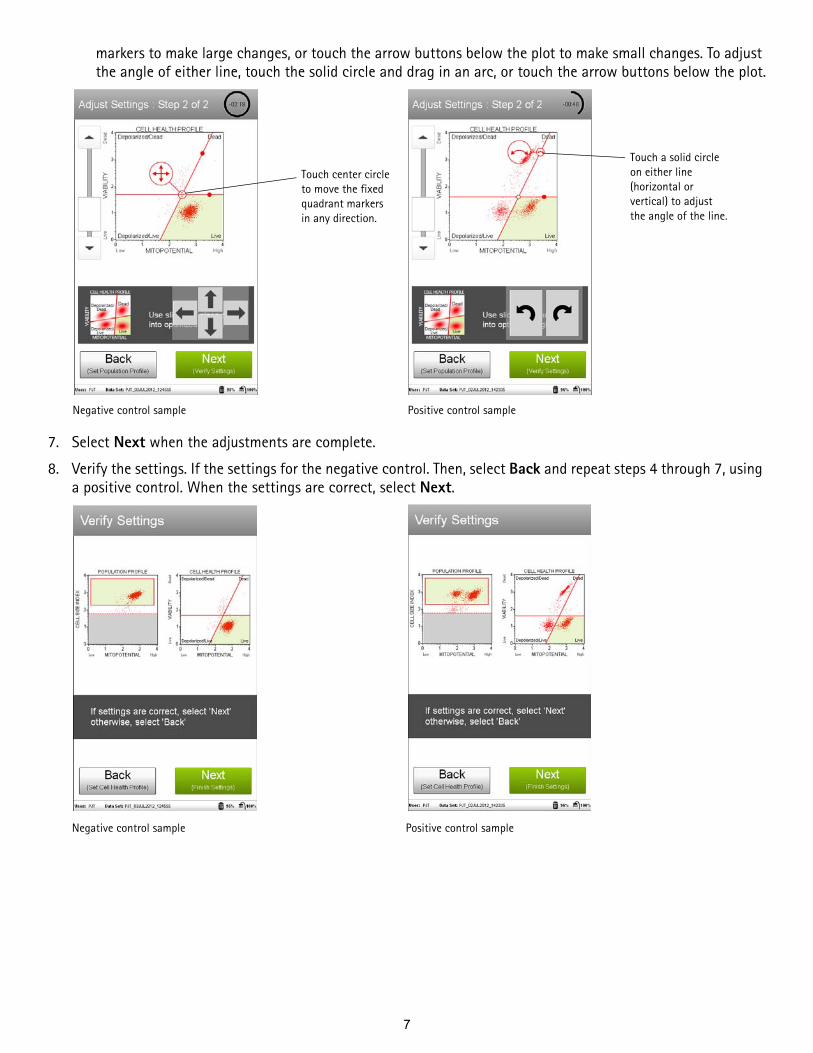
markers to make large changes, or touch the arrow buttons below the plot to make small changes. To adjust the angle of either line, touch the solid circle and drag in an arc, or touch the arrow buttons below the plot.
7. Select Next when the adjustments are complete.
8. Verify the settings. If the settings for the negative control. Then, select Back and repeat steps 4 through 7, using a positive control. When the settings are correct, select Next.
Touch center circle to move the fixed quadrant markers in any direction.
Touch a solid circle on either line (horizontal or vertical) to adjust the angle of the line.
Negative control sample Positive control sample
Negative control sample Positive control sample
7

9. Enter the sample ID by touching the field, then using the keypad to input the ID. Touch Done when you finish entering the ID. If necessary, change the Events to Acquire and/or Dilution Factor by touching the field, then selecting the value from the pop-up menu. Select Next.
10. Mix the first sample and load it on the instrument. Select Run to run the sample.
8

11. When acquisition is complete, the results are displayed. If necessary, select Plots to display dot plots for the sample. You can view or change the sample ID and/or dilution factor, as well as add annotations for the current sample by selecting the Sample Info tab. To print the results for the current sample select the printer tab.
12. (Optional) If changes are needed to the gate or markers, touch a plot to enlarge it, then adjust the cell size gate and/or marker as described in steps 4 and 6, respectively. You cannot adjust the cell size threshold after the sample has been acquired.If you adjust the gate or marker and wish to apply the changes to other samples that you already acquired, select the Apply Changes button ( ) in the title bar. Select the samples you want to apply the changes to or choose Select All, then select Apply. The sample you originally made changes to must be selected.
Select to display plots.
Select to hide plots.
Select to apply changes to other samples.
Apply changes
9
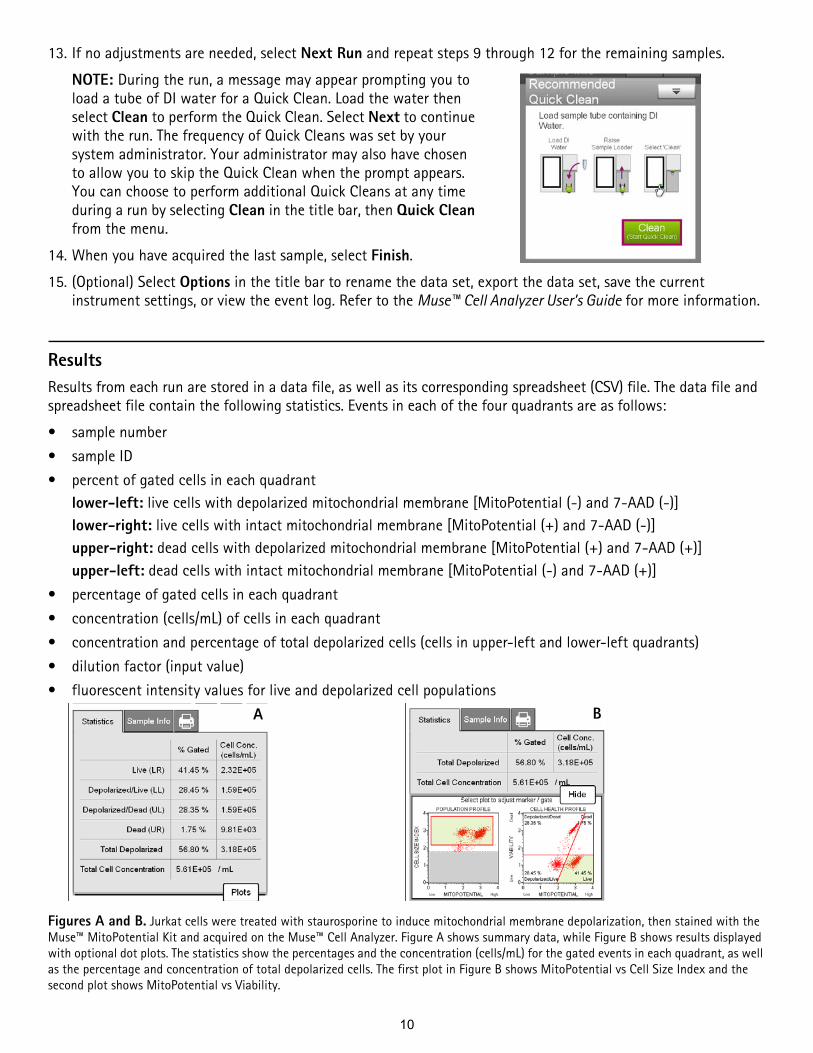
13. If no adjustments are needed, select Next Run and repeat steps 9 through 12 for the remaining samples.
NOTE: During the run, a message may appear prompting you to load a tube of DI water for a Quick Clean. Load the water then select Clean to perform the Quick Clean. Select Next to continue with the run. The frequency of Quick Cleans was set by your system administrator. Your administrator may also have chosen to allow you to skip the Quick Clean when the prompt appears. You can choose to perform additional Quick Cleans at any time during a run by selecting Clean in the title bar, then Quick Clean from the menu.
14. When you have acquired the last sample, select Finish.
15. (Optional) Select Options in the title bar to rename the data set, export the data set, save the current instrument settings, or view the event log. Refer to the Muse™ Cell Analyzer User’s Guide for more information.
ResultsResults from each run are stored in a data file, as well as its corresponding spreadsheet (CSV) file. The data file and spreadsheet file contain the following statistics. Events in each of the four quadrants are as follows:
• sample number• sample ID• percent of gated cells in each quadrant
lower-left: live cells with depolarized mitochondrial membrane [MitoPotential (-) and 7-AAD (-)]lower-right: live cells with intact mitochondrial membrane [MitoPotential (+) and 7-AAD (-)]upper-right: dead cells with depolarized mitochondrial membrane [MitoPotential (+) and 7-AAD (+)]upper-left: dead cells with intact mitochondrial membrane [MitoPotential (-) and 7-AAD (+)]
• percentage of gated cells in each quadrant• concentration (cells/mL) of cells in each quadrant• concentration and percentage of total depolarized cells (cells in upper-left and lower-left quadrants)• dilution factor (input value) • fluorescent intensity values for live and depolarized cell populations
Figures A and B. Jurkat cells were treated with staurosporine to induce mitochondrial membrane depolarization, then stained with the Muse™ MitoPotential Kit and acquired on the Muse™ Cell Analyzer. Figure A shows summary data, while Figure B shows results displayed with optional dot plots. The statistics show the percentages and the concentration (cells/mL) for the gated events in each quadrant, as well as the percentage and concentration of total depolarized cells. The first plot in Figure B shows MitoPotential vs Cell Size Index and the second plot shows MitoPotential vs Viability.
A B
10
Technical Tips1. Mix each cell sample thoroughly on a mixer before acquiring samples for consistent and accurate results.
However, avoid vigorous mixing, which can cause splashing and cellular breakdown, resulting in volume loss and erroneous results.
2. Multiple acquisitions of a cell sample minimize sampling error. Statistically, multiple acquisitions yield more accurate cell count and viability results.
3. The default number of events to acquire is 2000. You may select a different number; however, your statistical error will increase as you decrease the number of events for acquisition.
4. If the results deviate from the expected values, prepare a freshly stained sample and reacquire the data.
5. If the cell count results deviate from expected values, check that the correct value was entered for the dilution factor. The MitoPotential application can be used to recalculate cell counts. Open the data file corresponding to the mistaken entry. Reenter the correct dilution factor and the cell count values will be recalculated automatically.
6. Periodically run Quick Clean using a tube of DI water (after every 20 sample acquisitions) to prevent a buildup from cellular debris in the system. If your samples contain significant amounts of cellular debris, run the Quick Clean cycle more often to prevent clogs or blockage.
7. If you are acquiring data from a sample but the progress bar is not moving, there is probably either insufficient volume to continue to acquire the sample or a blockage of the flow system. First check to ensure that there is at least 100 μL of sample in the tube. If not, add additional buffer to bring the volume up to 100 μL or proceed to the next sample. If the sample volume is greater than 100 μL, then the lack of events is probably due to a clog. A clog or blockage can be caused by cell aggregates, cell debris, bleach crystals, or other particulates. Perform a Backflush to flush out the clog into a tube containing 20% bleach. Then run a Quick Clean to remove bleach residue. If this procedure does not alleviate the problem, refer to the Muse™ Cell Analyzer User's Guide for additional troubleshooting tips, or contact Millipore Technical Support for help.
8. Ensure you have the latest version of Muse™ software, which includes all assay modules, loaded on the instrument. Visit www.millipore.com/muse to get the latest software.
For more information, contact the Millipore office nearest you. In the US, call 1-800-MILLIPORE (1-800-645-5476). Outside the US, visit our website at www.millipore.com/offices for up-to-date worldwide contact information. You can also view the tech service page on our web site at www.millipore.com/techservice.
11

Troubleshooting
Potential Problem Experimental Suggestions
Acquisition taking longer than expected or progress bar stops during acquisition
Ensure that the System Check procedure was run and passed. If the progress bar stops during acquisition, the fluid system may be clogged. Run a Quick Clean procedure.
Instrument clogging;too many cells
Run a Quick Clean to clean out the capillary. This procedure can be performed during or after an assay. This will wash away any material forming within the glass capillary walls.
Low Cell Concentration warning during acquisition
The sample concentration may be too low. The assay instructions are optimized to give you a range of cells between 100–500 cells/μL in the final sample volume so accurate population count results are obtained. Repeat sample preparation with a lower dilution factor to allow for adequate cell numbers. A substantial decrease in cell numbers can lead to difficulty in adjusting settings.
High Cell Concentration warning during acquisition
If the concentration of the stained cell sample for acquisition is high (>500 cells/μL), the accuracy of data will most likely be compromised. Dilute the sample further with 1X Assay Buffer to adjust the cell concentration below 500 cells/μL. For best results, we recommend a cell concentration of 200–300 cells/μL.
Background staining and/or non-specific staining of cells
If all samples appear to be induced even when low levels of induction are expected, your cultured may be compromised. It is important to run negative control samples for each experiment. The negative control should be a sample from your cell culture, not treated to induce mitochondrial membrane depolarization. Typically, negative control samples show a low level of depolarization and/or dead cell marker–positive cells that are distinct from that of induced cells, because healthy cell cultures contain a small number of depolarized and/or dead cells. However, sub-optimal culture conditions may stress cells in culture, causing them to undergo depolarization in the absence of experimental induction treatment. The negative control from a stressed culture often shows increased depolarization and/or dead cell marker reactivity.
Low level of staining • Although the assay procedure has been optimized to function utilizing multiple cell types, every cell line behaves differently. A lack of signal may indicate that excess dilution factors may need to be altered to obtain accurate results.
• Possible reagent degradation. Verify that the reagent has been stored desiccated and is not past its expiration date.
• Live/uninduced control samples are recommended for each experiment. • Dim staining may be a sign that the cell concentration was too high and the concentration of
reagents was insufficient to stain the cells. Repeat the experiment using a lower number of cells per well.
Poor separation between live and depolarized populations
• Poor resolution could indicate that the staining time was too short. Make sure that the cells were stained for at least 20 minutes in a 37°C CO2 incubator.
• If resolution of samples is poor even with increased staining time, it may be necessary to wash the samples. To do this centrifuge the cells at 800 x g and resuspend in 195 μL of fresh 1X Assay Buffer plus 5 μL of Muse™ MitoPotential 7-AAD.
No positive cells Cells may not have undergone a change in membrane potential. Positive controls should be included for each experiment to ensure an accurate staining protocol. Treatments to induce a change in membrane potential in various cell lines include CCCP, valinomycin, and staurosporine.
12

Limitations• The results of the assay are dependent upon proper handling of samples, reagents, and instruments.• The Muse™ MitoPotential Reagents are designed for use on unfixed cells. Fixing cells yields inaccurate results.• The Muse Cell Analyzer and Muse™ MitoPotential Kit yield optimal results when the stained cell sample used for
acquisition is between 1 x 10⁴ to 5 x 10⁵ cells/mL. To obtain the most accurate results, adjust the cell concentrations to within the recommended range. However, to optimize throughput, we recommend using between 1 x 10⁵ to 5 x 10⁵ cells/mL when possible.
Appendix A: Cell Sample Preparation
ControlsRegardless of the type of cells (adherent or non-adherent) or culture vessel (microplate, tube, or flask) used, each experiment should include the proper negative and positive control samples as indicated below.
• Negative control sample: The negative control should be a sample from your cell culture, not treated to induce mitochondrial membrane depolarization. The stained negative control sample should be run at the beginning of the experiment, and used to adjust the instrument settings for background-level staining.
• Positive control sample: The positive control should be a sample of depolarized and dead cells from a culture treated using a known depolarization induction method for your cell line.
Preparing Non-Adherent and Adherent CellsThe following protocols describe how to harvest non-adherent or adherent cells cultured in 96-well plates, as well as non-adherent or adherent cells cultured in flasks or other tissue culture vessels. Each of the culturing conditions requires different protocols to harvest the cells.
Preparing non-adherent cells1. Set up initial culture conditions, such that after culture and treatment, cells are at a concentration of 1 x 10⁵ to
5 x 10⁵ cells/mL in low serum- or albumin-containing medium.
2. Proceed to “Staining Protocol” on page 5.
Preparing adherent cellsFor harvesting adherent cells, use your method of removal. Reagents such as EDTA or trypsin can be used to dissociate the cells from the flask and should create single-cell suspensions. If using mechanical means to dislodge the cells, Muse™ Cell Dispersal Reagent (Catalog No. MCH100107) may be used to dissociate clumps.
1. Using your preferred method for dissociation, detach the cells from their culture vessel.
Variability in day-to-day experiments
• If the results are inconsistent, check that the samples were well mixed prior to acquisition. Cells may quickly settle in your samples and your results will be inaccurate unless the cells are mixed just prior to acquisition.
• Monitor experimental cell cultures to ensure that cell viability and cell numbers being analyzed are consistent. Any drop in cell numbers or viability can influence experimental results.
• If there appears to be day-to-day variation of the staining pattern, ensure the Muse™ Cell Analyzer is working properly. Run the Muse™ System Check procedure to verify proper instrument function and accuracy.
Potential Problem Experimental Suggestions
13

2. Add fresh serum- or albumin-containing medium to each well so the final concentration is between 1 x 10⁵ to 5 x 10⁵ cells/mL.
3. Proceed to “Staining Protocol” on page 5.
References1. Finkel E. The mitochondrion: is it central to apoptosis? Science. 2001;292:624-626.
2. Zamzami N, Kroemer G. The mitochondrion in apoptosis: how Pandora's box opens. Nat Rev Mol Cell Biol. 2001;2:67-71.
3. Wang X. The expanding role of mitochondria in apoptosis. Genes Dev. 2001;15:2922-2933.
4. Ly JD, Grubb DR, Lawen A. The mitochondrial membrane potential [delta psi (m)] in apoptosis; an update. Apoptosis. 2003;8:115-128.
5. Zamzami N, Susin SA, Marchetti P, Hirsch T, Gomez-Monterrey I, Castedo M, Kroemer G. Mitochondrial control of nuclear apoptosis. J Exp Med. 1996;183:1533-1544.
6. Hearps AC, Burrows J, Connor CE, Woods GM, Lowenthal RM, Ragg SJ. Mitochondrial cytochrome C release precedes transmembrane depolarisation and caspase-3 activation during ceramide-induced apoptosis of Jurkat T cells. Apoptosis. 2002;7:387-394.
7. Krysko DV, Roels F, Leybaert L, D'Herde K. Mitochondrial transmembrane potential changes support the concept of mitochondrial heterogeneity during apoptosis. J Histochem Cytochem. 2001;49:1277-1284.
8. Gollapudi S, McCormick MJ, Gupta S. Changes in mitochondrial membrane potential and mitochondrial mass occur independent of the activation of caspase-8 and caspase-3 during CD95-mediated apoptosis in peripheral blood T cells. Int J Oncol. 2003;22:597-600.
9. Friedrich MJ. Scientists probe roles of mitochondria in neurological disease and injury. JAMA. 2004;291:679-681.
10. Schmidt I, Krall WJ, Uittenbogaart CH, Braun J, Guirgi JV. Dead cell discrimination with 7-amino-actinomycin D in combination with dual color immunofluorescence in single laser flow cytometry. Cytometry. 1992;13:204-208.
Related Kits• Muse™ System Check Kit – MCH100101 • Muse™ Count & Viability Kit (100T) – MCH100102• Muse™ Count & Viability Kit (600T) – MCH600103• Muse™ Count & Viability Kit (200X) – MCH100104 • Muse™ Annexin V & Dead Cell Kit – MCH100105 • Muse™ Cell Cycle Kit – MCH100106• Muse™ Cell Dispersal Reagent – MCH100107• Muse™ Caspase-3/7 Kit – MCH100108• Muse™ MultiCaspase Kit – MCH100109
14

WarrantyEMD Millipore Corporation ("Millipore") warrants its products will meet their applicable published specifications when used in accordance with their applicable instructions for either: a) a period of one year from the date of shipment of the products; or b) a term less than one year, as such term is expressly stated on the product specification or product label. MILLIPORE MAKES NO OTHER WARRANTY, EXPRESSED OR IMPLIED. THERE IS NO WARRANTY OF MERCHANTABILITY OR FITNESS FOR A PARTICULAR PURPOSE. The warranty provided herein and the data, specifications, and descriptions of Millipore products appearing in Millipore's published catalogues and product literature may not be altered except by express written agreement signed by an officer of Millipore. Representations, oral or written, which are inconsistent with this warranty or such publications are not authorized, and if given, should not be relied upon.
In the event of a breach of the foregoing warranty, Millipore’s sole obligation shall be to repair or replace, at its option, the applicable product or part thereof, provided the customer notifies Millipore promptly of any such breach. If after exercising reasonable efforts, Millipore is unable to repair or replace the product or part, then Millipore shall refund to the Company all monies paid for such applicable Product. MILLIPORE SHALL NOT BE LIABLE FOR CONSEQUENTIAL, INCIDENTAL, SPECIAL, OR ANY OTHER DAMAGES RESULTING FROM ECONOMIC LOSS OR PROPERTY DAMAGE SUSTAINED BY ANY COMPANY CUSTOMER FROM THE USE OF ITS PRODUCTS.
© 2013 EMD Millipore Corporation. All rights reserved. No part of these works may be reproduced in any form without permission in writing.
Unless otherwise stated in our catalog or other company documentation accompanying the product(s), our products are intended for research use only and are not to be used for any other purpose, which includes but is not limited to, unauthorized commercial uses, in vitro diagnostic uses, ex vivo or in vivo therapeutic uses, or any type of consumption or application to humans or animals.
Millipore, Muse, Guava, and the M logo are trademarks of Merck KGaA, Darmstadt, Germany.
March 6, 2013Revision C Part No. 4600-3421 MAN
15