muscle fiber type-dependent differences in the regulation ...vuir.vu.edu.au/30367/1/muscle fiber...
TRANSCRIPT

Muscle Fiber Type-Dependent Differences in theRegulation of Protein SynthesisCraig A. Goodman, Jack A. Kotecki, Brittany L. Jacobs, Troy A. Hornberger*
Department of Comparative Biosciences, School of Veterinary Medicine, University of Wisconsin-Madison, Madison, Wisconsin, United States of America
Abstract
This study examined fiber type-dependent differences in the regulation of protein synthesis in individual muscle fibersfound within the same whole muscle. Specifically, the in vivo SUrface SEnsing of Translation (SUnSET) methodology wasused to measure protein synthesis in type 1, 2A, 2X and 2B fibers of the mouse plantaris muscle, in response to fooddeprivation (FD), and mechanical overload induced by synergist ablation (SA). The results show that 48 h of FD induceda greater decrease in protein synthesis in type 2X and 2B fibers compared to type 1 and 2A fibers. Type 2X and 2B fibers alsohad the largest FD-induced decrease in total S6 protein and Ser240/244 S6 phosphorylation, respectively. Moreover, only type2X and 2B fibers displayed a FD-induced decrease in cross-sectional area (CSA). Ten days of SA also induced fiber type-dependent responses, with type 2B fibers having the smallest SA-induced increases in protein synthesis, CSA and Ser240/244
S6 phosphorylation, but the largest increase in total S6 protein. Embryonic myosin heavy chain (MHCEmb) positive fiberswere also found in SA muscles and the protein synthesis rates, levels of S6 Ser240/244 phosphorylation, and total S6 proteincontent, were 3.6-, 6.1- and 2.9-fold greater than that found in fibers from control muscles, respectively. Overall, theseresults reveal differential responses in the regulation of protein synthesis and fiber size between fiber types found withinthe same whole muscle. Moreover, these findings demonstrate that changes found at the whole muscle level do notnecessarily reflect changes in individual fiber types.
Citation: Goodman CA, Kotecki JA, Jacobs BL, Hornberger TA (2012) Muscle Fiber Type-Dependent Differences in the Regulation of Protein Synthesis. PLoSONE 7(5): e37890. doi:10.1371/journal.pone.0037890
Editor: Marco Sandri, University of Padova, Italy
Received March 8, 2012; Accepted April 30, 2012; Published May 22, 2012
Copyright: � 2012 Goodman et al. This is an open-access article distributed under the terms of the Creative Commons Attribution License, which permitsunrestricted use, distribution, and reproduction in any medium, provided the original author and source are credited.
Funding: This work was supported by U.S. National Institutes of Health grant AR057347 to TAH. The funders had no role in study design, data collection andanalysis, decision to publish, or preparation of the manuscript.
Competing Interests: The authors have declared that no competing interests exist.
* E-mail: [email protected]
Introduction
Mammalian skeletal muscles are heterogeneous tissues com-
posed of different fiber types that are identified by their expression
of specific myosin heavy chain (MHC) isoforms. For example,
adult limb and trunk muscles are composed of four major fiber
types; oxidative slow-twitch type 1 fibers, oxidative fast-twitch type
2A fibers, and glycolytic fast-twitch type 2X and 2B fibers, which
express MHC isoforms 1, 2a, 2x and 2b, respectively. Over the last
century, a large body of research has described the distinct genetic,
structural, functional, metabolic and adaptive characteristics of
these fiber types (for reviews see [1–5]). However, due to technical
limitations, comparatively little is known about possible fiber type-
dependent differences in the regulation of protein synthesis [6].
Nonetheless, a thorough understanding of how protein synthesis is
regulated in different fiber types remains fundamentally important
to furthering our knowledge of how skeletal muscles adapt to
conditions such as altered mechanical loading, injury, changes in
nutritional or hormonal status, and to pharmacological or genetic
therapies [5].
Recently, we developed a non-radioactive method for measur-
ing in vivo rates of protein synthesis at the single muscle fiber level.
This method is based on the principles of the SUrface SEnsing of
Translation (SUnSET) technique and it involves injecting animals
with a low dose of puromycin (a structural analog of tyrosyl-tRNA)
[7,8]. The puromycin gets incorporated into nascent peptides in
a rate-dependent manner and then anti-puromycin immunohis-
tochemistry is used to quantify the amount of puromycin labelled
peptides [8]. Importantly, several studies have shown that the
quantitative results obtained with this approach are indistinguish-
able from those obtained with more traditional methods of
measuring protein synthesis [7–9]. Furthermore, when combined
with immunohistochemistry against specific MHC isoforms, this
methodology can be used to determine rates of protein synthesis
within a specific muscle fiber type [8]. Indeed, we have successfully
used the SUnSET approach to demonstrate that basal rates of
protein synthesis in the mouse plantaris (PLT) muscle vary in
a fiber-type dependent manner (2B , 2X , 2A < 1) [8].
Our finding of fiber type-dependent differences in basal rates of
protein synthesis highlights the long standing question of whether
physiological perturbations can alter protein synthesis in a fiber
type-dependent manner [10]. In support of this possibility, it has
been shown that perturbations, such as food deprivation, alcohol
administration, glucocorticoids, and burns, induce a greater
decrease in the rate of protein synthesis in whole muscles that
are composed predominantly of fast-twitch fibers (e.g. extensor
digitorum longus vs. soleus) [11–15]. These whole muscle studies
seemingly provide support for the hypothesis that the adaptive
changes in protein synthesis occur in a fiber type-dependent
manner. However, it could also be argued that the differences
observed between whole fast- and slow-twitch muscles have
nothing to do with fiber type composition per se, but instead, are
the result of their different anatomical positions and functional
PLoS ONE | www.plosone.org 1 May 2012 | Volume 7 | Issue 5 | e37890

roles. Hence, we set out to firmly establish whether or not various
stimuli can induce fiber type specific alterations in the rate of
protein synthesis within a single whole muscle. To accomplish this
goal, we subjected mice to food deprivation, or mechanical
overload via synergist ablation (SA), and then used the SUnSET
approach to measure the effect on protein synthesis in type 1, 2A,
2X and 2B fibers of the PLT muscle. Based on our results, it is now
apparent that physiological perturbations can induce fiber type
specific changes in the rate of protein synthesis.
Materials and Methods
AnimalsMale FVB/N mice, 8–10 wk old, were used for all conditions.
Mice were housed under a 12 h light/dark cycle with ad libitum
access to food and water unless otherwise stated. Before all surgical
procedures, mice were anesthetized with an intraperitoneal (IP)
injection of ketamine (100 mg/kg) and xylazine (10 mg/kg). After
tissue extractions, the mice were euthanized by cervical disloca-
tion. All methods were approved by the Institutional Animal Care
and Use Committee of the University of Wisconsin-Madison
under the protocol #V01324.
Experimental ModelsFood Deprivation. Food deprived (FD) mice had food
withdrawn for 48 h, with ad libitum access to water as previously
described [8]. Control mice were maintained on the ad libitum
diet (Ad Lib). After 48 h, the PLT muscles from these mice were
subjected to the various measurements described below.
Synergist Ablation of the Plantaris Muscle. Mechanical
overload was induced by synergist ablation (SA) surgery that
involved the bilateral removal of the soleus and distal half of the
gastrocnemius muscle, leaving the PLT as the sole plantar flexor
muscle [8,16]. Mice in the control group received a sham surgery,
for which an incision was made on the lower leg and then closed.
After the surgical procedures, the incision was closed with
Vetbond surgical glue (Henry Schein, Melville, NY, USA). Mice
were allowed to recover for 10 d, after which, their PLT muscles
were subjected to the various measurements described below.
Measurement of In Vivo Protein Synthesis with SUnSETFor in vivo measurements of protein synthesis, a pair of mice (Ad
lib and FD or Sham and SA) were anesthetized and then
simultaneously given an IP injection of 0.04 mmol/g puromycin
dissolved in 100 ml of phosphate buffered saline (PBS), as
previously described [8]. At exactly 30 min after the injection,
the PLT muscles from both mice were simultaneously dissected,
aligned adjacent each other in optimal cutting temperature (OCT)
compound (Tissue-Tek; Sakura, Torrance, CA, USA) and then
frozen together in liquid N2-chilled isopentane.
Immunohistochemical AnalysisMuscle Fiber Type, Cross-Sectional Area and Protein
Synthesis. Cross sections (10 mm thick) from the paired muscles
were taken at the mid-belly and fixed in 220uC acetone for
10 min. Sections were warmed to room temperature for 5 min
and then incubated in PBS for 15 min, followed by a 1 h
incubation in solution A [PBS with 0.5% bovine serum albumin
(BSA) and 0.5% Triton X-100] containing anti-mouse IgG Fab
(1:10; Jackson Immuno-Research). After three 5 min washes with
PBS, samples were incubated for 1 h with solution A containing
primary antibodies [mouse IgG2a monoclonal anti-puromycin
(clone 12D10, 1:1000) [7] and one, or two, of the following: mouse
IgG2b monoclonal anti-type 1 MHC (clone BA-D5, 1:100), mouse
IgG1 monoclonal anti-type 2a MHC (clone SC-71, 1:100), mouse
IgM monoclonal anti-type 2b MHC (clone BF-F3, 1:10), mouse
IgM monoclonal anti-type 2x MHC (clone 6H1, 1:10), or mouse
IgG1 monoclonal anti-embryonic MHC (clone F1.652, 1:50)]. All
MHC antibodies were obtained from the Developmental Studies
Hybridoma Bank at the University of Iowa (Ames, IA, USA). After
three 5 min washes with PBS, samples were incubated for 1 h with
solution A containing secondary antibodies [DyLight 594-conju-
gated anti-mouse IgG Fc 2a (1:500) and, depending on the anti-
MHC primary antibody applied, FITC-conjugated anti-mouse
IgG Fc 1 (1:100; Jackson Immuno-Research), Alexa 350-conju-
gated anti-mouse IgG Fc 2b (1:500; Invitrogen, Carlsbad, CA,
USA) or AMCA-conjugated anti-mouse IgM (1:150; Jackson
ImmunoResearch)]. Samples were then washed 3 times for
10 min and images of the different fluorophores were captured
with a Nikon DS-QiMc camera (Nikon, Tokyo, Japan), which has
a .33-fold working linear range (r = 0.9997, data not shown).
The camera was mounted on a Nikon 80i epifluorescence
microscope, and monochrome images were captured through
TRITC, FITC and/or DAPI cubes and merged with Nikon NIS-
Elements D software as previously described [8,17]. For most of
the quantification procedures, up to sixty fibers, within a given
fiber type (type 1, 2A, 2X, or 2B), were randomly selected from
each control (Ad lib or Sham) and experimental (FD or SA) sample
on the same slide. The periphery of these fibers was traced with
Nikon NIS-Elements D software and measurements of the area
and the average puromycin signal intensity were obtained. To
calculate relative rates of protein synthesis, the intensity of the
puromycin signal in a given fiber type was expressed relative to the
mean intensity obtained from the same fiber type within the
control section on the same slide. One exception to this procedure
involved the analysis of fibers in SA muscles that expressed the
embryonic MHC isoform (MHCEmb). For MHCEmb fibers, the
area and average puromycin signal intensity was expressed relative
to the mean of sixty randomly selected, non-typed, fibers from the
sham section on the same slide. All analyses were performed on
images that had signal intensities within the linear range of the
camera. The analyses were performed by investigators masked to
the sample identity and involved the quantification of at least five
independent pairs of muscles.
Muscle Fiber Type, Total Ribosomal S6 Protein and S6
phosphorylation. Muscle samples were collected, sectioned
and stained as described above with the following modifications.
After warming and incubation in PBS for 15 min, the sections
were then incubated in solution B [PBS with 5% normal goat
serum (Jackson Immuno-Research) and 0.5% Triton-X] for 1 h.
After three 5 min washes, samples were incubated for 1 h with
solution A containing primary antibodies specific for MHC 1, 2a,
2x or 2b as described above, and either rabbit anti-ribosomal S6
protein antibody (1:100, clone 5G10, Cell Signaling) or anti-rabbit
phospho-S6 ribosomal protein (Ser240/244) XPH antibody (1:100,
clone D68F8, Cell Signaling). After three 5 min washes with PBS,
samples were incubated for 1 h with solution B containing
secondary antibodies for the detection of specific MHC isoforms
and DyLight 594-conjugated goat anti-rabbit IgG (1:8000 for total
S6 and 1:3000 for Ser240/244 S6 phosphorylation; Jackson
Immuno-Research). Samples were then washed 3 times for
10 min with PBS and images of the different fluorophores were
then captured, processed and quantified for relative levels of total
S6 and Ser240/244 S6 phosphorylation as described for the protein
synthesis measurements. One exception to this procedure involved
the analysis of basal levels total S6 and Ser240/244 S6 phosphor-
ylation in fibers from Ad Lib muscles (see Fig. S3). For these
analyses, up to sixty type 2A, and either type 1, 2X, or 2B fibers,
Fiber Type-Dependent Rates of Protein Synthesis
PLoS ONE | www.plosone.org 2 May 2012 | Volume 7 | Issue 5 | e37890

were randomly selected from each Ad Lib section, and the average
total S6 or Ser240/244 S6 phosphorylation signal intensity in
individual type 1, 2X, or 2B fibers was expressed relative to the
mean total S6, or Ser240/244 S6 phosphorylation signal in type 2A
fibers from the same section [8].
Statistical AnalysisAll statistical analyses were performed with GraphPad Prism 5.0
(GraphPad Software Inc., La Jolla, CA, USA). Student’s 2-tailed,
unpaired t-tests, were used for all 2-group comparisons. One-way
ANOVA with Newman-Keul post-hoc analysis was used for
comparisons involving more than 2 groups. The statistical
significance level was set at P,0.05.
Results
Muscle Fiber Protein Synthesis and Cross Sectional AreaTo explore potential fiber type differences in the regulation of
protein synthesis, we employed two experimental models that are
known to induce a decrease [food deprivation (FD)] and an
increase [synergist ablation (SA)] in skeletal muscle protein
synthesis [8,11,18].
Food Deprivation. In the PLT muscle we identified four
different fiber types: slow-twitch type 1 and fast-twitch types 2A,
2X and 2B (Fig. 1 A–D). As shown in Fig. 1E, whole muscle cross-
sections of Ad Lib and FD muscles demonstrate that FD resulted
in substantial decrease in the overall puromycin signal intensity /
protein synthesis. When quantified in the individual fiber types,
a significant reduction in protein synthesis in all four fiber types
was observed (Fig. 1F and Fig. S1). Furthermore, in type 2X and
2B fibers, the magnitude of the reduction in protein synthesis was
significantly greater than that observed in type 1 and 2A fibers
(Fig. 1F). Consistent with the larger decreases in protein synthesis,
it was also determined that FD only induced a significant decrease
in the cross-sectional area (CSA) of the type 2X and 2B fibers
(Fig. 1G and Fig. S1). Combined, these data demonstrate that the
magnitude of the effect of FD on both protein synthesis, and fiber
size, occurs in a fiber-type dependent manner.
Synergist Ablation. As shown in Fig. 2A–E, 10 d of synergist
ablation (SA) induced a striking hypertrophic response. The
hypertrophic effect of SA was also associated with a marked
increase in protein synthesis at the whole muscle level (Fig. 2E).
When quantified in the individual fiber types, a significant increase
in protein synthesis in all four fiber types was observed (Fig. 2F and
Fig. S2). These results also demonstrated that type 2B fibers had
a significantly smaller increase in protein synthesis when compared
to all of the other fiber types (Fig. 2F). Furthermore, the increase in
the rate of protein synthesis in type 2X fibers was significantly
greater than type 2B fibers but less than type 2A fibers, while the
increase in type 1 fibers was not different from that of type 2A and
2X fibers (Fig. 2F). SA also induced a significant increase in the
CSA of all four fiber types (Fig. 2G and Fig. S2). Consistent with
the changes in protein synthesis, the type 2B fibers also revealed
the smallest increase in CSA, while type 2A fibers had the largest
increase in CSA (Fig. 2H). Furthermore, the increase in the CSA
of type 1 and 2X fibers was greater than that in type 2B fibers, but
less than that in type 2A fibers (Fig. 2H). Taken together, these
data firmly demonstrate that SA induces muscle fiber type-
dependent increases in both protein synthesis and fiber CSA.
Total Ribosomal S6 Protein and S6 Ser240/244
PhosphorylationTo gain insight into the mechanism(s) responsible for the
observed fiber type-dependent changes in protein synthesis we
performed IHC analysis for crude markers of translational
capacity and translational efficiency. As a marker for translational
capacity we measured the total amount of the ribosomal S6
protein (a protein associated with the 40S ribosomal subunit [19]).
For translational efficiency, we chose to examine changes in
Ser240/244 phosphorylation of the ribosomal S6 protein. This
selection was based on previous studies which have shown that
ribosomal S6 protein is phosphorylated at the Serine 240 and 244
residues by p70 ribosomal S6 kinase (p70S6K) [19–21]. Further-
more, p70S6K is a direct downstream target of the mammalian
target of rapamycin complex 1 (mTORC1), and mTORC1 has
been widely implicated in the regulation of translational efficiency
[22]. Thus, changes in S6 Ser240/244 phosphorylation were used as
a marker of potential mTORC1-mediated changes in translational
efficiency.
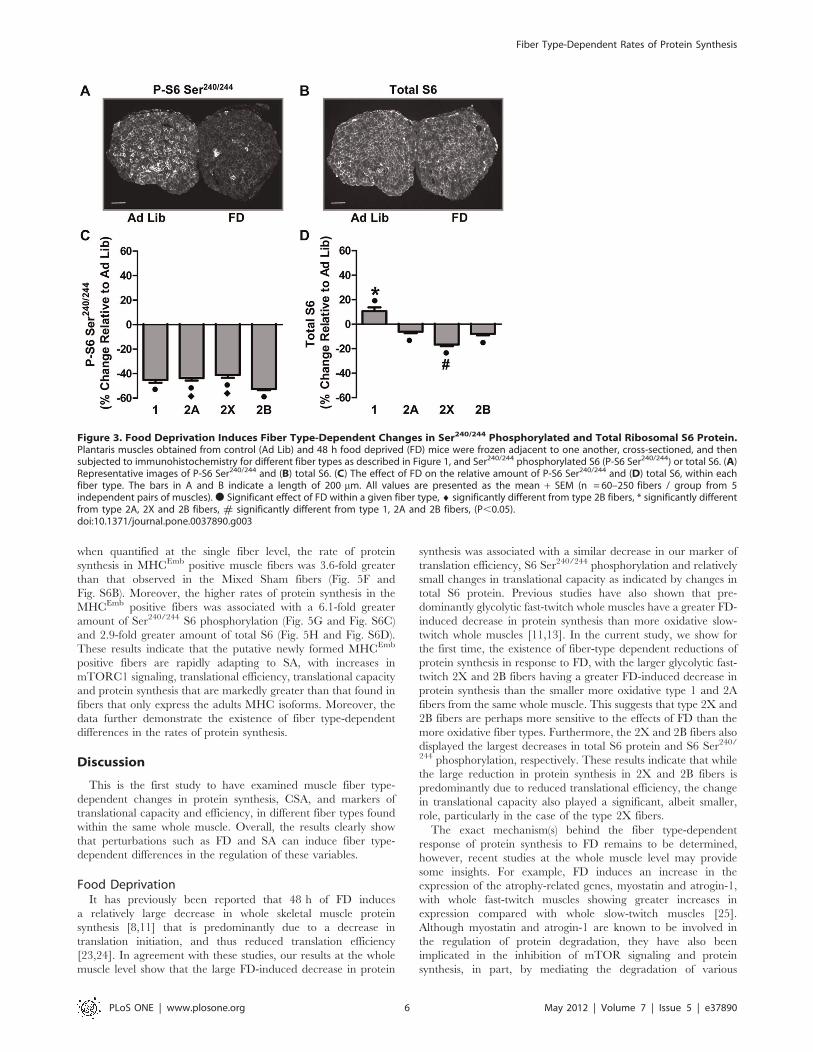
Food Deprivation. Figures 3A and 3B show Ad Lib and FD
muscle cross-sections stained for Ser240/244 S6 phosphorylation
and total S6 protein, respectively. The first striking observation
from these images was the inter-fiber variability of staining
intensities within the Ad Lib sections, suggesting the possibility of
fiber type-dependent differences in basal levels of Ser240/244 S6
phosphorylation and total S6 protein. Indeed, when quantified at
the single fiber level, Ser240/244 S6 phosphorylation in each fiber
type varied in the following manner: type 1 . 2A . 2X = 2B
(Fig. S3A). Furthermore, total S6 protein also varied in a fiber
type-dependent manner with type 2A . 1 . 2X . 2B (Fig. S3B).
The second striking observation from Fig. 3 was the large FD-
induced decrease in Ser240/244 S6 phosphorylation (Fig. 3A) and
the comparatively small decrease in whole muscle total S6 staining
intensity (Fig. 3B). This suggests that FD induced a large decrease
in mTORC1 signaling, and that the FD-induced decrease in
protein synthesis was more likely due to an acute decrease in
translational efficiency rather than a marked decrease in trans-
lational capacity. Similar to that observed for the whole muscle
sections, Ser240/244 S6 phosphorylation was significantly decreased
in all four fiber types (Fig. 3C and Fig. S4). The change in Ser240/
244 S6 phosphorylation also revealed a fiber type-dependent effect
with type 2B fibers having a significantly larger decrease than type
2A and 2X fibers (Fig. 3C). Also, relatively small, but significant,
fiber type-dependent changes in total S6 protein were observed
with total S6 slightly increasing in type 1 fibers and decreasing in
2A, 2X and 2B fibers (Fig. 3D and Fig. S4). Interestingly, the FD-
induced decrease in total S6 protein was significantly greater (.2-
fold) in type 2X fibers compared to type 2A and 2B fibers. Overall,
type 2X and 2B fibers, which had the largest FD-induced
decreases in protein synthesis (Fig. 1F), and were the only fiber
types to display a FD-induced decrease in CSA (Fig. 1G), also had
the largest decreases in total S6 and Ser240/244 S6 phosphoryla-
tion, respectively. These results suggest that the FD-induced fiber
type-dependent changes in protein synthesis are associated with
a complex combination of fiber type-dependent changes in
translational efficiency, and to a lesser extent, translational
capacity.
Synergist Ablation. In contrast to FD, SA induced large
increases in both Ser240/244 S6 phosphorylation (Fig. 4A) and total
S6 protein (Fig. 4B) at the whole muscle level. Together, these data
suggest that the SA-induced increase in protein synthesis (Fig. 2)
was due to a combination of increases in both translational
efficiency and translational capacity. At the single fiber level, all
fiber types showed a significant increase in Ser240/244 S6
phosphorylation; however, this occurred in a fiber type-dependent
manner with type 1 fibers revealing the largest increase and type
2B fibers having the smallest increase (Fig. 4C and Fig. S5). Total
S6 protein also increased across all the fiber types, and again, the
Fiber Type-Dependent Rates of Protein Synthesis
PLoS ONE | www.plosone.org 3 May 2012 | Volume 7 | Issue 5 | e37890

increase was fiber type-dependent, with type 2B fibers having
a larger increase in total S6 protein than all other fiber types
(Fig. 4D and Fig. S5). Thus, type 2B fibers had the smallest
increase in protein synthesis and Ser240/244 S6 phosphorylation
but the largest increase in total S6 protein. These results highlight
that the fiber type-dependent regulation of protein synthesis in
response to SA involves a complex interplay between fiber type-
dependent changes in translational efficiency and translational
capacity.
MHCEmb Positive Fibers in Synergist Ablated MusclesRecently, we reported that SA induces a significant increase in
the total number of muscle fibers per cross-section [16].
Furthermore, we also showed that SA induced an increase in
the number of muscle fibers expressing the embryonic MHC
isoform (MHCEmb; the isoform predominantly expressed in newly
formed fibers), and that the magnitude of the increase in these
fibers was similar to the increase in the total number of fibers [16].
Taken together, these data suggested that SA induces the
formation of new muscle fibers (i.e. hyperplasia). In the current
Figure 1. Food Deprivation Induces Fiber Type-Dependent Changes in Protein Synthesis and Cross-Sectional Area. Plantaris musclesobtained from control (Ad Lib) and 48 h food deprived (FD) mice were frozen adjacent to one another, cross-sectioned, and then subjected toimmunohistochemistry for rates of protein synthesis (puromycin, red) and fiber type via the identification of (A) type 1, (B) type 2a, (C) type 2x or (D)type 2b, myosin heavy chain isoforms (green). (E) Grayscale image of the puromycin signal from the same pair of muscles shown in A–D. (F) Theeffect of FD on the relative rate of protein synthesis and (G) cross-sectional area (CSA), within each fiber type. The bars in A–E indicate a length of200 mm. All values are presented as the mean + SEM (n = 60–250 fibers / group from 5 independent pairs of muscles). N Significant effect of FDwithin a given fiber type, { significantly different from type 1 and 2A fibers, (P,0.05).doi:10.1371/journal.pone.0037890.g001
Fiber Type-Dependent Rates of Protein Synthesis
PLoS ONE | www.plosone.org 4 May 2012 | Volume 7 | Issue 5 | e37890

study, we observed a population of smaller diameter fibers with
very high puromycin staining and hypothesized that these might
be newly formed MHCEmb positive fibers. Therefore, we stained
for the presence of fibers expressing MHCEmb and measured
protein synthesis, Ser240/244 S6 phosphorylation and total S6
protein in these fibers when compared to a population of mixed
fiber types randomly chosen from the adjacent Sham cross-section
(Mixed Sham).
As shown in Fig. 5A, and as previously reported [16], SA
muscles contained a population of MHCEmb positive fibers that
were not present in Sham cross-sections. Consistent with the idea
that these are newly formed fibers, the MHCEmb positive fibers
were significantly smaller in CSA when compared to the Mixed
Sham fibers (Fig. 5E and Fig. S6A). Furthermore, higher
magnification images revealed that these smaller MHCEmb
positive muscle fibers had very high puromycin signal intensities,
and thus, high rates of protein synthesis (Fig. 5C and 5D). Indeed,
Figure 2. Synergist Ablation Induces Fiber Type-Dependent Changes in Protein Synthesis and Cross-Sectional Area. Plantaris musclesobtained from control (Sham) and 10 d synergist ablated (SA) mice were frozen adjacent to one another, cross-sectioned, and then subjected toimmunohistochemistry for rates of protein synthesis (puromycin, red) and fiber type via the identification of (A) type 1, (B) type 2a, (C) type 2x or (D)type 2b, myosin heavy chain isoforms (green). (E) Grayscale image of the puromycin signal from the same pair of muscles shown in A–D. (F) Theeffect of SA on the relative rate of protein synthesis within each fiber type. (G) The absolute and (H) relative effect of SA on the cross-sectional area(CSA) of each fiber type. The bars in A–E indicate a length of 200 mm. All values are presented as the mean + SEM (n = 84–500 fibers / group from 6independent pairs of muscles). N Significant effect of SA within a given fiber type, * significantly different from type 1, 2A and 2X fibers, #significantly different from type 2A fibers, (P,0.05).doi:10.1371/journal.pone.0037890.g002
Fiber Type-Dependent Rates of Protein Synthesis
PLoS ONE | www.plosone.org 5 May 2012 | Volume 7 | Issue 5 | e37890
when quantified at the single fiber level, the rate of protein
synthesis in MHCEmb positive muscle fibers was 3.6-fold greater
than that observed in the Mixed Sham fibers (Fig. 5F and
Fig. S6B). Moreover, the higher rates of protein synthesis in the
MHCEmb positive fibers was associated with a 6.1-fold greater
amount of Ser240/244 S6 phosphorylation (Fig. 5G and Fig. S6C)
and 2.9-fold greater amount of total S6 (Fig. 5H and Fig. S6D).
These results indicate that the putative newly formed MHCEmb
positive fibers are rapidly adapting to SA, with increases in
mTORC1 signaling, translational efficiency, translational capacity
and protein synthesis that are markedly greater than that found in
fibers that only express the adults MHC isoforms. Moreover, the
data further demonstrate the existence of fiber type-dependent
differences in the rates of protein synthesis.
Discussion
This is the first study to have examined muscle fiber type-
dependent changes in protein synthesis, CSA, and markers of
translational capacity and efficiency, in different fiber types found
within the same whole muscle. Overall, the results clearly show
that perturbations such as FD and SA can induce fiber type-
dependent differences in the regulation of these variables.
Food DeprivationIt has previously been reported that 48 h of FD induces
a relatively large decrease in whole skeletal muscle protein
synthesis [8,11] that is predominantly due to a decrease in
translation initiation, and thus reduced translation efficiency
[23,24]. In agreement with these studies, our results at the whole
muscle level show that the large FD-induced decrease in protein
synthesis was associated with a similar decrease in our marker of
translation efficiency, S6 Ser240/244 phosphorylation and relatively
small changes in translational capacity as indicated by changes in
total S6 protein. Previous studies have also shown that pre-
dominantly glycolytic fast-twitch whole muscles have a greater FD-
induced decrease in protein synthesis than more oxidative slow-
twitch whole muscles [11,13]. In the current study, we show for
the first time, the existence of fiber-type dependent reductions of
protein synthesis in response to FD, with the larger glycolytic fast-
twitch 2X and 2B fibers having a greater FD-induced decrease in
protein synthesis than the smaller more oxidative type 1 and 2A
fibers from the same whole muscle. This suggests that type 2X and
2B fibers are perhaps more sensitive to the effects of FD than the
more oxidative fiber types. Furthermore, the 2X and 2B fibers also
displayed the largest decreases in total S6 protein and S6 Ser240/
244 phosphorylation, respectively. These results indicate that while
the large reduction in protein synthesis in 2X and 2B fibers is
predominantly due to reduced translational efficiency, the change
in translational capacity also played a significant, albeit smaller,
role, particularly in the case of the type 2X fibers.
The exact mechanism(s) behind the fiber type-dependent
response of protein synthesis to FD remains to be determined,
however, recent studies at the whole muscle level may provide
some insights. For example, FD induces an increase in the
expression of the atrophy-related genes, myostatin and atrogin-1,
with whole fast-twitch muscles showing greater increases in
expression compared with whole slow-twitch muscles [25].
Although myostatin and atrogin-1 are known to be involved in
the regulation of protein degradation, they have also been
implicated in the inhibition of mTOR signaling and protein
synthesis, in part, by mediating the degradation of various
Figure 3. Food Deprivation Induces Fiber Type-Dependent Changes in Ser240/244 Phosphorylated and Total Ribosomal S6 Protein.Plantaris muscles obtained from control (Ad Lib) and 48 h food deprived (FD) mice were frozen adjacent to one another, cross-sectioned, and thensubjected to immunohistochemistry for different fiber types as described in Figure 1, and Ser240/244 phosphorylated S6 (P-S6 Ser240/244) or total S6. (A)Representative images of P-S6 Ser240/244 and (B) total S6. (C) The effect of FD on the relative amount of P-S6 Ser240/244 and (D) total S6, within eachfiber type. The bars in A and B indicate a length of 200 mm. All values are presented as the mean + SEM (n = 60–250 fibers / group from 5independent pairs of muscles).N Significant effect of FD within a given fiber type, ¤ significantly different from type 2B fibers, * significantly differentfrom type 2A, 2X and 2B fibers, # significantly different from type 1, 2A and 2B fibers, (P,0.05).doi:10.1371/journal.pone.0037890.g003
Fiber Type-Dependent Rates of Protein Synthesis
PLoS ONE | www.plosone.org 6 May 2012 | Volume 7 | Issue 5 | e37890

ribosomal proteins and translation factors [26–28]. Thus, the
greater FD-induced reduction of protein synthesis in type 2X and
2B fibers, may in part be explained by larger increases in atrogin-1
and myostatin. This is further supported by our finding that only
2X and 2B fibers experienced significant atrophy in response to
FD.
Another mechanism that could help to explain the greater FD-
induced decrease in type 2X and 2B fiber CSA is fiber-type
dependent differences in the expression of PGC1a. Recent
evidence has shown that more oxidative fiber types have higher
levels of PGC1a expression than glycolytic fiber types [29–31],
and that PGC1a may inhibit the expression of atrophy related
genes [32]. Thus, lower levels of PGC1a expression in type 2X
and 2B fibers [29–31] may leave these fiber types more susceptible
to FD-induced atrophy. Finally, the smaller decrease in protein
synthesis and absence of FD-induced atrophy in type 1 and 2A
fibers could also be related to their more frequent use during
ambulation. For example, motor units containing type 1 and 2A
fibers are, in general, activated more frequently than motor units
composed of type 2X and 2B fibers [33,34]. Hence, the more
frequent contractile activity in type 1 and 2A may have attenuated
the FD-induced changes in protein synthesis and protein
degradation and, in turn, promoted a greater resistance to changes
in CSA [35].
In summary, relatively short-term FD induces fiber type-
dependent changes in S6 Ser240/244 phosphorylation, total S6
protein, protein synthesis and fiber CSA. These fiber type-
dependent responses are likely due to a combination of the
intrinsic fiber type-dependent differences in the molecular
mechanisms that regulate protein synthesis and degradation, as
well as, fiber type-dependent use patterns. Nevertheless, further
work will be needed to define the exact molecular mechanism(s)
responsible for these fiber-type dependent responses.
Fiber Type-Dependent Differences in the BasalExpression of Total Ribosomal S6 Protein and in S6Ser240/244 PhosphorylationIn the process of investigating the effect of FD on translational
capacity we noticed that sections from Ad Lib muscle had
significant inter-fiber differences in the amount of the ribosomal
S6 protein. This observation suggested that the basal expression of
the ribosomal S6 protein may be fiber type-dependent. Indeed,
our results showed that the total S6 protein signal intensity varied
in the following order: 2B , 2X , 1 , 2A. These findings suggest
that translational capacity may vary in a fiber type-dependent
manner. This hypothesis is supported by the study of Habets et al
[36] which showed that rat single muscle fiber 28S rRNA,
a marker of ribosomal content, increased in the following order of
fiber type: 2B , 2X , 2A. Moreover, our total S6 results are
consistent with our previous finding that basal rates of protein
synthesis varies in a similar fiber type-dependent manner (i.e. type
2B , 2X , 2A < 1) [8]. Taken together, these data suggest that
basal rates of protein synthesis are correlated with ribosomal
content, and thus, translational capacity. We also found that the
fiber type-dependent pattern for S6 Ser240/244 phosphorylation
(2B< 2X, 2A, 1) was slightly different from that observed with
total S6. Specifically, the level of S6 Ser240/244 phosphorylation
was not different between type 2X and 2B fibers. Furthermore, S6
Figure 4. Synergist Ablation Induces Fiber Type-Dependent Changes in Ser240/244 Phosphorylated and Total Ribosomal S6 Protein.Plantaris muscles obtained from control (Sham) and 10 d synergist ablated (SA) mice were frozen adjacent to one another, cross-sectioned, and thensubjected to immunohistochemistry for different fiber types as described in Figure 2, and Ser240/244 phosphorylated S6 (P-S6 Ser240/244) or total S6. (A)Representative images of P-S6 Ser240/244 and (B) total S6. (C) The effect of SA on the relative amount of P-S6 Ser240/244 and (D) total S6, within eachfiber type. The bars in A and B indicate a length of 200 mm. All values are presented as the mean + SEM (n = 84–500 fibers / group from 6independent pairs of muscles).N Significant effect of SA within a given fiber type, significantly different from type 1, 2A and 2X fibers,# significantlydifferent from type 2A and 2X fibers, (P,0.05).doi:10.1371/journal.pone.0037890.g004
Fiber Type-Dependent Rates of Protein Synthesis
PLoS ONE | www.plosone.org 7 May 2012 | Volume 7 | Issue 5 | e37890

Figure 5. Cross-Sectional Area, Protein Synthesis, Ser240/244 Phosphorylated and Total Ribosomal S6 Protein in MHCEmb PositiveFibers. Plantaris muscles obtained from control (Sham) and 10 d synergist ablated (SA) mice were frozen adjacent to one another, cross-sectioned,and then subjected to immunohistochemistry for MHCEmb and rates of protein synthesis (puromycin), Ser240/244 phosphorylated S6 (P-S6 Ser240/244),or total S6, as described in Figures 2 and 4. (A) Representative image of the signals for puromycin (red) and MHCEmb (green). (B) Grayscale image ofthe puromycin signal shown in A. (C) Higher magnification image from a SA muscle that was tripled stained for puromycin (red), MHCEmb (green) andlaminin (blue). (D) Grayscale image of the puromycin signal shown in C. (E) The relative cross-sectional area (CSA), (F) rate of protein synthesis, (G)amount of P-S6 Ser240/244 and (H) total amount of S6 in MHCEmb positive fibers of SA muscles expressed relative to randomly selected fibers fromsham muscles (Mixed Sham). The bars in A and B indicate a length of 200 mm, and the bars in C and D indicate 50 mm in length. All values arepresented as the mean + SEM (n = 152–360 fibers / group from 6 independent pairs of muscles). Significantly different from mixed sham, (P,0.05).doi:10.1371/journal.pone.0037890.g005
Fiber Type-Dependent Rates of Protein Synthesis
PLoS ONE | www.plosone.org 8 May 2012 | Volume 7 | Issue 5 | e37890

Ser240/244 phosphorylation in type 1 fibers was higher than in type
2A fibers. Thus, it seems that, at least under basal conditions, rates
of protein synthesis are not as closely associated with this marker of
mTORC1 signaling, and presumably, translational efficiency.
Nevertheless, our data clearly reveals fiber type-dependent
differences in the basal levels of both total ribosomal S6 protein
and S6 Ser240/244 phosphorylation and further work will be
required to elucidate the molecular mechanisms responsible for
these findings.
Synergist AblationFiber type-dependent changes in protein synthesis, CSA, S6
Ser240/244 phosphorylation and total S6 protein were also
observed in response to SA. Specifically, SA resulted in
significantly larger increases in protein synthesis in type 1 and
2A fibers compared to type 2X and 2B fibers, with the increase in
type 2X fibers being intermediate to 2A and 2B fibers. Moreover,
this fiber type-dependent pattern of increases in protein synthesis
was largely mirrored by a similar pattern of fiber type-dependent
increases in fiber CSA. For example, type 2B fibers revealed the
smallest SA-induced increase in both protein synthesis and CSA,
while type 2A fibers had the largest increase in both these
parameters. One potential mechanism behind these observations
could be the result of differences in motor unit recruitment
patterns [33,34], with the type 1 and 2A fibers being recruited,
and thus mechanically overloaded, more frequently than the type
2X and 2B fibers.
Although the fiber type-dependent differences in protein
synthesis and fiber CSA seem to fit well with potential differences
in recruitment patterns, the SA-induced changes in total S6
protein and S6 Ser240/244 phosphorylation are not so congruent.
For example, despite having the smallest SA-induced increase in
protein synthesis, type 2B fibers had a 55–77% greater increase in
total S6 protein compared to the other three fiber types.
Furthermore, the SA-induced increase in S6 Ser240/244 phosphor-
ylation was not different between type 2A and 2X fibers, and type
1 fibers had a larger increase in S6 Ser240/244 phosphorylation
than type 2A fibers. These data suggest that the fiber type-specific
regulation of protein synthesis and CSA in response to mechanical
overload results from a complex combination of changes in
translational efficiency and capacity. Interestingly, the SA-induced
increase in Ser240/244 S6 phosphorylation, when expressed relative
to the increase in total S6 protein, was 5.7-, 4.4-, 4.4- and 1.8-fold
for type 1, 2A, 2X and 2B fibers, respectively. This suggests that,
compared to type 1, 2A and 2X fibers, the increase in Ser240/244
S6 phosphorylation in type 2B fibers was largely due to an increase
total S6 protein. This also suggests that, compared to type 1, 2A
and 2X fibers, the increase in protein synthesis in type 2B fibers
was driven to a greater extent by an increase in translational
capacity than translational efficiency. Moreover, the fact that there
was a relatively smaller increase in protein synthesis in type 2B
fibers (Fig. 2F), despite the larger increase in total S6 protein
compared to the other fiber types (, 2-fold), suggests that
increases in translational efficiency play a more dominant role in
determining the effect of SA on protein synthesis.
Apart from differences in motor unit recruitment, another
possible reason for the smaller SA-induced increase in protein
synthesis, CSA and Ser240/244 S6 phosphorylation in type 2B fibers
could be related to absolute fiber size. For example, in rodent
muscles, type 2B fibers are the largest of the four fiber types
(Fig. 2G) and their increase in size may be limited by factors such
as oxygen diffusion, or the requirement for an optimal myonuclei
to cytoplasm ratio [6]. Thus, despite the SA-induced increase in
total S6 protein, and presumably translational capacity, other
molecular mechanisms may have acted to limit the increase in
protein synthesis by restricting translational efficiency. One such
mechanism could be a fiber type-dependent increase in the
activation AMPK, a known inhibitor of mTORC1 signaling and
protein synthesis [37]. Indeed, previous studies have shown that
SA induces the activation of AMPK activity [38] and that intense
exercise induces AMPK a-subunit Thr172 phosphorylation to
a greater extent in type 2X fibers than in type 1 and 2A fibers [39].
Although the exact mechanism for enhanced AMPK activation in
the faster fiber types remains to be determined, it could in part be
mediated by limited oxygen diffusion and greater metabolic stress
due to the lower capillary densities and blood flow in these fibers
[40]. A limitation in oxygen diffusion could also induce the
expression of HIF-1a and REDD1 which are also known
inhibitors of mTORC1 signaling [41,42]. In summary, our results
demonstrate that SA induces fiber type-dependent increases in
total S6 protein, S6 Ser240/244 phosphorylation, protein synthesis
and fiber CSA. As with FD, the SA induced changes are likely due
to complex array of factors and additional studies will be needed to
define the molecular mechanisms that are responsible for these
fiber type-dependent effects.
MHCEmb Positive Fibers in Synergist Ablated MusclePreviously we have shown that SA induces an increase in the
total number of muscle fibers and this effect is matched by
a proportional increase in the number of fibers that express the
MHCEmb isoform [16]. Based on these findings we, and others,
have interpreted these observations as evidence for SA-induced
muscle fiber hyperplasia [16,43]. In the current study, we again
identified a population of MHCEmb positive fibers in SA muscles,
and using the in vivo SUnSET technique, we were able to measure
the relative rate of protein synthesis in these fibers. Specifically, the
MHCEmb positive fibers in SA muscles had rates of protein
synthesis that were 3.6-fold greater than that observed in sham
muscle fibers. The greater rates of protein synthesis were also
associated with a 2.9-fold greater amount of total S6 protein and
a 6.1-fold greater amount of S6 Ser240/244 phosphorylation.
Combined, our results suggest that SA induces new fiber
formation and that these fibers possess a robust activation of
mTORC1 signaling, translational efficiency, translational capacity
and protein synthesis. Furthermore, we have reported that 30–
40% of the total fibers in 14 day SA muscles are MHCEmb positive
[16], thus, these fibers are likely to account for a significant
proportion of the increase in total S6 protein, S6 Ser240/244
phosphorylation and protein synthesis that is observed at the
whole muscle level. Taken together, these results provided a clear
and striking example of fiber type-dependent differences in protein
synthesis that may not be evident if analyses are performed at the
whole muscle level.
ConclusionIn summary, this study has demonstrated the existence of fiber
type-dependent changes in protein synthesis in fibers found within
the same whole muscle. In addition, fiber type-dependent changes
in CSA, total S6 protein and S6 Ser240/244 phosphorylation, were
also observed in response to FD and SA. Furthermore, for the first
time, we were also able to measure the relative rate of protein
synthesis in putative newly formed MHCEmb positive fibers that
are found in SA muscles. Combined, this study highlights that the
in vivo SUnSET methodology can be used for investigating fiber
type-specific responses in protein synthesis to a variety of
physiological stressors, or to potential therapies designed to treat
various skeletal muscle pathologies. Moreover, our findings
illustrate that changes found at the whole muscle level may not
Fiber Type-Dependent Rates of Protein Synthesis
PLoS ONE | www.plosone.org 9 May 2012 | Volume 7 | Issue 5 | e37890

accurately reflect the changes that occur within the individual
muscle fiber types.
Supporting Information
Figure S1 Food Deprivation Induces Fiber Type-De-pendent Changes in Protein Synthesis and Cross-Sectional Area. Plantaris muscles obtained from control (Ad
Lib) and 48 h food deprived (FD) mice were frozen adjacent to
one another, cross-sectioned, and then subjected to immunohis-
tochemistry for rates of protein synthesis (puromycin) and different
fiber types as described in Figure 1. (A–H) Frequency histograms
representing the effect of FD on the relative rate of protein
synthesis (i.e. puromycin staining intensity) (A, C, E, G), and
cross-sectional area (B, D, F, H), within a given fiber type. Inset
values are presented as the mean 6 SEM (n =60–250 fibers /
group from 5 independent pairs of muscles). * Significant effect of
FD, (P,0.05).
(TIF)
Figure S2 Synergist Ablation Induces Fiber Type-De-pendent Changes in Protein Synthesis and Cross-Sectional Area. Plantaris muscles obtained from control (Sham)
and 10 d synergist ablated (SA) mice were frozen adjacent to one
another, cross-sectioned, and then subjected to immunohisto-
chemistry for rates of protein synthesis (puromycin) and different
fiber types as described in Figure 2. (A–H) Frequency histograms
representing the effect of SA on the relative rate of protein
synthesis (i.e. puromycin staining intensity) (A, C, E, G), and
cross-sectional area (B, D, F, H), within a given fiber type. Inset
values are presented as the mean 6 SEM (n =84–500 fibers /
group from 6 independent pairs of muscles). * Significant effect of
SA, (P,0.05).
(TIF)
Figure S3 Fiber Type-Dependent Differences in BasalSer240/244 Phosphorylated and Total Ribosomal S6 Pro-tein. Muscle sections from Ad Lib mice were subjected to
immunohistochemistry for different fiber types and Ser240/244
phosphorylated S6 (P-S6 Ser240/244) or total S6, as described in
Figure 3. (A) P-S6 Ser240/244 and (B) total S6 in each fiber type was
expressed relative to the mean value obtained in type 2A fibers
from the same section. Values are means + SEM (n =59–
300 fibers / group from 4–5 independent muscles). significantly
different from all other fiber types, # significantly different from
type 1 and 2A fibers (P.0.05).
(TIF)
Figure S4 Food Deprivation Induces Fiber Type-De-pendent Changes in Ser240/244 Phosphorylated and TotalRibosomal S6 Protein. Plantaris muscles obtained from control
(Ad Lib) and 48 h food deprived (FD) mice were frozen adjacent to
one another, cross-sectioned, and then subjected to immunohis-
tochemistry for different fiber types and Ser240/244 phosphorylated
S6, or total S6, as described in Figure 3. (A–H) Frequency
histograms representing the effect of FD on the relative staining
intensity of Ser240/244 phosphorylated S6 (P-S6 Ser240/244) (A, C,E, G), and total S6 (B, D, F, H), within a given fiber type. Inset
values are presented as the mean 6 SEM (n = 60–250 fibers /
group from 5 independent pairs of muscles). * Significant effect of
FD, (P,0.05).
(TIF)
Figure S5 Synergist Ablation Induces Fiber Type-De-pendent Changes in Ser240/244 Phosphorylated and TotalRibosomal S6 Protein. Plantaris muscles obtained from control
(Sham) and 10 d synergist ablated (SA) mice were frozen adjacent
to one another, cross-sectioned, and then subjected to immuno-
histochemistry for different fiber types and Ser240/244 phosphor-
ylated S6, or total S6, as described in Figure 4. (A–H) Frequency
histograms representing the effect of SA on the relative staining
intensity of Ser240/244 phosphorylated S6 (P-S6 Ser240/244) (A, C,E, G), and total S6 (B, D, F, H), within a given fiber type. Inset
values are presented as the mean 6 SEM (n = 84–500 fibers /
group from 6 independent pairs of muscles). * Significant effect of
SA, (P,0.05).
(TIF)
Figure S6 Cross-Sectional Area, Protein Synthesis,Ser240/244 Phosphorylated and Total Ribosomal S6 Pro-tein in MHCEmb Positive Fibers. Plantaris muscles obtained
from control (Sham) and 10 d synergist ablated (SA) mice were
frozen adjacent to one another, cross-sectioned, and then
subjected to immunohistochemistry for MHCEmb and rates of
protein synthesis (puromycin), Ser240/244 phosphorylated S6 (P-S6
Ser240/244), or total S6, as described in Figures 2 and 4. Frequency
histograms of the (A) fiber cross-sectional area (CSA), (B) rate of
protein synthesis, (C) amount of Ser240/244 phosphorylated S6 (P-
S6 Ser240/244) and (D) total amount of S6 in MHCEmb positive
fibers of SA muscles expressed relative to randomly selected fibers
from sham muscles (Mixed Sham). Inset values are presented as
the mean 6 SEM (n = 152–360 fibers / group from 6
independent pairs of muscles). Significantly different from mixed
sham, (P,0.05).
(TIF)
Acknowledgments
The type 1, 2a, and 2b MHC monoclonal antibodies developed by S.
Schiaffino, the type 2x MHC monoclonal antibody developed by C. Lucas,
and the embryonic MHC antibody developed by H. Blau, were obtained
from the Developmental Studies Hybridoma Bank developed under the
auspices of the Eunice Kennedy Shriver National Institute of Child Health
and Human Development and maintained by the University of Iowa
Department of Biology (Ames, IA, USA).
Author Contributions
Conceived and designed the experiments: CAG TAH. Performed the
experiments: CAG JAK BLJ TAH. Analyzed the data: CAG JAK BLJ
TAH. Contributed reagents/materials/analysis tools: TAH. Wrote the
paper: CAG TAH.
References
1. Pette D, Staron RS (1997) Mammalian skeletal muscle fiber type transitions. Int
Rev Cytol 170: 143–223.
2. Talmadge RJ (2000) Myosin heavy chain isoform expression following reduced
neuromuscular activity: potential regulatory mechanisms. Muscle Nerve 23:
661–679.
3. Bottinelli R, Reggiani C (2000) Human skeletal muscle fibres: molecular and
functional diversity. Prog Biophys Mol Biol 73: 195–262.
4. Stephenson GM (2001) Hybrid skeletal muscle fibres: a rare or common
phenomenon? Clin Exp Pharmacol Physiol 28: 692–702.
5. Schiaffino S, Reggiani C (2011) Fiber Types in Mammalian Skeletal Muscles.
Physiol Rev 91: 1447–1531.
6. van Wessel T, de Haan A, van der Laarse W, Jaspers R (2010) The muscle fiber
type–fiber size paradox: hypertrophy or oxidative metabolism? Eur J Appl
Physiol 110: 665–694.
7. Schmidt EK, Clavarino G, Ceppi M, Pierre P (2009) SUnSET, a nonradioactive
method to monitor protein synthesis. Nat Meth 6: 275–277.
8. Goodman CA, Mabrey DM, Frey JW, Miu MH, Schmidt EK, et al. (2011)
Novel insights into the regulation of skeletal muscle protein synthesis as revealed
by a new nonradioactive in vivo technique. FASEB J 25: 1028–1039.
Fiber Type-Dependent Rates of Protein Synthesis
PLoS ONE | www.plosone.org 10 May 2012 | Volume 7 | Issue 5 | e37890
9. Nakano K, Hara H (1979) Measurement of the protein-synthetic activity in vivo
of various tissues in rats by using [3H]Puromycin. Biochem J 184: 663–668.10. Mittendorfer B, Andersen JL, Plomgaard P, Saltin B, Babraj JA, et al. (2005)
Protein synthesis rates in human muscles: neither anatomical location nor fibre-
type composition are major determinants. J Physiol 563: 203–211.11. Li JB, Goldberg AL (1976) Effects of food deprivation on protein synthesis and
degradation in rat skeletal muscles. Am J Physiol 231: 441–448.12. Preedy VR, Peters TJ (1988) The effect of chronic ethanol ingestion on protein
metabolism in type-I- and type-II-fibre-rich skeletal muscles of the rat. Biochem J
254: 631–639.13. Baillie AG, Garlick PJ (1991) Responses of protein synthesis in different skeletal
muscles to fasting and insulin in rats. Am J Physiol - Endocrinol And Metab 260:E891–E896.
14. Fang CH, James HJ, Ogle C, Fischer JE, Hasselgren PO (1995) Influence ofburn injury on protein metabolism in different types of skeletal muscle and the
role of glucocorticoids. J Am Coll Surg 180: 33–42.
15. Savary I, Debras E, Dardevet D, Sornet C, Capitan P, et al. (1998) Effect ofglucocorticoid excess on skeletal muscle and heart protein synthesis in adult and
old rats. Br J Nutr 79: 297–304.16. Goodman CA, Frey JW, Mabrey DM, Jacobs BL, Lincoln HC, et al. (2011) The
role of skeletal muscle mTOR in the regulation of mechanical load-induced
growth. J Physiol 589: 5485–5501.17. Goodman CA, Miu MH, Frey JW, Mabrey DM, Lincoln HC, et al. (2010) A
Phosphatidylinositol 3-Kinase/Protein Kinase B-independent Activation ofMammalian Target of Rapamycin Signaling Is Sufficient to Induce Skeletal
Muscle Hypertrophy. Mol Biol Cell 21: 3258–3268.18. Goldberg AL (1968) Protein Synthesis During Work-Induced Growth of Skeletal
Muscle. J Cell Biol 36: 653–658.
19. Oded M, Kwang WJ (2008) Physiological Roles of Ribosomal Protein S6: Oneof Its Kind. Int Rev Cell Mol Biol: Academic Press. pp 1–37.
20. Pende M, Um SH, Mieulet V, Sticker M, Goss VL, et al. (2004) S6K1-/-/S6K2-/- Mice Exhibit Perinatal Lethality and Rapamycin-Sensitive 59-Terminal
Oligopyrimidine mRNA Translation and Reveal a Mitogen-Activated Protein
Kinase-Dependent S6 Kinase Pathway. Mol Cell Biol 24: 3112–3124.21. Lee-Fruman KK, Kuo CJ, Lippincott J, Terada N, Blenis J (1999)
Characterization of S6K2, a novel kinase homologous to S6K1. Oncogene18: 5108–5114.
22. Mahoney SJ, Dempsey JM, Blenis J (2009) Cell Signaling in Protein SynthesisRibosome Biogenesis and Translation Initiation and Elongation. Prog Mol Biol
Transl Sci 90C: 53–107.
23. Harmon CS, Proud CG, Pain VM (1984) Effects of starvation, diabetes andacute insulin treatment on the regulation of polypeptide-chain initiation in rat
skeletal muscle. Biochem J 223: 687–696.24. Millward DJ, Garlick PJ, Nnanyelugo DO, Waterlow JC (1976) The relative
importance of muscle protein synthesis and breakdown in the regulation of
muscle mass. Biochem J 156: 185–188.25. Allen DL, Cleary AS, Lindsay SF, Loh AS, Reed JM (2010) Myostatin
expression is increased by food deprivation in a muscle-specific manner andcontributes to muscle atrophy during prolonged food deprivation in mice. J Appl
Physiol 109: 692–701.26. Lagirand-Cantaloube J, Offner N, Csibi A, Leibovitch MP, Batonnet-Pichon S,
et al. (2008) The initiation factor eIF3-f is a major target for Atrogin1/MAFbx
function in skeletal muscle atrophy. Embo J 27: 1266–1276.
27. Csibi A, Cornille K, Leibovitch M-P, Poupon A, Tintignac LA, et al. (2010) The
Translation Regulatory Subunit eIF3f Controls the Kinase-Dependent mTOR
Signaling Required for Muscle Differentiation and Hypertrophy in Mouse.
PLoS ONE 5: e8994.
28. Lokireddy S, McFarlane C, Ge X, Zhang H, Sze SK, et al. (2011) Myostatin
Induces Degradation of Sarcomeric Proteins through a Smad3 Signaling
Mechanism During Skeletal Muscle Wasting. Mol Endocrinol 25: 1936–1949.
29. Lin J, Wu H, Tarr PT, Zhang C-Y, Wu Z, et al. (2002) Transcriptional co-
activator PGC-1[alpha] drives the formation of slow-twitch muscle fibres.
Nature 418: 797–801.
30. Russell AP, Feilchenfeldt J, Schreiber S, Praz M, Crettenand A, et al. (2003)
Endurance Training in Humans Leads to Fiber Type-Specific Increases in
Levels of Peroxisome Proliferator-Activated Receptor-g Coactivator-1 and
Peroxisome Proliferator-Activated Receptor-a in Skeletal Muscle. Diabetes 52:
2874–2881.
31. Kramer DK, Ahlsen M, Norrbom J, Jansson E, Hjeltnes N, et al. (2006) Human
skeletal muscle fibre type variations correlate with PPARa, PPARd; and PGC-1a
mRNA. Acta Physiol 188: 207–216.
32. Sandri M, Lin J, Handschin C, Yang W, Arany ZP, et al. (2006) PGC-1a
protects skeletal muscle from atrophy by suppressing FoxO3 action and atrophy-
specific gene transcription. Proc Natl Acad Sci USA 103: 16260–16265.
33. Henneman E, Mendell LM (1981) Functional organization of motoneuron pool
and its inputs. In: Brookhart JM, Mountcastle VB, eds. Handbook of Physiology:
The Nervous System. Bethesda: American Physiological Society. pp 423–507.
34. Armstrong RB, Laughlin MH (1985) Metabolic indicators of fibre recruitment in
mammalian muscles during locomotion. J Exp Biol 115: 201–213.
35. Goldberg AL, Goodman HM (1969) Relationship between cortisone and muscle
work in determining muscle size. J Physiol 200: 667–675.
36. Habets PE, Franco D, Ruijter JM, Sargeant AJ, Pereira JA, et al. (1999) RNA
content differs in slow and fast muscle fibers: implications for interpretation of
changes in muscle gene expression. J Histochem Cytochem 47: 995–1004.
37. Goodman CA, Mayhew DL, Hornberger TA (2011) Recent Progress towards
Understanding the Molecular Mechanisms that Regulate Skeletal Muscle Mass.
Cell Signal 23: 1896–1906.
38. McGee SL, Mustard KJ, Hardie DG, Baar K (2008) Normal hypertrophy
accompanied by phosphoryation and activation of AMP-activated protein kinase
a1 following overload in LKB1 knockout mice. J Physiol 586: 1731–1741.
39. Lee-Young RS, Canny BJ, Myers DE, McConell GK (2009) AMPK activation is
fiber type specific in human skeletal muscle: effects of exercise and short-term
exercise training. Journal of Applied Physiology 107: 283–289.
40. McAllister RM, Amann JF, Laughlin MH (1993) Skeletal muscle fiber types and
their vascular support. J Reconstr Microsurg 9: 313–317.
41. Ellisen LW (2005) Growth control under stress: mTOR regulation through the
REDD1-TSC pathway. Cell Cycle 4: 1500–1502.
42. Favier FB, Costes F, Defour A, Bonnefoy R, Lefai E, et al. (2010)
Downregulation of Akt/mammalian target of rapamycin pathway in skeletal
muscle is associated with increased REDD1 expression in response to chronic
hypoxia. Am J Physiol Regul Integr Comp Physiol 298: R1659–1666.
43. McCarthy JJ, Mula J, Miyazaki M, Erfani R, Garrison K, et al. (2011) Effective
fiber hypertrophy in satellite cell-depleted skeletal muscle. Development 138:
3657–3666.
Fiber Type-Dependent Rates of Protein Synthesis
PLoS ONE | www.plosone.org 11 May 2012 | Volume 7 | Issue 5 | e37890