musa acuminata (wild banana)agritrop.cirad.fr/589366/7/589366.pdfthree new genome assemblies support...
TRANSCRIPT

Three New Genome Assemblies Support a Rapid Radiation in
Musa acuminata (Wild Banana)
Mathieu Rouard1 Gaetan Droc23 Guillaume Martin23 Julie Sardos1 Yann Hueber1 Valentin Guignon1Alberto Cenci1 Bjorn Geigle4 Mark S Hibbins56 Nabila Yahiaoui23 Franc-Christophe Baurens23Vincent Berry7 Matthew W Hahn56 Angelique DrsquoHont23 and Nicolas Roux1
1Bioversity International Parc Scientifique Agropolis II Montpellier France2CIRAD UMR AGAP Montpellier France3AGAP Univ Montpellier CIRAD INRA Montpellier SupAgro France4Computomics GmbH Tuebingen Germany5Department of Biology Indiana University6Department of Computer Science Indiana University7LIRMM Universite de Montpellier CNRS Montpellier France
Corresponding author E-mail mrouardcgiarorg
Accepted October 10 2018
Data deposition Raw sequence reads for de novo assemblies were deposited in the Sequence Read Archive (SRA) of the National Center for
Biotechnology Information (NCBI) (BioProject PRJNA437930 and SRA SRP140622) Genome Assemblies and gene annotation data are available
on the Banana Genome Hub (Droc G Lariviere D Guignon V Yahiaoui N This D Garsmeur O Dereeper A Hamelin C Argout X Dufayard J-F
Lengelle J Baurens FndashC Cenci A Pitollat B DrsquoHont A Ruiz M Rouard M Bocs S The Banana Genome Hub Database (2013) doi101093
databasebat035) (httpbanana-genome-hubsouthgreenfrspecies-list) Cluster and gene tree results are available on a dedicated database
(httppanmusagreenphylorg) hosted on the South Green Bioinformatics Platform (Guignon et al 2016) Additional data sets are made available
on Dataverse httpsdoiorg107910DVNIFI1QU
Abstract
Ediblebananas result from interspecifichybridizationbetweenMusa acuminata and Musa balbisiana aswell as amongsubspecies in
M acuminata Four particular M acuminata subspecies have been proposed as the main contributors of edible bananas all of which
radiated ina shortperiodof time in southeasternAsia Clarifying theevolutionof these lineagesat awhole-genomescale is therefore
an important step toward understanding the domestication and diversification of this crop This study reports the de novo genome
assembly and gene annotation of a representative genotype from three different subspecies of M acuminata These data are
combined with the previously published genome of the fourth subspecies to investigate phylogenetic relationships Analyses of
shared and unique gene families reveal that the four subspecies are quite homogenous with a core genome representing at least
50 of all genes and very few M acuminata species-specific gene families Multiple alignments indicate high sequence identity
between homologous single copy-genes supporting the close relationships of these lineages Interestingly phylogenomic analyses
demonstrate high levels of gene tree discordance due to both incomplete lineage sorting and introgression This pattern suggests
rapid radiationwithinMusaacuminata subspecies thatoccurredafter thedivergencewithMbalbisiana IntrogressionbetweenMa
ssp malaccensis and M a ssp burmannica was detected across the genome though multiple approaches to resolve the subspecies
tree converged on the same topology To support evolutionary and functional analyses we introduce the PanMusa database which
enables researchers to exploration of individual gene families and trees
Key words banana Musa ssp incomplete lineage sorting phylogenomics genome assembly
Introduction
Bananas are among the most important staple crops culti-
vated worldwide in both the tropics and subtropics The
wild ancestors of bananas are native to the Malesian Region
(including Malaysia and Indonesia) (Simmonds 1962) or to
northern Indo-Burma (southwest China) Dating back to the
The Author(s) 2018 Published by Oxford University Press on behalf of the Society for Molecular Biology and Evolution
This is an Open Access article distributed under the terms of the Creative Commons Attribution Non-Commercial License (httpcreativecommonsorglicensesby-nc40) which permits
non-commercial re-use distribution and reproduction in any medium provided the original work is properly cited For commercial re-use please contact journalspermissionsoupcom
Genome Biol Evol 10(12)3129ndash3140 doi101093gbeevy227 Advance Access publication October 13 2018 3129
GBED
ownloaded from
httpsacademicoupcom
gbearticle-abstract101231295129088 by Universiteeacute Feacutedeacuterale Toulouse M
idi-Pyreacuteneacutees - SICD
user on 06 Decem
ber 2018
early Eocene (Janssens et al 2016) the genus Musa currently
comprises 60ndash70 species divided into two sections Musa and
Callimusa (Heuroakkinen 2013) Most of modern cultivated ba-
nanas originated from natural hybridization between two spe-
cies from the section Musa Musa acuminata which occurs
throughout the whole southeast Asia region and Musa bal-
bisiana which is constrained to an area going from east India
to south China (Simmonds and Shepherd 1955) While no
subspecies have been defined so far in M balbisiana M
acuminata is further divided into multiple subspecies among
which at least four have been identified as contributors to the
cultivated banana varieties namely banksii zebrina bur-
mannica and malaccensis (reviewed in Perrier et al 2011)
These subspecies can be found in geographical areas that are
mostly nonoverlapping Musa acuminata ssp banksii is en-
demic to New Guinea Musa a ssp zebrina is found in
Indonesia (Java island) M a ssp malaccensis originally
came from the Malay Peninsula (De Langhe et al 2009
Perrier et al 2011) while M a ssp burmannica is from
Burma (todayrsquos Myanmar) (Cheesman 1948)
While there are many morphological characters that differ-
entiate M acuminata from M balbisiana the subspecies of
M acuminata have only a few morphological differences be-
tween them For instance M a ssp burmannica is distin-
guished by its yellowish and waxless foliage light brown
markings on the pseudostem and by its compact pendulous
bunch and strongly imbricated purple bracts Musa a ssp
banksii exhibits slightly waxy leaf predominantly brown-
blackish pseudostems large bunches with splayed fruits
and nonimbricated yellow bracts Musa a ssp malaccensis
is strongly waxy with a horizontal bunch and bright red non-
imbricated bracts while M a ssp zebrina is characterized by
dark red patches on its dark green leaves (Simmonds 1956)
Previous studies based on a limited number of markers
have been able to shed some light on the relationships among
M acuminata subspecies (Sardos et al 2016 Christelova et al
2017) Phylogenetic studies have been assisted by the avail-
ability of the reference genome sequence for a representative
of M acuminata ssp malaccensis (DrsquoHont et al 2012 Martin
et al 2016) and a draft M balbisiana genome sequence
(Davey et al 2013) However the availability of large genomic
data sets from multiple (sub)species are expected to improve
the resolution of phylogenetic analyses and thus to provide
additional insights on species evolution and their specific traits
(Bravo et al 2018) This is especially true in groups where
different segments of the genome have different evolutionary
histories as has been found in Musaceae (Christelova et al
2011) Whole-genome analyses also make it much easier to
distinguish among the possible causes of gene tree heteroge-
neity especially incomplete lineage sorting (ILS) and hybridi-
zation (Folk et al 2018)
Moreover the availability of multiple reference genome
sequences opens the way to so-called pangenome analyses
a concept coined by Tettelin et al (2005) The pangenome is
defined as the set of all gene families found among a set of
phylogenetic lineages It includes 1) the core genome which
is the pool of genes common to all lineages 2) the accessory
genome composed of genes absent in some lineages and 3)
the species-specific or individual-specific genome formed by
genes that are present in only a single lineage Identifying
specific compartments of the pangenome (such as the acces-
sory genome) offers a way to detect important genetic differ-
ences that underlie molecular diversity and phenotypic
variation (Morgante et al 2007)
Here we generated three de novo genomes for the sub-
species banksii zebrina and burmannica and combined these
with existing genomes for M acuminata ssp malaccensis
(DrsquoHont et al 2012) and M balbisiana (Davey et al 2013)
We thus analyzed the whole genome sequences of five extant
genotypes comprising the four cultivated bananasrsquo contribu-
tors from M acuminata that is the reference genome ldquoDH
Pahangrdquo belonging to M acuminata ssp malaccensis
ldquoBanksiirdquo from M acuminata ssp banksii ldquoMaia Oardquo belong-
ing to M acuminata ssp zebrina and ldquoCalcutta 4rdquo from
M acuminata ssp burmannica as well as M balbisiana
(ie ldquoPisang Klutuk Wulungrdquo or PKW) We carried out phy-
logenomic analyses that provided evolutionary insights into
both the relationships and genomic changes among lineages
in this clade Finally we developed a banana species-specific
database to support the larger community interested in crop
improvement
Materials and Methods
Plant Material
Banana leaf samples from accessions ldquoBanksiirdquo (Musa acumi-
nata ssp banksii PT-BA-00024) ldquoMaia Oardquo (Musa acuminata
ssp zebrina PT-BA-00182) and ldquoCalcutta 4rdquo (Musa acumi-
nata ssp burmannica PT-BA-00051) were supplied by the
CRB-Plantes Tropicales Antilles CIRAD-INRA field collection
based in Guadeloupe Leaves were used for DNA extraction
Plant identity was verified at the subspecies level using SSR
markers at the Musa Genotyping Centre (MGC Czech
Republic) as described in (Christelova et al 2011) and passport
data of the plant is accessible in the Musa Germplasm
Information System (Ruas et al 2017) In addition the repre-
sentativeness of the genotypes of the four subspecies was
verified on a set of 22 samples belonging to the same four
M acuminata subspecies of the study (supplementary fig 3
Supplementary Material online)
Sequencing and Assembly
Genomic DNA was extracted using a modified MATAB
method (Risterucci et al 2000) DNA libraries were con-
structed and sequenced using the HiSeq2000 (Illumina) tech-
nology at BGI (supplementary table 1 Supplementary
Material online) ldquoBanksiirdquo was assembled using
Rouard et al GBE
3130 Genome Biol Evol 10(12)3129ndash3140 doi101093gbeevy227 Advance Access publication October 13 2018
Dow
nloaded from httpsacadem
icoupcomgbearticle-abstract101231295129088 by U
niversiteeacute Feacutedeacuterale Toulouse Midi-Pyreacuteneacutees - SIC
D user on 06 D
ecember 2018
SoapDenovo (Luo et al 2012) and PBJelly2 (English et al
2012) was used for gap closing using PacBio data generated
at the Norwegian Sequencing Center (NSC) with Pacific
Biosciences RS II ldquoMaia Oardquo and ldquoCalcutta 4rdquo were assem-
bled using the MaSuRCA assembler (Zimin et al 2013) (sup-
plementary table 2 Supplementary Material online)
Estimation of genome assembly completeness was assessed
with BUSCO plant (Sim~ao et al 2015) (supplementary table 3
Supplementary Material online)
Gene Annotation
Gene annotation was performed on the obtained de novo
assembly for ldquoBanksiirdquo ldquoMaia Oardquo and ldquoCalcutta 4rdquo as
well as on the draft Musa balbisiana ldquoPKWrdquo assembly
(Davey et al 2013) for consistency and because the published
annotation was assessed as low quality For structural anno-
tation we used EuGene v42 (httpeugenetoulouseinrafr)
(Foissac et al 2008) calibrated on M acuminata malaccensis
ldquoDH Pahangrdquo reference genome v2 which produced similar
results (eg number of genes no missed loci good specific-
ity and sensitivity) as the official annotation (Martin et al
2016) EuGene combined genotype-specific (or closely re-
lated) transcriptome assemblies performed with Trinity v24
with RNAseq data sets (Sarah et al 2017) to maximize the
likelihood to have genotype-specific gene annotation (supple-
mentary table 4 Supplementary Material online) The estima-
tion of gene space completeness was assessed with Busco
(supplementary table 3 Supplementary Material online)
Because of its high quality and to avoid confusing the com-
munity we did not perform a new annotation for the M a
malaccensis ldquoDH Pahangrdquo reference genome but used the
released version 2 Finally the functional annotation of plant
genomes was performed by assigning their associated generic
GO terms through the Blast2GO program (Conesa et al
2005) combining BLAST results from UniProt (E-value 1e-5)
(Magrane and UniProt Consortium 2011)
Gene Families
Gene families were identified using OrthoFinder v114 (Emms
and Kelly 2015) with default parameters based on BLASTp (e-
value 1e-5) Venn diagrams were made using JVenn online
(httpjvenntoulouseinrafr) (Bardou et al 2014) and alter-
nate visualization was produced with UpsetR (httpsgehlen-
borglabshinyappsioupsetr) (Lex et al 2014)
Tree Topology from Literature
A species tree was initially identified based on previous studies
(Janssens et al 2016 Sardos et al 2016) Those two studies
included all M acuminata subspecies and had the same tree
topology (supplementary fig 1 Supplementary Material on-
line) In the first study Sardos et al (2016) computed a
Neighbor-Joining tree from a dissimilarity matrix using biallelic
GBS-derived SNP markers along the 11 chromosomes of the
Musa reference genome Several representatives of each sub-
species that comprised genebank accessions related to the
genotypes used here were included (Sardos et al 2016)
We annotated the tree to highlight the branches relevant to
M acuminata subspecies (supplementary fig 2
Supplementary Material online) In the second study a max-
imum clade credibility tree of Musaceae was proposed based
on four gene markers (rps16 atpB-rbcL trnL-F and internal
transcribed spacer ITS) analyzed with Bayesian methods
(Janssens et al 2016)
Genome-Scale Phylogenetic Analyses and Species Tree
Single-copy OGs (ie orthogroups with one copy of a gene in
each of the five genotypes) from protein coding DNA se-
quence (CDS) and genes (including introns and UTRs) were
aligned with MAFFT v7271 (Katoh and Standley 2013) and
gene trees were constructed using PhyML v31 (Guindon et al
2009) with ALrT branch support All trees were rooted using
Musa balbisiana as outgroup using Newick utilities v16
(Junier and Zdobnov 2010) Individual gene tree topologies
were visualized as a cloudogram with DensiTree v225
(Bouckaert 2010)
Single-copy OGs were further investigated with the quartet
method implemented in ASTRAL v556 (Mirarab and
Warnow 2015 Zhang et al 2018) In parallel we carried
out a Supertree approach following the SSIMUL procedure
(httpwwwatgc-montpellierfrssimul) (Scornavacca et al
2011) combined with PhySIC_IST (httpwwwatgc-montpel-
lierfrphysic_ist) (Scornavacca et al 2008) applied to a set of
rooted trees corresponding to core OGs (including single and
multiple copies) and accessory genes for which only one rep-
resentative species was missing (except outgroup species)
Finally single-copy OGs (CDS only) were used to generate a
concatenated genome-scale alignment with FASconCAT-G
(Kuck and Longo 2014) and a tree was constructed using
PhyML (NNI HKY85 100 bootstrap)
Search for Introgression
Ancient gene flow was assessed with the ABBA-BABA test or
D-statistic (Green et al 2010 Durand et al 2011) and com-
puted on the concatenated multiple alignment converted to
the MVF format and processed with MVFtools (Pease and
Rosenzweig 2018) similar to what is described in Wu et al
(2017) (httpsgithubcomwum5JaltPhylo) The direction of
introgression was further assessed with the D2 test (Hibbins
and Hahn 2018) The D2 statistic captures differences in the
heights of genealogies produced by introgression occurring in
alternate directions by measuring the average divergence be-
tween species A and C in gene trees with an ((A B) C) to-
pology (denoted [dACjA B]) and subtracting the average AndashC
divergence in gene trees with a ((B C) A) topology (denoted
[dACjB C]) so that D2 frac14 (dACjA B)(dACjB C) If the statistic
Three New Genome Assemblies GBE
Genome Biol Evol 10(12)3129ndash3140 doi101093gbeevy227 Advance Access publication October 13 2018 3131
Dow
nloaded from httpsacadem
icoupcomgbearticle-abstract101231295129088 by U
niversiteeacute Feacutedeacuterale Toulouse Midi-Pyreacuteneacutees - SIC
D user on 06 D
ecember 2018
is significantly positive it means that introgression has either
occurred in the BC direction or in both directions D2 sig-
nificance was assessed by permuting labels on gene trees
1000 times and calculating p values from the resulting null
distribution of D2 values The test was implemented with a
Perl script using distmat from EMBOSS (Rice et al 2000) with
TajimandashNei distance applied to multiple alignments associated
with gene trees fitting the defined topologies above (https
githubcommrouardperl-script-utils)
Results
Assemblies and Gene Annotation
We generated three de novo assemblies belonging to M
acuminata ssp banksii M a ssp zebrina and M a ssp
burmannica The M a ssp zebrina and M a ssp burmannica
assemblies contained 56481 and 47753 scaffolds (N50 scaf-
fold of 37689 and 22183 bp) totaling 623 Mb and 526 Mb
respectively The M a ssp banksii assembly which benefited
from long-read sequencing contained 9467 scaffolds (N50
scaffold of 435833 bp) for a total of 464 Mb (782 of the
genome) (supplementary tables 1 and 2 Supplementary
Material online)
The number of predicted protein coding genes per ge-
nome within different genomes of Musa ranges from
32692 to 45069 (supplementary table 3 Supplementary
Material online) Gene number was similar for M a ssp mal-
accensis ldquoDH Pahangrdquo M balbisiana ldquoPKWrdquo and M a ssp
banksii ldquoBanksiirdquo but higher in M a ssp zebrina ldquoMaia Oardquo
and M a ssp burmannica ldquoCalcutta 4rdquo According to
BUSCO (supplementary table 4 Supplementary Material on-
line) the most complete gene annotations are ldquoDH Pahangrdquo
(965) ldquoCalcutta 4rdquo (742) and ldquoBanksiirdquo (725) fol-
lowed by ldquoPKWrdquo (665) and ldquoMaia Oardquo (612)
Gene Families
The percentage of genes in orthogroups (OGs) which is a set
of orthologs and recent paralogs (ie gene family) ranges
from 74 in M a zebrina ldquoMaia Oardquo to 893 in M a mala-
ccensis ldquoDH Pahangrdquo with an average of 798 (table 1)
Orthogroups have a median size of 4 genes and do not ex-
ceed 50 (supplementary table 5 Supplementary Material on-
line) A pangenome here was defined on the basis of the
analysis of OGs in order to define the 1) core 2) accessory
and 3) unique gene set(s) On the basis of the five genomes
studied here the pangenome embeds a total of 32372 OGs
composed of 155222 genes The core genome is composed
of 12916 OGs (fig 1) Among these 8030 are composed of
only one sequence in each lineage (ie are likely single-copy
orthologs) A set of 1489 OGs are specific to all subspecies in
M acuminata while the number of genes specific to each
subspecies ranged from 14 in the M acuminata ldquoDH
Pahangrdquo to 110 in M acuminata ldquoBanksiirdquo for a total of
272 genes across all genotypes No significant enrichment
for any Gene Ontology (GO) category was detected for
subspecies-specific OGs
Variation in Gene Tree Topologies
Phylogenetic reconstruction performed with single-copy
genes (nfrac14 8030) showed high levels of discordance among
the different individual gene trees obtained both at the nu-
cleic acid and protein levels (fig 2A and supplementary data
1 Supplementary Material online) Considering M balbisiana
as outgroup there are 15 possible bifurcating tree topologies
relating the four M acuminata subspecies For all three par-
titions of the datamdashprotein CDS and gene (including introns
and UTRs)mdashwe observed all 15 different topologies (table 2)
We also examined topologies at loci that had bootstrap sup-
portgt90 for all nodes also finding all 15 different topologies
(table 2) Among trees constructed from whole genes topol-
ogies ranged in frequency from 1312 for the most com-
mon tree to 192 for the least common tree (table 2) with
an average length of the 1342 aligned nucleotide sites for
CDS and 483 aligned sites for proteins Based on these results
gene tree frequencies were used to calculate concordance
factors on the most frequent CDS gene trees (table 2) dem-
onstrating that no split was supported bygt30 of gene trees
(fig 2B) Therefore in order to further gain insight into the
subspecies phylogeny we used a combination of different
approaches described in the next section
Inference of a Species Tree
We used three complementary methods to infer phylogenetic
relationships among the sampled lineages First we
concatenated nucleotide sequences from all single-copy
genes (totaling 11668507 bp) We used PHYML to compute
a maximum likelihood tree from this alignment which as
expected provided a topology with highly supported nodes
(fig 3A) Note that this topology (denoted topology number 1
in table 2) is not the same as the one previously proposed in
the literature (denoted topology number 7 in table 2) (supple-
mentary figs 1 and 2 Supplementary Material online)
Next we used a method explicitly based on individual gene
tree topologies ASTRAL (Mirarab and Warnow 2015) infers
the species tree by using quartet frequencies found in gene
trees It is suitable for large data sets and was highlighted as
one of the best methods to address challenging topologies
with short internal branches and high levels of discordance
(Shi and Yang 2018) ASTRAL found the same topology using
ML gene trees from single-copy genes obtained from protein
sequences CDSs and genes (fig 3C)
Finally we ran a supertree approach implemented in
PhySIC_IST (Scornavacca et al 2008) on the single-copy genes
and obtained again the same topology (fig 3B) PhySIC_IST
first collapses poorly supported branches of the gene trees
into polytomies as well as conflicting branches of the gene
Rouard et al GBE
3132 Genome Biol Evol 10(12)3129ndash3140 doi101093gbeevy227 Advance Access publication October 13 2018
Dow
nloaded from httpsacadem
icoupcomgbearticle-abstract101231295129088 by U
niversiteeacute Feacutedeacuterale Toulouse Midi-Pyreacuteneacutees - SIC
D user on 06 D
ecember 2018
trees that are only present in a small minority of the trees it
then searches for the most resolved supertree that does not
contradict the signal present in the gene trees nor contains
topological signal absent from those trees Deeper investiga-
tion of the results revealed that 66 of the trees were
unresolved 33 discarded (pruned or incorrectly rooted)
and therefore that the inference relied on fewer than 1
of the trees Aiming to increase the number of genes used
by PhySIC_IST we included multicopy OGs of the core ge-
nome as well as some OGs in the accessory genomes using
the pipeline SSIMUL (Scornavacca et al 2011) SSIMUL trans-
lates multilabeled gene trees (MUL-trees) into trees having a
Table 1
Summary of the Gene Clustering Statistics Per (Sub)Species
Musa acuminata
malaccensis
ldquoDH Pahangrdquo
M acuminata
burmannica
ldquoCalcutta 4rdquo
M acuminata
banksii
ldquoBanksiirdquo
M acuminata
zebrina
ldquoMaia Oardquo
M balbisiana
ldquoPKWrdquo
genes 35276 45069 32692 44702 36836
genes in orthogroups 31501 34947 26490 33059 29225
unassigned genes 3775 10122 6202 11643 7611
genes in orthogroups 893 775 81 74 793
unassigned genes 107 225 19 26 207
orthogroups containing species 24074 26542 21446 25730 23935
orthogroups containing species 744 82 662 795 739
species-specific orthogroups 6 46 47 11 9
genes in species-specific orthogroups 14 104 110 23 21
genes in species-specific orthogroups 0 02 03 01 01
FIG 1mdashIntersection diagram showing the distribution of shared gene families (at least two sequences per OG) among M a banksii ldquoBanksiirdquo M a
zebrina ldquoMaia Oardquo M a burmannica ldquoCalcutta 4rdquo M a malaccensis ldquoDH Pahangrdquo and M balbisiana ldquoPKWrdquo genomes The figure was created with
UpsetR (Lex et al 2014)
Three New Genome Assemblies GBE
Genome Biol Evol 10(12)3129ndash3140 doi101093gbeevy227 Advance Access publication October 13 2018 3133
Dow
nloaded from httpsacadem
icoupcomgbearticle-abstract101231295129088 by U
niversiteeacute Feacutedeacuterale Toulouse Midi-Pyreacuteneacutees - SIC
D user on 06 D
ecember 2018
single copy of each gene (X-trees) that is the type of tree
usually expected in supertree inference To do so all individual
gene trees were constructed on CDSs from OGs with at least
4 M acuminata and M balbisiana genes (nfrac14 18069)
SSIMUL first removed identical subtrees resulting from a
duplication node in these trees it then filtered out trees where
duplicated parts induced contradictory rooted triples keeping
only coherent trees These trees can then be turned into trees
containing a single copy of each gene either by pruning the
smallest subtrees under each duplication node (leaving only
FIG 2mdashIllustration of gene tree discordance (A) Cloudogram of single copy OGs (CDS) visualized with Densitree The blue line represents the consensus
tree as provided by Densitree (B) Species tree with bootstrap-like support based on corresponding gene tree frequency from table 2 (denoted topology
number 2) PKW M balbisiana ldquoPKWrdquo C4 M acuminata burmannica ldquoCalcutta 4rdquo M M acuminata zebrina ldquoMaia Oardquo DH M acuminata malaccensis
ldquoDH Pahangrdquo B M acuminata banksii ldquoBanksiirdquo
Table 2
Frequency of Gene Tree Topologies of the 8030 Single Copy OGs
No Topology CDS () Protein () Gene () Gene Bootstrap gt90 ()
1 (PKW(C4(M(DH B)))) 119 1058 1312 1372
2 (PKW(C4(DH(B M)))) 108 1048 1192 1488
3 (PKW((DH C4)(B M))) 959 728 1273 1752
4 (PKW(M(C4(DH B)))) 953 1251 778 591
5 (PKW(C4(B(DH M)))) 802 737 889 844
6 (PKW((DH B)(C4 M))) 767 655 916 1256
7 (PKW(M(B(DH C4)))) 666 821 5 306
8 (PKW(B(M(DH C4)))) 558 523 461 253
9 (PKW(DH(C4(B M)))) 541 521 518 496
10 (PKW(B(C4(DH M)))) 526 445 62 707
11 (PKW(B(DH(C4 M)))) 502 682 336 19
12 (PKW(M(DH(B C4)))) 423 468 284 116
13 (PKW((DH M)(B C4))) 4037 361 479 506
14 (PKW(DH(B(C4 M)))) 385 418 244 063
15 (PKW(DH(M(B C4)))) 238 277 192 052
NOTEmdashIn bold the most frequent topology
PKW Musa balbisiana ldquoPKWrdquo C4 Musa acuminata burmannica ldquoCalcutta 4rdquo M Musa acuminata zebrina ldquoMaia Oardquo DH Musa acuminata malaccensis ldquoDH Pahangrdquo BMusa acuminata banksii ldquoBanksiirdquo
Rouard et al GBE
3134 Genome Biol Evol 10(12)3129ndash3140 doi101093gbeevy227 Advance Access publication October 13 2018
Dow
nloaded from httpsacadem
icoupcomgbearticle-abstract101231295129088 by U
niversiteeacute Feacutedeacuterale Toulouse Midi-Pyreacuteneacutees - SIC
D user on 06 D
ecember 2018
orthologous nodes in the tree) or by extracting the topolog-
ical signal induced by orthology nodes into a rooted triplet set
that is then turned back into an equivalent X-tree Here we
chose to use the pruning method to generate a data set to be
further analyzed with PhySIC_IST which lead to a subset of
14507 gene trees representing 44 of the total number of
OGs and an increase of 80 compared with the 8030 single-
copy OGs This analysis returned a consensus gene tree with
the same topology as both of the previous methods used here
(fig 3B)
Evidence for Introgression
Although much of the discordance we observe is likely due to
incomplete lineage sorting we also searched for introgression
between subspecies A common approach performed in
other plant genomes (Eaton and Ree 2013 Eaton et al
2015 Novikova et al 2016 Choi et al 2017) relies on the
use of the ABBA-BABA test (or D statistics) (Green et al 2010)
This test allows to differentiate admixture from incomplete
lineage sorting across genomes by detecting an excess of ei-
ther ABBA or BABA sites (where ldquoArdquo corresponds to the an-
cestral allele and ldquoBrdquo corresponds to the derived allele state)
An excess of each of this patterns is indicative of ancient ad-
mixture Therefore we applied it in a four-taxon phylogeny
including three M acuminata subspecies as ingroups and M
balbisiana as outgroup Because there were five taxa to be
tested analyses were done with permutation of taxa denoted
P1 P2 and P3 and Outgroup (table 3) Under the null hypoth-
esis of ILS an equal number of ABBA and BABA sites are
expected However we always found an excess of sites
grouping malaccensis (ldquoDHrdquo) and burmannica (ldquoC4rdquo) (ta-
ble 3) This indicates a history of introgression between these
two lineages
To test the direction of introgression we applied the D2
test (Hibbins and Hahn 2018) While introgression between a
pair of species (eg malaccensis and burmannica) always
results in smaller genetic distances between them the D2
test is based on the idea that gene flow in the two alternative
directions can also result in a change in genetic distance to
other taxa not involved in the exchange (in this case banksii)
We computed the genetic distance between banksii and bur-
mannica in gene trees where malaccensis and banksii are sis-
ter (denoted dACjA B) and the genetic distance between
banksii and burmannica in gene trees where malaccensis
and burmannica are sister (denoted dACjB C) The test takes
into account the genetic distance between the species not
involved in the introgression (banksii) and the species involved
in introgression that it is not most closely related to (burmann-
ica) We identified 1454 and 281 gene trees with dACjA
Bfrac14 115 and dACjB Cfrac14 091 respectively giving a significant
positive value of D2frac14023 (plt 0001 by permutation) These
FIG 3mdashSpecies topologies computed with three different approaches (A) Maximum likelihood tree inferred from a concatenated alignment of single-
copy genes (CDS) (B) Supertree-based method applied to single and multilabelled gene trees (C) Quartet-based model applied to protein CDS and gene
alignments
Three New Genome Assemblies GBE
Genome Biol Evol 10(12)3129ndash3140 doi101093gbeevy227 Advance Access publication October 13 2018 3135
Dow
nloaded from httpsacadem
icoupcomgbearticle-abstract101231295129088 by U
niversiteeacute Feacutedeacuterale Toulouse Midi-Pyreacuteneacutees - SIC
D user on 06 D
ecember 2018
results support introgression from malaccensis into burmann-
ica though they do not exclude the presence of a lesser level
of gene flow in the other direction
PanMusa a Database to Explore Individual OGs
Since genes underlie traits and wild banana species showed a
high level of incongruent gene tree topologies access to a
repertoire of individual gene trees is important This was the
rationale for constructing a database that provides access to
gene families and individual gene family trees in M acuminata
and M balbisiana A set of web interfaces are available to
navigate OGs that have been functionally annotated using
GreenPhyl comparative genomics database (Rouard et al
2011) PanMusa shares most of the features available on
GreenPhyl to display or export sequences InterPro assign-
ments sequence alignments and gene trees (fig 4) In addi-
tion new visualization tools were implemented such as
MSAViewer (Yachdav et al 2016) and PhyD3 (Kreft et al
2017) to view gene trees
Discussion
Musa acuminata Subspecies Contain Few Subspecies-Specific Families
In this study we used a de novo approach to generate addi-
tional reference genomes for the three subspecies of Musa
acuminata all three are thought to have played significant
roles as genetic contributors to the modern cultivars
Genome assemblies produced for this study differ in quality
but the estimation of genome assembly and gene annotation
quality conducted with BUSCO suggests that they were suf-
ficient to perform comparative analyses Moreover we ob-
served that the number of genes grouped in OGs were
relatively similar among subspecies indicating that the poten-
tial overprediction of genes in ldquoMaia Oardquo and ldquoCalcutta 4rdquo
was mitigated during the clustering procedure Indeed over-
prediction in draft genomes is expected due to fragmentation
leading to an artefactual increase in the number of genes
(Denton et al 2014)
Although our study is based on one representative per
subspecies Musa appears to have a widely shared
pangenome with only a small number of subspecies-
specific families identified The pangenome analysis also
reveals a large number of families shared only among subsets
of species or subspecies (fig 1) this ldquodispensablerdquo genome is
thought to contribute to diversity and adaptation (Tettelin
et al 2005 Medini et al 2005) The small number of
species-specific OGs in Musa acuminata also supports the re-
cent divergence between all genotypes including the split
between M acuminata and M balbisiana
Musa acuminata Subspecies Show a High Level ofDiscordance between Individual Gene Trees
Gene tree conflict has been recently reported in the
Zingiberales (Carlsen et al 2018) and Musa in not an excep-
tion By computing gene trees with all single-copy genes OG
we found widespread discordance in gene tree topologies
Topological incongruence can be the result of incomplete lin-
eage sorting the misassignment of paralogs as orthologs in-
trogression or horizontal gene transfer (Maddison 1997)
With the continued generation of phylogenomic data sets
over the past dozen years massive amounts of discordance
have been reported first in Drosophila (Pollard et al 2006)
and more recently in birds (Jarvis et al 2014) mammals (Li
et al 2016 Shi and Yang 2018) and plants (Novikova et al
2016 Pease et al 2016 Choi et al 2017 Copetti et al 2017
Wu et al 2017) Due to the risk of hemiplasy in such data sets
(Avise et al 2008 Hahn and Nakhleh 2016) we determined
that we could not accurately reconstruct either nucleotide
substitutions or gene gains and losses among the genomes
analyzed here
In our case the fact that all possible subspecies tree topol-
ogies occurred and that ratios of minor trees at most nodes
were equivalent to those expected under ILS strongly sug-
gests the presence of ILS (Hahn and Nakhleh 2016) Banana is
a paleopolyploid plant that experienced three independent
whole genome duplications (WGD) and some fractionation
is likely still occurring (DrsquoHont et al 2012) (supplementary
table 6 Supplementary Material online) But divergence levels
among the single-copy OGs were fairly consistent (fig 2A)
supporting the correct assignment of orthology among
sequences However we did find evidence for introgression
between malaccensis and burmannica which contributed a
Table 3
Four-Taxon ABBA-BABA Test (D-Statistic) Used for Introgression Inference from the Well-Supported Topology from Fig 3
P1 P2 P3 BBAA ABBA BABA Disc a Db p valuec
Malaccensis (DH) Banksii (B) Burmannica (C4) 12185 4289 8532 051 033 lt22e-16
Malaccensis (DH) Zebrina (M) Burmannica (C4) 9622 5400 9241 06 026 lt 22e-16
Zebrina (M) Banksii (B) Burmannica (C4) 11204 6859 6782 054 0005 05097
Malaccensis (DH) Banksii (B) Zebrina (M) 10450 7119 6965 057 002 01944
aDiscordancefrac14(ABBAthornBABA)TotalbD frac14(ABBABABA)(ABBAthornBABA)cBased on Pearson chi-squared
Rouard et al GBE
3136 Genome Biol Evol 10(12)3129ndash3140 doi101093gbeevy227 Advance Access publication October 13 2018
Dow
nloaded from httpsacadem
icoupcomgbearticle-abstract101231295129088 by U
niversiteeacute Feacutedeacuterale Toulouse Midi-Pyreacuteneacutees - SIC
D user on 06 D
ecember 2018
small excess of sites supporting one particular discordant to-
pology (table 3) This event is also supported by the geograph-
ical overlap in the distribution of these two subspecies (Perrier
et al 2011)
Previous studies have attempted to resolve the topology in
the Musaceae but did not include all subspecies considered
here and had very limited numbers of loci In Christelova et al
(2011) a robust combined approach using maximum likeli-
hood maximum parsimony and Bayesian inference was ap-
plied to 19 loci but only burmannica and zebrina out of the
four subspecies were included Jarret et al (1992) reported
sister relationships between malaccensis and banksii on the
basis of RFLP markers but did not include any samples from
burmannica and zebrina However the resolved species tree
supported by all methods used here is a new topology com-
pared with species trees comprising at least one representa-
tive of our 4 subspecies (Janssens et al 2016 Sardos et al
2016 Christelova et al 2017) (supplementary fig 1
Supplementary Material online) Indeed ldquoCalcutta 4rdquo as rep-
resentative of M acuminata ssp burmannica was placed
sister to the other Musa acuminata genotypes in our
study whereas those studies indicates direct proximity
between burmannica and malaccensis The detected in-
trogression from malaccensis to burmannica may be an
explanation for the difference observed but increasing
the sampling with several genome sequences by subspe-
cies would enable a better resolution
More strikingly considering previous phylogenetic hy-
potheses malaccensis appeared most closely related to
banksii which is quite distinct from the other M acumi-
nata spp (Simmonds and Weatherup 1990) and which
used to be postulated as its own species based on its geo-
graphical area of distribution and floral diversity (Argent
1976) (fig 5) However on the bases of genomic similar-
ity all our analyses support M acuminata ssp banksii as a
subspecies of M acuminata
FIG 4mdashOverview of available interfaces for the PanMusa database (A) Homepage of the website (B) List of functionally annotated OGs (C) Graphical
representation of the number of sequence by species (D) Consensus InterPro domain schema by OG (E) Individual gene trees visualized with PhyD3 (F)
Multiple alignment of OG with MSAviewer
Three New Genome Assemblies GBE
Genome Biol Evol 10(12)3129ndash3140 doi101093gbeevy227 Advance Access publication October 13 2018 3137
Dow
nloaded from httpsacadem
icoupcomgbearticle-abstract101231295129088 by U
niversiteeacute Feacutedeacuterale Toulouse Midi-Pyreacuteneacutees - SIC
D user on 06 D
ecember 2018
Gene Tree Discordance Supports Rapid Radiation of Musaacuminata Subspecies
In their evolutionary history Musa species dispersed from
ldquonorthwest to southeastrdquo into Southeast Asia (Janssens
et al 2016) Due to sea level fluctuations Malesia (including
the nations of Indonesia Malaysia Brunei Singapore the
Philippines and Papua New Guinea) is a complex geographic
region formed as the result of multiple fusions and subse-
quent isolation of different islands (Thomas et al 2012
Janssens et al 2016) Ancestors of the Callimusa section (of
the Musa genus) started to radiate from the northern Indo-
Burma region toward the rest of Southeast Asia 30 Ma
while the ancestors of the Musa (formerly Eumusa
Rhodochlamys) section started to colonize the region
10 Ma (Janssens et al 2016) The divergence between M
acuminata and M balbisiana has been estimated to be5 Ma
(Lescot et al 2008) However no accurate dating has yet
been proposed for the divergence of the Musa acuminata
subspecies We hypothesize that after the speciation of M
acuminata and M balbisiana (ca 5 Ma) rapid diversification
occurred within populations of M acuminata This hypothesis
is consistent with the observed gene tree discordance and
high levels of ILS Such a degree of discordance may reflect
a near-instantaneous radiation between all subspecies of M
acuminata Alternatively it could support the proposed hy-
pothesis of divergence back in the northern part of Malesia
during the Pliocene (Janssens et al 2016) followed by intro-
gression taking place among multiple pairs of species as
detected between malaccensis and burmannica While mas-
sive amounts of introgression can certainly mask the history of
lineage splitting (Fontaine et al 2015) we did not find evi-
dence for such mixing
Interestingly such a broad range of gene tree topologies
due to ILS (and introgression) has also been observed in gib-
bons (Carbone et al 2014 Veeramah et al 2015 Shi and
Yang 2018) for which the area of distribution in tropical for-
ests of Southeast Asia is actually overlapping the center of
origin of wild bananas Moreover according to Carbone
et al (2014) gibbons also experienced a near-instantaneous
radiation 5 Ma It is therefore tempting to hypothesize that
ancestors of wild bananas and ancestors of gibbons faced
similar geographical isolation and had to colonize and adapt
to similar ecological niches leading to the observed patterns
of incomplete lineage sorting
In this study we highlighted the phylogenetic complexity in
a genome-wide data set for Musa acuminata and Musa
FIG 5mdashArea of distribution of Musa species in Southeast Asia as described by Perrier et al (2011) including species tree of Musa acuminata subspecies
based on results described in figure 4 Areas of distribution are approximately represented by colors hatched zone shows area of overlap between two
subspecies where introgression may have occurred
Rouard et al GBE
3138 Genome Biol Evol 10(12)3129ndash3140 doi101093gbeevy227 Advance Access publication October 13 2018
Dow
nloaded from httpsacadem
icoupcomgbearticle-abstract101231295129088 by U
niversiteeacute Feacutedeacuterale Toulouse Midi-Pyreacuteneacutees - SIC
D user on 06 D
ecember 2018
balbisiana bringing additional insights to explain why the
Musaceae phylogeny has remained controversial Our work
should enable researchers to make inferences about trait evo-
lution and ultimately should help support crop improvement
strategies
Supplementary Material
Supplementary data are available at Genome Biology and
Evolution online
Acknowledgments
We thank Noel Chen and Qiongzhi He (BGI) for providing
sequencing services with Illumina and Ave Tooming-
Klunderud (CEES) for PacBio sequencing services and
Computomics for support with assembly We thank Erika
Sallet (INRA) for providing early access to the new version of
Eugene with helpful suggestions We thank the CRB-Plantes
Tropicales Antilles CIRAD-INRA for providing plant materials
We would like also to acknowledge Jae Young Choi (NYU)
Steven Janssens (MBG) Laura Kubatko (OSU) for helpful dis-
cussions and advice on species tree topologies This work was
financially supported by CGIAR Fund Donors and CGIAR
Research Programme on Roots Tubers and Bananas (RTB)
and technically supported by the high performance cluster
of the UMR AGAP ndash CIRAD of the South Green
Bioinformatics Platform (httpwwwsouthgreenfr) Finally
this work benefited from the GenomeHarvest project
(httpswwwgenomeharvestfr) funded by the Agropolis
fondation
Authors Contribution
MR NR and AD set up the study and MR coordinated
the study AD and FCB provided access to plant material
and DNA NY provided access to transcriptome data and
GM to repeats library for gene annotation BG performed
assembly and gap closing MR GD GM YH JS and
AC performed analyses VB MSH and MWH provided
guidance on methods and helped with result interpretation
VG and MR set up the PanMusa website MR wrote the
manuscript with significant contributions from MWH VB
and JS and all coauthors commented on the manuscript
Literature CitedArgent G 1976 The wild bananas of Papua New Guinea Notes Roy Bot
Gard Edinb 3577ndash114
Avise JC Robinson TJ Kubatko L 2008 Hemiplasy a new term in the
lexicon of phylogenetics Syst Biol 57(3)503ndash507
Bardou P Mariette J Escudie F Djemiel C Klopp C 2014 jvenn an
interactive Venn diagram viewer BMC Bioinformatics 15(1)293
Bouckaert RR 2010 DensiTree making sense of sets of phylogenetic
trees Bioinformatics 26(10)1372ndash1373
Bravo GA et al 2018 Embracing heterogeneity Building the Tree of Life
and the future of phylogenomics PeerJ Preprints 6e26449v3 https
doiorg107287peerjpreprints26449v3
Carbone L et al 2014 Gibbon genome and the fast karyotype evolution
of small apes Nature 513(7517)195ndash201
Carlsen MM et al 2018 Resolving the rapid plant radiation of early di-
verging lineages in the tropical Zingiberales pushing the limits of ge-
nomic data Mol Phylogenet Evol 12855ndash68
Cheesman EE 1948 Classification of the bananas Kew Bull 3(1)17ndash28
Choi JY et al 2017 The rice paradox multiple origins but single domes-
tication in Asian rice Mol Biol Evol 34969ndash979
Christelova P et al 2017 Molecular and cytological characterization of the
global Musa germplasm collection provides insights into the treasure
of banana diversity Biodivers Conserv 26(4)801ndash824
Christelova P et al 2011 A platform for efficient genotyping in Musa
using microsatellite markers AoB Plants 2011plr024
Christelova P Valarik M Hribova E De Langhe E Dolezel J 2011 A multi
gene sequence-based phylogeny of the Musaceae (banana) family
BMC Evol Biol 11103
Conesa A et al 2005 Blast2GO a universal tool for annotation visuali-
zation and analysis in functional genomics research Bioinformatics
21(18)3674ndash3676
Copetti D et al 2017 Extensive gene tree discordance and hemiplasy
shaped the genomes of North American columnar cacti Proc Natl
Acad Sci U S A 114(45)12003ndash12008
Davey MW et al 2013 A draft Musa balbisiana genome sequence for
molecular genetics in polyploid inter- and intra-specific Musa hybrids
BMC Genomics 14(1)683
De Langhe E et al 2009 Why bananas matter an introduction to the
history of banana domestication Ethnobot Res Appl 7165ndash177
Denton JF et al 2014 Extensive error in the number of genes inferred
from draft genome assemblies PLoS Comput Biol 10(12)e1003998
DrsquoHont A et al 2012 The banana (Musa acuminata) genome and the
evolution of monocotyledonous plants Nature 488213
Durand EY Patterson N Reich D Slatkin M 2011 Testing for ancient
admixture between closely related populations Mol Biol Evol
28(8)2239ndash2252
Eaton DAR Hipp AL Gonzalez-Rodrıguez A Cavender-Bares J 2015
Historical introgression among the American live oaks and the com-
parative nature of tests for introgression Evolution
69(10)2587ndash2601
Eaton DAR Ree RH 2013 Inferring phylogeny and introgression using
RADseq data an example from flowering plants (Pedicularis
Orobanchaceae) Syst Biol 62(5)689ndash706
Emms DM Kelly S 2015 OrthoFinder solving fundamental biases in
whole genome comparisons dramatically improves orthogroup infer-
ence accuracy Genome Biol 16157
English AC et al 2012 Mind the gap upgrading genomes with Pacific
Biosciences RS long-read sequencing technology PLoS One
7(11)e47768
Foissac S et al 2008 Genome annotation in plants and fungi EuGene as
a model platform Curr Bioinformatics 387ndash97
FolkRA Soltis Pamela S Soltis Douglas E Guralnick R 2018 New pros-
pects in the detection and comparative analysis of hybridization in the
tree of life Am J Bot 105364ndash375
Fontaine MC et al 2015 Extensive introgression in a malaria vector spe-
cies complex revealed by phylogenomics Science
347(6217)1258524
Green RE et al 2010 A Draft Sequence of the Neandertal Genome
Science 328710ndash722
Guignon V et al 2016 The South Green portal a comprehensive resource
for tropical and Mediterranean crop genomics Curr Plant Biol 76ndash9
Guindon S Delsuc F Dufayard J-F Gascuel O 2009 Estimating maximum
likelihood phylogenies with PhyML Methods Mol Biol 537113ndash137
Three New Genome Assemblies GBE
Genome Biol Evol 10(12)3129ndash3140 doi101093gbeevy227 Advance Access publication October 13 2018 3139
Dow
nloaded from httpsacadem
icoupcomgbearticle-abstract101231295129088 by U
niversiteeacute Feacutedeacuterale Toulouse Midi-Pyreacuteneacutees - SIC
D user on 06 D
ecember 2018
Hahn MW Nakhleh L 2016 Irrational exuberance for resolved species
trees Evol Int J Org Evol 70(1)7ndash17
Heuroakkinen M 2013 Reappraisal of sectional taxonomy in Musa
(Musaceae) Taxon 62(1)809ndash813
Hibbins MS Hahn MW 2018 Population genetic tests for the direction
and relative timing of introgression bioRxiv 328575
Janssens SB et al 2016 Evolutionary dynamics and biogeography of
Musaceae reveal a correlation between the diversification of the ba-
nana family and the geological and climatic history of Southeast Asia
New Phytol 210(4)1453ndash1465
Jarret R Gawel N Whittemore A Sharrock S 1992 RFLP-based phylogeny
of Musa species in Papua New Guinea Theor Appl Genet
84579ndash584
Jarvis ED et al 2014 Whole-genome analyses resolve early branches in
the tree of life of modern birds Science 346(6215)1320ndash1331
Junier T Zdobnov EM 2010 The Newick utilities high-throughput phy-
logenetic tree processing in the UNIX shell Bioinformatics
26(13)1669ndash1670
Katoh K Standley DM 2013 MAFFT multiple sequence alignment soft-
ware version 7 improvements in performance and usability Mol Biol
Evol 30(4)772ndash780
Kreft L Botzki A Coppens F Vandepoele K Van Bel M 2017 PhyD3 a
phylogenetic tree viewer with extended phyloXML support for func-
tional genomics data visualization Bioinformatics 332946ndash2947
Kuck P Longo GC 2014 FASconCAT-G extensive functions for multiple
sequence alignment preparations concerning phylogenetic studies
Front Zool 11(1)81
Lescot M et al 2008 Insights into the Musa genome syntenic relation-
ships to rice and between Musa species BMC Genomics 9(1)58
Lex A Gehlenborg N Strobelt H Vuillemot R Pfister H 2014 UpSet
visualization of intersecting sets IEEE Trans Vis Comput Graph
20(12)1983ndash1992
Li G Davis BW Eizirik E Murphy WJ 2016 Phylogenomic evidence for
ancient hybridization in the genomes of living cats (Felidae) Genome
Res 26(1)1ndash11
Luo R et al 2012 SOAPdenovo2 an empirically improved memory-
efficient short-read de novo assembler GigaScience 118
Maddison WP 1997 Gene trees in species trees Syst Biol 46(3)523ndash536
Magrane M UniProt Consortium 2011 UniProt Knowledgebase a hub of
integrated protein data Database (Oxford) 2011bar009
Martin G et al 2016 Improvement of the banana lsquoMusa acuminatarsquo
reference sequence using NGS data and semi-automated bioinformat-
ics methods BMC Genomics 17243
Medini D Donati C Tettelin H Masignani V Rappuoli R 2005 The mi-
crobial pan-genome Curr Opin Genet Dev 15(6)589ndash594
Mirarab S Warnow T 2015 ASTRAL-II coalescent-based species tree es-
timation with many hundreds of taxa and thousands of genes
Bioinformatics 31(12)i44ndashi52
Morgante M De Paoli E Radovic S 2007 Transposable elements and the
plant pan-genomes Curr Opin Plant Biol 10(2)149ndash155
Novikova PY et al 2016 Sequencing of the genus Arabidopsis identifies a
complex history of nonbifurcating speciation and abundant trans-
specific polymorphism Nat Genet 48(9)1077ndash1082
Pease JB Rosenzweig BK 2018 Encoding Data Using Biological
Principles The Multisample Variant Format for Phylogenomics and
Population Genomics IEEEACM Trans Comput Biol Bioinformatics
151231ndash1238
Pease JB Haak DC Hahn MW Moyle LC 2016 Phylogenomics reveals
three sources of adaptive variation during a rapid radiation PLoS Biol
14(2)e1002379
Perrier X et al 2011 Multidisciplinary perspectives on banana (Musa spp)
domestication Proc Natl Acad Sci U S A 10811311ndash11318
Pollard DA Iyer VN Moses AM Eisen MB 2006 Widespread discordance
of gene trees with species tree in Drosophila evidence for incomplete
lineage sorting PLoS Genet 2(10)e173
Rice P Longden I Bleasby A 2000 EMBOSS the European Molecular
Biology Open Software Suite Trends Genet 16(6)276ndash277
Risterucci AM et al 2000 A high-density linkage map of Theobroma
cacao L Theor Appl Genet 101(5-6)948ndash955
Rouard M et al 2011 GreenPhylDB v20 comparative and functional
genomics in plants Nucleic Acids Res 39(Suppl_1)D1095ndashD1102
Ruas M et al 2017 MGIS managing banana (Musa spp) genetic resour-
ces information and high-throughput genotyping data Database
2017 doi 101093databasebax046
Sarah G et al 2017 A large set of 26 new reference transcriptomes
dedicated to comparative population genomics in crops and wild rel-
atives Mol Ecol Resour17565ndash580
Sardos J et al 2016 A genome-wide association study on the seedless
phenotype in banana (Musa spp) reveals the potential of a selected
panel to detect candidate genes in a vegetatively propagated crop
PLoS One 11(5)e0154448
Sardos J et al 2016 DArT whole genome profiling provides insights on
the evolution and taxonomy of edible banana (Musa spp) Ann Bot
mcw170
Scornavacca C Berry V Lefort V Douzery EJ Ranwez V 2008 PhySIC_IST
cleaning source trees to infer more informative supertrees BMC
Bioinformatics 9(1)413
Scornavacca C Berry V Ranwez V 2011 Building species trees from larger
parts of phylogenomic databases Inf Comput 209(3)590ndash605
Shi C-M Yang Z 2018 Coalescent-based analyses of genomic sequence
data provide a robust resolution of phylogenetic relationships among
major groups of gibbons Mol Biol Evol 35(1)159ndash179
Sim~ao FA Waterhouse RM Ioannidis P Kriventseva EV Zdobnov EM
2015 BUSCO assessing genome assembly and annotation complete-
ness with single-copy orthologs Bioinformatics 31(19)3210ndash3212
Simmonds NW 1956 Botanical results of the banana collecting expedi-
tion 1954ndash5 Kew Bull 11(3)463ndash489
Simmonds NW 1962 The evolution of the bananasLondon (GBR)
Longmans
Simmonds NW Shepherd K 1955 The taxonomy and origins of the cul-
tivated bananas J Linn Soc Lond Bot 55(359)302ndash312
Simmonds NW Weatherup STC 1990 Numerical taxonomy of the wild
bananas (Musa) New Phytol 115(3)567ndash571
Tettelin H et al 2005 Genome analysis of multiple pathogenic isolates of
Streptococcus agalactiae implications for the microbial ldquopan-
genomerdquo Proc Natl Acad Sci U S A 10213950ndash13955
Thomas DC et al 2012 West to east dispersal and subsequent rapid
diversification of the mega-diverse genus Begonia (Begoniaceae) in
the Malesian archipelago J Biogeogr 39(1)98ndash113
Veeramah KR et al 2015 Examining phylogenetic relationships among
Gibbon genera using whole genome sequence data using an approx-
imate Bayesian computation approach Genetics 200(1)295ndash308
Wu M Kostyun JL Hahn MW Moyle L 2017 Dissecting the basis of novel
trait evolution in a radiation with widespread phylogenetic discor-
dance bioRxiv 201376
Yachdav G et al 2016 MSAViewer interactive JavaScript visualization of
multiple sequence alignments Bioinformatics 323501ndash3503
Zhang C Rabiee M Sayyari E Mirarab S 2018 ASTRAL-III polynomial
time species tree reconstruction from partially resolved gene trees
BMC Bioinformatics 19(Suppl 6)153
Zimin AV et al 2013 The MaSuRCA genome assembler Bioinformatics
29(21)2669ndash2677
Associate editor Laura Rose
Rouard et al GBE
3140 Genome Biol Evol 10(12)3129ndash3140 doi101093gbeevy227 Advance Access publication October 13 2018
Dow
nloaded from httpsacadem
icoupcomgbearticle-abstract101231295129088 by U
niversiteeacute Feacutedeacuterale Toulouse Midi-Pyreacuteneacutees - SIC
D user on 06 D
ecember 2018
- evy227-TF1
- evy227-TF2
- evy227-TF3
- evy227-TF4
- evy227-TF5
-
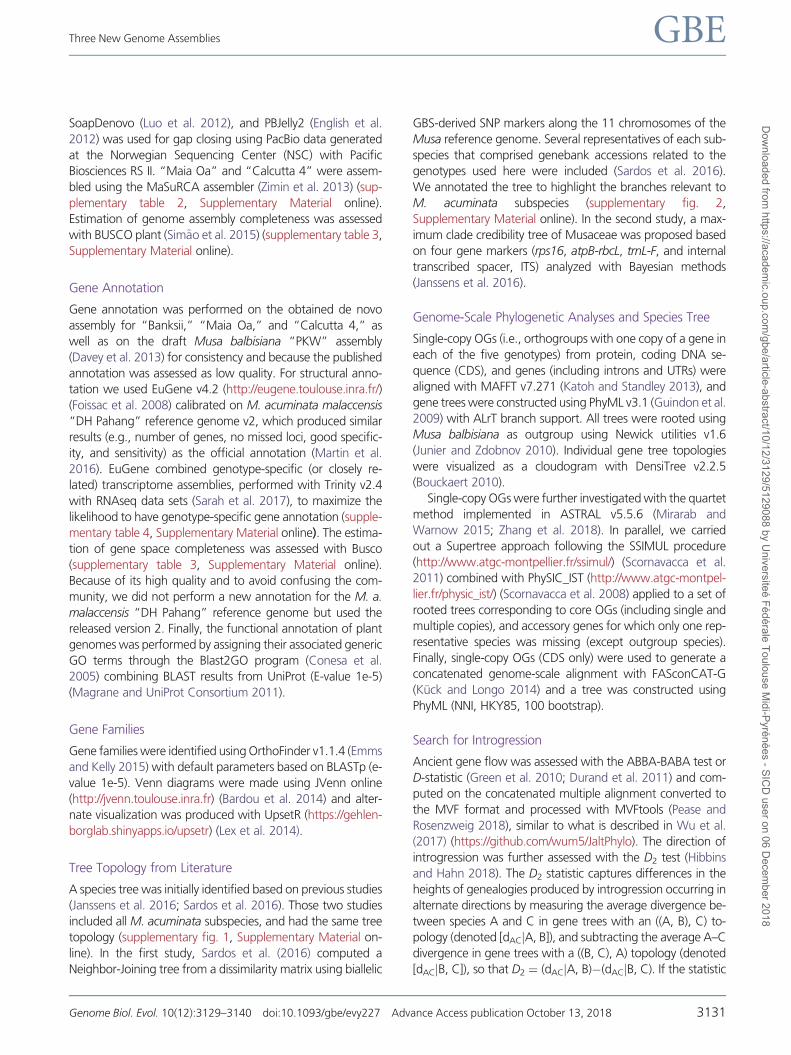
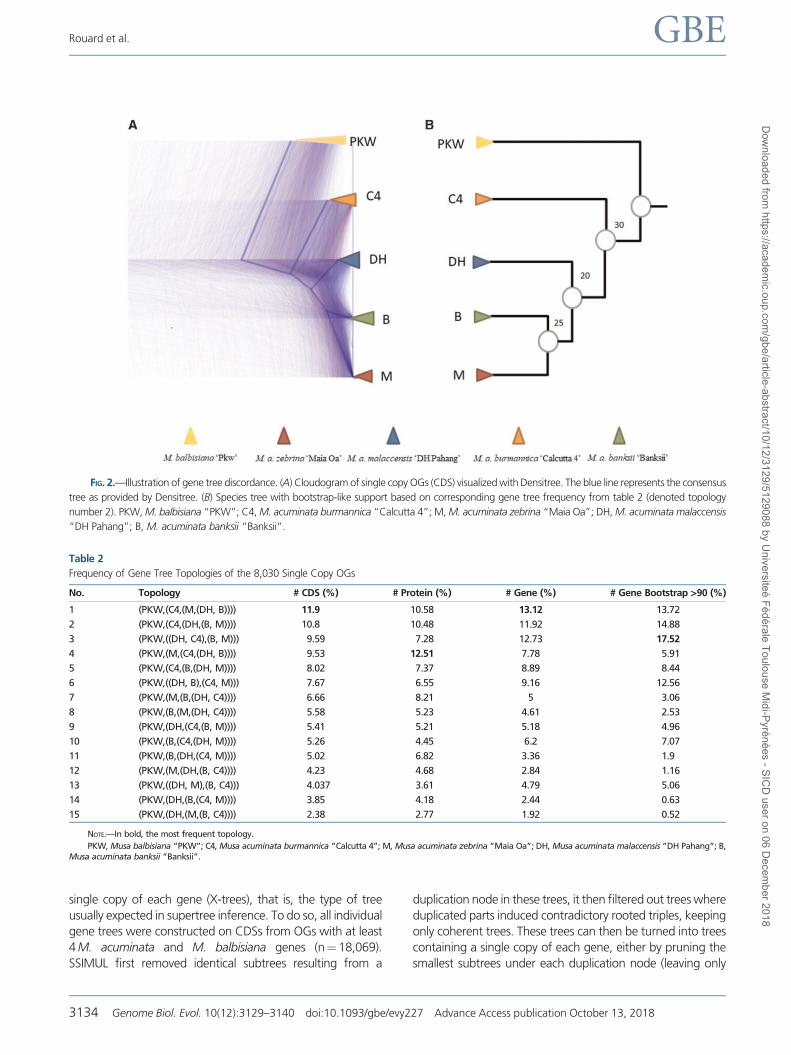
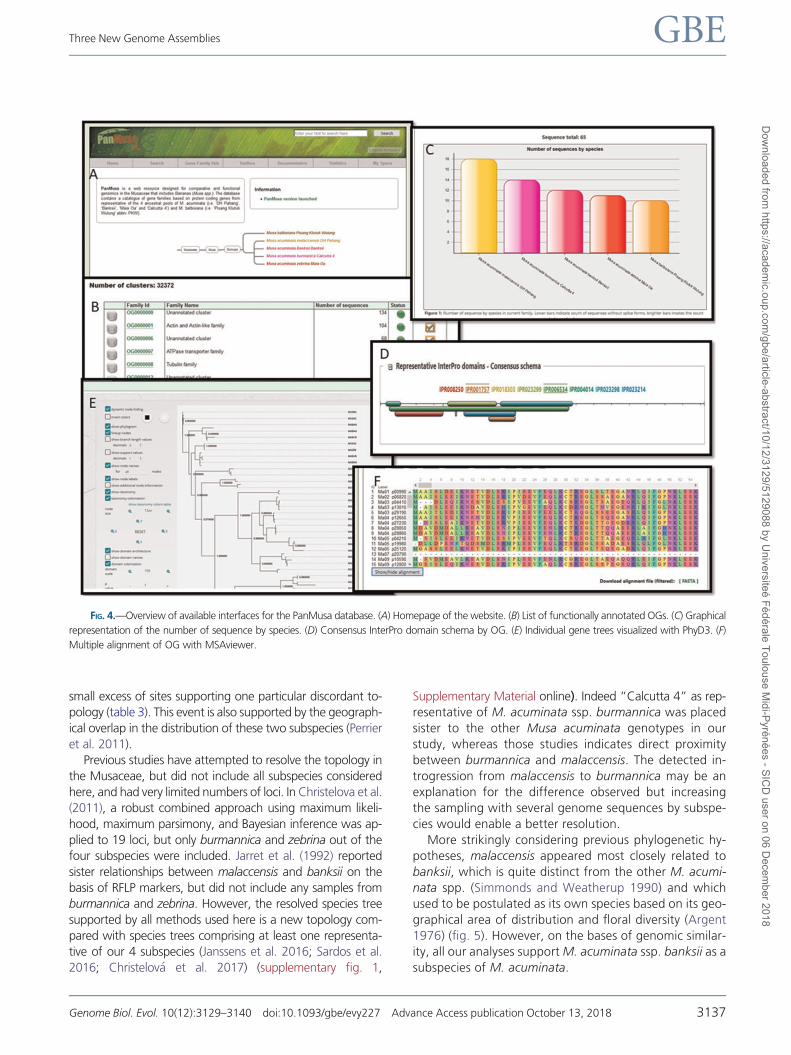
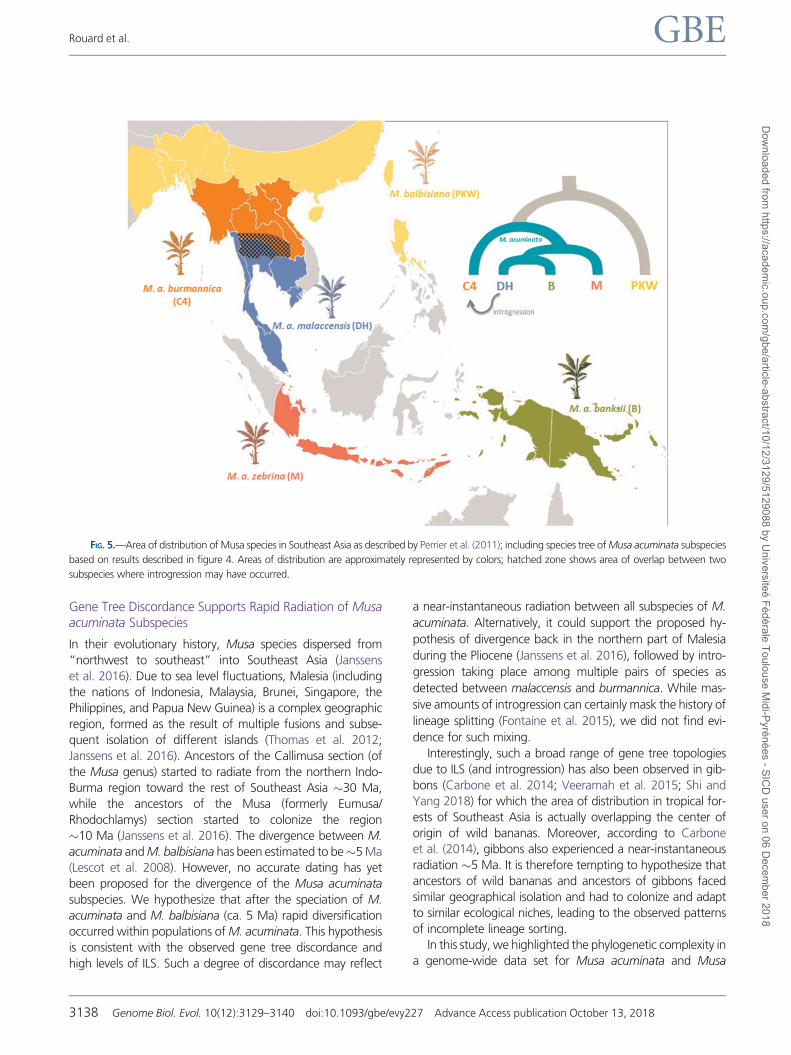
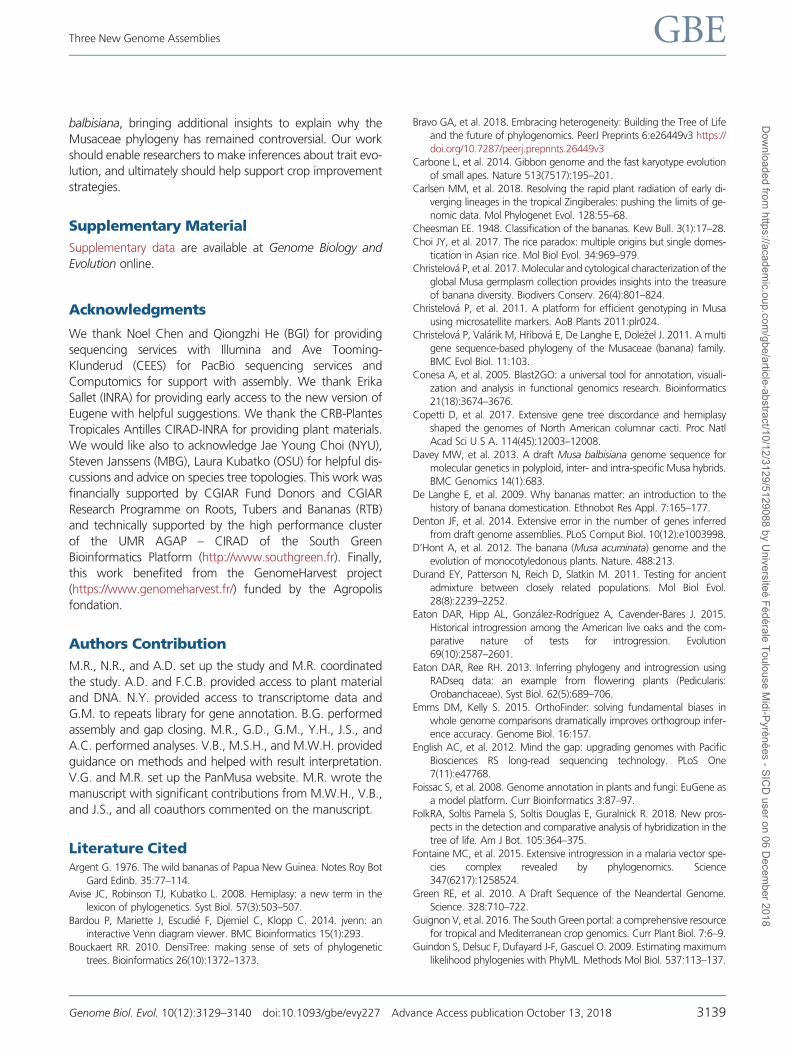