murdoch research repositoryresearchrepository.murdoch.edu.au/id/eprint/6074/1/adsorption_of... ·...
TRANSCRIPT

MURDOCH RESEARCH REPOSITORY
This is the author’s final version of the work, as accepted for publication following peer review but without the publisher’s layout or pagination.
The definitive version is available at http://dx.doi.org/10.1016/j.mineng.2011.09.011
Poinern, G.E.J., Senanayake, G., Shah, N., Thi-Le, X.N.,
Parkinson, G.M. and Fawcett, D. (2011) Adsorption of the aurocyanide, complex on granular activated carbons derived from macadamia nut shells – A preliminary study. Minerals
Engineering, 24 (15). pp. 1694-1702.
http://researchrepository.murdoch.edu.au/6074/
Copyright: © 2011 Elsevier Ltd.
It is posted here for your personal use. No further distribution is permitted.

Adsorption of the aurocyanide, complex on granular activated carbons derived from macadamia nut shells – A preliminary study
Gerrard Eddy Jai Poinerna, Gamini Senanayakeb, Nikunj Shaha, Xuan N. Thi-Lea, Gordon M. Parkinsonc, Derek Fawcetta
a School of Science and Engineering, Murdoch Applied Nanotechnology Research Group, Australia
b School of Science and Engineering, Mineral Science, Murdoch University, Australia
c Department of Chemistry, Curtin University of Technology, Australia
Abstract
In this study, waste macadamia nut shells were investigated for potential use as a hard
organic precursor for the production of a granular activated carbon material. The processing
of the macadamia shells commenced with the carbonised of the shells under a nitrogen
atmosphere. This was followed by the physical activation of the shells under a carbon dioxide
atmosphere, which was carried out at different temperatures to investigate the effect of the
activation temperature on pore formation. The pore structure and gold loading capacity of the
synthesised activated carbons were investigated. The porous nature and surface structure of
the macadamia shell based activated carbon were examined by Scanning Electron
Microscopy (SEM) at various stages of manufacture. In addition, gold loading studies were
carried out in conjunction with elemental mapping of the activated carbon surface to
determine the gold adsorption sites. The studies have revealed that the macadamia shell based
carbons, activated at higher temperatures have a gold loading capacity that is comparable to
the commercially available coconut based activated carbons.
Keywords: Activated carbons; Gold cyanide; Gold extraction; Adsorption; Macadamia
Introduction
Activated carbons are highly porous carbonaceous materials with a unique set of properties;
these consist of a well-developed reproducible microporous structure, a large internal surface
area, a high degree of surface reactivity and adsorption capacity, which makes them effective
and versatile adsorbents. They have a variety of engineered surface groups which can be
employed in a number of specific applications ranging from purification, decolourisation and
deodorisation, chlorine reduction, toxicity reduction, filtration, separation and concentration
of recoverable materials (Gadkaree, 1997 and Hayashi et al., 2005). Major applications of
activated carbons include gas separation and purification, solvent recovery, water treatment,
food and food beverage processing, chemical and pharmaceutical processing, sewage
treatment, gold recovery, catalysts and catalyst supports, water purification and gas–solid
separation (Smisek and Cerny, 1970, El-Geundi, 1997 and Marsh, 2001).
Materials that can produce activated carbons from plant origin include wood, peat, lignin,
coal, vegetable waste from food processing, coconut shells, nut shells (almond, hazelnut,
walnut, pecan and macadamia shells) and fruit stones (apricot, peach and cherry stones)
(Gadkaree, 1997, Ahmadpour and Do, 1997, Khalili et al., 1999 and Tancredi et al., 2004). In
addition, alternative sources ranging from bone, sugar and tyres to waste sludge or bio-solids

produced at municipal or industrial wastewater treatment facilities can also be used as
precursors for producing activated carbons (Teng et al., 1997, Khalili et al., 1999, Lartey et
al., 1999, Martin et al., 2002 and Zabaniotou et al., 2004). On average, it takes approximately
1 Mt of raw material to produce 0.4 Mt of activated carbon globally at the beginning of the
21st century and the continuing demand for activated carbons will require more raw organic
materials for processing (Marsh, 2001).
In 1894, Johnson patented the process of gold recovery using wood charcoal from a cyanide
leached solution, but it was not until the early 1950’s that Zadra et al. from the US Bureau of
Mines developed the activated carbon based technology (Johnson, 1894 and Zadra et al.,
1952). The relative ease at which gold adsorption takes place onto activated carbon and the
subsequent desorption has generated significant interest from both the scientific and
industrial fields. In particular, the gold mining industry has effectively used activated carbons
to extract gold (Au) from crushed ore to maximise extraction rates for many years and hence
reduce processing costs. There are two activated carbon based technologies that are widely
used in the gold industry, the first is carbon in pulp (CIP) process and the second is carbon in
leach (CIL) process. Both technologies use activated carbon with an approximate surface area
of 1000 m2/g produced from peat or coconut based carbon. This activated carbon is then used
for the adsorption of Au (I), which is in the form of ions that are present in the
cyanide leach liquors that normally contain around 10 mg/L of Au (I) (Marsden and House,
1993). Once the activated carbon is loaded with the Au (I) complex, it is separated from the
pulp by screening, and then washed. It is then stripped of the Au complex in a hot caustic
solution. This is followed by the electrowinning of the Au from the concentrated Au (I)
solution and the recycling of carbon (reactivation). After regeneration (reactivation) cycle the

carbon is ready for another Au loading process again, with this process continuing until the
carbon material becomes unserviceable. The low capital and operating costs, in conjunction
with the high selectivity of activated carbon towards Au, has made both the CIP and CIL
processes a very attractive economical option for the gold industry (Muir, 1991 and Fleming,
1998). This is clearly evident from the increase in annual carbon-based global gold
production from 0% in the 1970s to 70% in 2000 (Fleming et al., 2011).
For optimum performance in a gold recovery circuit, the activated carbon must possess
important properties such as a high rate of adsorption, superior gold loading capacity,
mechanically strong and have a high resistance to abrasion (Ladeira et al., 1993). The raw
materials have an inherent structure, which also contributed to the overall adsorption activity
of the activated carbon produced. These properties are controlled by the nature of the
activating agent and the conditions of the activation process. Despite the large Au equilibrium
adsorption capacity of activated carbon, which is dependent upon the surface area per unit
mass and the surface structure of the carbon, the Au extraction rates are slow in both CIP and
CIL processing plants because they are dependent on adsorption kinetics rather than
equilibrium loading. Furthermore, increasing the Au loading on the activated carbon in a
series of tanks during a continuous process operation progressively slows the rate of
adsorption and results in an increase of soluble Au losses to the tailings. This problem can be
solved by increasing the amount of activated carbon in each tank or by increasing the number
of tanks used in the loading circuit (Fleming et al., 2011). In addition, the hardness and
longevity of the activated carbon are also major factors, which can contribute to the loss of
carbon during the process operation. The three major pathways in which carbon can be lost
are: (i) wet attrition resulting from the agitated and abrasive pulp environment of the
adsorption circuit, (ii) the transportation of carbon during screening, (iii) oxidation, burning

and dry abrasion in the regeneration kiln. Also the industrial practice of conditioning fresh
activated carbon using either tumbling or screening to remove undersized or imperfect
particles before being introduced into the processing circuit can also contribute to carbon
loss. Conditioning tends to minimise the possibility of gold being lost on undersized carbon
particles within the circuit, which ultimately ends up in the tailings. Another important
feature of carbons conditioning is that it often indicates how effective the production of the
activated carbon was carried out by the manufacturer (Avraamides, 1989).
With the increasing production of macadamia nuts globally, the disposal of waste shells has
created a serious problem for the nut processing industry. Australia’s contribution to the
global macadamia market was around 40%, which equates to 0.3 Mt of produce, with a
market value of AUS$150 million. This production level is about twice that of Hawaii and
South Africa combined. The trend in production figures clearly indicates a future increase of
around 10% annually and the associated waste problem is also expected to increase (Rural
Industries Research, 2009). Currently around 5 Mt of waste shells are annually used as fuel to
produce electricity for plant operations in the Gympie region of Queensland, Australia, thus
partially alleviating the waste problem (Ergon Energy, 2002). In an effort to reduce this
problem, the macadamia shell has been effectively converted to an activated carbon and
successfully used to remove organic contaminants in the primary stage molecular sieves and
it has also been used for adsorption of aqueous Cu2+ ions (Nguyen and Do, 1995, Toles et al.,
1998, Wartelle et al., 2000 and Wartelle and Marshall, 2001). One important and attractive
property of the macadamia shell is its high cracking pressure, which has the potential to
produce a durable activated carbon for gold adsorption.

The specific aims of this study were to first briefly review the carbon activation process and
secondly investigate the possibility of using granular macadamia shells as an activated carbon
source for Au absorption in an Au hydrometallurgical application. The experimental
investigation started with producing granular, CO2 activated carbon derived from macadamia
shells that were synthesised at several temperatures. Then the Brunauer, Emmett and Teller
(BET) surface area and microstructure were evaluated. The granular activated carbon samples
were then subjected to pre-abrasion, dry abrasion resistance and Au loading kinetics tests.
The performance of the samples were investigated and compared to the commercially
available coconut based (Haycarb) activated carbon. The activated carbon samples were also
characterised using Scanning Electron Microscopy (SEM), Energy Dispersive X-ray Analysis
(EDAX) and then elemental mapping of the activated carbon was carried out to determine the
location of the Au on the loaded samples.
Carbon activation and gold adsorption – a brief review
Activation process and mechanism
The procedure for creating an activated carbon product is based on a two-step process, the
first step is the carbonisation of the feedstock and the second step is the activation of the
carbon material. The carbonisation step is performed by heating the organic raw feedstock
material at temperatures below 800 °C in a continuous inert gas stream. This process
eliminates any volatile components that are present and also promotes porosity within the
material’s matrix. To improve the effectiveness of this process, usually commercial
manufacturers employ a pre-treatment step before carbonisation which involves the feedstock
being either impregnated or mixed with a dehydrating agent such as phosphoric acid, zinc
chloride or sulphuric acid (Serrano et al., 2004 and MacDonald and Quinn, 1996). During the

carbonisation step thermal decomposition of the carbonaceous material takes place which
eliminates non-carbon species such as oxygen, hydrogen and nitrogen. The result of the
thermal decomposition step is a carbonised mass with a rudimentary pore structure
(Yehaskel, 1978 and Yalcin and Arol, 2002). The residual elementary carbon atoms of the
carbonised mass are grouped into stacks of flat aromatic sheets that are cross-linked in a
random manner. The free interstices between these irregular aromatic sheets maybe filled
with tarry matter, products of decomposition, or partially blocked by disorganised carbon
(Bansal et al., 1988).
The activation step is usually carried out within the temperature range of 800–1100 °C in the
presence of a suitable oxidising agent such as steam, carbon dioxide, atmospheric air or a
combination of these gases (Zhang et al., 2004). In an industrial setting, the activating agent
is usually a combination of flue gas, the CO2 source and steam (Bansal et al., 1988). The
activation reaction occurs in two stages. In the first stage, the disorganised carbon is removed
by exposing the aromatic sheets to the action of the activation agent, which is described by
the endothermic reactions presented in Eqs. (1) and (2); (Bansal et al., 1988). The reaction by
the steam reacting with the carbon surface produces carbon monoxide, which is then followed
by the water to gas formation reaction Eq. (3), catalysed by the presence of the carbon
surface.
(1)
(2)
(3)

During the later stages of the activation process, the complete burnout of various
carbonaceous compounds and non-organised carbons within the pore volumes and from the
wall surfaces between adjacent pores produces a significant pore widening that result in the
formation of large sized pores. In addition, the spaces between the aromatic sheets also
become clear of the carbonaceous compounds and non-organised carbon to form a molecular
dimensioned porous structure, which greatly increases the internal surface area (Martinez et
al., 2006). Successful activation will produce a fine crystalline carbon product with an
interleaved system of pores with a very large internal surface area, which is highly dependent
on the processing conditions used and the original organic material matrix. However, the
exact procedures and process operations used for the commercial production of activated
carbons is a closely guarded secret by industrial manufacturers.
The effect of temperature on the values of ΔHo, ΔGo and log K used in Eqs. (1), (2) and (3) is
based on the HSC 6.1 software ( Roine, 2002). Although the endothermic reactions in Eqs.
(1) and (2) become more favourable at higher temperatures with K = 100.2–102.7 at 700–
1200 °C, the exothermic reaction in Eq. (3) becomes less favourable with K = 100–10−0.4 in
the same temperature range. Accordingly, the extent of activation will depend on the gas
employed, the temperature range used, the reaction times and related rates ( Yalcin and Arol,
2002). In addition, the factors that influence the pore volume, surface area and mean pore
diameter are the rate of heating during carbonisation, the final temperature and the activation
process time. When the degree of burn off is less than 50% a microporous structure is
produced in the activated carbon, while a mixed porous structure is produced when the
degree of burn off is between 50% and 75% ( Bansal et al., 1988). As a result, the different
types of activated carbons can be engineered to suit a particular specific application (
McDougall et al., 1981 and Marsden and House, 1993).

Pore structure
X-ray diffraction studies have confirmed the existence of two basic activated carbon
structures; the first consists of small regions of elementary crystallites composed of roughly
parallel layers of hexagonally ordered atoms, while the second consists of a disordered, cross
linked, spaced lattice of carbon hexagons (Marsden and House, 1993). The dimensions of the
elementary carbon are dependent on activation temperatures, but they typically vary from 0.9
to1.2 nm in height, 2.0 to 2.3 nm in width. The nano-crystallite structures are estimated to be
approximately three layers high, with widths equivalent to the diameter of the carbon
hexagons (McDougall and Hancock, 1980 and McDougall and Hancock, 1981).
The pore size distribution of activated carbon can be classified into three groups. The groups
are based on the size range of pore diameters found in activated carbon: the micropores are
less than 2 nm in size, the transition pores or mesopores range in size from 2 nm to 50 nm
and the macropores are greater than 50 nm (Dubinin, 1966). The porosity of activated carbon
is a very important property since it greatly influences the adsorption of aurocyanide. The
macropores provide passage to the micropores and access to the interior of the carbon matrix.
The micropores created during the activation process are responsible for the very large
surface area used for Au adsorption. Typically, activated carbons have BET surface areas in
the range from 500 to 1400 m2/g and the relative (%) contribution of each pore structure to
the total surface area and adsorption process vary in the order: macropores
(∼0%) < mesopores (5%) ≪ micropores (95%) (Lartey et al., 1999).
Gold adsorption mechanism
In the case of Au adsorption on activated carbons there are three rate dependent diffusion
mechanisms that have been proposed to account for the adsorption of Au based on contact
time and gold loading. These mechanisms are: (i) film diffusion (mass transport), (ii) pore
diffusion, and (iii) surface diffusion (Muir, 1982, Nicol et al., 1984a, Nicol et al., 1984b,
Jones et al., 1988, Jones et al., 1989, Le Roux et al., 1991, Demopoulos and Chen, 2004,
Pleysier et al., 2008 and Dai et al., 2008). The initial rate of Au cyanide adsorption is rapid,
with adsorption occurring at the most accessible sites in the macropores and possibly the
mesopores. Under these conditions the rate is controlled by the film diffusion (mass
transport) of Au cyanide species onto the carbon surface. However, with time the diffusion
rate decreases as equilibrium is approached. Once adsorption capacity has been achieved in
the macropores and mesopores, a pseudo-equilibrium is established beyond which adsorption
must take place in the micropores (Marsden and House, 1993). The diffusion of gold cyanide
species onto the micropores structures within the carbon structure is a much slower process,
since the boundary layer or film diffusion process is complicated by the length and
tortuosities of the inherent pore structures. This phenomenon has been confirmed by detailed
micro-tomography studies which indicate that there is poor diffusion of gold cyanide within
micropores. The findings of these studies exclude the contribution made by pore diffusion to
the rate limiting mechanisms and support a surface diffusion mechanism at higher gold
loadings (Pleysier et al., 2008 and Dai et al., 2008).
Gold adsorption sites
Due to the rapid adoption of the carbon-based technology in the Au Industry, several studies
have been conducted to elucidate the exact location of Au adsorption sites on activated

carbon surfaces, producing differing results. Studies have found that the aurocyanide
complex adsorbs onto the microporous structure of the activated carbon as an ion-pair
(Gross and Scott, 1927, Davidson, 1974, McDougall et al., 1981, Adams,
1990, Adams et al., 1987, Adams et al., 1992 and Adams et al., 1995). Whilst the functional
groups developed during the activation process are also responsible for the adsorption of the
Au complex onto the carbon surface (Tsuchida and Muir, 1986a and Tsuchida and Muir,
1986b). In addition, Mössbauer spectroscopy studies have supported the view that the
aurocyanide anion adsorbs to the surface through one of the cyanide ligands attaching to the
carbon substrate (Cashion et al., 1988 and Kongolo et al., 1990). Furthermore, to probe the
exact chemical state of the adsorbate, both X-ray photoelectron spectroscopic (XPS) and infra
red (IR) studies have indicated that the aurocyanide ion adsorbs onto small graphitic plates in
the activated carbon as an intact complex ion with a partial transfer of electrons to the gold (I)
ion (Klauber, 1991 and Ibrado and Fuerstenau, 1995). Other studies have focused on the
activity and influence of the graphitic component using a 14C labelled aurocyanide on highly
orientated pyrolytic graphite (HOPG), these studies revealed that Au adsorption
predominantly occurred on edge planes (Sibrell and Miller, 1992). Similar studies of
aurocyanide adsorption on HOPG in the presence of Ca2+ using novel in situ scanning
tunnelling microscopy, was able to atomically resolved clusters of Au that were
predominantly found on the graphite basal and edge planes ( Poinern and Thurgate, 2003). In
addition, other atomically-sized filamentous structures have been located on the HOPG
surface in contact with a Au cyanide solution (Poinern et al., 1998).

Carbon activity and gold loading
Carbon activity is a generic term used in industry to express the rate of Au cyanide adsorption
onto an activated carbon substrate. This term determines the amount of carbon required in
each adsorption tank, the contact time (controlled by the flow rates and tank size), gold
inventory and overall plant efficiency (Fleming, 1982). Mathematically, Eqs. (4) and (5) can
be used to determine the rate constant (k ) and equilibrium constant (K ), using batch
experiments where the gold concentration is continuously changing. These constants can then
be used in Eq. (6) to describe the rate of gold loading of the activated carbon in each stage of
a typical CIP plant, where the gold concentration in solution is constant ( Fleming et al.,
1980, Nicol et al., 1984a, Nicol et al., 1984b and Fleming et al., 2011).
(4)
(5)
(6)
(7)
(8)
where [Au]s is the concentration of gold in solution at time t , [Au]c the
concentration of gold on the carbon at time t , [Au]s ,0 the concentration of gold at t = 0,
[Au]c ,0 the concentration of gold in the carbon at t = 0, the change in gold loading
onto carbon from time zero to t, Mc the mass of the carbon, Ms the mass of the solution, k, k′
the rate constant, K the equilibrium constant, n is the empirical constant.
The carbon activity for Au adsorption can also be expressed by an empirical rate constant (k′)
which is based on batch experiments and is presented in Eqs. (7) and (8). This is a common
alternative approach used for the purpose of comparing different types of activated carbon,
fouling of the activated carbon and the effect of dewatering reagents ( La Brooy and Bax,
1985, La Brooy et al., 1986 and Salarirad and Behamfard, 2011). In addition, several studies
of various kinetic models have confirmed that Eq. (7) is more than adequate to model
experimental data over an 8 h period ( Le Roux et al., 1991).
Experimental
Materials
All chemicals, including the gold complex [KAu(CN)2] were purchased from Sigma–Aldrich
and used without further purification. The Suncoast Gold Macadamia Company, Queensland,
Australia, supplied raw macadamia nutshells. The broken shell pieces were approximately 1
to 2 cm in size and were manually cleaned to remove any remaining nut fragments and other
contaminants. All aqueous solutions used throughout the process procedure were prepared
using Milli-Q® water (18.3 MΩ cm−1). The gases used in processing the macadamia nut
shells were high purity (AR Grade) nitrogen (N2) and carbon dioxide (CO2), which were
used in the carbonisation and activation stages, respectively.

Carbonisation and activation
The cleaned shell pieces were placed into individual porcelain boats and weighed before
being placed into the furnace for carbonisation (mass of macadamia shells was 608.83 g and
the mass of coconut shells was 476.52 g). A continuous stream of N2 gas was then passed
through the furnace, which was set to a thermal treatment temperature of 500 °C. Both sets of
shells were heat treated in the furnace at the same time. After the shells were carbonised, they
were then allowed to slowly cool down to room temperature in the N2 gas stream to ensure
the integrity of the carbon produced. When the shells had cooled down to room temperature,
they were then removed from the furnace and weighed to determine the mass loss (Table 1).
After heat treatment the carbonised macadamia and coconut shells were then weighed out
into 2 g samples and then placed into porcelain boats. A total of 60 boats were prepared, the
number being equally split between the two materials.
The activation step consisted of placing the porcelain boats and carbonised shells into a pre-
heated furnace. Activation was conducted at set temperatures ranging from 500 °C to
1200 °C in the presence of a continuous stream of CO2 gas for 10 min. After thermal
treatment, the activated carbon samples were then permitted to slowly cool down to room
temperature in the CO2 gas stream to ensure the integrity of the activated product.
Abrasion and surface area tests
A standard industry based test (ASTM, 2011) was used to evaluate the abrasion properties of
the granulated activated carbons produced. A dry 50 g sample of activated carbon was pre-
abraded for 10 min on a standard 1 mm mesh 200 mm diameter sieve using a 20 mm stainless

steel ball and a sieve shaker (Ro-Tap). The oversized (+1 mm) carbon material was found to
be 30 mg; this material was then subjected to a further 60 min of abrasion in the sieve shaker.
The abrasion resistance was calculated by entering the mass of oversized carbon particles
(mOversize) and the mass of the undersize particles (mUndersize) into Eq. (9). In addition, the
activated carbon pore porosity and surface area measurements were performed using a
Quantachrome Autosorb-1 Tristar V4 3000 analyser.
(9)
Adsorption of gold cyanide
A 1000 mg/L stock solution of [KAu(CN)2] was prepared and then the pH was adjusted to
10.5. Then 1 g of activated carbon was placed into a 100 mL solution of the [KAu(CN)2]
stock solution and was permitted to soak in the stirred solution. Subsequently over the next 8
or 40 h 5 ml aliquots of the solution were regularly taken and examined to determine the
concentration of residual Au (I) remaining in the solution. The aliquot samples were
examined using inductively coupled plasma (ICP) analysis, which was performed using a
Vista ICP-OES Varian System. In addition, a commercially available coconut based activated
carbon (Haycarb) was also used in the adsorption tests as a control. The adsorption results of
both the Haycarb and the macadamia shell derived granular activated carbon manufactured at
various temperatures were analysed.
SEM characterisation
The porous nature and surface structure of the macadamia shell based activated carbons were
examined at various stages of manufacture using Scanning Electron Microscopy (SEM). The

samples were filtered, washed and then dried at 200 °C for 2 h before being examined using a
Phillips XL-30 SEM operating with a 30 kV electron source. Unless otherwise stated, none of
the samples were Au coated, since this would have interfered with the process of locating Au
complexes on the sample surfaces. Furthermore, all energy dispersive X-ray analysis
(EDAX) images and spectrum were produced by an Oxford Instruments EDS model 6650
analyser using Inca software to determine the presence of Au complexes and other elements
of interest
Results and discussion
4.1. Carbonisation
Table 2 presents the results of the comparative study between carbonised macadamia and
coconut shells. Under the same carbonising conditions, coconut shells and macadamia shells
gave conversion yields of 23% and 32%, respectively. The results have demonstrated that the
coconut shells contain large amounts of volatile, non-carbon species that decompose to give a
lower carbon yield than carbonised macadamia. However, the carbonisation process alone
does not give rise to a carbon product with a high adsorption capacity. It also depends on
other properties such as a well-developed pore structure and a high BET surface area, which
can greatly improve the adsorption capacity of the activated carbon, see Table 1.
Activation and pore structure
The SEM images of the activated macadamia shells produced at various temperatures ranging
from 700 °C to 1000 °C in the presence of a CO2 gas atmosphere. The electron microscopy
images presented in Fig. 1 reveal randomly distributed pore structures for activated

macadamia and commercially available coconut based carbons. Interestingly, the BET
surface areas for CO2 activated carbonised macadamia shells in the temperatures range from
600 °C to 1100 °C are significantly lower than those of similarly activated coconut shells
(Table 2). However, for activated carbonised macadamia shells there is generally an
increasing trend in surface area with increasing activation temperature. Evidence of large
internal surface areas in the microporous structures within the activated carbonised
macadamia shells is presented in Fig. 1. The SEM image in Fig. 1b presents a cross section of
an internal tubular structure and the presence of numerous inner micropores. Comparing the
activated carbonised macadamia shell images presented in Fig. 1a and b with the images of
activated coconut shells presented in Fig. 1c and d we can see that there is a highly
microporous structures in both activated carbons which can provide the maximum number of
possible Au loading sites.
Table 2 presents values for surface area, micro-porosity, meso-porosity, total pore-volume,
micropore volume and average pore diameter for both the activated macadamia shells and the
activated coconut shells. The study indicates that the burn off rate of the reactive components
present in the macadamia shell based carbon during the 10 min activation period is much
faster at higher temperatures than those at lower temperatures. This results in a much larger
surface area and significantly larger micro-porosity being produced at higher temperatures. It
is also evident that micropores are far more dominant at the higher temperatures, while at
lower temperatures with a lower burn off rate the mesopores are present in the carbon
structure. Thus increasing the activation temperature increases the total pore volume and
decreases the average pore diameter in the activated carbonised macadamia shells (Table 2).

Carbonised macadamia shells activated at higher temperatures have a slightly larger average
pore diameter than those of commercial available activated coconut shells (Table 2). This
indicates that for both activated carbon materials the burn off of volatile materials at the
respective activation temperatures only allows the formation of micropores and does not
promote meso-pore or macropore formation. The ratio of micropore volume/total surface area
in the temperature range from 600 °C to 1100 °C for activated carbonised macadamia shells
calculated from results presented in Table 2 is between 0.87 and 0.97. This value is higher
than those reported for steam/KOH activated fir woods or pistachio based carbons, which are
between 0.70 and 0.94 (Wu et al., 2005). Likewise, the average pore diameter of activated
carbonised macadamia shells is between 1.77 and 2.41 nm (see Table 2), which is generally
smaller than those of steam/KOH activated fir woods or pistachio based carbons that are
between 2.20 and 2.90 nm (Wu et al., 2005).
The surface area results of the commercially available activated coconut shells are listed in
Table 2. These results indicate that the activated coconut shells had the largest micropore
area, the largest total internal surface area and the largest total pore volume of the activated
carbons tested in this study. The commercially available activated coconut carbons are
predominantly activated using steam, which may be responsible for the greater micro-
porosity. These results have clearly demonstrated that steam activated coconut carbons have a
high adsorption capacity, and hence are extensively used by the Au industry. The presence of
a large micropore area and a low meso-pore area indicates that the burn off of volatile
components for these activated carbons is between 50% and 75% (Table 2). The significant
difference in surface area between the two types of activated carbons presented in Table 2
could be due to several factors employed by the commercial manufacturers of activated
coconut shells. These factors include activation temperature, thermal treatment time, gaseous

atmosphere (steam and/or CO2) used for activation and the pre-treatment of the carbonised
coconut shells with dehydrating agents before activation (Section 2.1).
Gold adsorption
The results of the 8 h Au adsorption study involving both the activated carbonised
macadamia shells and commercially available carbonised coconut shells are summarised for
comparative purposes in Table 3. Fig. 2 presents the logarithmic plots of as a
function of time for both the activated carbonised macadamia shells and commercially
available carbonised coconut shells. Both plots exhibit linear behaviour, with the values of k’
and n being based on the slopes and y-intercepts of the curves of best fit (Eq. (8)). These
values are listed in Table 3; inspection of these values reveals that the macadamia based
activated carbon n value is close to unity for activation temperatures in the range of 800–
1000 °C. The CO2 activated macadamia based k′ value reaches a maximum of 23.4 h−1 at
1000 °C, while the activated coconut shell based carbon reached a maximum value at
14.5 h−1. The increase in the k′ value with increasing activation temperature is generally
consistent with the increase in surface area, see Table 2 and Table 3. A comparison of Au
adsorption data is made between activated macadamia based carbon and coconut based
carbon at the activation temperatures of 1000 °C and 1100 °C over a 40 h period in Fig. 3.
The data indicates that the Au adsorption capacity of activated macadamia shell based carbon
is comparable with that of activated coconut shell based carbon.
A sample of Au loaded macadamia shell based carbon activated at 1000 °C was further
analysed using SEM and EDAX. The SEM images are presented in Fig. 4a and b: while the

EDAX analysis revealed the presence of Au on the loaded sample, see Fig. 4d, the absence of
Au on the unloaded macadamia shell based carbon was confirmed in Fig. 4c. Furthermore,
elemental mapping of the carbon surface and identification of Au sites were conducted on the
Au loaded macadamia shell based carbon. The presence of adsorbed Au on the surface of the
macadamia shell based carbon can be easily seen in the EDAX spectra, Fig. 4d. The Au
deposits were not just restricted to the macroscopic features, which could be easily identified
within the instrument resolution (1 mm to 0.5 μm), but they were widely distributed
throughout the structure as seen in Fig. 5c. These results are consistent with micro-
tomography studies of Dai et al., which reveal a uniform distribution of Au throughout the
carbon structure of activated carbon materials (Dai et al., 2008).
Abrasion resistance
Typical pre-abrasion test results for a good activated carbon are generally around 95–99%;
however, values lower than 95% are generally considered of lower quality for use in most
CIP processes. Abrasion percentage values between 89% and 92% are still considered to be
reasonably satisfactory; while an abrasive percentage of 75% or less represents a
softer/poorer quality activated carbon (Marsh, 2001). Pre-abrasion and dry abrasion test
results for macadamia shell based and coconut based activated carbons carried out in this
study are presented in Table 4. It demonstrates that in the case of CO2 activated macadamia
shell based carbons, (activated at 800 °C) a softer than the commercially available steam
activated coconut shell based carbon (Haycarb) is produced. The results also indicate that the
preliminary preparation procedure used in the manufacture of the granular activated
macadamia shell based carbon in this study requires further optimisation in order to improve
the hardness of the carbon product and hence make it a commercially viable commodity.

Conclusions
This preliminary research project has revealed that activated macadamia shell based carbons
have a strong affinity for the Au (I) complex and have the potential to adsorb significant
levels, which makes this granular product comparable with the currently used coconut based
adsorbents. Furthermore, if the naturally inherent higher strength of the macadamia shell,
compared to the coconut shell, could be translated into an effective activated carbon product,
(via optimisation of activation parameters) then the macadamia shell could be an attractive
alternative or a complementary supplement to the coconut shell based carbons that is
currently being used in the Au extraction industry.
Acknowledgements
The authors would like to thank Suncoast Gold Macadamias (Aust) Ltd. from Gympie
Queensland, Australia for supplying raw macadamia shells. The authorsa would like to
express their appreciation to Dr F. Jones for assistance with the initial SEM analysis.
References
Adams, M.D., 1990. The mechanism of adsorption of aurocyanide onto activated carbon, 1. Relation between the effects of oxygen and ionic strength. Hydrometallurgy 25, 171–184.
Adams, M.D., McDougall, G.J., Hancock, R.J., 1987. Models for the adsorption of aurocyanide onto activated carbon. Part II: Extraction of aurocyanide on pairs by polymeric adsorbents. Hydrometallurgy 18, 139– 154.
Adams, M.D., Friedl, J., Wagner, F.E., 1992. The mechanism of onto activated carbon. Hydrometallurgy 31, 265–275.
Adams, M.D., Friedl, J., Wagner, F.E., 1995. The mechanism of adsorption of aurocyanide on to activated carbon, 2. Thermal stability of the adsorbed species. Hydrometallurgy 37, 33–45.

Ahmadpour, A., Do, D.D., 1997. The preparation of activated carbon from macadamia nutshell by chemical activation. Carbon 35, 1723–1732.
ASTM, 2011. Active standard ASTM D3802 – 10. Standard test for ball pan hardness of activated carbon.
Avraamides, J., 1989. CIP carbons – selection, testing and plant operations. In: Bhappu, R.B. and Harden, R.J. (Eds.), Gold Forum on Technology and Practices - World Gold 89, Chapter 34, SME. Littleton, Colorado, 288-292.
Bansal, R.C., Donnet, J.B., Stoeckli, F., 1988. Active Carbon. Marcel Dekker, New York, 119–162.
Cashion, J.D., McGrath, A.C., Volz, P., Hall, J.S., 1988. Direct analysis of gold species on activated carbon by Mössbauer spectroscopy. Trans. Inst. Min. Metall. C 97, C129–C133.
Dai, X., Breuer, P.L., Jeffrey, M.I., 2008. Microtomography based identification of the mechanisms of gold adsorption onto activated carbon and modelling. In: Young, A.C., Taylor, P.R., Anderson, C.G., Chi, Y. (Eds.), Hydrometallurgy 2008 – 6th International Symposium, SME, Littleton, pp. 696–705.
Davidson, R.J., 1974. The mechanism of gold adsorption in activated charcoal. J. South Afr. Inst. Min. Metall. 75, 67–76.
Demopoulos, G.P., Chen, T.C., 2004. A case studyof CIP tails slurry treatment comparison of cyanide recovery to cyanide destruction. Eur. J. Miner. Proc. Environ. Protect. 4 (1), 1–9.
Dubinin, M.M., 1966. Porous structure and adsorption properties of active carbons. Chemistry and Physics of Carbon, vol. 2. Marcel Dekker, New York.
El-Geundi, M.S., 1997. Adsorbents for industrial pollution control. Adsorpt. Sci. Technol. 15, 777–787.
Ergon Energy, 2002. Environmental Report. <http://www.ergon.com.au/_data/assests/pdf_file/0015/6405/2002- Enviromental-Report.pdf>.
Fleming, C.A., 1982. Some aspects of the chemistry of carbon-in-pulp and resin-in-pulp processes. Carbon-in- pulp Technology for the Extraction of Gold. Aus.IMM, Melbourne, pp. 415–440.
Fleming, C.A., 1998. Thirty years of turbulent change in the gold industry. CIM Bull. 91, 55–67.
Fleming, C.A., Nicol, M.J., Nicol, D.J., 1980. The optimization of a carbon-in-pulp adsorption circuit based on the kinetics of extraction of aurocyanide by activated carbon. In: Presented at Mintek Meeting Ion Exchange and Solvent Extraction in Mineral Processing. February, Randburg, Mintek.
Fleming, C.A., Mezei, A., Bourricaudy, E., Canizares, M., Ashbury, M., 2011. Factors influencing the rate of gold cyanide leaching and adsorption on activated carbon, and their impact on the design of CIL and CIP circuits. Miner. Eng. 24, 484–494.
Gadkaree, K.P., 1997. Carbon honeycomb structures for adsorption applications. In: Marsh, H. (Ed.), Activated carbon compendium. Elsevier Science Ltd., Oxford UK, pp. 15–23, 2001.
Gross, J., Scott, J.W., 1927. Precipitation of gold and silver from cyanide solution on Charcoal, US Bureau of Mines, Technical Paper No. 378.
Hayashi, J., Yamamoto, N., Horikawa, T., Muroyama, K., Gomes, V.G., 2005. Preparation and characterisation of high-specific-surface-area activated carbons from K2CO3-treated waste polyurethane. J. Colloid. Interf. Sci. 281, 437–443.
Ibrado, A.S., Fuerstenau, D.W., 1995. Infrared and X-ray photoelectron spectroscopy studies on the adsorption of gold cyanide on activated carbon. Miner. Eng. 8, 441–458.

Johnson, W.D., 1894. US Patent 522, 260.
Jones, W.G., Klauber, C., Linge, H.G., 1988. The adsorption of gold cyanide onto activated carbon. Randol Gold Forum’88 Perth. Randol International, Golden, Co, pp. 243–248.
Jones, W.G., Klauber, C., Linge, H.G., 1989. Fundamental aspects of gold cyanide adsorption on activated carbon. World Gold’89. SME, Littleton, Co, pp. 278-281.
Khalili, N.R., Campbell, M., Sandi, G., Golas, J., 1999. Production of mirco- and mesopores activated carbon from paper mill sludge I. Effect of zinc chloride activation. In: Marsh, H. (Ed.), Activated Carbon Compendium. Elsevier Science Ltd, Oxford UK, pp. 3–13 (2001).
Klauber, C., 1991. X-ray photoelectron spectroscopic study of the adsorption mechanism of aurocyanide onto activated carbon. Langmuir 7, 2153–2159.
Kongolo, K., Bahr, A., Friedl, J., Wagner, F.E., 1990. 197Au Mossbauer studies of the gold species on carbons from cyanide solutions. Metall. Mater. Trans. B 21, 239–249.
La Brooy, S.R., Bax, A.R., 1985. Fouling of activated carbon by organic reagents. In: Proceedings of the 13th Australian Chemical Engineering Conference, Perth, Western Australia, pp. 187–191.
La Brooy, S.R., Bax, A.R., Muir, D.M., Hosking, J.W., Hughes, H.C., Parentich, A., 1986. Fouling of activated carbon by circuit organics. In: Fivaz, C.E., King, R.P., (Eds.), Gold 100. J. S. Afr. Inst. of Min. Metall, Johannesburg, South Africa, pp. 123–132.
Ladeira, A.C.Q., Figueira, M.E.M., Ciminelli, V.S.T., 1993. Characterisation of activated carbons utilised in the gold industry: physical and chemical properties and kinetic study. Miner. Eng. 6, 585–596.
Lartey, R.B., Acquah, F., Nketia, K.S., 1999. Developing National Capability for Manufacture of Activated Carbons from Agricultural Wastes. Ghana Engineer, p. 76.
Le Roux, J.D., Bryson, A.W., Young, B.D., 1991. A comparison of several kinetic models for the adsorption of gold cyanide onto activated carbon. J. South Afr. Inst. Min. Metall. 91, 95–103.
MacDonald, J.A.F., Quinn, D.F., 1996. Adsorbents for methane storage made by phosphoric acid activation of peach pits. Carbon 34, 1103–1108.
Marsden, J., House, I., 1993. The Chemistry of gold extraction, Series in Metals and Associated Materials. Ellis Horwood Limited, New York.
Marsh, H., 2001. Activated Carbon Compendium. Elsevier Science Ltd., Oxford UK.
Martin, M.J., Artola, A., Balaguer, M.D., Rigola, M., 2002. Towards waste minimisation in WWTP: activated carbon from biological sludge and its application in liquid phase adsorption. J. Chem. Technol Biot. 77, 825–833.
Martinez, M.L., Torres, M.M., Guzman, C.A., Maestri, D.M., 2006. Preparation and characteristics of activated carbon from olive stones and walnut shells. Ind. Crop Prod. 23, 23–28.
McDougall, G.J., Hancock, R.D., 1980. Activated carbons and gold – a literature survey. Miner. Sci. Eng. 12, 85–89.
McDougall, G.J., Hancock, R.D., 1981. Gold complexes and activated carbon. Gold Bull. 14, 138–153.
McDougall, G.J., Hancock, R.D., Nicol, M.J., Wellington, O.L., Copperthwaite, R.G., 1981. The mechanism of the adsorption of gold cyanide on activated carbon. J. South Afr. Inst. Min. Metall. 80, 344–356.
Muir, D.M., 1982. Recovery of gold from cyanide solutions using activated carbon: A review. In: Carbon in Pulp technology for the extraction of gold 1982, Aus. IMM, Melbourne, pp. 7–22.
Muir, D.M., 1991. Principles and applications of carbon technology for gold recovery. In: Proceedings China Gold Conference, Tsingdao.
Nguyen, C., Do, D.D., 1995. Preparation of carbon molecular sieves by macadamia nutshells. Carbon 33, 1717– 1725.
Nicol, M.J., Fleming, C.A., Cromberge, G., 1984a. The adsorption of gold cyanide onto activated carbon. 1. The kinetics of adsorption from pulps. J. South Afr. Inst. Min. Metall. 84, 50–54.
Nicol, M.J., Fleming, C.A., Cromberge, G., 1984b. The adsorption of gold cyanide onto activated carbon. 2. Application of the kinetic model to multistage adsorption circuits. J. South Afr. Inst. Min. Metall. 84, 50–54.
Pleysier, R., Dai, X., Wingate, C.J., Jeffrey, M.I., 2008. Microtomography based identification of gold adsorption mechanisms, the measurement of activated carbon activity, and the effect of frothers on gold adsorption. Miner. Eng. 21, 453–462.
Poinern, G., Thurgate, S., 2003. Recovery of gold from its ores: an STM investigation of the adsorption of the aurocyanide ion onto highly orientated pyrolytic graphite. In: Wandelt, K., Thurgate, S. (Eds.), Solid- Liquid Interfaces, Topics Applied Physics, vol. 85. Springer-Verlag, Berlin Heidelberg, pp. 113–138.
Poinern, G., Thurgate, S.M., Kirton, G., Ritchie, I.M., 1998. Adsorption of dicyanoaurate (I) ions on highly oriented pyrolytic graphite 134. Appl. Surf. Sci., 73–77.
Roine, A., 2002. Outokumpu HSC Chemistry Thermochemical Database, ver 6.1. Finland: Outokumpu Research Oy. Rural Industries Research and Development Corporation, 2009. <http://www.ridc.gov.au/programs/established-rural-industries/pollination/macadamia.cfm>.
Salarirad, M.M., Behamfard, A., 2011. Fouling effect of different flotation and dewatering reagents on activated carbon and sorption kinetics of gold. Hydrometallurgy 109, 23–28.
Serrano, V.G., Cuerda-Correa, E.M., Fernandez-Gonzalez, M.C., Alexandre-Franco, M.F., Macias-Garcia, A., 2004. Preparation of activated carbons from chestnut wood by phosphoric acid-chemical activation Study of microporosity and fractal dimension. Mater. Lett. 59, 846–853.
Sibrell, P.L., Miller, J.D., 1992. Significance of graphitic structural features in gold adsorption by carbon. Miner. Metall. Process. 9, 189–195.
Smisek, M., Cerny, S., 1970. Active Carbon. Elsevier, New York.
Tancredi, N., Medero, N., Möller, F., Piriz, J., Plada, C., Cordero, T., 2004. Phenol adsorption onto powdered and granular activated carbon, prepared from eucalyptus wood. J. Colloid Interf. Sci. 279, 357–363.
Teng, H., Ho, J.A., Hsu, Y.F., 1997. Preparation of activated carbon from bituminous coals with CO2 activation – influence of coal oxidation. In: Marsh, H. (Ed.), Activated carbon compendium. Elsevier Science Ltd., Oxford UK, pp. 15–23 (2001).
Toles, C.A., Marshall, W.E., Johns, M.M., 1998. Phosphoric acid activation of nutshells for metals and organic remediation: process optimization. J. Chem. Technol. Biot. 72, 255–263.
Tsuchida, N., Muir, D.M., 1986a. Potentiometric Studies on the adsorption of and onto activated carbon. Metall. Trans. B 17, 523–528.

Tsuchida, N., Muir, D.M., 1986b. Studies on the role of oxygen in the adsorption of and onto activated carbon. Metall. Trans. B 17, 529–533.
Wartelle, L.H., Marshall, W.E., 2001. Nutshells as granular activated carbons: physical, chemical and adsorptive properties. J. Chem. Technol. Biot. 76, 451–455.
Wartelle, L.H., Marshall, W.E., Toles, C.A., Johns, M.M., 2000. Comparison of nutshell granular activated carbons to commercial adsorbents for the purge-and-trap gas chromatography of volatile organic compounds. J. Chromatogr. A 879, 169–175.
Wu, F.C., Tseng, R.L., Juang, R.S., 2005. Comparisons of porous and adsorption properties of carbons activated by steam and KOH. J. Colloid. Interf. Sci. 283, 49–56.
Yalcin, M., Arol, A.I., 2002. Gold cyanide adsorption characteristics of activated carbon of non-coconut shell origin. Hydrometallurgy 63, 201–206.
Yehaskel, A., 1978. Activated Carbon Manufacture and Regeneration. Noyes Data Corporation, New Jersey, USA.
Zabaniotou, A., Maday, P., Oudenne, P.D., Jung, C.G., Delplancke, M.P., Fontana, A., 2004. Active carbon production from used tyre in two-stage procedure: industrial pyrolysis and bench scale activation with H2O–CO2 mixture. J. Anal. Appl. Pyrol. 72, 289–297.
Zadra, J.B., Engel, A.L., Heinen, H.J., 1952. RI 4843, US Bureau of Mines.
Zhang, T., Walawender, W.P., Fan, L.T., Fan, M., Daugaard, D., Brown, R.C., 2004. Preparation of activated carbon from forest and agricultural residues through CO2 activation. Chem. Eng. J. 105, 53–59.

Table 1. Carbonisation yields and BET surface areas of macadamia and coconut shells heat treated at 500 °C in N2 atmosphere.
Carbon source Macadamia shells Coconut shells
Before carbonisation (g) 608.83 476.52
After carbonisation (g) 194.89 110.71
Percentage yield (%) 32 23
Surface area (m2/g) 190 ± 7.7 178 ± 7.7
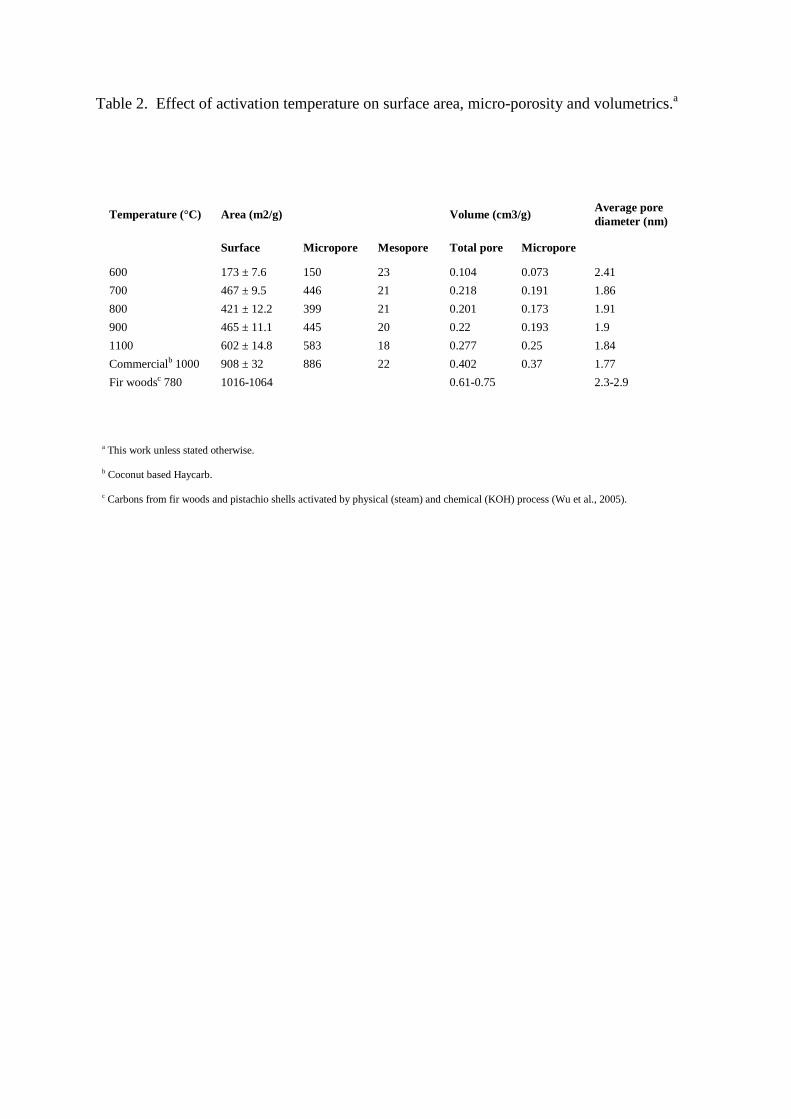
Table 2. Effect of activation temperature on surface area, micro-porosity and volumetrics.a
Temperature (°C) Area (m2/g) Volume (cm3/g) Average pore diameter (nm)
Surface Micropore Mesopore Total pore Micropore 600 173 ± 7.6 150 23 0.104 0.073 2.41 700 467 ± 9.5 446 21 0.218 0.191 1.86 800 421 ± 12.2 399 21 0.201 0.173 1.91 900 465 ± 11.1 445 20 0.22 0.193 1.9 1100 602 ± 14.8 583 18 0.277 0.25 1.84 Commercialb 1000 908 ± 32 886 22 0.402 0.37 1.77 Fir woodsc 780 1016-1064
0.61-0.75
2.3-2.9
a This work unless stated otherwise. b Coconut based Haycarb. c Carbons from fir woods and pistachio shells activated by physical (steam) and chemical (KOH) process (Wu et al., 2005).

Table 3. Effect of CO2-activation temperature on gold adsorption onto macadamia-based carbon.
Time (h) CO2-activation temperature (°C) Commerciala
1000
500 600 700 800 900 1000 1100 1200 Residual gold concentration (mg/L) 0 67 67 67 67 67 67 67 67 67 1 65 65 63 62 58 54 58 59 58 2 59.8 60.8 58.9 55.1 51.3 45.6 52.3 55.1 52.3 3 58.5 58.5 55.8 53.1 46.8 41.4 48.6 50.4 48.6 4 55.3 55.3 51 49.3 44.2 37.4 45.9 47.6 44.2 5 52 52 48.8 46.4 38.4 32.8 42.4 44 40.8 6 48 47.3 45 42.7 35.3 30 39 40.5 37.5 7 44.8 44.1 41.3 38.5 31.5 26.6 35.7 37.1 33.6 8 42.3 40.9 39 35.7 29.3 24.7 33.2 34.5 31.2 Values of k’ and n(Eq. 8) log k′ 0.54 0.51 0.78 0.93 1.17 1.37 1.17 1.08 1.16 k′ (h−1) 3.5 3.2 6 8.5 14.8 23.4 14.8 12 14.5 N 1.35 1.41 1.17 1.09 1.01 0.93 0.89 0.94 0.96 R2 0.98 0.99 1 0.98 0.99 0.99 0.99 0.99 0.99
a Coconut based (Haycarb).

Table 4. Pre abrasion and dry abrasion resistance of activated carbon materials.
Sample Particle size (mm)
Pre dry abrasion percent
Dry abrasion percentage
Macadamia 800 °C +1.00 mm 90 73
Commerciala +1.00 mm 98 93
a Coconut based (Haycarb).

Fig. 1. SEM images of CO2 activated macadamia and commercially available coconut based carbons (activation temperature for both was 1000 °C): Macadamia (1a) 20 μm scale bar and (1b) 10 μm scale bar coconut (1c) 50 μm scale bar and (1d) 5 μm scale bar.

Fig. 2. Comparison of logarithmic plots of as a function of time for the macadamia-based granular carbon activated at 1000 °C (circles) and the coconut-based granular carbon (triangles) over a 8 h batch testing procedure (Table 3).
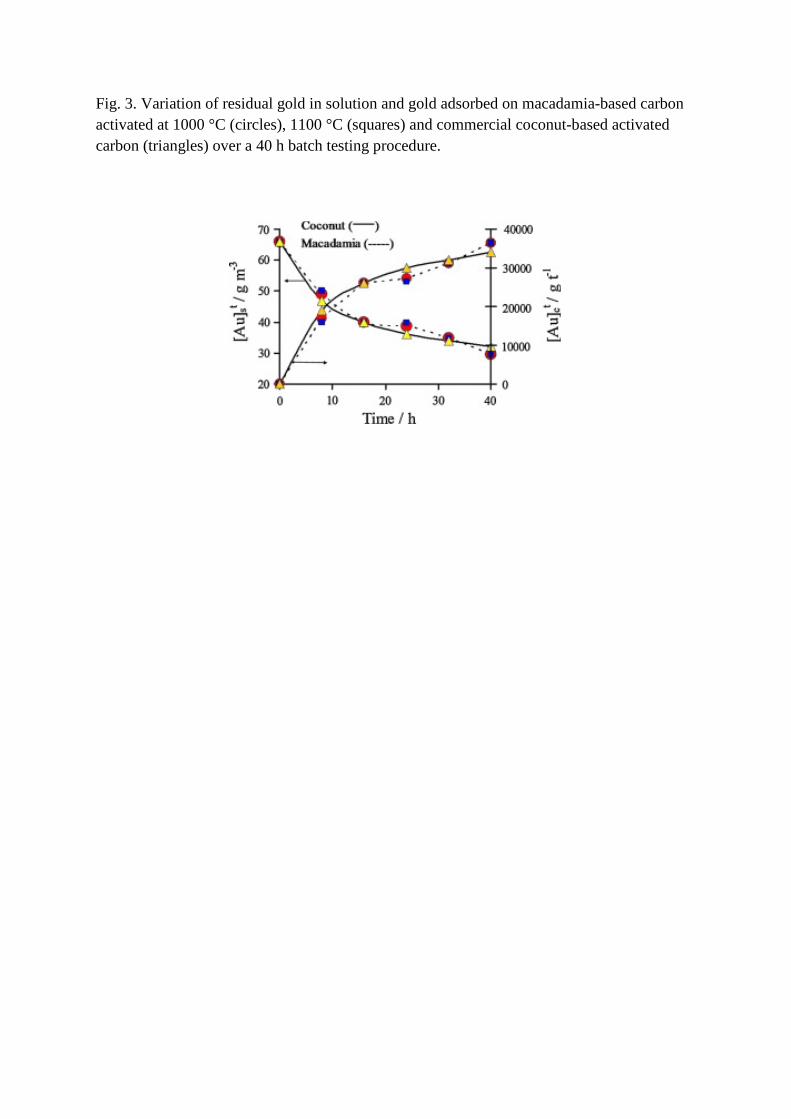
Fig. 3. Variation of residual gold in solution and gold adsorbed on macadamia-based carbon activated at 1000 °C (circles), 1100 °C (squares) and commercial coconut-based activated carbon (triangles) over a 40 h batch testing procedure.

Fig. 4. SEM and EDAX analysis of gold loading in a typical macadamia-based carbon: (a) SEM image of unloaded gold sample – 100 μm scale bar. (b) SEM image of gold loaded sample – 50 μm scale bar. (c) EDAX analysis of unloaded sample. (d) EDAX analysis of loaded sample.

Fig. 5. Gold loading in macadamia shell based carbon activated at 1000 °C in CO2 atmosphere: (a) SEM image of unloaded gold sample – 100 μm scale bar. (b) Elemental mapping of carbon sample. (c) EDAX spectrum analysis of gold loaded sample. (d) Elemental mapping of carbon clearly showing the wide distribution of gold in the carbon matrix.