municipal sanitation plans in brazil: analysis of plans...
TRANSCRIPT

Page 1 of 17
Municipal Sanitation Plans in Brazil: Analysis of Plans and Recommendations to improve planning sanitation in Brazil
Rafaella Oliveira Baracho/Graduate student of University of Brasília, and Rita Claire Klees/University of Colorado Boulder
Abstract: The main goal of this study is improving the planning of sanitation services in Brazil, by analyzing some Municipal Sanitation Plan (MSP) of Paraná State which are representative of MSPs in Brazil. The methodology was apply a set of check-lists to evaluate the following categories: Universal Access, Equity, Policy/Sectorial, “Municipal Policy of Sanitation”, Management Capacity, Drinking Water, Sewage, Urban Drainage, and Urban Waste Management. As conclusions, the MSPs vary in quality and comprehensiveness. While each MSP has positive features, none completely meet the legal requirements. The main problem is the concept does not appear in any part of the MSP. Key-words: sanitation, sanitation planning, Brazil.
Introduction
On Brazil, basic sanitation is defined by the Public Law 2007-11.445 (the Sanitation Act), as a set of services, infrastructures, and operational activities of drinking water providing, sewage, solid waste management and urban cleaning, and urban drainage and rain water management.
The Sanitation Act establishes the national guidelines for sanitation in Brazil, it was enacted to modernize the sanitation regulation, giving support and new institutional features to cities, counties and States, aiming to improve the sanitation services in Brazil. The 11,445/2007 Law was regulated and detailed later by the Executive Order 7.217 of 2010. Both laws establish all cities must develop and implement a Municipal Sanitation Plan (MSP) and a Municipal Sanitation Policy.
The minimum content of MSP must include
Diagnosis of current situation and their impact on life conditions;
Objectives and goals for short, medium, and long terms;
Programs, projects, and actions to achieve the objectives and goals;
Mechanisms to evaluate efficiency and effectiveness
Be compatible and integrated with other municipal plans;
Plan the four sectors of sanitation integrated;
Be developed with effective social participation in all phases;
Have 20-years horizon on planning, among others.A MSP is important not only to meet the Sanitation Law requirements, but
because it is an important and useful document to manage and develop the sanitation services. If the MSP follows all the guidelines, it can be assured that the services will be provided based on the Sanitation Act principles, for example: universal access, democratic control, and equity.
Paraná is a Brazilian state that is in a population growth. Urbanization combined with institutional weakness and insufficient financial resources (the result of rapid

Page 2 of 17
population growth) have led to significant deficit in urban infrastructure and public services (Durán-Ortiz et al, 2013). Also Paraná is receiving financial support from various institutions, e.g. The Inter-American Development Bank (IADB), to elaborate this kind of plan (Durán-Ortiz et al, 2013). On the one hand MSP is an important tool for urban development in Paraná, however in writing and implementing the plans is a challenge for a number of reasons. One reason most Brazilian cities are inexperienced in planning sanitation, and the cities have had problems in writing plans. Another reason is that, usually, the City Administration does not have enough human resources to work on the sanitation daily and routine sanitation activities, which means that they most likely the resources to work exclusively on MSP (Pereira, 2012).
Thus, the cities tend to hire a consulting company or a service provider to write the MSP. However, assessment companies usually are expensive and sometimes the City Administration remains indifferent to, or has little access to, the plan during the process of writing. In all situations, the plan is more prone to bias, since the indirect provider is usually interested in maintaining the stat quo, not into improving it.
As consequence of the aforementioned problems, weak plans have been written and implemented. Even though some problems have been identified in the analysis of, among others, Pereira (2012) and Silva (2012), important gaps still remains in the identification of the problems specifically in the MSP from Paraná State. Also, Paraná State has few regulation agencies in Basic Sanitation (ABAR, 2013) that could help in assessment to MSP.
The main goal of this study is improving sanitation services in Brazil, by analyzing some Paraná State MSPs which are representative of other MSPs in Brazil. In order to achieve this goal, the objective of this study is to analyze selected plans by identifying best practices and do recommendations about how to prepare sanitation plans in a manner that supports successful implementation. Methodology
The selection criteria to include cities in this analysis are: (i) a population over 20,000 people, and (ii) a MPS written and approved and available on the internet. The 20,000 people criterion was used because municipalities of this size in Brazil are required to have a City Plan (in Portuguese, Plano Diretor) that guides the City Management over four years. Next, a random internet search was performed to try to find and select some cities. These five municipalities were selected randomly: Assis Chauteubriand, Rio Negro, Ibiporã, Maringá and Marechal Cândido Rondon.
The research tool adopted was a check list adapted from Pereira (2012). Usually, the methodologies to analyze plans just focused on some specific parts of the Plan, and do not analyze other concepts such as universal access and equality. Pereira’s methodology was chosen because it presents methodological consistency, covers all aspects of Municipal Plan, and follows recommendations founded about Plans in literature about Plans. In addition, Pereira’s methodology covers aspects about the full plan and her methodology is consistent with recommendations found in the literature.
Even though Pereira’s methodology shows a great screenshot of sanitation plans, some changes were done by the author of this report. The first change was adapting Pereira’s check list, adding a description about each characteristic. The second change was eliminating some subcategories about management considered too specific or impossible to be determined. The most important change in Pereira’s methodology was creating four extra check list tables, to evaluate in detail the four

Page 3 of 17
services (Drinking Water, Sewage, Solid Waste Management, and Urban Drainage). These new tables provide deeper analysis of the four sanitation services emphasizing the strengths and weakness of each service. The new tables follow Borja (2009) recommendations.
The Drinking Water and Sewage Tables were designed using Ministério das Cidades (2009) elements and recommendations and Basílio Sobrinho’s (2011) methodology adapted. The Urban Drainage and Solid Waste Management Tables are based on recommendations founded in Funasa (2012), Ministério das Cidades (2007 and 2014), and Tucci (2009). Finally, the categories covered are:
Properties Categories: Universal Access, Equity, Policy/Sectorial, Document “Municipal Policy of Sanitation”, Management Capacity;
Sector Categories: Drinking Water, Sewage, Urban Drainage, and Urban Waste Management.
The final check list is comprised by a set of twelve categories, subdivided into characteristics. The Table 1 defines the categories and it description.
Table 1 – Categories description
Category Definition
Universal Access Progressive increasing of access to Brazilian Basic Sanitation, until all of occupied housing has access to Brazilian Basic Sanitation (Brazil, 2007).
Equity Overcome avoidable, unnecessary and unjust differences. Also defined as equal treatment for equal and unequal treatment of unequal (Brazil, 2013).
Policy/Sectorial
Covers joint or integration of policies, programs, and actions applied Brazilian Basic Sanitation with policies, programs, and actions in other areas, as healthy, water resources and urban development (Moraes, 2009).
“Municipal Policy of Sanitation”
Concerns the municipal law required by the 11,445/2007 Law and its content (Pereira, 2012).
Management Capacity
Concerns the relationship between government management capacity according to Carlos Matus1 and management capacity needed to assure responsibilities and provide good services (Pereira, 2012).
Drinking Water Concerns activities, infrastructures, and facilities needed to drinking water supply, since catchment until residential measuring instruments and their connections (Brazil, 2007).
Sewage
Concerns activities, infrastructures, and operating facilities for collection, transportation, treatment, and appropriate sewage disposal, since residential connections until the final disposal on the environment (Brazil, 2007).
Urban Drainage
Concerns activities, infrastructures, and operating facilities for urban drainage of rainwater; their transport, detention or retention for the damping of flood flows; treatment and final disposal of drained rainwater in urban areas (Brazil, 2007).
Urban Waste Management
Concerns activities, infrastructures, and operating facilities for collecting, transporting, transference, treatment, and final
1C. Matus (2007). “Los tres cinturones del gobierno”. San Justo: Univ. Nacional de La Matanza,
Page 4 of 17
destination of domestic solid waste and waste from urban cleaning (sweeping) (Brazil, 2007).
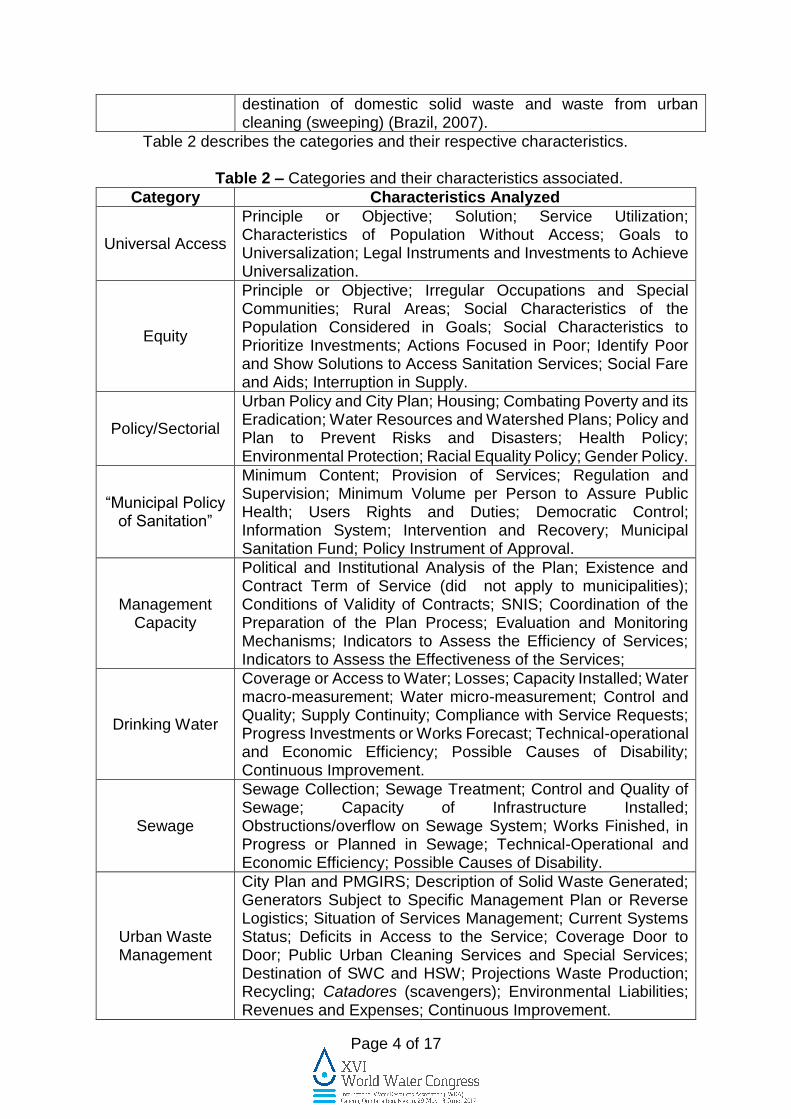
Table 2 describes the categories and their respective characteristics.
Table 2 – Categories and their characteristics associated.
Category Characteristics Analyzed
Universal Access
Principle or Objective; Solution; Service Utilization; Characteristics of Population Without Access; Goals to Universalization; Legal Instruments and Investments to Achieve Universalization.
Equity
Principle or Objective; Irregular Occupations and Special Communities; Rural Areas; Social Characteristics of the Population Considered in Goals; Social Characteristics to Prioritize Investments; Actions Focused in Poor; Identify Poor and Show Solutions to Access Sanitation Services; Social Fare and Aids; Interruption in Supply.
Policy/Sectorial
Urban Policy and City Plan; Housing; Combating Poverty and its Eradication; Water Resources and Watershed Plans; Policy and Plan to Prevent Risks and Disasters; Health Policy; Environmental Protection; Racial Equality Policy; Gender Policy.
“Municipal Policy of Sanitation”
Minimum Content; Provision of Services; Regulation and Supervision; Minimum Volume per Person to Assure Public Health; Users Rights and Duties; Democratic Control; Information System; Intervention and Recovery; Municipal Sanitation Fund; Policy Instrument of Approval.
Management Capacity
Political and Institutional Analysis of the Plan; Existence and Contract Term of Service (did not apply to municipalities); Conditions of Validity of Contracts; SNIS; Coordination of the Preparation of the Plan Process; Evaluation and Monitoring Mechanisms; Indicators to Assess the Efficiency of Services; Indicators to Assess the Effectiveness of the Services;
Drinking Water
Coverage or Access to Water; Losses; Capacity Installed; Water macro-measurement; Water micro-measurement; Control and Quality; Supply Continuity; Compliance with Service Requests; Progress Investments or Works Forecast; Technical-operational and Economic Efficiency; Possible Causes of Disability; Continuous Improvement.
Sewage
Sewage Collection; Sewage Treatment; Control and Quality of Sewage; Capacity of Infrastructure Installed; Obstructions/overflow on Sewage System; Works Finished, in Progress or Planned in Sewage; Technical-Operational and Economic Efficiency; Possible Causes of Disability.
Urban Waste Management
City Plan and PMGIRS; Description of Solid Waste Generated; Generators Subject to Specific Management Plan or Reverse Logistics; Situation of Services Management; Current Systems Status; Deficits in Access to the Service; Coverage Door to Door; Public Urban Cleaning Services and Special Services; Destination of SWC and HSW; Projections Waste Production; Recycling; Catadores (scavengers); Environmental Liabilities; Revenues and Expenses; Continuous Improvement.
Page 5 of 17
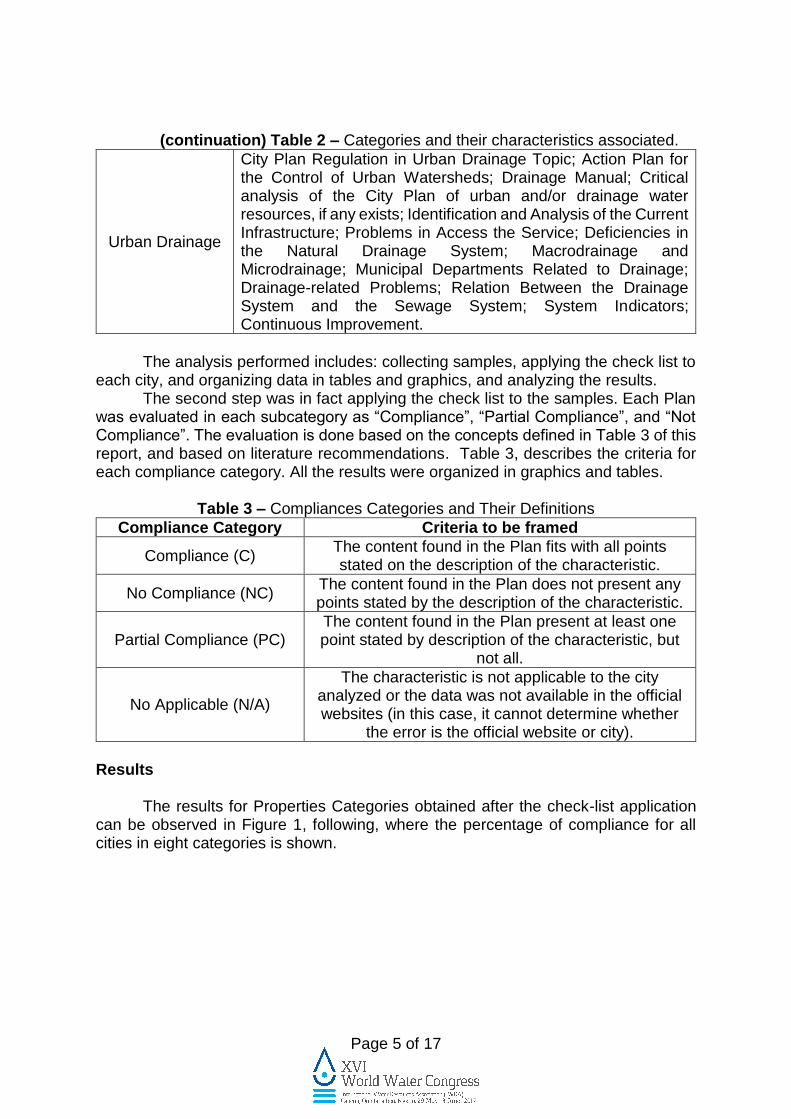
(continuation) Table 2 – Categories and their characteristics associated.
Urban Drainage
City Plan Regulation in Urban Drainage Topic; Action Plan for the Control of Urban Watersheds; Drainage Manual; Critical analysis of the City Plan of urban and/or drainage water resources, if any exists; Identification and Analysis of the Current Infrastructure; Problems in Access the Service; Deficiencies in the Natural Drainage System; Macrodrainage and Microdrainage; Municipal Departments Related to Drainage; Drainage-related Problems; Relation Between the Drainage System and the Sewage System; System Indicators; Continuous Improvement.
The analysis performed includes: collecting samples, applying the check list to
each city, and organizing data in tables and graphics, and analyzing the results. The second step was in fact applying the check list to the samples. Each Plan was evaluated in each subcategory as “Compliance”, “Partial Compliance”, and “Not Compliance”. The evaluation is done based on the concepts defined in Table 3 of this report, and based on literature recommendations. Table 3, describes the criteria for each compliance category. All the results were organized in graphics and tables.
Table 3 – Compliances Categories and Their Definitions
Compliance Category Criteria to be framed
Compliance (C) The content found in the Plan fits with all points stated on the description of the characteristic.
No Compliance (NC) The content found in the Plan does not present any points stated by the description of the characteristic.
Partial Compliance (PC) The content found in the Plan present at least one point stated by description of the characteristic, but
not all.
No Applicable (N/A)
The characteristic is not applicable to the city analyzed or the data was not available in the official websites (in this case, it cannot determine whether
the error is the official website or city).
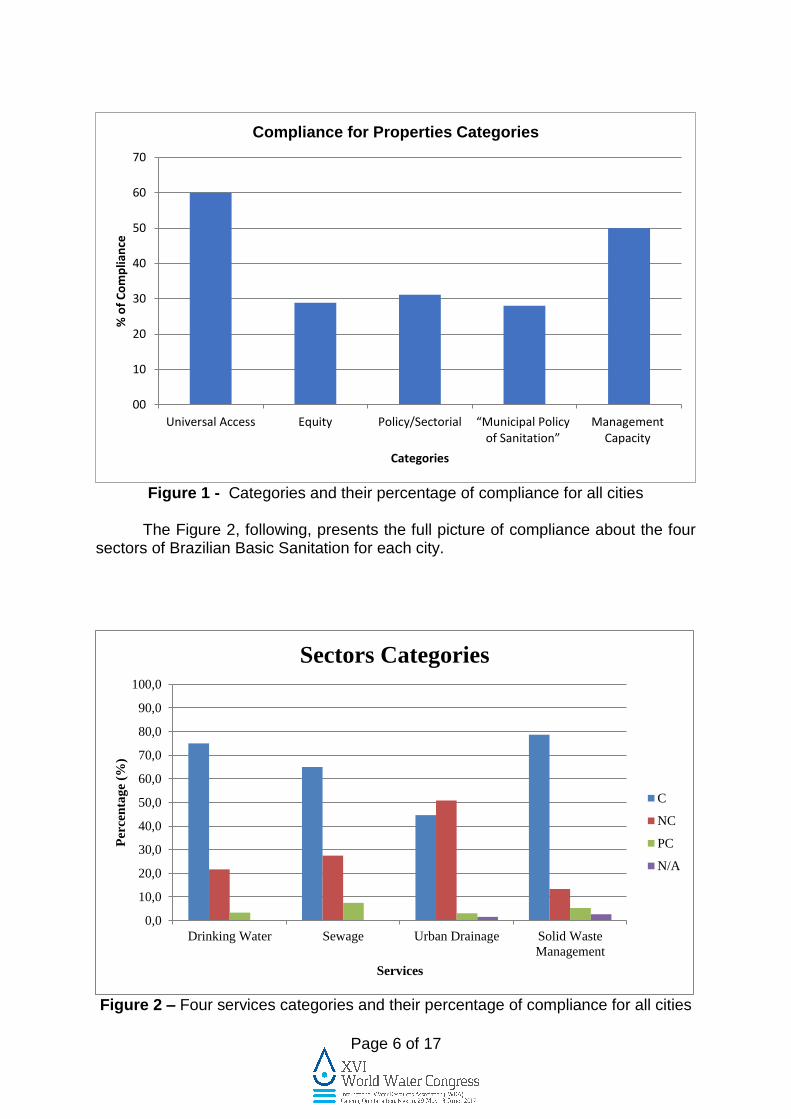
Results The results for Properties Categories obtained after the check-list application can be observed in Figure 1, following, where the percentage of compliance for all cities in eight categories is shown.
Page 6 of 17
Figure 1 - Categories and their percentage of compliance for all cities
The Figure 2, following, presents the full picture of compliance about the four sectors of Brazilian Basic Sanitation for each city.
Figure 2 – Four services categories and their percentage of compliance for all cities
00
10
20
30
40
50
60
70
Universal Access Equity Policy/Sectorial “Municipal Policy of Sanitation”
ManagementCapacity
% o
f C
om
plia
nce
Categories
Compliance for Properties Categories
0,0
10,0
20,0
30,0
40,0
50,0
60,0
70,0
80,0
90,0
100,0
Drinking Water Sewage Urban Drainage Solid Waste
Management
Per
cen
tag
e (%
)
Services
Sectors Categories
C
NC
PC
N/A

Page 7 of 17
The Figure 3, following, presents the results about percentage of compliance for Universal Access in each city analyzed.
Figure 3 – Percentage of Compliance – Universal Access Category
The Figure 4, following, presents the results about percentage of compliance
for Equity in each city analyzed.
Figure 4 – Percentage of Compliance – Equity Category
0,0
10,0
20,0
30,0
40,0
50,0
60,0
70,0
80,0
90,0
100,0
Maringá Mar. Cândido
Rondon
Ibiporã Assis
Chauteubriand
Rio Negro
Per
cen
tag
e (%
)
Cities
Universal Access
C
NC
PC
N/A
0,0
10,0
20,0
30,0
40,0
50,0
60,0
70,0
80,0
90,0
100,0
Maringá Mar. CândidoRondon
Ibiporã AssisChauteubriand
Rio Negro
Pe
rce
nta
ge (
%)
Cities
Equity
C
NC
PC
N/A

Page 8 of 17
The Figure 5, following, presents the results about percentage of compliance for Policy/Sectorial in each city analyzed.
Figure 5 – Percentage of Compliance – Policy/Sectorial Category
The Figure 6, following, presents the results about percentage of compliance
for “Municipal Policy of Sanitation” in each city analyzed.
Figure 6 – Percentage of Compliance – Service Quality Category
0,0
10,0
20,0
30,0
40,0
50,0
60,0
70,0
80,0
90,0
100,0
Maringá Mar. CândidoRondon
Ibiporã AssisChauteubriand
Rio Negro
Pe
rce
nta
ge (
%)
Cities
Policy/Sectorial
C
NC
PC
N/A
0
10
20
30
40
50
60
70
80
90
100
Maringá Mar. CândidoRondon
Ibiporã AssisChauteubriand
Rio Negro
Pe
rce
nta
ge (
%)
Cities
Municipal Policy of Sanitation
C
NC
PC
N/A

Page 9 of 17
The Figure 7, following, presents the results about percentage of compliance for Management Capacity in each city analyzed.
Figure 7 – Percentage of Compliance – Management Capacity Category
The Figure 8, following, presents the results about percentage of compliance
for Drinking Water in each city analyzed.
Figure 6 – Percentage of Compliance – Drinking Water Category
0,0
10,0
20,0
30,0
40,0
50,0
60,0
70,0
80,0
90,0
100,0
Maringá Mar. CândidoRondon
Ibiporã AssisChauteubriand
Rio Negro
Pe
rce
nta
ge (
%)
Cities
Management Capacity
C
NC
PC
N/A
0,0
10,0
20,0
30,0
40,0
50,0
60,0
70,0
80,0
90,0
100,0
Maringá Mar. CândidoRondon
Ibiporã AssisChauteubriand
Rio Negro
Pe
rce
nta
ge (
%)
Cities
Drinking Water
C
NC
PC
N/A

Page 10 of 17
The Figure 7, following, presents the results about percentage of compliance for Sewage in each city analyzed.
Figure 7 – Percentage of Compliance – Sewage Category
The Figure 8, following, presents the results about percentage of compliance
for Urban Drainage in each city analyzed.
Figure 8 – Percentage of Compliance – Urban Drainage Category
The Figure 9, following, presents the results about percentage of compliance
for Drinking Water in each city analyzed.
0
10
20
30
40
50
60
70
80
90
100
Maringá Mar. CândidoRondon
Ibiporã AssisChauteubriand
Rio Negro
Pe
rce
nta
ge (
%)
Cities
Sewage
C
NC
PC
N/A
0,0
10,0
20,0
30,0
40,0
50,0
60,0
70,0
80,0
90,0
100,0
Maringá Mar. CândidoRondon
Ibiporã AssisChauteubriand
Rio Negro
Pe
rce
nta
ge (
%)
Cities
Urban Drainage
C
NC
PC
N/A

Page 11 of 17
Figure 9 – Percentage of Compliance – Urban Waste Management Category
Except for Assis Chauteubriand, all cities have a high index of Compliance. Assis Chauteubriand presented a high level of No Compliance. Discussion
Each category result will be discussed individually, at the next topics.
Universal Access Category Looking through the Universal Access graphic (Figure 3) two different groups were identified. The first group (Maringá, Mar. Cândido Rondon, and Ibiporã) had Compliance above the expectations, which means that the Universal Aspect concept is not only present as a goal but also throughout the PMS. For example, Mar. Cândido Rondon MSP identified the characteristics of populations without access and the legal instruments and investments necessary to achieve the universal access. Providing this kind of information is essential to support actions in order to achieve universal access goal. On another hand, Assis Chauteubriand and Rio Negro had Compliance below the expectations or significantly below the expectations. This result means that the concept was not totally incorporated throughout the plan. Even though both cities stated Universal Access as an objective, they did not provide information and basis to achieve the universal access goal. Assis Chauteubriand had the highest index of No Compliance (50%), which means that half of the characteristics of Universal Access analyzed on the check list were not even partially stated in the MSP.
Returning to Figure 3 and comparing it with Pereira (2012) results, it is possible observe that Pereira obtained similar results in her work. The level of Compliance was the same, and usually the plans were strong in includes Universal Access as a purpose or objective, but weak in describe the characteristics of population without access.
Finally, results below the expectations as observed in Assis Chauteubriand and Rio Negro cause concerns because assure DW, S, UD, and SWM for everybody is an
0,0
10,0
20,0
30,0
40,0
50,0
60,0
70,0
80,0
90,0
100,0
Maringá Mar. CândidoRondon
Ibiporã AssisChauteubriand
Rio Negro
Pe
rce
nta
ge (
%)
Cities
Urban Waste Management
C
NC
PC
N/A

Page 12 of 17
important step to assure healthy and avoid sanitary related diseases. Also, universal access to sanitation is defined by U.N. (2012) as “not only fundamental for human dignity and privacy, but is one of the principal mechanisms for protecting the quality of water resources”. Thus, it is important not only to establish Universal Access as a goal, but also to give information to support how this goal will be achieved. Municipal Policy of Sanitation category
The Municipal Policy of Sanitation had the expectations in average. Just one city, Ibiporã, obtained results in a range expected. The main points of No Compliance were defaults about Municipal Sanitation Fund, information system, and democratic control.
The Municipal Sanitation Fund is important because it makes the cities prioritize money exclusively for sanitation purposes in day-by-day activities, which does not always happens in Brazilian municipalities.
The information system makes the cities have and show to the users a systematic and organized system as a way to make the sanitation transparent. This helps the community to see the evolution of the services and also as a way to supervise the services.
Regarding democratic control, the most part of the MSPs makes reference to mechanisms of democratic control. 11,445/2007 clearly obligates the owner of sanitation services to establish democratic control. Thus, it was expected to see strong recommendations and coverage about democratic control over the MSPs. This is an important mechanism of popular participation and an important way to include the society as part of the decisions about sanitation. It is important to highlight that democratic control is a new and important tool that must be clearly covered in MSP.
Equity category
Equity was the category with the worst results. Only Ibiporã had an index of Compliance expected. All others cities had an index of Compliance below expectations. Social characteristics to prioritize investments, actions focused on the poor, and reference to equity as part of the objectives are examples of characteristics of Equity that almost all cities neglected.
The results obtained in my work and in Pereira’s work (2012) are similarly bad. In both researches equity concept did not appears as an objective or in other parts of the plan, for example. This can be an indicative that the cities are not concerning in decrease the existent inequity problems.
Not having equity concept in the plans cause concerns because Brazil is a world reference about inequity. If equity is not part of the MSPs the investments in the next 20 years will not prioritize decreasing the inequity in the services. Furthermore, equity is part of U.N. goals for Drinking Water and Sanitation. Not including Equity in the MSP is going on the opposite direction of U.N. millennium goals. Policy/Sectorial and Management Capacity categories
The Policy/sectorial category had results below the expectations for most of the cities, except for Mar. Cândido Rondon. This city obtained results above the expectations and stood out positively because it took into consideration urban policy and City Plan, and water resources and watershed plans. Management Capacity had expected results of Compliance. This category basically analyses if indicators of effectiveness and efficiency are provided. Each city

Page 13 of 17
calculated own indicators, according to data available. This is an interesting choice instead of do not provide any indicator. Sector Categories on MSP The four sectors of Brazilian Basic Sanitation presented different scenarios of Compliance as could be seen on Figure 3. This result reflects how each of these sectors is running in Brazil. DW obtained results above the expectation about Compliance. Assis Chauteubriand obtained the worst result, 58% of Compliance. Between the four services of Brazilian Sanitation (DW, S, SWM, and UD), Drinking Water supply always was prioritized because involves an essential life necessity. This is easily realized when the diagnosis of current system section of the MSP is analyzed. All cities had almost 100% of urban and rural drinking water supply. Usually the cities put more efforts in supply water, not only in equipment and infrastructure but also in human resources working it. Furthermore, some Plans provide information and photos about pumps, treatment plants, and quality of water provided. Ibiporã MSP, for example, provide the full analysis of water quality parameters. Rio Negro and Mar. Cândido Rondon MSPs provided photos and detailed description about pumps maintenance necessities. Only in DW section was found these kinds of detailed information and photos description. Sewage obtained expected results, on average. However, looking at the cities results, three cities obtained only 50% of Compliance and levels of No Compliance and Partial Compliance that draw attention. These three cities had NC or PC in the characteristic “Control and quality of sewage, for example. To have No Compliance in this characteristic causes concerning because it means that the MSP do not provide data, information or indicators about control and quality of sewage. Without this kind of information is not possible know if the treated sewage is following CONAMA 237 Resolution2 and how the watershed will be impacted by receiving treated sewage. Another characteristic that had low index of Compliance was “Technical-operational and economic efficiency”. Only Maringá received C in this topic, which means that the MSPs are not planning sewage observing technical-operational and economic-financial indicators. This kind of data helps to plan efficient systems. Usually DW and S services are provided by the same company. However, S did not present the same level of Compliance than DW. Hence, even though the provider is the same, DW and S do not have the same attention regarding information and data about the services. The most important example of this gap is in DW section data about quality water is available, and in S section data about treated sewage is not always available. SWM had the best Compliance index 78.8%, above the expectations. This results can be the consequence of the Solid Waste Policy, established by 12,305/2010 Law that obligate all cities to have a PMGIRS. The Law 11,445/2007 allows the cities elaborate sectorial plans for each one of DW, S, SWM, and UD. Thus, some cities choose to use their PMGIRS as a sectorial plan for SWM in their MSP. Maringá and Rio Negro adopted this strategy. Sectorial plans presented more details and information than DW, S, and UD sections of the same Plan. Only one city obtained Compliance below the expectations and high level of No Compliance: Assis Chauteubriand. Basic data as description of solid waste generated,
2 CONAMA 357 Resolution (Updated by CONAMA 430 Resolution): conditions and parameters for release
effluents.

Page 14 of 17
destination of SWC and HSW, and projections waste productions were not provided or just partially provided. These data are basic because is not possible make calculations about landfill size, how many truck waste collectors, and how the SWM system will works. UD was the only category that that Compliance is below the expectations and the level of No Compliance is higher than the level of Compliance. Brazil has a history of fewer investments for UD when compared with the other sectors of sanitation. According to Brazil (2013), this is the sector with less policies and institutional organization, and just 22% had a UD City Plan. The MSP analyzed here reflect this scenario of no organization: action plan for the control of urban watersheds was not created, and the most part of the Plans just make suggestions about a Drainage Manual, but did not present it.
Two cities specially presented high levels of No Compliance in UD topic: Assis Chauteubriand and Maringá. The Assis Chauteubriand MSP does not cover UD topic with details. The Plan just provided information about the relation between the drainage system and the sewage system. Even the objectives and goals for 5, 10, and 20 year’s periods were not clearly established. Likewise, Maringá MSP did not cover UD with details. Even though UD is mentioned in Sewage part, no more information, or infrastructure description were provided.
These UD weak parts (in average and in punctual cases) causing concerns because it means that UD will continue to receive less and/or wrong investments because the investments in sanitation will be guided by the MSP. If the Plan is weak or do not provide information, is more difficult plan actions for this sector or apply money on the correct solutions for UD problems.
According to the results obtained here, Maringá have a good plan in almost all service, except for UD. Also, Maringá have a special website to make the access to MSP easy, where was simple to find another documents associated. This situation of do not cover UD was unexpected because the plan covered very well DW, S, and SWM. Even though the MSP covered very well others parts, the plan do not meet the law requirements and literature recommendations in UD aspect because even UD section was developed, it is not available to public together with another sections of MSP.
Looking at DW, S, SWM, and UD Assis Chauteubriand presented the worse plan. In fact, this plan presented less information than plans from other cities. Some examples of data did not presented by Assis Chauteubriand MSP and were presented by others MSP are data about supply continuity in DW, obstructions/overflow on sewage system, almost no data about UD, and Projections waste production. Conclusions and Recommendations
MSPs vary in quality and comprehensiveness. While each MSP has positive features, none completely meet the legal requirements. Of particular concern basic categories are not completely covered including i.e. Universal Access, Equity, DW, UD, SWM, and S. To help cities develop or update their sanitation plans, Tables 5 and 6 present make recommendations based on the main weak points found in each category.

Page 15 of 17
Table 5 – Main problems and recommendations for best practice
Properties Categories
Main Problem Recommendations
Universal Access
Concept just stated as purpose, but no incorporated throughout the plan.
Provide detailed information to identify who still does not have access to the services and how to achieve universal access.
“Municipal Policy of Sanitation”
It is not clear how Information system, Municipal Sanitation Fund and Democratic Control will work.
Establish and create these mechanisms and actions during the Plan, and show it in the MSP.
Equity Concept does not appear in any part of the MSP.
Present social characteristics of the population without access to services to priory investments.
Policy/Sectorial
Combating poverty, watershed plans, and gender/race policy ignored
Consider gender, race, and poverty on MSP (this can be linked with Universal Access and Equity topics). Also, always link and includes watershed plans in sanitation planning process.
Management Capacity
Indicators of effectiveness and efficiency not available.
Establish a method to calculate effectiveness and efficiency, calculate theses parameters and show on MSP.
Table 6 – Main problems and recommendations for best practice
Sector Categories
Main Problem Recommendations
Drinking Water No data about possible causes of disability.
Investigate where problems (e.g., losses, interruption on services) starts and why this happen. Make available on MSP.
Sewage No data about possible causes of disability and quality of sewage.
Make available data collected after treatment (parameters stated on CONAMA 357). Investigate and show where problems occur (e.g., parameters above law requirements).
Solid Waste Management
Basic data not provided. Plan sectorial not linked.
Provide data about description of solid waste generated (daily production, composition, treatment), destination of SWC and HSW. Link PMGIRS and MSP.
Urban Drainage
Little information about the system and no Drainage Manual built/referenced.
Infrastructure description, flooding information and control actions, macrodrainage and microdrainage description, maintenance and cleaning description.

Page 16 of 17
References Abar (2013). Saneamento Básico: Regulação 2013. Fortaleza: Expressão Gráfica e Editora. Assis Chauteubriand (2011). Plano Municipal De Saneamento Básico: Município De Assis Chateaubriand/PR. Available from: http://assischateaubriand.pr.gov.br/index.php?sessao=39849 1ff5cvf39&id=1208313 [Accessed 25th May 2015]. Brazil. (2007). Lei 11.445, de 5 de janeiro de 2007. Published in Union Official Diary in 01/11/2007. Available from: http://www.planalto.gov.br/ccivil_03/_ato2007-2010/2007/lei/l11445 .htm [Accessed 25th May 2015]. Brazil (2010). “Decreto 7.217, de 21 de junho de 2010”. Published in Union Official Diary in 06/01/2010.Available from: [Accessed 29th December 2016]. Brazil (2013). Plano Nacional de Saneamento Básico: PLANSAB. Brasília: Ministério das Cidades. Available from: http://www.cidades.gov.br/images/stories/ArquivosSNSA/PlanSaB/Proposta_Plansab_11-08-01.pdf [Accessed 25th May 2015]. Tucci, C. E. M.. (2009). Gestão integrada das águas urbanas: águas pluviais. In: Ministério das Cidades. Lei Nacional de Saneamento: perspectivas para as políticas e a gestão dos serviços públicos. Vol. II Brasília, 2009. 718 p. Ibiporã (2009). Plano Municipal de Saneamento Básico de Ibiporã – PR. IBGE (2010). Ministério do Planejamento, Orçamento e Gestão and Instituto Brasileiro de Geografia e Estatística. Contagem Populacional. Available from: http://www.ibge.gov.br/estadosat/perfil.php?sigla=pr. [Accessed 25th May 2015]. Funasa (2012). Termo de Referência para elaboração de planos municipais de saneamento básico. Brasília. 68 p. Available from: http://www.funasa.gov.br/site/wp-content/uploads/2012/04/2b_TR_PMSB_V201 2.pdf. [Accessed 25th May 2015]. Basílio Sobrinho, G. (2011). Planos municipais de saneamento básico (PMSB): uma análise da universalização do abastecimento de água e do esgotamento sanitário Dissertation to conclude Masters Degree in Civil Engineering. Ceará, 2011. 112 p. Moraes, L. R. S. (2009). Política e Plano Municipal de Saneamento Básico: aportes conceituais e metodológicos. In: MINISTÉRIO DAS CIDADES. Lei Nacional de Saneamento: perspectivas para as políticas e a gestão dos serviços públicos. Vol. I Brasília. Marechal Cândido Rondon. Plano Municipal de Sanemento Básico. Available from: http://www.saaemcr.com.br/plano_municipal_de_saneamento_basico.html. [Accessed 25th May 2015].

Page 17 of 17
Maringá (2011). Plano Municipal de Sanemento Básico (all sectorial plans are in this link). Available from: http://www.maringa.pr.gov.br/saneamento/. [Accessed 25th May 2015]. Ministério das Cidades (2007). Resolução Recomendada n° 75: Estabelece orientações relativas à Política de saneamento Básico e ao conteúdo mínimo dos Planos de Saneamento Básico. M. Dúran-Ortiz et al (2012). Brazil Urban Development and Municipal Public Investment Program: Paraná Urbano II. Available from: http://www.iadb.org/en/projects/project-description-title,1303.html?id=BR-L1356. [Accessed 25th May 2015]. Ministério das Cidades (2014). Módulo 07 - Contratação, elaboração e acompanhamento do Plano Municipal de saneamento Básico: Anexo - Escopo do plano municipal de saneamento básico.” In: Ministério das Cidades (2014). Curso a distância – Planos Municipais de Saneamento Básico. 2014. Rio Negro (2009). Plano Municipal de Saneamento Ambiental: Rio Negro-PR. Available from: http://www.rionegro.pr.gov.br/utilidades_downloads.php. [Accessed 25th May 2015]. Pereira, T. S. T. (2012). Conteúdo e metodologia dos planos municipais de saneamento básico: um olhar para 18 casos no Brasil. Monograph to conclude latu sensu specialization in Sanitation Management and Technology. Brasília, 192 p. U.N. (2012). “The Human Right to Water and Sanitation”. UN-Water Decade Programme on Advocacy and Communication and Water Supply and Sanitation Collaborative Council. Zaragoza, 8 p. Available from: http://www.un.org/waterforlifedecade/pdf/human_right_to_ water_and_sanitation_media_brief.pdf [Accessed 25th May 2015]. U.N. (2014). WASH Post-2015 proposed targets and indicators for drinking-water, sanitation and hygiene. Zaragoza, 8 p. Available from: http://www.zaragoza.es/contenidos/medioambiente /onu/1323-eng_WASH_Post2015_proposed_targets_and_indicators_for_drinking_water _sanitation_hygiene.pdf [Accessed 25th May 2015].