municipal pavement management system...
TRANSCRIPT

CITY OF NORTHVILLE, MICHIGAN
City of Northville
Municipal Pavement Management System Report 2013 Update
DATE OF FIELD EVALUATION: February 12 th, 2013
PREPARED FOR:
Mr. James Gallogly Public Works Director
Department of Public Works Office 215 West Main Street Northville, MI 48167
SPALDING DEDECKER ASSOCIATES, INC. 905 South Boulevard East Rochester Hills, Michigan 48307 P: (248) 844-5400 – F: (248) 844-5404 SDA Job No. NP11040.1C
Table of Contents
REPORT Page EXECUTIVE SUMMARY.................................................................................................. 1 INTRODUCTION.............................................................................................................. 3 FIELD EVALUATION AND DATA COLLECTION.............................................................. 4 DATA ORGANIZATION AND PAVEMENT CRITERIA ...................................................... 5 SUMMARY OF NORTHVILLE PAVEMENT NETWORK .................................................. 9 TEN-YEAR WORK PLAN PARAMETERS........................................................................ 14 TEN-YEAR WORK PLAN RESULTS AND RECOMMENDATIONS................................... 21 PAVEMENT LIFE............................................................................................................. 24 SUMMARY AND CONCLUSIONS.................................................................................... 26 TABLES Table 1.0 – Summary of Typical Pavement Cross-Sections .............................................. 4 Table 2.0 – Modified Asphalt PASER Ratings................................................................... 5 Table 3.0 – Modified Concrete PASER Ratings ................................................................ 6 Table 4.0 – Pavement Use Categories ............................................................................. 8 Table 5.0 – Pavement Priority Categories......................................................................... 8 Table 6.0 – Net Priority Ranking (NPR) Weighting Factors................................................ 15 Table 7.0 – Pavement Priority Values within NPR............................................................. 15 Table 8.0 – Pavement Use Values within NPR ................................................................. 16 Table 9.0 – Surface Classification Values within NPR....................................................... 16 Table 10.0 – CartéGraph Repair Activities ........................................................................ 17 Table 11.0 – Budget Plans ............................................................................................... 20 Table 12.0 – Summary of Budget Scenarios..................................................................... 22 Table 13.0 – Extended Service Life Gains for Pavement Treatments ................................ 25 FIGURES Figure 1.0 – Typical Pavement Deterioration Curve .......................................................... 7 Figure 2.0 – Network Pavement Condition Areas ............................................................. 10 Figure 3.0 – Network Pavement Condition Distribution...................................................... 10 Figure 4.0 – Network Pavement Use Areas ...................................................................... 11 Figure 5.0 – Network Pavement Use Distribution.............................................................. 11 Figure 6.0 – Network Pavement Priority Distribution ......................................................... 12 Figure 7.0 – Network OCI Distribution within Priority Categories ....................................... 12 Figure 8.0 – Network Pavement Classification Distribution................................................ 13 Figure 9.0 – Network Budget versus Pavement OCI Comparison...................................... 23 Figure 10.0 – Pavement OCI versus Network Backlog Comparison .................................. 23 Figure 11.0 –Repair Effects of Pavement Deterioration with Time..................................... 26

Table of Contents
APPENDICES
Appendix A – Overall Condition Index (OCI) Maps Appendix B – Pavement Priority Maps Appendix C – Pavement Classification Maps Appendix D – Pavement Use Maps Appendix E – Segment Information Spreadsheet Appendix F – CartéGraph Output - Budget Summary Report Appendix G – CartéGraph Output - Segment Analysis Recommendations - $350K Budget – CartéGraph Output - Segment Analysis Recommendations - $950K Budget – CartéGraph Output - Segment Analysis Recommendations - Bond Budget Appendix H – Ten-Year Work Plan Maps - $350K Budget
– Ten-Year Work Plan Maps - $950K Budget – Ten-Year Work Plan Maps - Bond Budget
Appendix I – Ten-Year Work Plan Tables - $350K Budget – Ten-Year Work Plan Tables - $950K Budget – Ten-Year Work Plan Tables - Bond Budget Appendix J – Asphalt PASER Manual Appendix K – Concrete PASER Manual
City of Northville Municipal Pavement Management System Report
2013 Update
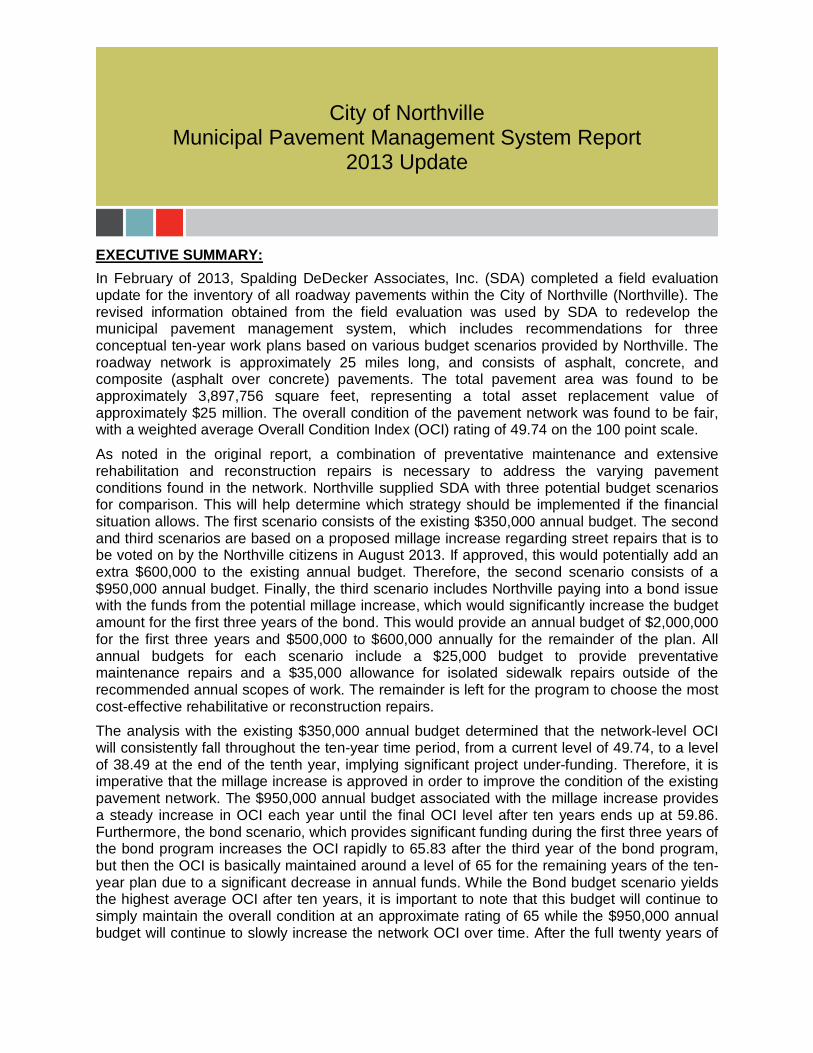
EXECUTIVE SUMMARY:
In February of 2013, Spalding DeDecker Associates, Inc. (SDA) completed a field evaluation update for the inventory of all roadway pavements within the City of Northville (Northville). The revised information obtained from the field evaluation was used by SDA to redevelop the municipal pavement management system, which includes recommendations for three conceptual ten-year work plans based on various budget scenarios provided by Northville. The roadway network is approximately 25 miles long, and consists of asphalt, concrete, and composite (asphalt over concrete) pavements. The total pavement area was found to be approximately 3,897,756 square feet, representing a total asset replacement value of approximately $25 million. The overall condition of the pavement network was found to be fair, with a weighted average Overall Condition Index (OCI) rating of 49.74 on the 100 point scale.
As noted in the original report, a combination of preventative maintenance and extensive rehabilitation and reconstruction repairs is necessary to address the varying pavement conditions found in the network. Northville supplied SDA with three potential budget scenarios for comparison. This will help determine which strategy should be implemented if the financial situation allows. The first scenario consists of the existing $350,000 annual budget. The second and third scenarios are based on a proposed millage increase regarding street repairs that is to be voted on by the Northville citizens in August 2013. If approved, this would potentially add an extra $600,000 to the existing annual budget. Therefore, the second scenario consists of a $950,000 annual budget. Finally, the third scenario includes Northville paying into a bond issue with the funds from the potential millage increase, which would significantly increase the budget amount for the first three years of the bond. This would provide an annual budget of $2,000,000 for the first three years and $500,000 to $600,000 annually for the remainder of the plan. All annual budgets for each scenario include a $25,000 budget to provide preventative maintenance repairs and a $35,000 allowance for isolated sidewalk repairs outside of the recommended annual scopes of work. The remainder is left for the program to choose the most cost-effective rehabilitative or reconstruction repairs.
The analysis with the existing $350,000 annual budget determined that the network-level OCI will consistently fall throughout the ten-year time period, from a current level of 49.74, to a level of 38.49 at the end of the tenth year, implying significant project under-funding. Therefore, it is imperative that the millage increase is approved in order to improve the condition of the existing pavement network. The $950,000 annual budget associated with the millage increase provides a steady increase in OCI each year until the final OCI level after ten years ends up at 59.86. Furthermore, the bond scenario, which provides significant funding during the first three years of the bond program increases the OCI rapidly to 65.83 after the third year of the bond program, but then the OCI is basically maintained around a level of 65 for the remaining years of the ten-year plan due to a significant decrease in annual funds. While the Bond budget scenario yields the highest average OCI after ten years, it is important to note that this budget will continue to simply maintain the overall condition at an approximate rating of 65 while the $950,000 annual budget will continue to slowly increase the network OCI over time. After the full twenty years of
City of Northville Municipal Pavement Management System 2013 Update Page 2 of 27
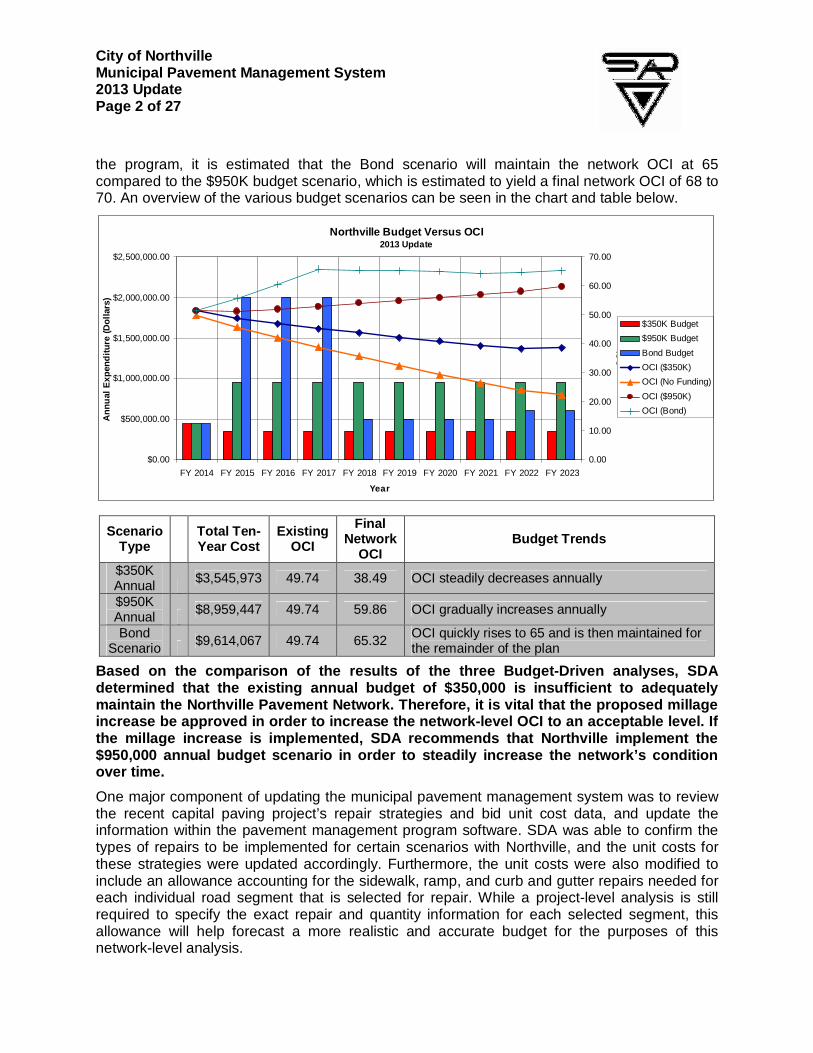
the program, it is estimated that the Bond scenario will maintain the network OCI at 65 compared to the $950K budget scenario, which is estimated to yield a final network OCI of 68 to 70. An overview of the various budget scenarios can be seen in the chart and table below.
Northville Budget Versus OCI2013 Update
$0.00
$500,000.00
$1,000,000.00
$1,500,000.00
$2,000,000.00
$2,500,000.00
FY 2014 FY 2015 FY 2016 FY 2017 FY 2018 FY 2019 FY 2020 FY 2021 FY 2022 FY 2023
Year
Ann
ual E
xpen
ditu
re (
Dol
lars
)
0.00
10.00
20.00
30.00
40.00
50.00
60.00
70.00
OC
I
$350K Budget
$950K Budget
Bond Budget
OCI ($350K)
OCI (No Funding)
OCI ($950K)
OCI (Bond)
Based on the comparison of the results of the three Budget-Driven analyses, SDA determined that the existing annual budget of $350, 000 is insufficient to adequately maintain the Northville Pavement Network. Therefore , it is vital that the proposed millage increase be approved in order to increase the netwo rk-level OCI to an acceptable level. If the millage increase is implemented, SDA recommends that Northville implement the $950,000 annual budget scenario in order to steadil y increase the network’s condition over time.
One major component of updating the municipal pavement management system was to review the recent capital paving project’s repair strategies and bid unit cost data, and update the information within the pavement management program software. SDA was able to confirm the types of repairs to be implemented for certain scenarios with Northville, and the unit costs for these strategies were updated accordingly. Furthermore, the unit costs were also modified to include an allowance accounting for the sidewalk, ramp, and curb and gutter repairs needed for each individual road segment that is selected for repair. While a project-level analysis is still required to specify the exact repair and quantity information for each selected segment, this allowance will help forecast a more realistic and accurate budget for the purposes of this network-level analysis.
Scenario Type
Total Ten-Year Cost
Existing OCI
Final Network
OCI Budget Trends
$350K Annual $3,545,973 49.74 38.49 OCI steadily decreases annually
$950K Annual $8,959,447 49.74 59.86 OCI gradually increases annually
Bond Scenario $9,614,067 49.74 65.32 OCI quickly rises to 65 and is then maintained for
the remainder of the plan

City of Northville Municipal Pavement Management System 2013 Update Page 3 of 27
INTRODUCTION
The following report is intended to overview the updated municipal pavement management system developed by SDA for the City of Northville. The purpose of the management system is to provide an accessible pavement inventory as well as important management information pertaining to the approximately 25 mile long roadway network under the City’s jurisdiction. In addition, the management system serves as a tool for developing short and long-term capital funding projections. Existing information from the network was obtained through a detailed site evaluation, and incorporated into the system to assist in development of a conceptual ten-year work plan. The work plan optimizes funding by strategically allocating budgets to suit the specific needs of the Northville network. The goal of the ten-year work plan is to help the City plan and project strategic annual repair projects, which will lead to tangible improvements in the overall pavement conditions. The field evaluation update was conducted in February of 2013 to update the current pavement condition ratings. SDA identified the visible distresses on each road for repair analysis. Pavement distresses such as deformations, depressions, cracks, patches, and potholes were identified and linked to a probable cause to help determine cost-effective repair strategies. A visual rating based on the established “PASER” rating system was given for all pavements to determine the Overall Condition Index (OCI). CartéGraph software was used to develop the ten-year work plans. This software utilizes either OCI-Driven Analysis or Budget-Driven Analysis to determine the predicted work for the ten-year plan. For this report, SDA utilized the Budget-Driven Analysis, since Northville provided three predicted annual budgets for comparison that served as the funding parameters. The unit prices for each repair activity were updated to include allowances for sidewalk, ramp, and curb and gutter repairs within the recommended pavement segments for each year based on actual paving program pricing data. SDA also provided a separate allowance in the budget to account for isolated sidewalk, sidewalk ramp, and curb and gutter repairs that are necessary outside of the recommended annual scope of work. General cost information and work plan maps from the CartéGraph output are provided for planning purposes in Appendices F thru I. We note that the results of the ten-year plan are not intended to directly fund actual repair projects. A more detailed, “project level” analysis is required prior to actual design and construction work. Therefore, the provided cost information may differ from the final chosen design depending on a number of factors. The strength of the management system and ten-year work plan is built upon the Network Priority Ranking (NPR), observed pavement conditions, value-engineering repair strategies, and if/then budget scenarios, including other parameters discussed later in the report. The following is a summary of our approach for the project update:
� Update the history of the pavements with collaboration from Northville personnel to include the most recent capital improvements.
� Inspect the roadways; document and inventory the updated existing pavement conditions for each pavement segment.
� Develop CAD drawings and colored-maps to overview the updated pavement characteristics throughout the network.
City of Northville Municipal Pavement Management System 2013 Update Page 4 of 27
� Review input from City and project-level cost data from most recent capital projects to update network-level repair and unit cost information; include allowance for sidewalk, ramp, and curb and gutter repairs for each recommended segment in unit cost projection for each recommended repair activity.
� Provide pavement management strategies for the overall Northville pavement network. For example:
o Maintain high priority pavements in “good” condition by recommending applicable preventative maintenance with budget information supplied by City.
o Propose rehabilitation methods where possible for fair condition pavements before they deteriorate to poor condition and require more costly reconstruction.
o Provide value-engineered alternatives where applicable. o Run three budget scenarios provided by City to help confirm predicted funding or
determine appropriate funding for the network. � Prepare work plan maps with color-coding to show updated repair locations and types
(preventative maintenance, rehabilitation, or reconstruction) for the ten-year plans. � Give a general overview of predicted costs and resulting pavement conditions for the
ten-year time period. FIELD EVALUATION AND DATA COLLECTION
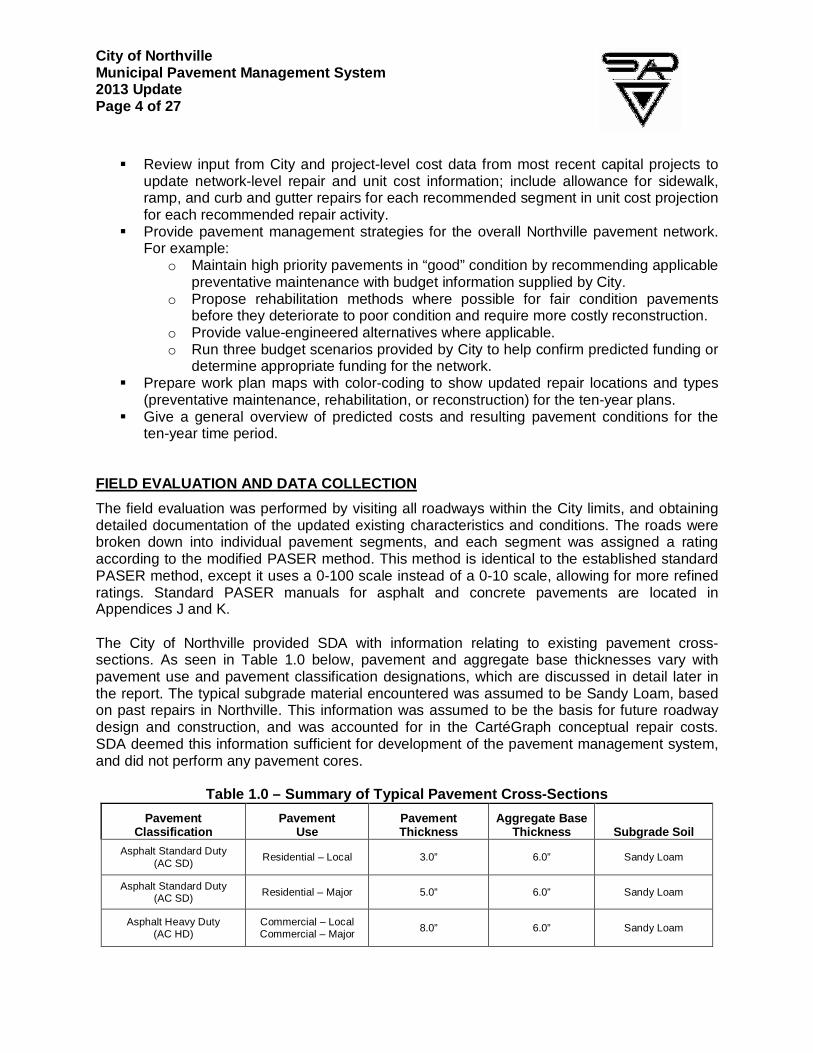
The field evaluation was performed by visiting all roadways within the City limits, and obtaining detailed documentation of the updated existing characteristics and conditions. The roads were broken down into individual pavement segments, and each segment was assigned a rating according to the modified PASER method. This method is identical to the established standard PASER method, except it uses a 0-100 scale instead of a 0-10 scale, allowing for more refined ratings. Standard PASER manuals for asphalt and concrete pavements are located in Appendices J and K. The City of Northville provided SDA with information relating to existing pavement cross-sections. As seen in Table 1.0 below, pavement and aggregate base thicknesses vary with pavement use and pavement classification designations, which are discussed in detail later in the report. The typical subgrade material encountered was assumed to be Sandy Loam, based on past repairs in Northville. This information was assumed to be the basis for future roadway design and construction, and was accounted for in the CartéGraph conceptual repair costs. SDA deemed this information sufficient for development of the pavement management system, and did not perform any pavement cores.
Table 1.0 – Summary of Typical Pavement Cross-Secti ons
Pavement Classification
Pavement Use
Pavement Thickness
Aggregate Base Thickness Subgrade Soil
Asphalt Standard Duty (AC SD)
Residential – Local 3.0” 6.0” Sandy Loam
Asphalt Standard Duty (AC SD) Residential – Major 5.0” 6.0” Sandy Loam
Asphalt Heavy Duty (AC HD)
Commercial – Local Commercial – Major 8.0” 6.0” Sandy Loam

City of Northville Municipal Pavement Management System 2013 Update Page 5 of 27
Concrete Standard Duty (PCC SD) Residential – Local 7.0” 6.0” Sandy Loam
Concrete Heavy Duty (PCC HD)
Commercial – Major
9.0” 6.0” Sandy Loam
Asphalt Overlaid Concrete (APC)
Commercial – Major 3.0” – 4.0” Asphalt 7.0” – 9.0” Concrete
6.0” Sandy Loam
DATA ORGANIZATION AND PAVEMENT CRITERIA
Pavement segments were created to differentiate roadways based upon existing characteristics observed during the field evaluation. In addition to the modified PASER rating assigned to each segment, pavement was also categorized based on Use (typical traffic types and frequency), Classification (material and thickness of road), and Priority (precedence for receiving repair funds). Wherever any one of the categories changed, a new segment was created. The segment information and inventory for all roads within Northville can be found in Appendix E. This information was later utilized as input parameters for the CartéGraph program to develop the ten-year work plans. Pavement areas for each pavement segment were determined by creating closed poly-lines in the AutoCAD drawings. The data was then compiled and used to create four color-coded maps showing the segment characteristics. Color-coded maps for the entire City of Northville are located in Appendices A thru D. The input parameters for pavement Overall Condition Index (OCI), Pavement Use, Pavement Priority and Pavement Classification are detailed below: Overall Condition Index The Overall Pavement Condition Index (OCI) is used to determine whether or not pavement segments are in need of maintenance, repair, or replacement. The OCI of each segment was determined in the field by visually evaluating the pavement, and assigning a numerical modified PASER rating between 0 and 100. SDA then set up CartéGraph to correspond with the modified PASER Ratings. The modified PASER rating scales for asphalt and concrete are displayed in Table 2.0 and 3.0 below to show typical distresses in each rating category.
Table 2.0 – Modified ASPHALT PASER Ratings Modified
PASER Rating Typical Distresses – Asphalt Pavement
100 Excellent None. 90 Excellent Very few isolated cracks. All cracks sealed or tight (open less than 1/4”).
80 Very Good No longitudinal cracks except reflection of paving joints. Occasional transverse cracks, widely spaced (40’ or greater). All cracks sealed or tight (open less than 1⁄4”).
70 Good
Very slight or no raveling, surface shows some traffic wear. Longitudinal cracks (open 1⁄4”) due to reflection or paving joints. Transverse cracks (open 1⁄4”) spaced 10’ or more apart, little or slight crack raveling. No patching or very few patches in excellent condition.
60 Good
Slight raveling (loss of fines) and traffic wear. Longitudinal cracks (open 1⁄4”– 1⁄2”), some spaced less than 10’. First sign of block cracking. Sight to moderate flushing or polishing. Occasional patching good condition.
City of Northville Municipal Pavement Management System 2013 Update Page 6 of 27
50 Fair
Moderate to severe raveling (loss of fine and coarse aggregate). Longitudinal and transverse cracks (open 1⁄ 2”) show first signs of slight raveling and secondary cracks. First signs of longitudinal cracks near pavement edge. Block cracking up to 50% of surface. Extensive to severe flushing or polishing. Some patching or edge wedging in good condition.
40 Fair Severe surface raveling. Multiple longitudinal and transverse cracking with slight raveling. Longitudinal cracking in wheel path. Block cracking (over 50% of surface). Patching in fair condition. Slight rutting or distortions (1⁄2” deep or less).
30 Poor
Closely spaced longitudinal and transverse cracks often showing raveling and crack erosion. Severe block cracking. Some alligator cracking (less than 25% of surface). Patches in fair to poor condition. Moderate rutting or distortion (1” or 2” deep). Occasional potholes.
20 Very Poor Alligator cracking (More than 25% of surface). Severe distortions (More than 2” deep) Extensive patching in poor condition. Potholes.
10 Failed Severe distress with extensive loss of surface integrity.
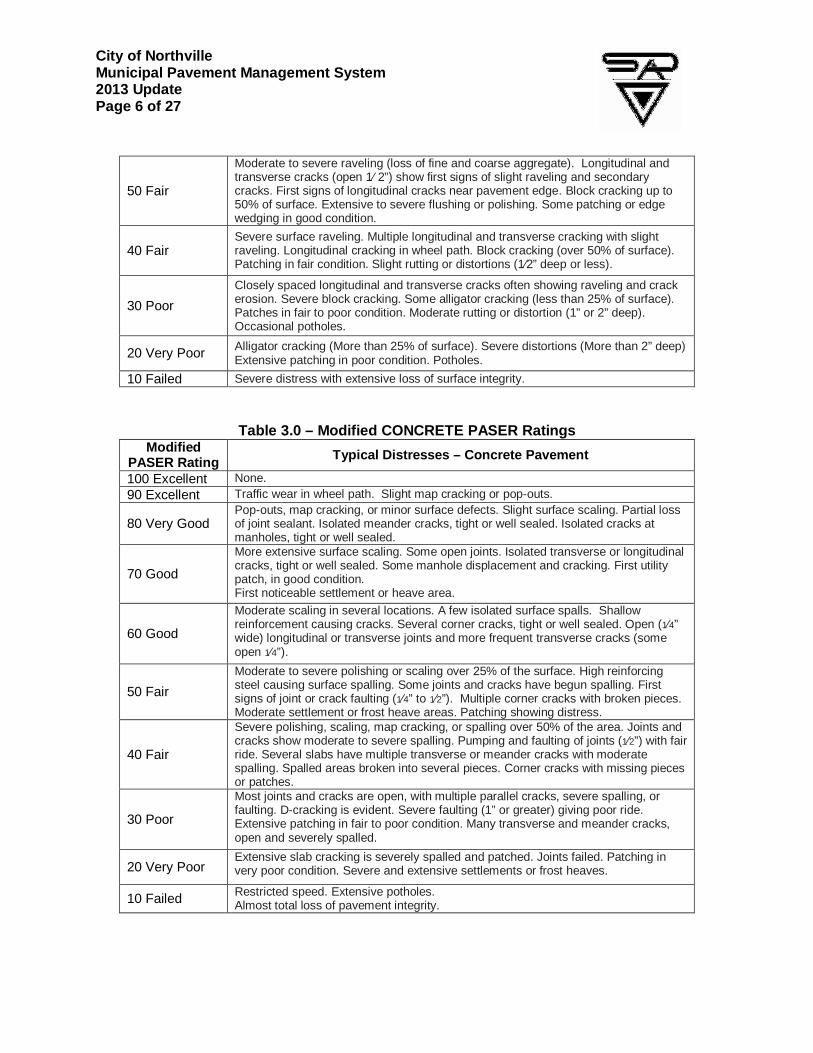
Table 3.0 – Modified CONCRETE PASER Ratings Modified
PASER Rating Typical Distresses – Concrete Pavement
100 Excellent None. 90 Excellent Traffic wear in wheel path. Slight map cracking or pop-outs.
80 Very Good Pop-outs, map cracking, or minor surface defects. Slight surface scaling. Partial loss of joint sealant. Isolated meander cracks, tight or well sealed. Isolated cracks at manholes, tight or well sealed.
70 Good
More extensive surface scaling. Some open joints. Isolated transverse or longitudinal cracks, tight or well sealed. Some manhole displacement and cracking. First utility patch, in good condition. First noticeable settlement or heave area.
60 Good
Moderate scaling in several locations. A few isolated surface spalls. Shallow reinforcement causing cracks. Several corner cracks, tight or well sealed. Open (1⁄4” wide) longitudinal or transverse joints and more frequent transverse cracks (some open 1⁄4”).
50 Fair
Moderate to severe polishing or scaling over 25% of the surface. High reinforcing steel causing surface spalling. Some joints and cracks have begun spalling. First signs of joint or crack faulting (1⁄4” to 1⁄2”). Multiple corner cracks with broken pieces. Moderate settlement or frost heave areas. Patching showing distress.
40 Fair
Severe polishing, scaling, map cracking, or spalling over 50% of the area. Joints and cracks show moderate to severe spalling. Pumping and faulting of joints (1⁄2”) with fair ride. Several slabs have multiple transverse or meander cracks with moderate spalling. Spalled areas broken into several pieces. Corner cracks with missing pieces or patches.
30 Poor
Most joints and cracks are open, with multiple parallel cracks, severe spalling, or faulting. D-cracking is evident. Severe faulting (1” or greater) giving poor ride. Extensive patching in fair to poor condition. Many transverse and meander cracks, open and severely spalled.
20 Very Poor Extensive slab cracking is severely spalled and patched. Joints failed. Patching in very poor condition. Severe and extensive settlements or frost heaves.
10 Failed Restricted speed. Extensive potholes. Almost total loss of pavement integrity.

City of Northville Municipal Pavement Management System 2013 Update Page 7 of 27
The typical pavement deterioration curve as shown below, in Figure 1.0, shows how the deterioration rate varies depending on the OCI conditions throughout the life-cycle of the pavement. Deterioration rates are also dependent upon several other factors, including: original design, quality of original construction, subgrade condition, traffic loadings, and climate. Pavement deterioration can fluctuate significantly depending on these factors. As pavement condition reaches the critical range, loadings, moisture intrusion and other environmental conditions can allow the pavement to deteriorate from good condition (60-80) to poor condition (10-30) in a short time frame. SDA developed unique deterioration curves in the CartéGraph program for each type of pavement found in Northville.
Figure 1.0
The updated weighted average OCI of the Northville pavement network is at 49.74, which is below the approximate critical point of 57 on the deterioration curve. This indicates that the best management strategy will be a combination of preventative maintenance and major pavement repairs, which includes rehabilitation and reconstruction. SDA recommends allocating an annual allowance to provide preventative maintenance repairs such as crack and joint sealing, which will help prolong life expectancy in good condition areas, and “stretch” the deterioration curve. The remaining repair funds should be allocated to provide rehabilitation and reconstruction repairs, with a focus on providing cost-effective rehabilitation strategies before pavements deteriorate to the point where they require more costly reconstruction. End of Useful Life - Pavement deteriorates based upon numerous factors as discussed above. Pavement deterioration follows a curve with a critical pavement condition index range that is generally considered to be between a modified PASER rating of 57 and 75 on the curve. The “critical point” of 57 on the curve is considered the threshold that when the pavement condition falls below, preventative maintenance measures become less cost-effective. Some form of rehabilitation is required for the pavement to restore serviceability when pavement falls below the critical point, which requires a significant increase in costs. Upon further deterioration, an end of useful life is reached when the pavement is considered to be a safety hazard; at this point, even more costly and extensive reconstruction repairs are required to restore the service condition. A modified PASER condition rating of 15 is typically viewed as the end of useful life.

City of Northville Municipal Pavement Management System 2013 Update Page 8 of 27
Evaluation of the pavement on a consistent basis will maximize capital expenditures by providing the most cost-effective repairs in each area. Pavement Use Each segment was also categorized by Pavement Use. Pavement Use is generally related to the location, degree of utilization, and expected traffic type/frequency of a particular road segment. How the pavement is used is a key determining factor for planning future repairs. The four Pavement Use categories are broken down as either Residential or Commercial, and either Local or Major roadways. Table 4.0 below gives an overview of the Pavement Use categories.
Table 4.0 – Pavement Use Categories Use Category Description
Commercial - Major
Road segments that service commercial areas that are frequently utilized by a high percentage of residents. These segments receive higher traffic loadings and volumes, and likely provide access to county or state roads.
Commercial - Local
Road segments that service low traffic commercial areas. These segments typically receive higher traffic loadings but lower traffic volumes. May service as commercial parking areas adjacent to streets in downtown.
Residential - Major
Road segments that service higher traffic residential areas. These segments typically receive higher traffic volumes, but lower traffic loadings, and typically provide primary access from residential areas to commercial areas.
Residential - Local
Road segments that service lower traffic residential areas. These segments typically receive lower traffic volumes and loadings, and typically provide access between residential areas, or secondary access to commercial areas.
Pavement Priority The segments were also categorized by Pavement Priority. Priority ratings are generally associated with the Pavement Use, and were developed to enable repair funding preferences to occur within the Northville pavement network. More frequently used segments, and those that are commonly seen by a higher volume of the general public, typically have a higher Pavement Priority. The Pavement Priority categories are: High, Medium, and Low, as shown in Table 5.0.
Table 5.0 – Pavement Priority Categories Priority
Category Description
High High priority pavements receive frequent amounts of commercial traffic and are regularly utilized by a high percentage of residents. Typical corresponding Pavement Use category: Commercial - Major
City of Northville Municipal Pavement Management System 2013 Update Page 9 of 27
Medium Medium priority pavements receive a combination of periodic commercial traffic and frequent residential traffic. Typical corresponding Pavement Use categories: Commercial – Local, Residential - Major
Low Low priority pavements receive only residential traffic, and are mostly utilized by local residents. Typical corresponding Pavement Use category: Residential - Local
Pavement Classification The Pavement Classification differentiates pavements based on material such as asphalt or concrete, as well as the pavement thickness, aggregate base thickness, and subgrade soil material. Pavement Classification is used to define the types of pavement that make up each road segment, and will affect future repair strategies and costs. For this project, the Pavement Classification categories are categorized based on surface material (asphalt or concrete), and cross-section thickness (standard or heavy duty cross-sections). Cross-section thicknesses generally correlate with the Pavement Use category when it came to classifying Major and Local roads. In addition to asphalt and concrete pavement, there were several areas that were classified as asphalt overlaid concrete. The five classification categories are: Asphalt Standard Duty (AC SD), Asphalt Heavy Duty (AC HD), Concrete Standard Duty (PCC SD), Concrete Heavy Duty (PCC HD), and Asphalt overlaid Concrete (APC). See Table 1.0 earlier in the report for specific information on each pavement type. SUMMARY OF NORTHVILLE PAVEMENT NETWORK
SDA determined that there is a total of approximately 3,897,756 square feet of pavement in the Northville network. The updated weighted average OCI for the overall pavement network is 49.74. This number encompasses all pavement segments that comprise roadways under Northville’s jurisdiction. The two charts below, Figures 2.0 and 3.0, display the pavement conditions by total area and percentage distribution. As an overall network, a little more than one-third (34.6%) of Northville’s pavement assets are currently in poor or worse overall condition. The widely-spread distribution of pavement conditions further emphasizes the need to establish a ”mix of fixes” repair strategy. Due to the size of the network, SDA strongly recommends that Northville maintains an annual budget that specifies allocations for preventative maintenance, rehabilitation, and reconstruction. Doing so with an appropriate overall budget will help keep the backlog, or accumulation of needed repairs, from growing exponentially and will gradually improve the overall network OCI throughout the ten-year plan.

City of Northville Municipal Pavement Management System 2013 Update Page 10 of 27
Figure 2.0
Condition AreasNorthville Overall Network - 2013 Update
84,385
254,432279,292
423,985 407,976
262,680
834,496
979,951
370,559
00
200,000
400,000
600,000
800,000
1,000,000
1,200,000
NewPavement
Excellent Very Good Good+ Good Fair+ Fair Poor Very Poor FailedPavement
Overall Condition Index (OCI)
Are
a (S
quar
e F
eet)
Figure 3.0
Condition DistributionNorthville Overall Network - 2013 Update
7.2%
10.9%
10.5%
6.7%21.4%
9.5%
25.1%
0% 2.2%
6.5%
New Pavement
Excellent
Very Good
Good+
Good
Fair+
Fair
Poor
Very Poor
Failed Pavement

City of Northville Municipal Pavement Management System 2013 Update Page 11 of 27
The charts below, Figures 4.0 and 5.0, show the Pavement Use areas and percentage distribution throughout the network. Note that pavements identified as “Residential – Local” roadways constitute over 65% of the entire network.
Figure 4.0
Pavement Use Areas Northville Overall Network - 2013 Update
880,122
174,398301,982
2,541,254
0
500,000
1,000,000
1,500,000
2,000,000
2,500,000
3,000,000
Commerical - M ajo r Commerical - Local Residential - M ajo r Residential - Local
Pavement Use
Are
a (S
quar
e F
eet)
Figure 5.0
Pavement Use DistributionNorthville Overall Network - 2013 Update
4.5%
7.7%65.2%
22.6%
Commerical - Major
Commerical - Local
Residential - Major
Residential - Local

City of Northville Municipal Pavement Management System 2013 Update Page 12 of 27
The Pavement Priority distribution, Figure 6.0, is shown below. Low priority areas account for 70% of the network pavements, which corresponds with Residential-Local being the majority of the Pavement Use distribution.
Figure 6.0
Pavement Priority DistributionNorthville Overall Network - 2013 Update
High18.9%
Medium11.1%
Low70.0%
Figure 7.0 below, gives a distribution of the OCI ranges within each Pavement Priority category for the entire network pavement area. For example, 56.4% of the pavements in the network that were considered to be high priority had an OCI of 66 or better.
Figure 7.0
OCI Distribution within Priority CategoriesNorthville Overall Network - 2013 Update
14.2%
55.4%56.4%48.5%
9.0%
19.3%
37.3%35.6%
24.2%
0.0%
10.0%
20.0%
30.0%
40.0%
50.0%
60.0%
70.0%
80.0%
90.0%
100.0%
High Medium Low
Pavement Priority
Per
cent
Are
a
OCI 66-100
OCI 36-65
OCI 0-35
City of Northville Municipal Pavement Management System 2013 Update Page 13 of 27
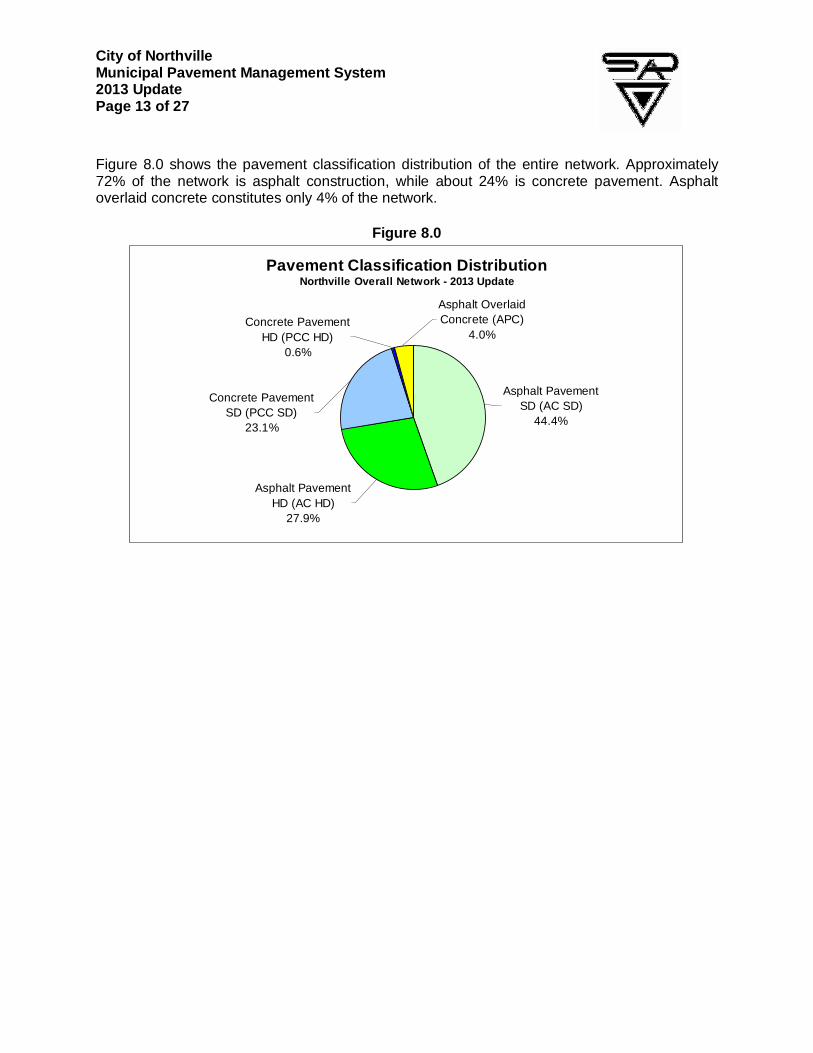
Figure 8.0 shows the pavement classification distribution of the entire network. Approximately 72% of the network is asphalt construction, while about 24% is concrete pavement. Asphalt overlaid concrete constitutes only 4% of the network.
Figure 8.0
Pavement Classification DistributionNorthville Overall Network - 2013 Update
Asphalt Pavement SD (AC SD)
44.4%
Concrete Pavement HD (PCC HD)
0.6%
Concrete Pavement SD (PCC SD)
23.1%
Asphalt Overlaid Concrete (APC)
4.0%
Asphalt Pavement HD (AC HD)
27.9%

City of Northville Municipal Pavement Management System 2013 Update Page 14 of 27
TEN-YEAR WORK PLAN PARAMETERS
One of the primary goals of the pavement management system is to develop a conceptual, network wide, ten-year work plan to help predict future repairs. The work plan utilizes a budget based on Northville’s projected funding allocations, and then distributes the funds for preventative maintenance, rehabilitation and reconstruction repairs based on the input parameters for each pavement segment. Each segment is re-evaluated in every year of the plan. A current OCI is determined based on appropriate deterioration curves that have been incorporated into the program, and any conceptual repairs that may have been assigned to a segment in a previous plan year. The system is then able to prioritize the overall network to determine which segments receive funding, how much funding is received, and how the conceptual repairs will improve the overall network OCI. After performing the inventory, inspection, and analysis of the pavement conditions throughout the Northville network, the ten-year work plan compares how effectively the proposed funds are at providing an acceptable overall condition index (OCI) for the network. SDA utilizes CartéGraph PavementVIEW and PavementVIEW Plus software to assist in generating a ten-year work plan. This program can be easily customized to fit the requirements and philosophies of Northville, as they may change throughout the years. As with any computer prediction, the quality of the output is directly related to the quality of the input. Therefore, we present our goal for the analysis, the management strategy, and the input factors involved in this computer model. Goal – In the case of a pavement management analysis, our goal is to predict the financial needs of the pavement system over a period of time to reach a defined benchmark. For this analysis, SDA utilized three predicted annual budgets that were provided by Northville for comparison. The goal is to determine how effective these budgets are at maintaining the pavement network throughout the ten-year time period. The network level OCI at the end of the tenth plan year serves as the indicator for the effectiveness of each annual budget. Strategy – The basic philosophy of pavement management is to apply preventive maintenance treatments at appropriate times to retard the rate of pavement deterioration. Both preventative maintenance and rehabilitation techniques should be applied at a time when they are cost-effective, instead of letting the pavement deteriorate to failure and require expensive reconstruction. Accordingly, our pavement management strategy follows this same philosophy. We target a repair strategy that combines preventative maintenance, rehabilitation, and reconstruction where necessary. Numerous studies have shown that a strategy of only reconstruction of the failed pavements will cost significantly more than this combined approach throughout a defined analysis period. The reason for this is properly applied preventive maintenance treatments effectively “stretch” the pavement deterioration curve. Input - Most computer models require a significant amount of input information. A pavement condition prediction is no different. Some of the input factors are easily defined, whereas others require some assumptions and interpretation of related technical data. The findings from the field investigation such as OCI, Pavement Use, Pavement Priority, and Pavement Classification are the main inputs into the system. Additional information such as pavement age and previous repairs is also used in the analyses.

City of Northville Municipal Pavement Management System 2013 Update Page 15 of 27
NPR – Network Priority Ranking (NPR) CartéGraph uses a concept of Network Priority Ranking (NPR) to prioritize the pavement segment repair selection. This calculation essentially computes a weighted average based on the selected input fields and weighting factors. The higher a particular segments NPR, the more likely it will be chosen for repair. The variables involved in the NPR calculation are almost limitless, but must contain at least the OCI (Overall Condition Index), Use, Pavement Priority, and Pavement Classification. Each of the factors has a rank associated with each value, which is defined by the user. If factors other than those recommended below are required for the computation, that data must be incorporated into the NPR computation. A ranking system of the variables must also be determined. The NPR used for the Northville 2013 update model analyses is shown in Table 6.0 below:
Table 6.0 – NPR Weighting Factors
Input Factor Weighting Description
OCI 15 15/30 of the NPR Priority 6 6/30 of the NPR Use 5 5/30 of the NPR Area 3 3/30 of the NPR Classification 1 1/30 of the NPR Total 30
OCI – Overall Condition Index (OCI) The numerical OCI value stands alone in this computation, and does not have a rank associated with it. Northville’s program was set up to assign the numerical value of [100 minus the segment OCI] to each particular segment, therefore assigning a higher weight to pavements in inferior condition. Area The numerical value for area stands alone in this computation, and does not have a rank associated with it. The following charts outline the numerical values associated with rankings within each remaining input category, shown in Tables 7.0 through 9.0 below:
Table 7.0 – Pavement Priority Values within NPR
Pavement Priority Category Rank High 90 Medium 80 Low 70

City of Northville Municipal Pavement Management System 2013 Update Page 16 of 27
Table 8.0 – Pavement Use Values within NPR
Use Category Rank Commercial - Major 90 Commercial - Local 85 Residential - Major 85 Residential - Local 80
Table 9.0 – Surface Classification Values within NP R
Classification Category Rank* Asphalt – Heavy Duty (AC HD) 90 Asphalt – Standard Duty (AC SD) 90 Concrete – Heavy Duty (PCC HD) 90 Concrete – Heavy Duty (PCC SD) 90 Asphalt Overlaid Concrete (APC) 90 *It was decided not to differentiate segments based on Surface Classification since surface classifications generally correspond with Pavement Use and Priority.
Another key input into CartéGraph that affects the ten-year work plan results is the Minimum Allowable Conditions rating. A Minimum Allowable Condition rating is set for the network to allow particular pavement segments to be chosen for repairs, regardless of their NPR rating. Ideally, the pavement should never reach this condition unless the segment NPR becomes low enough to never receive budget allocations under normal circumstances. The Minimum Allowable Condition input ensures that the segment’s OCI does not drop below the specified number as long as the supplied budget is adequate for the network. For this analysis, the Minimum Allowable Condition rating was set at 30 for the entire network. SDA feels that an OCI of 30 is still at the point where most low priority segments are still in serviceable condition, and would benefit from rehabilitation. An OCI of 30 is still high enough on the Pavement Curve that rehabilitation measures can typically still be applied, rather than more costly reconstruction. Again, it is important to note that budget constraints may directly affect the chosen repairs within the network. A low budget amount that does not allow for the repair of all segments that are in need may keep these segments below the Minimum Allowable Condition. In addition to the input that CartéGraph uses to determine pavement conditions and repair priorities, there are also inputs relating to the repair strategies and costs, as well as budget types and amounts. The CartéGraph program uses general pavement repair activities for planning and budgeting purposes. The type of repair activity is chosen based on the OCI and Pavement Classification. For example, an “AC-50 HD” repair activity is applied if the segment is asphalt concrete (AC), the OCI falls within the range of 46 and 55, and the asphalt consists of a heavy-duty (HD) cross-section. Since the activities are intended to address multiple segments that may fall into a particular OCI range due to varying distresses, they are setup to allow multiple repair actions instead of a single action for one particular distress. For example, a PCC-40 SD activity likely consists of approximately 25% slab replacement within the segment as well as isolated partial or full-depth joint repairs. Certain segments that meet the criteria for a PCC-40 SD might require

City of Northville Municipal Pavement Management System 2013 Update Page 17 of 27
more slab replacement, but less joint repairs. To account for the different pavement cross-sections that are commonly used in Northville, multiple unit costs are provides for asphalt and concrete pavements. A PCC-40 HD would generally consist of the same repairs as a PCC-40 SD, but has a higher unit cost to reflect the added repair expense from the thicker cross-section. Further detail for specific repairs on each segment will be determined on a yearly basis in the project-level analysis and subsequent design process. Some repair types are intended to repeat on a normal schedule, particularly those associated with preventative maintenance. For example, we recommend crack filling asphalt segments on a periodic basis. General repair activities have been created for pavement classification type, throughout the condition spectrum. The only exceptions are for asphalt pavements with an OCI above 85, and concrete segments with an OCI above 75. These pavements generally require no action be taken because they are new or in excellent condition. The budget inputs are the last key series of data that affect the results of the ten-year work plan. There are two budget types that are included in the overall budget plan for Northville: 1) Preventative Maintenance and 2) General. The model was set up in this manner due to Northville’s desire to allocate a specific annual allowance for preventative maintenance. Required rehabilitation and reconstruction repairs in each plan year will come out of the General budget. The budget types and dollar amounts can also be modified from year to year to account for fluctuations in the availability of real-world funds. Budgets affect the plan by limiting funds available for segments that meet the criteria for repair activities associated with each budget type. When the funding for one budget type is gone, no other repair activities within that budget will be done in that plan year. Table 10.0 below overviews the repair activities, budget types, and repair costs used in the CartéGraph model.
Table 10.0 – CartéGraph Repair Activities
Repair Activity Budget Type Pavement
Classification Typical Repairs **Avg. Cost per
S.F.
SD HD AC-80 Preventative
Maintenance
Asphalt Crack Sealing (overband) $0.06 $0.06
AC-70 Preventative Maintenance
Asphalt Crack Sealing (overband) $0.16 $0.16
AC-60 General (Rehabilitation)
Asphalt Crack Sealing (requires routing) Isolated Cut and Patch Possible thin Overlay Re-stripe
$3.15 $3.15
AC-50 General (Rehabilitation)
Asphalt Isolated Cut and Patch 1.5” Mill and Replace Re-stripe
$3.60 $3.60
AC-40 General (Rehabilitation)
Asphalt Isolated Cut and Patch 2” Mill and Replace Re-stripe
$3.90 $3.90
AC-30 General (Rehabilitation / Reconstruction)
Asphalt 3” Mill and Replace Proof-roll and perform incremental milling and replacement or full-
$4.65 $4.65

City of Northville Municipal Pavement Management System 2013 Update Page 18 of 27
depth repairs where required Re-stripe
AC-20 General (Rehabilitation / Reconstruction)
Asphalt 3” Mill and Replace Proof-roll and perform incremental milling and replacement or full-depth repairs where required Re-stripe
$4.80 $4.80
AC-10 General (Reconstruction)
Asphalt Full-Depth Asphalt and Base Reconstruction required
$6.75 $8.25
PCC-70 Preventative
Maintenance Concrete Crack and Joint Sealing $0.50 $0.50
PCC-60 Preventative Maintenance
Concrete Crack and Joint Sealing Isolated Patching or Joint Repair
$3.10 $3.10
PCC-50 General (Rehabilitation)
Concrete Approximately 10% Full-Depth Patching. Crack Sealing and Joint Cleaning/Sealing, Isolated Full- Depth Joint Repair.
$4.00 $4.35
PCC-40 General (Rehabilitation)
Concrete Approximately 25% Full-Depth Patching. Isolated Full-Depth Joint Repair or Chipping and Patching Spalled Joints.
$5.15 $5.35
PCC-30 General (Rehabilitation / Reconstruction)
Concrete 3” Mill and Asphalt Overlay Isolated Full-Depth Patching prior to Overlay. Isolated Undercutting and Base Replacement required.
$5.70 $5.90
PCC-20 General (Rehabilitation / Reconstruction)
Concrete 3” Mill and Asphalt Overlay Isolated Full-Depth Patching and Joint Repair prior to Overlay. Isolated Undercutting and Base Replacement required.
$6.10 $6.50
PCC-10 General (Reconstruction)
Concrete Remove and Replace Concrete Pavement in entire area. Extensive Undercutting and Base Replacement required.
$12.25 $14.00
APC-80 Preventative
Maintenance Asphalt Overlaid
Concrete Crack Sealing (Overband) $0.06
APC-70 Preventative Maintenance
Asphalt Overlaid Concrete
Crack Sealing (Overband) $0.16
APC-60 General (Rehabilitation)
Asphalt Overlaid Concrete
Approximately 10% Asphalt Surface Patching Possibly thin Overlay
$3.20
APC-50 General (Rehabilitation)
Asphalt Overlaid Concrete
1.5” Mill and Replace Asphalt Isolated Full-Depth Concrete Patching
$4.65
APC-40 General (Rehabilitation)
Asphalt Overlaid Concrete
2” Mill and Replace Asphalt Isolated Full-Depth Concrete Patching
$5.50
APC-30 General (Rehabilitation / Reconstruction)
Asphalt Overlaid Concrete
3” Mill and Replace Asphalt Isolated Full-Depth Concrete Patching
$6.45
APC-20 General (Reconstruction)
Asphalt Overlaid Concrete
Mill entire asphalt layer. Perform isolated full-depth concrete patching with isolated undercutting and base replacement required. Replace entire asphalt layer.
$7.25

City of Northville Municipal Pavement Management System 2013 Update Page 19 of 27
APC-10 General (Reconstruction)
Asphalt Overlaid Concrete
Remove asphalt and concrete pavement in entire area. Install heavy-duty concrete section. Extensive undercutting and base replacement required.
$14.75
** Average cost associated with a series of repairs anticipated for the designated condition. As part of the 2013 update of the program, SDA reviewed the bid cost information from the most recent capital paving project in Northville. Along with input from the City, this cost information was used to update the repair strategy for the varying conditions as well as the overall unit cost for each repair activity. The unit cost for each repair activity includes an allowance per square foot for the necessary sidewalk, ramp, and curb and gutter repairs for each segment so these can be implemented during the time of pavement construction. With that being said, a separate $35,000 annual allowance for isolated sidewalk, ramp, and curb and gutter repairs is still included in the project budget for spot repairs outside of the annual recommended segment repairs. CartéGraph has the ability to predict the repairs and costs that will be required to keep the overall pavement network at a pre-determined, acceptable condition level for the next ten years. This is referred to as “OCI-Driven Analysis”. Since Northville already has a predicted annual funding budget, SDA instead utilized “Budget-driven Analysis”. Budget-driven Analyses takes the provided budget and shows the resulting network OCI. The two types of analyses are fully described as follows: (1) OCI-Driven Analysis : predicts the repairs and costs that will be required to keep the overall pavement network at a user-specified condition level for the next ten years. (2) Budget-Driven Analysis : predicts the repairs and resulting network pavement conditions throughout the next ten years using pre-determined budget allocations. CartéGraph will add any activities that weren’t completed because of lack of funds to the next plan year, and adjust the rest of the ten-year plan accordingly. For the updated program, the City of Northville informed SDA that the $350,000 budget used in the last report should still be used in the 2013 update analysis. However, SDA was also informed that the City is planning to present a millage issue regarding street repairs to the voting citizens in August 2013, which if approved would potentially add an extra $600,000 to the existing budget. Therefore, the City requested a second budget scenario be run within CartéGraph for comparison. The City also noted that if the millage increase is approved, it would consider paying into a bond issue to increase the budget amount for the first three years. Therefore, the City requested a total of three budget scenarios in order to compare how the OCI is affected during the ten years. The first year of the ten-year plan for all three scenarios includes a set budget of $440,000 since the City already has a desired work plan in place. An overview of the three budgets used in the Northville’s analysis can be seen in Table 11.0.

City of Northville Municipal Pavement Management System 2013 Update Page 20 of 27
Table 11.0 – Budget Plans
$350K BUDGET SCENARIO Dollar Allocation
General (Rehabilitation or Reconstruction) $380,000
Preventative Maintenance $25,000
Sidewalk Allowance $35,000 FY2014
ANNUAL TOTAL $440,000
General (Rehabilitation or Reconstruction) $290,000
Preventative Maintenance $25,000
Sidewalk Allowance $35,000
FY2015 thru
FY2023 ANNUAL TOTAL $350,000
$950K BUDGET SCENARIO Dollar Allocation
General (Rehabilitation or Reconstruction) $380,000
Preventative Maintenance $25,000
Sidewalk Allowance $35,000 FY2014
ANNUAL TOTAL $440,000
General (Rehabilitation or Reconstruction) $890,000
Preventative Maintenance $25,000
Sidewalk Allowance $35,000
FY2015 thru
FY2023 ANNUAL TOTAL $950,000
BOND BUDGET SCENARIO Dollar Allocation
General (Rehabilitation or Reconstruction) $380,000
Preventative Maintenance $25,000
Sidewalk Allowance $35,000 FY2014
ANNUAL TOTAL $440,000
General (Rehabilitation or Reconstruction) $1,940,000
Preventative Maintenance $25,000
Sidewalk Allowance $35,000
FY2015 thru
FY2017 ANNUAL TOTAL $2,000,000
General (Rehabilitation or Reconstruction) $440,000
Preventative Maintenance $25,000
Sidewalk Allowance $35,000
FY2018 thru
FY2021 ANNUAL TOTAL $500,000
General (Rehabilitation or Reconstruction) $540,000
Preventative Maintenance $25,000
Sidewalk Allowance $35,000
FY2022 thru
FY2023 ANNUAL TOTAL $600,000

City of Northville Municipal Pavement Management System 2013 Update Page 21 of 27
CartéGraph also has the ability to adjust the inflation for the plan period. The inflation rate was set to 1.0% to account for the increase in repair activity costs in the subsequent nine years of the ten-year plan. Inflation can be adjusted to be consistent with other projections. It should be clearly understood that changes to any of the above technical inputs, or plan parameters will affect the results of the analysis. SDA has selected the parameters based on some initial assumptions, information obtained from the City of Northville, and engineering judgment. The program can be modified in the future to account for changing goals, varying budgets, or altering management philosophies as required by the City of Northville. Approaching a large pavement network with a ten-year plan strategy provides a comprehensive and detailed process that will lead to cost-effective annual repair projects. The process we have shown here in has been tested and proven over years of development and use. TEN-YEAR WORK PLAN RESULTS AND RECOMMENDATIONS
The calculation of the work plan involves CartéGraph running detailed analysis while accounting for the previously discussed input parameters. The program determines the NPR of each segment. It then determines which repair activities can be performed within the allocated total budget for each of the three budget scenarios, and the potential segments for repair that have the highest NPR are selected first in the repair recommendations. The program will select segments to repair until the annual budget allocations are gone. It will progress down the NPR ranking until it finds a suitable project that will both raise the network OCI to an acceptable level while also minimizing costs. As a result, we end up with some small projects, which we may not necessarily do, or projects too large to fit into a given years budget. We consider this the “raw” output or results. The “raw” results can be manipulated, and scenarios re-calculated. Some manual manipulation of the results was performed for this analysis to develop the work plan presented. The work plan is the result of a specific set of input criteria. Changes to any of the input criteria will impact the results of the plan. The full CartéGraph output including budget summaries with resulting network OCI levels at the end of each year, along with specific segment repair recommendations and planned costs can be found in Appendices F and G. Work plan maps for the ten years of each budget scenario are located in Appendix H. A naming convention was developed for each segment to signify the road name, and segment number within each particular road, as most roads contain multiple pavement segments. For example, the second segment within Rayson Street is named: RYS 02. A spreadsheet with a complete list of segments in the Northville network is provided in Appendix E. All input parameters associated with each segment are also provided in this spreadsheet. SDA implemented the three Budget-Driven scenarios to provide Northville with a comparison of the various impacts on the overall pavement network. The results of the Budget-Driven Analysis with the existing $350,000 annual budget determined that the network-level OCI will consistently fall throughout the ten-year time period, from a current level of 49.74, to a level of 38.49 at the end of the tenth year, implying significant project under-funding. Therefore, it is imperative that the millage increase is approved in order to improve the condition of the existing pavement network. The $950,000 annual budget associated with the millage increase provides a steady

City of Northville Municipal Pavement Management System 2013 Update Page 22 of 27
increase in OCI each year until the final OCI level after ten years ends up at 59.86. Furthermore, the bond scenario, which provides significant funding upfront during the ten-year plan increases the OCI rapidly to 65.83 after the first few years of repairs, but then the OCI is basically maintained at 65 for the remaining years of the ten-year plan due to a significant decrease in annual funds. While the Bond budget scenario yields the highest average OCI after ten years, it is important to note that this budget will continue to simply maintain the overall condition at an approximate rating of 65 while the $950,000 annual budget will continue to slowly increase the network OCI over time. Based on the comparison of the results of the three Budget-Driven analyses, SDA determined that t he existing annual budget of $350,000 is insufficient to adequately maintain the Northville Pavement Network. Therefore, it is vital that the proposed millage in crease be approved in order to increase the network-level OCI to an acceptable level. If th e millage increase is implemented, SDA recommends that Northville implement the $950,000 a nnual budget scenario in order to steadily increase the network’s condition over time . We also note that based on the total pavement area and projected funding amounts, these results are consistent with other large pavement networks with which SDA has been involved in maintaining. The following information in Table 12.0 summarizes the results of the three budget scenarios.
Table 12.0 – Summary of Budget Scenarios
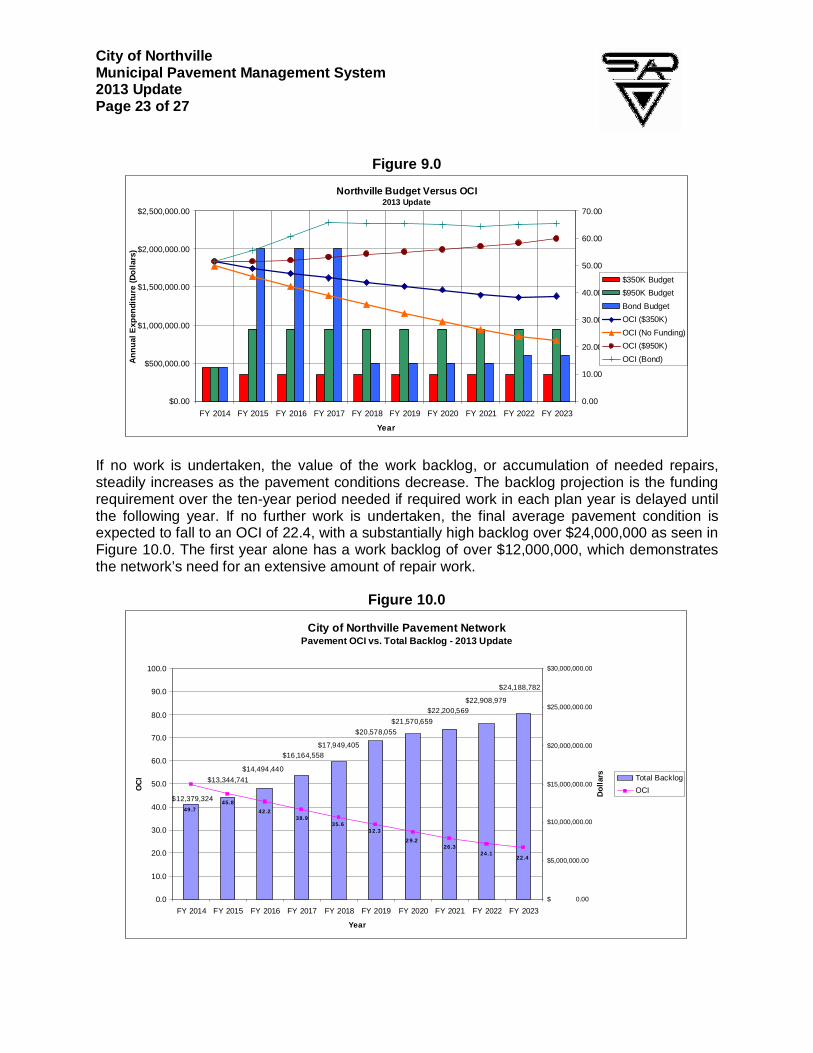
Figure 9.0, below, shows the results of the three budget scenarios on the network level OCI, compared to the network level OCI of a scenario where no funding is applied to the network. The $350K annual budget scenario shows a steady decline in OCI, indicating network-level project under-funding. The $950K annual budget scenario results in a consistent increase in the network-level OCI over the ten year period. The Bond scenario helps bring the OCI up to an approximate rating of 65 after the first few years; however, since the annual budget amount drops at this point, it simply helps maintain the network-level OCI at this level for the remaining years of the program. In the scenario where no funding is applied to the network, the OCI drops to a level of 22.39 at the end of the ten year period.
Scenario Type
Total Ten-Year Cost
Existing OCI
Final Network
OCI Budget Trends
$350K Annual $3,545,973 49.74 38.49 OCI steadily decreases annually
$950K Annual $8,959,447 49.74 59.86 OCI gradually increases annually
Bond Scenario $9,614,067 49.74 65.32 OCI quickly rises to 65 and is then maintained for
the remainder of the plan
City of Northville Municipal Pavement Management System 2013 Update Page 23 of 27
Figure 9.0
Northville Budget Versus OCI2013 Update
$0.00
$500,000.00
$1,000,000.00
$1,500,000.00
$2,000,000.00
$2,500,000.00
FY 2014 FY 2015 FY 2016 FY 2017 FY 2018 FY 2019 FY 2020 FY 2021 FY 2022 FY 2023
Year
Ann
ual E
xpen
ditu
re (
Dol
lars
)
0.00
10.00
20.00
30.00
40.00
50.00
60.00
70.00
OC
I
$350K Budget
$950K Budget
Bond Budget
OCI ($350K)
OCI (No Funding)
OCI ($950K)
OCI (Bond)
If no work is undertaken, the value of the work backlog, or accumulation of needed repairs, steadily increases as the pavement conditions decrease. The backlog projection is the funding requirement over the ten-year period needed if required work in each plan year is delayed until the following year. If no further work is undertaken, the final average pavement condition is expected to fall to an OCI of 22.4, with a substantially high backlog over $24,000,000 as seen in Figure 10.0. The first year alone has a work backlog of over $12,000,000, which demonstrates the network’s need for an extensive amount of repair work.
Figure 10.0
City of Northville Pavement Network Pavement OCI vs. Total Backlog - 2013 Update
$21,570,659
$22,908,979$22,200,569
$12,379,324
$13,344,741
$17,949,405
$14,494,440
$20,578,055
$24,188,782
$16,164,558
35.638.9
42.2
45.849 .7
3 2.3
2 9.226.3
24.122.4
0.0
10.0
20.0
30.0
40.0
50.0
60.0
70.0
80.0
90.0
100.0
FY 2014 FY 2015 FY 2016 FY 2017 FY 2018 FY 2019 FY 2020 FY 2021 FY 2022 FY 2023
Year
OC
I
$ 0.00
$5,000,000.00
$10,000,000.00
$15,000,000.00
$20,000,000.00
$25,000,000.00
$30,000,000.00
Dol
lars Total Backlog
OCI

City of Northville Municipal Pavement Management System 2013 Update Page 24 of 27
The ten-year work plans for all three budget scenarios are presented in tabular form in Appendix I. Information displayed includes the Road Name, Segment ID number, the Segment Area, the CartéGraph Plan Activity, the Projected Cost of the proposed repair project, and the Anticipated Repairs to be performed for each project. The total cost for each plan year is also provided. Information within these tables corresponds directly with the pavement inventory spreadsheet, CartéGraph segment analysis recommendations, and work plan maps provided in Appendices E, G, and H, respectively. We stress, and highly recommend that isolated distresses must continuously be repaired as part of an ongoing maintenance program beyond the initial repairs chosen by CartéGraph. This type of maintenance program is handled with yearly allocated funding. For example, a pothole on a “70” rated asphalt pavement needs immediate attention or repair even though the repair recommendations addressing the rating category do not speak to these specific repairs. In this case, an AC-70 repair does not include isolated pothole repair. We recommend that Northville establish a general maintenance fund to allow for the immediate action or repair when dealing with these isolated situations to avoid problems or situations that may result from these isolated distresses. We caution using this plan for direct funding of repair projects. The purpose of an analysis of this level is to assist in selecting projects. Once projects are selected, a detailed “Project Level” analysis should be performed. It is during this inspection that specific repair techniques, overall scope of the project, and a project budget are determined. Once the project budget is determined, the funding should be requested. Skipping the project level inspection can result in under-funding or over-funding of the project, and potentially compromise the overall quality of the project. Over-funding can occur when the pavement deteriorates at a slower rate than predicted. When work is completed, the maintenance and repair database should be updated annually as work is completed. We also recommend re-assessing the ten-year plan annually at the end of construction. PAVEMENT LIFE
The repair activities used in the plan (Table 10.0) are intended to increase the pavement life expectancy. Repairs in the preventative maintenance category, such as crack sealing and surface sealing, are intended to retard the deterioration of the pavement, as opposed to dramatically increasing the pavement condition. Although rehabilitation or reconstruction will be needed eventually, the preventative maintenance activities provide the most cost-effective way to increase life-expectancy. Once a pavement reaches the point where rehabilitation repairs are required, the associated costs rise at an increasing rate as the condition deteriorates. Repairs such as cut and patching, overlays, and partial-depth milling and replacement increase the pavement condition rating and extend the life significantly, but at a greater cost than applying preventative maintenance. The repairs associated with reconstruction are the most extreme scenario. They essentially start the life-cycle over by increasing the condition rating to 100, but at the highest expense. The intention of the ten-year plan is to minimize the amount of reconstruction needed, and implement rehabilitation when possible. Preventative maintenance repairs are included within the pre-determined annual budget allocation. The effects of different repairs on the pavement

City of Northville Municipal Pavement Management System 2013 Update Page 25 of 27
life-expectancy are shown in Table 13.0 below. This information was obtained from the Federal Highway Administration; it gives time ranges for the benefits to the pavement, not for the treatments themselves. It is important to understand that these are estimated values, as the actual gains depend on numerous factors such as original construction quality, varying traffic loadings, sub-grade type, and climate conditions. SDA added the information regarding reconstruction activities.
Table 13.0 – Extended Service Life Gains for Paveme nt Treatments
Repair Activity Pavement Type Extended Service Life
(Years) Flexible Up to 2
Overband Crack Sealing Composite Up to 2
Flexible Up to 3
Composite Up to 3 Crack Sealing
Rigid Up to 3
Flexible 3 to 6 Single Chip Seal
Composite NA*
Flexible 4 to 7 Double Chip Seal
Composite 3 to 6
Flexible NA* Slurry Seal
Composite NA*
Flexible 3 to 5** Micro-surfacing (Single Course)
Composite NA*
Flexible 4 to 6** Micro-surfacing (Multiple Course)
Composite NA*
Flexible 3 to 5** Ultrathin Asphalt Overlay (0.75")
Composite 3 to 5**
Flexible 5 to 10 Asphalt Overlay (1.5")
Composite 4 to 9
Flexible 5 to 10 Mill and Overlay (1.5")
Composite 4 to 9
Flexible 7 to 12 Mill and Overlay (2.0")
Composite 7 to 12
Flexible 8 to 14 Pulverization and Overlay
Composite 8 to 14
Flexible 15 to 40 Full Reconstruction
Composite 15 to 40
Joint Resealing Rigid 3 to 5
Spall Repair Rigid Up to 5
Full-depth Concrete Repairs Rigid 3 to 10

City of Northville Municipal Pavement Management System 2013 Update Page 26 of 27
Diamond Grinding Rigid 3 to 5**
Dowel-bar Retrofit Rigid 2 to 3**
Concrete Pavement Restoration Rigid 7 to 15**
Full Reconstruction Rigid 15 to 50
*Sufficient data are not available to determine life-extending value
**Additional information is necessary to quantify the extended life more accurately
Figure 11.0, below, further demonstrates the effects on pavement condition that preventative maintenance, rehabilitation, and reconstruction have throughout the life-cycle.
Figure 11.0 – Repair Effects of Pavement Deteriorat ion with Time
SUMMARY AND CONCLUSIONS
SDA performed the field evaluation update of the City of Northville’s approximately 25 Mile long pavement network in February of 2013. Roads consisting of asphalt, concrete, and composite (asphalt over concrete) construction were evaluated and categorized by Pavement Condition, Use, Priority and Classification. The total pavement area within the Northville network was found to be approximately 3,897,756 square feet. This represents a total asset replacement value of approximately $25 million. The overall condition of the pavement network was found to be in fair condition, with a weighted average Overall Condition Index (OCI) rating of 49.74 on the 100 point scale. Individual pavement conditions ranged widely across the rating scale, but numerous concrete and asphalt pavement were found to be in poor condition, and are anticipated to deteriorate into failed condition within the next several years if heavy rehabilitation or reconstruction repairs are not implemented. A combination of isolated preventative maintenance, and extensive rehabilitation and reconstruction repairs is necessary to address the varying pavement conditions found in the network.
City of Northville Municipal Pavement Management System 2013 Update Page 27 of 27
SDA organized the pavement data into the CartéGraph software program to assist in development of three individual ten-year work plans, which are based on three preliminary budget projections provided by the City of Northville. Based upon CartéGraph output, the updated ten-year work plan was developed to start in 2013. The three budget scenarios include: 1) an annual budget of $350,000; 2) an annual budget of $950,000; and 3) a bond issue scenario providing a $2,000,000 budget for the first three years and $500,000 to $600,000 annually for the remainder of the plan. All annual budgets for each scenario include a $25,000 budget to provide preventative maintenance repairs and a $35,000 allowance for isolated sidewalk repairs outside of the recommended annual scopes of work. The remainder is left for the program to choose the most cost-effective rehabilitative or reconstruction repairs. As part of the 2013 program update, the unit costs for each plan activity were updated to include allowances for the necessary sidewalk, ramp, and curb and gutter repairs for each particular segment selected for repair. Based on the comparison of the results of the three Budget-Driven analyses, SDA determined that the existing annual budget of $350, 000 is insufficient to adequately maintain the Northville Pavement Network. Therefore , it is vital that the proposed millage increase be approved in order to increase the netwo rk-level OCI to an acceptable level. If the millage increase is implemented, SDA recommends that Northville implement the $950,000 annual budget scenario in order to steadil y increase the network’s condition over time. Significant investment has been made in the inventory of the pavement and development of this management system. We strongly recommend continued investment into the program by the City of Northville, and to continually refine and update the inventory through future inspections. The maintenance and repair database should be updated annually as work is completed. We also recommend re-assessing the ten-year plan at least every three (3) years to account for any changes that may have occurred. This comprehensive centralized program will provide easy access to pavement information, allow for proper budget allocation to minimize pavement repair costs, and reduce overall pavement maintenance repair spending. This program is an investment that will save Northville money by applying value engineered decisions now, therefore reducing the need for more costly repairs in the long run. Pavement Management Programs are not new to our industry, but how we use the technology that has been developed and proven in the field, and now incorporated into this municipal management system, represents an important step in asset management for the City of Northville. N:\NP\NLD Projects\NP11040.1C City of Northville - Pvmt Mgmt Sys\WP\Reports\Northville MPMS Report - 2013 Update\3 - Northville Report - 2013 Update.doc