municipal energy profile - philaenergy.org · municipal energy profile: the general fund 1 ......
TRANSCRIPT

Municipal Energy Profile: The General Fund 1
MUNICIPAL ENERGY
PROFILEA FIRST LOOK: THE GENERAL FUND

Municipal Energy Profile: The General Fund2
Photo:
City Hall clock tower
prior to LED retrofit
2014 PHILADELPHIA ENERGY COSTS (in millions)
0 10 20 30 40 50 60 70 80
street lighting
*excludes vehicle fuel
GENERAL FUND* WATER AVIATION

Municipal Energy Profile: The General Fund 3
DEAR CITY LEADERS,
We are pleased to publish our first report focused on energy management for the City of Philadelphia. The
Philadelphia Energy Authority (PEA) is an independent authority jointly created by City Council and Mayor Nutter
in 2010 to provide targeted expertise and focus to the City’s efforts to reduce energy consumption and expense.
One of PEA’s charter responsibilities is educating the broader public, our decision-makers and leaders. Our hope is
that this report provides context for future decisions, highlights effective practices, and contributes to a more public
conversation about our city’s energy future by examining its history.
This report is a consolidated record of significant utility management milestones pursued to ensure budget
stability in the ever changing energy market, and contains recommendations for future improvements, additions or
changes. The report is a result of compiling over 200 documents provided by the City, informal interviews, case
study research, and on-going working group sessions. We are grateful for the support and fact-checking of the
Energy Office, Mayor’s Office of Sustainability, and the Mayor’s Office of Transportation & Utilities. Though the
factual content has been reviewed by the current administration, the recommendations herein are made solely by
the PEA. These recommendations are by no means exhaustive, and in many cases, City stakeholders and officials
have already begun to address these issues. We recognize their progress and initiative, and believe there is value in
continuing to drive and support a more public conversation.
Energy is one of Philadelphia’s largest non-labor, non-discretionary expenditures. In 2014, the City of Philadelphia
spent approximately $78,000,000 on energy1 and approximately 53% of that cost was attributable to the General
Fund. For this reason, this report focuses on buildings within the General Fund portfolio (excluding vehicle fuel).
The City of Philadelphia has made great strides in energy management, many occurring in the last 7 years
under Mayor Nutter’s Administration. The PEA is looking forward to continuing to work with this and future
administrations to seize available opportunities to reduce energy consumption, cost, and environmental footprint,
all of which ultimately impact the taxpayers and quality of life in our great City.
Sincerely,
Christopher A. Lewis Jill D. KowalskiChairman Executive Director
THE GENERAL FUND ENERGY EXPENDITURES INCLUDE:
• PoliceDepartment• PhiladelphiaPrisonSystem• FirstJudicialDistrict• FireDepartment• OfficeofFleetManagement• DepartmentofPublicProperty• DepartmentofHumanServices
• DepartmentofPublicHealth• OfficeofSupportiveHousing• FreeLibrarySystem• PhiladelphiaParksandRecreation• PhiladelphiaMuseumofArt• StreetsDepartment• CityCommissioner
TheGeneralFunddoesnotincludetheAviationFund(PhiladelphiaInternationalAirport)ortheWaterFund(PhiladelphiaWaterDepartment).Theseentitieshavetheirownenergyplansandstrategies.ThePhiladelphiaSchoolDistrictoperatesseparately.

Municipal Energy Profile: The General Fund4
INTRODUCTION .....................................................5
Why is Energy Efficiency Important? .........................5
Where Do We Rank? ...............................................6
ENERGY MANAGEMENT THROUGH
THE ADMINISTRATIONS .......................................7
An Energy Management Timeline .............................8
State Legislation Policies ........................................10
CURRENT ENERGY MANAGEMENT ..................12
Current Cost ......................................................... 12
Governance Structure ............................................ 13
Current City Policies & Legislation .......................... 14
Reducing Energy Demand ...................................... 15
• PreventativeMaintenance ................................ 15
• UtilityBilling ................................................... 16
• EnergyManagementDatabase ......................... 16
• PECO’sSmartIdeasRebateProgram ................ 17
• CurrentTechnology- BuildingManagementSystems ......................... 17
• DemandResponsePrograms & PLC Management ......................................... 18
• IncentivizingBehaviorChange .......................... 19
Energy Supply ...................................................... 20
• Electricity ....................................................... 20
• NaturalGas .................................................... 21
• VehicleFuel ..................................................... 21
• Steam ............................................................. 21
• FuelOil ........................................................... 21
• Renewable&AlternativeEnergy .......................22
Projects ................................................................23
• QuadplexGESA ..............................................24
Financing....................................................................26
• InnovationinEnergyEfficiencyFinancing ..........27
• CurrentRebateAccounting ..............................27
LOOKING FORWARD ............................................28
Governance ..........................................................28
Legislation & Policy ...............................................29
• Pennsylvania’sBuildingEnergyCode .................29
Potential Planning Process Policies & Measures ........30
• Holistic&IntegratedDesignApproach ..............30
• ROI ................................................................ 31
• LCA ............................................................... 31
• BuildingOperatorTraining ...............................32
• LeveragingRebatesasaFundingStream ............32
• PECO’sSmartBusinessSolutions Direct Install Program ......................................32
Reducing Demand .................................................33
• DepartmentalEnergyEfficiency Incentive Program ............................................33
• DepartmentalAccountabilityPolicy...................33
Emerging Data Management Technologies ..............33
• SmartMeterTechnology ..................................33
• Submetering....................................................34
• OpenDataStrategy .........................................34
• ElectronicDataInterface .................................34
BarrierstoEnergyEfficiency ..................................35
PEA CALLS TO ACTION .......................................36
REFERENCES ..........................................................38
ACKNOWLEGEMENTS .........................................43
COMMON ACRONYMS
AEPS ................................Alternative Energy Portfolio StandardBAS ...............................................BuildingAutomationSystemCSP .............................................. Curtailment Service ProviderDOE ....................................................... Department of EnergyDPP ............................................Department of Public PropertyESCO ................................................. Energy Service CompanyGESA ....................................... Guaranteed Energy Savings ActIgCC .............................. International Green Construction CodeLCC ................................................................Lifecycle CostingLCCA .................................................... Lifecycle Cost AnalysisLEED ................. Leadership in Energy and Environmental DesignLSE ............................................................. Load Serving Entity
LSP .................................................... Licensed Service ProviderMEO ....................................................Municipal Energy OfficeMOS ...........................................Mayor’s Office of SutainabilityMOTU .....................Mayor’s Office of Transportation & UtilitiesPEA .............................................Philadelphia Energy AuthorityPPA ................................................Power-Purchase AgreementPLC ...................................................... Peak Load ContributionPUC...................................................Public Utility CommissionPWD ..........................................Philadelphia Water DepartmentQECB ...............................QualifiedEnergyConservationBondsRO .............................................................. Remote OperationsSREC ......................................... Solar Renewable Energy Credit
TABLE OF CONTENTS

Municipal Energy Profile: The General Fund 5
80%
67%75%
NATIONAL ENERGY
CONSUMPTION5
GLOBAL ENERGY
CONSUMPTION4
GLOBAL GREENHOUSE GAS
EMMISSIONS6
There is an urgent need
for energy efficiency in
urban areas due to their
significant role in energy
consumption and green
house gas emissions.
why is energy efficiency important? Energy efficiency is the cheapest, most abundant,
and most underutilized resource for local, economic
and community development.2 In every major
American city, buildings account for the majority of
energy use and carbon pollution — even more than
the transportation or industrial sectors.
If cities want to be more competitive and more
resilient against energy-related crises, they must
boost the energy efficiency of their building stock.3
Energy management must evolve from an optional exercise to a core function of City operations.
Philadelphia has not been able to consistently manage energy costs due to a decentralized approach of
energy management, and fragmented energy office functions with limited resources and authority. In
addition, the current centralized utility payment policy disconnects users from their consumption, and
the project budgeting process discourages energy efficiency.
Progress has been made, but governance and leadership focused on a single, comprehensive energy
management plan for the City is needed.
INTRODUCTION
Municipal Energy Profile: The General Fund 5
Municipal Energy Profile: The General Fund6
STATE ENERGY EFFICIENCY RATINGS
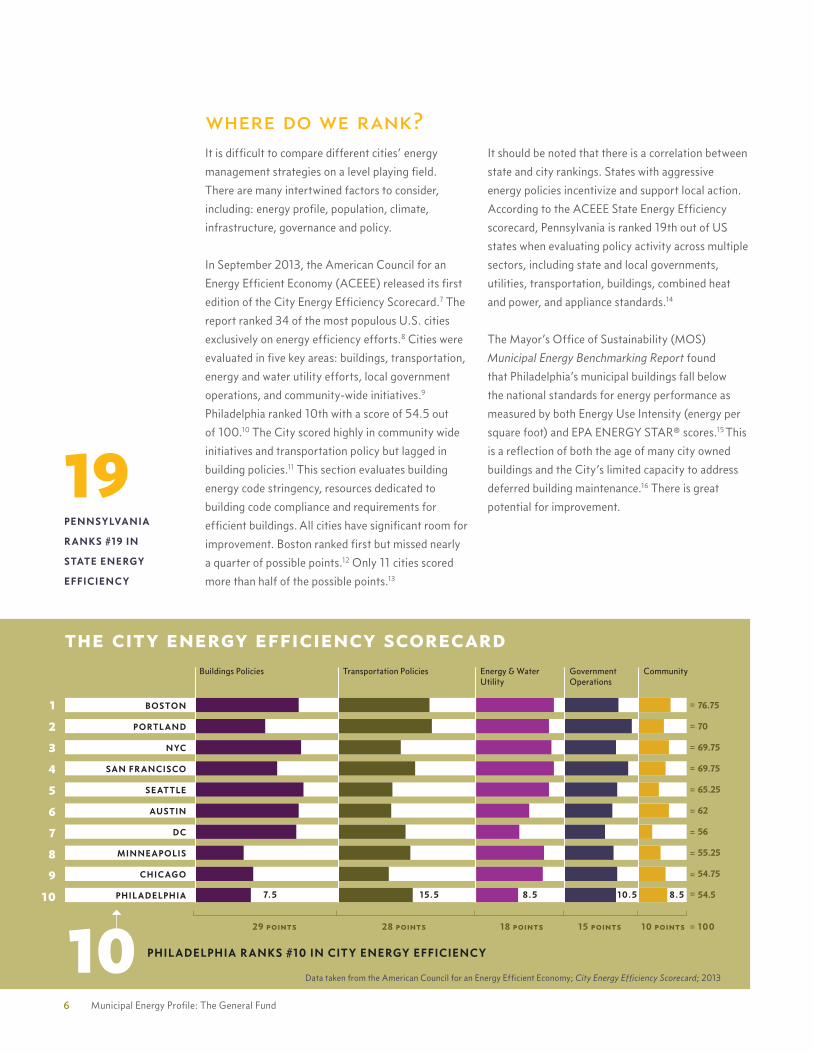
where do we rank? It is difficult to compare different cities’ energy
management strategies on a level playing field.
There are many intertwined factors to consider,
including: energy profile, population, climate,
infrastructure, governance and policy.
In September 2013, the American Council for an
Energy Efficient Economy (ACEEE) released its first
edition of the City Energy Efficiency Scorecard.7 The
report ranked 34 of the most populous U.S. cities
exclusively on energy efficiency efforts.8 Cities were
evaluated in five key areas: buildings, transportation,
energy and water utility efforts, local government
operations, and community-wide initiatives.9
Philadelphia ranked 10th with a score of 54.5 out
of 100.10 The City scored highly in community wide
initiatives and transportation policy but lagged in
building policies.11 This section evaluates building
energy code stringency, resources dedicated to
building code compliance and requirements for
efficient buildings. All cities have significant room for
improvement.Bostonrankedfirstbutmissednearly
a quarter of possible points.12 Only 11 cities scored
more than half of the possible points.13
It should be noted that there is a correlation between
state and city rankings. States with aggressive
energy policies incentivize and support local action.
According to the ACEEE State Energy Efficiency
scorecard, Pennsylvania is ranked 19th out of US
states when evaluating policy activity across multiple
sectors, including state and local governments,
utilities, transportation, buildings, combined heat
and power, and appliance standards.14
The Mayor’s Office of Sustainability (MOS)
MunicipalEnergyBenchmarkingReport found
that Philadelphia’s municipal buildings fall below
the national standards for energy performance as
measured by both Energy Use Intensity (energy per
square foot) and EPA ENERGY STAR® scores.15 This
is a reflection of both the age of many city owned
buildings and the City’s limited capacity to address
deferred building maintenance.16 There is great
potential for improvement.
Philadelphia
New York
Seattle
Chicago
Denver
Boston
Columbus
Phoenix
San Francisco
Portland 13.75
13
12.25
11.25
11
11
10.75
10.75
10.5
10.5
OIL
STEAM
NATURAL GAS ELECTRICITY
76.75
70
69.75
69.75
65.25
62
56
55.25
54.75
54.5
the city energy efficiency scorecard
10 PHILADELPHIA RANKS #10 IN CITY ENERGY EFFICIENCY
Data taken from the American Council for an Energy Efficient Economy; CityEnergyEfficiencyScorecard; 2013
1
2
3
4
5
6
7
8
9
10
19PENNSYLVANIA
RANKS #19 IN
STATE ENERGY
EFFICIENCY
Municipal Energy Profile: The General Fund 7
STATE ENERGY EFFICIENCY RATINGS
MAYOR WILLIAM GREEN (1980-1984)
The City of Philadelphia began its foray into energy
management in 1981 when Mayor William Green III
took office amidst relatively high energy prices.17
HecreatedaMunicipalEnergyOffice(MEO)
with the responsibility of paying the City’s utility
bills and tracking, managing and reducing energy
consumption.18 This was the first time energy was
made a priority by the City, but the impact of the
MEO was limited. One full-time director was in
charge of managing the municipal energy use and
paying utility bills.19
MAYOR WILSON GOODE (1984-1992)
Difficult financial times for the City continued into
Mayor Goode’s administration and specific funding
forenergymanagementwaslimited.However,
important dialogue addressing where responsibility
for energy costs ultimately fell set the stage for
future progress. Energy related efforts during this
administration included: improved management
of municipal waste management, ensuring energy
efficiency solutions in Section 8 housing to protect
PhiladelphiaHousingAuthority(PHA)housing
residents from inheriting high utility bills, lighting
retrofitsforstreetlightingandCityHall,andfocused
attention of the Gas Commission to make PGW
more efficient. 20
MAYOR ED RENDELL (1992-2000)
By1993,theenergymarkethadbecomevery
volatile.21 Newly inaugurated Mayor Rendell was
environmentally minded and requested that a Special
Committee on Energy Management Issues release a
report detailing Philadelphia’s energy management
options.22 In response to the report, Mayor Rendell
expanded the MEO to about five staff members
and placed the MEO under the Mayor’s Office.23
This restructured MEO was put in charge of
auditing and managing the utility accounts utilizing
an energy management database, and reducing
City energy consumption by 5-10%.24 The MEO
prioritized timely utility bill payments, improved
energy management strategies, implemented
energy efficient technologies, and reduced the cost
of energy for the City through procurement and
negotiations with utility companies.25
The Electricity Generation Customer Choice and
Competition Act was passed by Pennsylvania
legislature in 1996.26 The Act aimed to break apart
the state’s public utility monopolies and allow
consumers to choose their electricity generation
providers. Rate caps set electricity prices at
artificially low rates in Philadelphia to prevent
severe market fluctuations and discouraged market
competition in PECO’s service territory for over
a decade. This left little incentive for the City to
reduce energy consumption or implement energy
conservation measures.
ENERGY MANAGEMENT THROUGH THE ADMINISTRATIONS
Energy management priorities have been largely directed by the leadership of mayors, with
significant variation over time. There has never been an energy master plan that transcended
administrations, resulting in energy management policies that have been largely reactive and
focused on the short term.

Municipal Energy Profile: The General Fund8
MAYOR JOHN STREET (2000-2008)
During his time in office, Mayor John Street saw
energy prices rising dramatically across the country,
but Philadelphia’s electricity prices remained stable
because of rate caps set by the Pennsylvania Public
Utility Commission (PUC). In 2004, the Street
administration released the “PhiladelphiaHigh
PerformanceBuildingRenovationGuide” outlining
integrated whole building approaches for renovation
and maintenance projects that included roof,
window,lighting,automation,HVACandelectrical
systems upgrades.27
In addition, Mayor Street signed the U.S. Mayors’
Climate Protection Agreement in 2005 and issued
Executive Order 1-07. This action set the stage for
the City to adopt a Local Climate Change Action
Plan, released in 2007.
MAYOR MICHAEL NUTTER (2008-PRESENT)
In 2008, Mayor Nutter was elected and prioritized
sustainability. Rising energy prices and expiring
rate caps incentivized energy management reform
inPhiladelphia.Budgetcertaintywasapriority.He
established the Mayor’s Office of Transportation
and Utilities (MOTU) and the Mayor’s Office of
Sustainability (MOS). The MEO energy functions
were absorbed and responsibilities were split.
MOTU was responsible for energy supply and MOS
was charged with managing energy demand.
199819971996199519941993199219911990198919881987198619851984198319821981 201620152014201320122011201020092008200720062005200420032002200120001999
GREENE GOODE RENDELL STREET NUTTER
2.5
5.0
7.5
10.0
Municipal Energy Office established under Dept. of Public Property
Municipal Energy Office expanded and restructured
Congress passes EPACT (Energy Policy Act) requiring states to establish building energy codes and to deregulate the electric power market, among other energy efficiency provisions
Electricity Generation Customer Choice and Competition Act
passed by the Pennsylvania General Assembly requiring
electricity deregulation to be implemented
Guaranteed Energy Savings Act (GESA)
FED
ER
AL/
STA
TE
PH
ILA
DE
LPH
IA
AVERAGE U.S.ENERGY PRICES(CENTS PER KWHOUR)
an energy management timeline

Municipal Energy Profile: The General Fund 9
In 2009 he launched GreenworksPhiladelphia,
announcing his goal to make Philadelphia the
‘Greenest City in America.’ The plan’s goals
extend until 2015 and Greenworks reports
have been released annually detailing progress
to date.
Mayor Nutter passed Executive Order 6-10,
in 2010, to establish an Electricity Supply
Advisory Committee to evaluate and determine
the best procurement strategy for the City to
assure budget certainty.28 This order specifies
the procedure for electricity procurement and
established the reporting requirements necessary
to keep the Mayor and City Council updated on
the status of electricity purchases.29
In November 2013, the Mayor’s Task Force on
City-Owned Facilities released its Final Report
& Recommendations after evaluating four major
areas of City facility management: space allocation,
leasing, maintenance and facility management, and
utility payments/energy efficiencies. Of the nineteen
recommendations, ten were directly related to
energy efficiency.
In keeping with his priorities, on Earth Day 2014
Mayor Nutter announced that Philadelphia was
selected to join the City Energy Project with nine
other United States cities to improve the energy
efficiency of buildings.30
199819971996199519941993199219911990198919881987198619851984198319821981 201620152014201320122011201020092008200720062005200420032002200120001999
GREENE GOODE RENDELL STREET NUTTER
2.5
5.0
7.5
10.0
Mayor’s Office of Sustainability and Mayor’s
Office of Transportation and Utility created
Creation of Philadelphia Energy Authority
Philadelphia begins participating in PJM’s Demand Response Programs
Legislation mandates new construction meet ENERGY STAR® cool roof standards
Purchase Obligation Bill allows City to procure electricity strategically
Bill No. 080025 mandates large City-owned buildings must be
certified LEED Silver
End of Electricity Rate-Caps (Dec. 31, 2010)
Departmental Energy Efficiency Incentive Pilot Program launched to target the role of tenant and employee engagement in reducing energy consumption
Nutter announces Philadelphia will join the “City Energy Project”
Creation of Energy Office
Mayor’s Task Force on City-Owned Facilities releases its final report
City Council passes Bill No. 120428-A, requiring energy benchmarking and disclosure for all commercial buildings 50,000 sq. ft. or larger to report annual energy and water usage
Philadelphia begins participating in a Peak Load Contribution (PLC) Predictor Program to reduce electricity costs
Local Action Plan for Climate Change
released by Sustainability Working Group
Philadelphia High Performance Building
Renovation Guide released
Electricity retail choice was implemented for all Pennsylvania residents
Assembly passes Act 129, expanding the PUC’s
oversight responsibilities and imposing new efficiency
requirements on electric distribution companies
Pennsylvania mandates an Alternative Energy
Portfolio Standard
Pennsylvania PUC implements measures to remove final barriers to a complete competitive electricity market
First Greenworks Philadelphia Report

Municipal Energy Profile: The General Fund10
state legislation policiesState legislation and politics greatly impact Philadelphia’s energy landscape.
Guaranteed Energy Savings Act
In 1996, the Pennsylvania general assembly passed
Act 29, the Guaranteed Energy Savings Act to
enable public entities to enter into guaranteed
energy savings agreements (GESA) contracts
with qualified providers, such as energy service
companies (ESCOs), for up to ten year terms.31
GESA projects identify issues and limitations in a
facility, implement energy conservation measures
and preventative maintenance strategies, and
analyze energy reductions and savings during a
measurement and verification phase to guarantee
projected energy savings. Amendments to this
Act, including Act 57 of 1998, which extended
GESA contracts to 20 year terms,32 and Act
77 of 2010, which updated definitions and
contracting procedures to clarify and make GESAs
more efficient and productive,33 have worked to
incentivize GESA projects. Act 39 of 2010 allowed
public housing authorities, municipalities, school
districts and state agencies to contract ESCOs
without using up-front capital.34
Alternative Energy Portfolio Standard
In November 2004, Pennsylvania enacted
legislation that mandated an Alternative Energy
Portfolio Standard (AEPS).35 This legislation
required that 18% of the electricity sold by
compliance year 2020-2021 come from approved
renewable or alternative sources with at least
0.5% from photovoltaic power.36 By2013,
renewable energy accounted for almost 4% of
Pennsylvania’s net electricity generation.37
Act 129
PennsylvaniaHouseBill2200,orAct129of2008,
was passed by Pennsylvania legislature in October,
2009.38 Act 129 “requires that Pennsylvania utilities
deliver energy efficiency programs that reduce their
electric load by 1% by May 31, 2011 and by 3% by
May 31, 2013” and “to reduce peak demand by
4.5% by May 31, 2013.”39 This act also gave the
Pennsylvania Public Utility Commission (PUC) the
authority to extend the program if it was determined
to be cost effective.40 Act 129 was a major piece
of energy legislation. It amended the Public Utility
Code and obligated the PUC to implement energy
efficiency and conservation programs such as
alternative energy, smart meter technology, and
time-of-use rates and real-time pricing plans.41
PECO’s Act 129 program, Smart Ideas, offers
rebates and incentives for energy efficiency
projects. The PUC evaluated the progress and cost
effectiveness of Act 129 programs and voted in
August 2012 to continue Act 129 programs for a
second phase through May 31, 2016.42 Phase three
planning is in process.
Municipal Energy Profile: The General Fund 11
Building Code Updates
Before2011,Pennsylvania’sbuildingcodewas
updated every three years based on model codes
recommended by the International Codes Council
(ICC). The ICC is a non-profit organization that
facilitates consensus among national stakeholders
regarding building code updates.43 Pennsylvania
Act 1 of 2011 made significant changes to the
Pennsylvania’s code adoption process, and code
updates have been stagnant since.
Act 1 gave the Department of Labor and Industry‘s
(L&I) Review and Advisory Committee (RAC)
broad authority over how Pennsylvania updates
their building code. It requires RAC to individually
examine the health, safety, welfare, economic,
financial impacts and technical feasibility of
thousands of proposed code changes on a triennial
basis, and approve each by a two-thirds vote.
In 2012 the RAC did not perform the required
analysis, and voted to reject the adoption of all 2012
building codes. As a result, Pennsylvania is operating
under the 2009 International Energy Conservation
Code (IECC).44 The rejected 2012 building energy
code would have increased energy performance
by 15 percent.45Bynotadoptingthemostcurrent
building code, Pennsylvania is erecting new buildings
to a lower energy efficiency standard than the
industry is capable of delivering.
Philadelphia is required to follow the state’s building
code. Municipalities cannot require local building
codes to be more stringent than the state’s code.
This may reduce Philadelphia’s flexibility to meet
local energy goals and is a disincentive to high
performanceconstruction.However,Philadelphia
can petition the state for its own code, incentivize
building better than code, or adopt voluntary codes
such as IgCC.
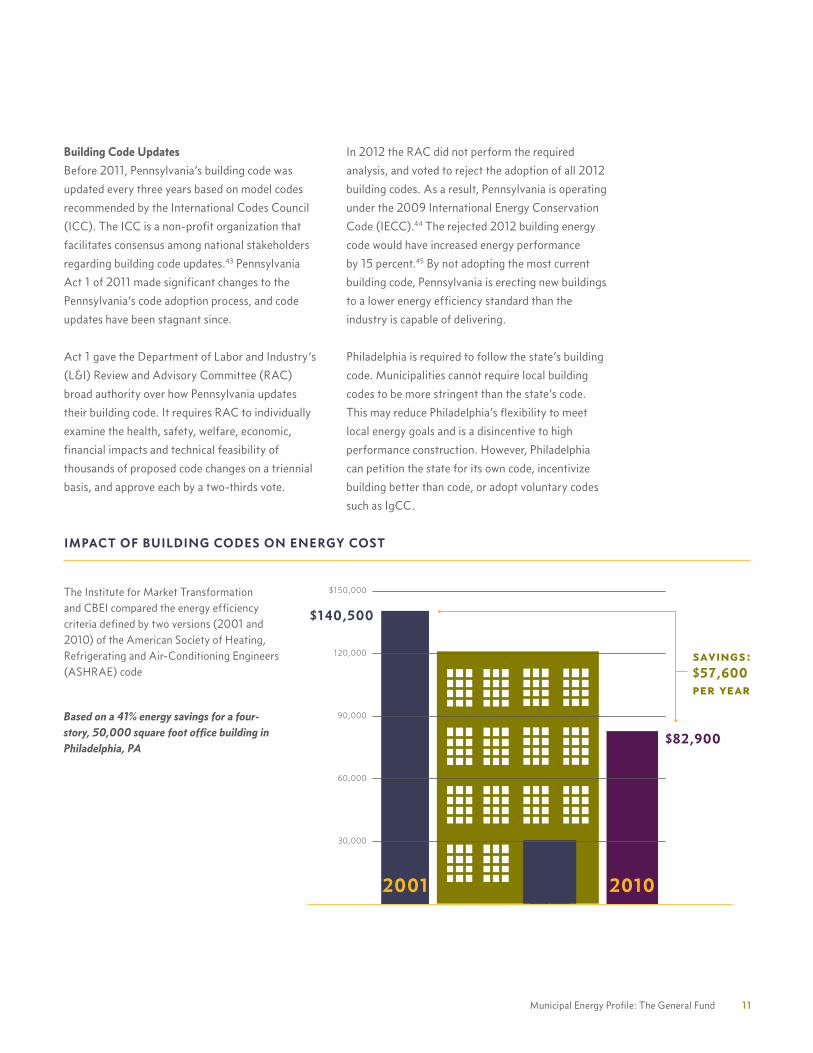
IMPACT OF BUILDING CODES ON ENERGY COST
The Institute for Market Transformation andCBEIcomparedtheenergyefficiencycriteria defined by two versions (2001 and 2010)oftheAmericanSocietyofHeating,Refrigerating and Air-Conditioning Engineers (ASHRAE)code
Based on a 41% energy savings for a four-story, 50,000 square foot office building in Philadelphia, PA
2001
$140,500
$82,900
savings:$57,600 per year
2010
30,000
60,000
90,000
120,000
$150,000

Municipal Energy Profile: The General Fund12
The City of Philadelphia manages more than 700 facilities ranging in size and function. They include
public safety buildings, libraries, parks and recreation and administrative offices. They range in size
from small neighborhood recreation centers to City Hall and the Philadelphia Museum of Art.46 These
buildings represent enormous opportunities to save both energy and money.47
CURRENT ENERGY MANAGEMENT
0 10 20 30 40 50 60 70 80
MAINTENANCE & OPERATIONS
PROJECTS
< 10,000 SQ. FT. > 10,000 SQ. FT.i.e., equipment or roof replacement
No energy efficiency requirementNo energy efficiency
measure or policy in place
LEED Silver Certification required
Cool Roof Standard
Energy Conservation Certificate of Design for Commercial Construction
ROI Analysis
Required as of FY16: Not retroactive; can only be enforcedon new projects or budget items
street lighting
CITY ENERGY COST BY FUND (in millions)
GENERAL FUND ENERGY COST BY DEPARTMENT (percent)
62.7% of the General Fund’s energy
usage is from electricity.
By department, the top energy
users are Public Property, Parks and
Recreation, Prisons, and the Art
Museum—totaling 64.8% of
General Fund energy use.
While the largest single user of
energy is the Art Museum, four of
the top ten users are prisons.
1 2 3 4 5 6 7 8 9 10Art Museum Curram
Fromhold Correctional
House of Corrections
Criminal Justice Center
One ParkwayBuilding
City Hall Municipal Services Building
PhiladelphiaNursingHome
PhiladelphiaJuvenile
Justice Center
RiversideCorrectional
LARGEST GENERAL FUND ENERGY USERS FY14
current cost48

Municipal Energy Profile: The General Fund 13
CURRENT ENERGY MANAGEMENT
governance structureCurrently, utilities are managed by MOS, MOTU,
and the Energy Office. MOS promotes city-wide
energy policy, energy efficiency projects, and
community engagement related to Greenworks
Philadelphia.49 MOTU has worked to enhance
the entire city’s energy, utility and mobility
infrastructure in keeping with sustainability
principles.50 In July 2014, the City’s energy
management functions were merged under a
new Energy Office jointly reporting to MOS and
MOTU.51 The goal of creating the Energy Office
was to position utility management as a separate
core function of City operations and provide a single
contact for energy related operations.52
PEA is an independent municipal authority that was
jointly created by City Council and Mayor Nutter
in July 2010 to bring additional expertise and focus
to the City’s efforts to reduce energy consumption
and expense.53 The PEA continues to evolve, but
is envisioned to serve as an energy think tank and
convener.54 As a municipal authority, the PEA is
positioned to provide long-term energy strategies,
hold long-term energy contracts, act as a public-
private liaison to leverage resources and aggregate
projects for efficiency, and initiate high level
coordination for future energy management and
efficiency projects.55
Municipal Energy Profile: The General Fund 13
PHILADELPHIA ENERGY MANAGEMENT
CIT
Y G
OV
ER
NM
ENT
MOTU
MOS
THE ENERGYOFFICE
PHILADELPHIA ENERGY
AUTHORITY
IND
EPEN
DEN
T A
UT
HO
RIT
Y
• Long term contracts• Steward of long term planning and vision • Drive regional, local and cross-sector collaboration
• Public education and engagement• Policy and technical advocacy• Public/private liason• Facilitator/convener• Clearinghouse of energy resources
PEA: ENERGY THINK TANK
• External city-wide policy• Sustainability program development and management• Benchmarking
• Public-private partnership• Tracking and reporting• Municipal project aggregation
• Energy procurement • Energy analysis• Technical assistance• Project development and management• Energy conservation management
• Act 129 Rebate Management• Administration of the Energy Efficiency Fund• Departmental engagement• Departmental education and training
THE ENERGY OFFICE:INTERNAL MUNICIPAL ENERGY OPERATIONS
• Utility management oversight• Utility relations
MOTU: INTERNAL ENERGY OVERSIGHT
MOS: EXTERNAL ENERGY POLICY & PROGRAMS

Municipal Energy Profile: The General Fund14
0 10 20 30 40 50 60 70 80
< 10,000 SQ. FT. > 10,000 SQ. FT.
No energy efficiency requirement
No energy efficiency standards or policy in place
LEED Silver Certification required
street lighting MUNICIPAL BUILDING PROJECTSOPERATIONS & MAINTENANCE i.e., equipment or roof replacement
Code Compliant Cool Roof Standard ROI Analysis
Required as of FY16: Not retroactive; can
only be enforced on new projects or
budget items
There are no enforceable energy
efficiency policies or procedures for the
majority of facility-related work.
Rebate funding is NOT credited back to the project or operations
cost, creating a disincentive to fund
energy efficiency through rebates.
current city policies and legislation
To encourage energy consumption reductions,
theCityofPhiladelphiaenactedBillNo.080025
in December 2009 (effective January 2010)
amending Philadelphia code relating to procurement
contracts.56 The bill required new construction
and any major renovations57 of large City-owned
buildings to be designed, constructed, and certified
at the silver level of the Leadership in Energy and
Environmental Design (LEED) rating system of
theU.S.GreenBuildingCouncil.58 Enacting LEED
legislation guarantees that projects 10,000 Square
Feet (SF) or greater will:
• Useatleast20%lessenergythanbasic,
code-compliant structures resulting in reduced
operating costs for the life of the building
• Operateasthedesignintendedthrougha
mandatory commissioning process, resulting in
reduced operating and maintenance costs and
maximum occupant comfort
The LEED requirement is intended to be an
effective tool for fostering integrated design and
high-performance construction in major City
buildingprojects.TheBillclarifiedaprevious
commitment contained in Mayor Street’s Executive
Order 1-07 regarding climate change and
environmental stewardship.59 The ordinance applies
to capital projects undertaken by all departments
and agencies across the City, including the Airport,
Water Department, and the Department of Public
Property (DPP). There are currently no energy
efficiency requirements for capital projects less
than 10,000 SF, but all construction projects are
encouraged to consider energy efficiency during
design initiation.
In May 2010, Mayor Nutter signed legislation,
introduced by Councilman James Kenney, requiring
all new construction in Philadelphia to use highly
reflective roofing materials that meet or exceed
ENERGY STAR® cool roof standards. The cool roof
law was an early step toward the City’s anticipated
adoption of green building standards.60
DECEMBER 2009
LEED Requirement Large, City-owned buildings must be LEED Silver
MAY 2010
Cool Roof Law All new construction meets ENERGY STAR® cool roof standards
DECEMBER 2010
Purchase Obligation Bill Allows City to procure electricity strategically
JUNE 2012
Commercial Benchmarking Requirement Requires annual energy and water benchmarking for large buildings
CURRENT ENERGY EFFICIENCY POLICY OVERVIEW

Municipal Energy Profile: The General Fund 15
reducing energy demand
PREVENTATIVE MAINTENANCE
Economic hardships and constrained budgets have
resulted in the deferred maintenance of many
City-owned buildings, leaving the City with the
burden of reviving those that have fallen into
disrepair. This deferred maintenance has resulted
in a significantly higher cost for the City today than
preventative maintenance would have incurred
over the years. The City does not have a consistent
preventative maintenance plan for City buildings,
and preventative maintenance actions have been
sporadic and limited when funding is available.
In 2012 the Facilities Management Division of
the Department of Public Property explored a
preventative maintenance strategy on 121 City
facilities. It concluded that preventative and
predictive maintenance could reduce the City’s
energy consumption by 5% to 20% annually, while
also providing other benefits. Public Property
received approval to hire 16 employees to begin
a preventative maintenance program to complete
scheduled projects and move to a more proactive
maintenance approach.
Organizations that have implemented comprehen-
sive preventative maintenance programs have
shown dramatic decreases in operation and
maintenance costs.65 When factors such as
extended equipment life, reduced energy use,
less frequent system downtime, and decreased
interruptions to building operations are included,
total costs can decrease by as much as 50%.66
Implementing a proactive maintenance plan can
help eliminate waste, reduce risk, improve customer
service and avoid loss of business continuity due to
unforeseen building emergencies.67
In order to prepare for the expiration of rate caps
at the end of December 2010, City Council passed
thePurchaseObligationBill61 to allow the City to
contract a licensed service provider (LSP) through a
competitive bidding process to act as the City’s load
serving entity (LSE) to make fixed rate wholesale
electricity purchases for the City. The Purchase
ObligationBillrequiredthattheLSPshopforblocks
of electricity and “make purchases only after first
securing responsive and competitive bids from
qualified electric power providers, and only from the
lowest bidder”62 to ensure low costs, price certainty
and energy security. This was a major step to begin
planning for the City’s energy future.
Philadelphia City Council took steps in June 2012
to reduce building energy consumption by amending
Chapter 9-3400 of the Philadelphia Code. This
amendment required annual energy benchmarking
for all commercial buildings in Philadelphia,
50,000 SF or larger, to disclose energy and water
consumption data.63 The City had already begun
to measure and compare performance metrics of
municipal buildings. A baseline was established
using data from 2011 onwards to set energy
efficiency standards for City buildings. The MOS
has benchmarked energy usage for all City-owned
facilities 10,000 SF and larger, as well as dozens of
smaller facilities.64

Municipal Energy Profile: The General Fund16
UTILITY BILLING
The City currently pays its utility bills manually.
For most utilities the information is received by the
Energy Office as an electronic flat file ready for
direct import into the energy management database.
The bill is resolved, audited, recorded in a monthly
report and forwarded for payment.
The City has been working closely with utility
companies to simplify and streamline their billing
and payment process to reduce the time it takes to
pay utility bills and improve working relationships.
The City has been able to reduce the bill payment
turnaround from 90 days to 30-45 days after
receiving its electricity bills, but there is still room for
improvement.68
As of July 2014, there General Fund has 1,400
electricity accounts, with two bills for each: one
for PECO’s distribution charges and one for
generation and transmission charges through an
energy supplier.69 The City receives a hard-copy
of the electricity invoice six weeks after the billing
cycle ends and an electronic copy about two weeks
later.70 The hard copy invoice is used to pay the bill
and the electronic invoice is hand-checked for billing
errors and discrepancies.71 Although the bills cover
the same time period, the information is presented
differently in each format and neither provide a
granular breakdown of charges.
The Mayor’s Task Force on City-Owned Facilities
Report recommended establishing a Utility Payment
AdvisoryBoardtoaudittheCity’sutilityaccounts.72
According to the Mayor’s Task Force on City-Owned
Facilities, the City has approximately $590,000
allocated to utility payments for non-City tenants
of City facilities.73 Many of these accounts are
for buildings that once housed City operations or
were previously in use by the City, but their leases
were arranged through “formal and semi-formal
agreements with inconsistent lease terms regarding
utilities”74 and are therefore, still billed to the City.
TodatetheUtilityPaymentAdvisoryBoardhasnot
convened; however, MOS has been able to begin
this process, already removing several unnecessary
accounts from the City’s payroll.
ENERGY MANAGEMENT DATABASE
The City selected a new energy management
database in 2014, replacing the previous software
solution used between 2010-2014.
The EnergyCAP database is the City’s primary tool
to monitor energy and water consumption and can
perform the following:
• Store information for all City utility accounts75
• Enable audits of utility accounts for
billing errors76
• Store information such as a building’s asset type,
square footage, age, systems, occupancy, and
hours of operation77
• Assist in tracking energy efficiency projects
that have completed construction
• Enable normalization of utility data to
provide valuable year-to-year, weather
adjusted comparisons78
• Allow users to group data by utility or by building
to organize bills for auditing and to better
understand energy consumption79
• Import utility bills automatically without manual
data entry80
• Transfer electronic bill data directly into
ENERGY STAR® Portfolio Manager for energy
benchmarking.81
• Greenhousegastracking
Through EnergyCap, the City will continue to
benchmark its facilities with ENERGY STAR®
Portfolio Manager both for compliance with the
City’s law and for the prioritization of investments.

Municipal Energy Profile: The General Fund 17
PECO’S SMART IDEAS REBATE PROGRAM
In compliance with Act 129, PECO offers a series
of incentives under its Smart Ideas program. All
PECO customers, including the City, pay an energy
efficiency charge to cover the administration of the
Smart Ideas rebate program.82 Rebates are awarded
for approved and completed energy efficiency
upgrades. This program allows PECO to incentivize
energy efficiency projects that lower demand, while
also encouraging energy efficiency and helping
customers save money.83 Phase 2 is currently
underway and will end May 31, 2016, with Phase 3
planning in progress.
To date the City has received more in rebates
than it has paid in program fees. Since the
implementation of Phase 1 in 2010, the City has
paid approximately $3.5 million in program fees and
received approximately $6.8 million in rebates. This
is almost exclusively due to larger energy projects.84
In order to maintain this balance the City will need to
execute large projects or proactively evaluate smaller
projects for rebate eligibility.
CURRENT TECHNOLOGY - BUILDING MANAGEMENT SYSTEMS
Buildingautomationsystems(BAS)arecontrol
systems that electronically monitor multiple building
systems.85UsingBAS,mechanicaloperations
forlighting,security,andHVACequipmentcan
be automated to maximize energy efficiency and
performance.86BASalsoallowforremoteoperations
(RO) so that system checks can be done by multiple
users working at offsite locations at any time of the
day.87 This can improve energy management because
it provides quick and easy access to information on
building operations.
Todate,BASandROimplementedatCityHall,
OneParkwayBuilding,CriminalJusticeCenter,
andtheMunicipalServicesBuildinghaveresulted
in a greater ability to troubleshoot operations, a
greater sense of energy awareness, and the ability to
increase accountability within operations.88
The City continues to retrofit many of its facilities
withremotelyaccessibleBAS.In2013,theDPP
installed a RO system in the 1st Police District
Buildingtofurtherenhancethebuilding’s
performance.89 The recently completed renovation
has delivered immediate benefits that will be
reflected in future municipal reporting.

Municipal Energy Profile: The General Fund18
DEMAND RESPONSE PROGRAMS AND PLC MANAGEMENT
As part of the City’s strategy for energy and
cost reduction, the Energy Office works with a
Curtailment Service Provider (CSP) to monetize a
building’s ability to reduce its energy consumption.90
Byquicklyrespondingtochangingenergydemands
and reducing peak loads the City is saving money,
reducing its carbon footprint, and helping to prevent
power outages from disrupting City operations.91
There are three programs the City participates in
to deal with extreme weather events, curtail non-
essential energy use during high demand periods,
improve the region’s power grid for enhanced
reliability, and reduce the City’s reliance on less
efficient energy generation resources:
• Peak Load Contribution (PLC) Predictor Program
• PJM’s Emergency Demand Response Program
• PJM’s Economic Demand Response Program
For Peak Load Contribution (PLC) Management, the
CSP or Energy Office informs participating facilities
to conserve energy on the highest energy use days of
the year.92 This is done through temperature setting
adjustmentstoHVACsystemsandthereduceduse
of non-essential building and office equipment.93
The City’s efforts result in lowered Capacity and
Demand Charges on its electricity bill, which can
yield significant savings.
The Emergency and Economic Demand Response
Programs work the same way, but were put in
place by PJM, the regional grid operator, to avoid
blackouts, brownouts and transmission interruptions
during peak times of energy use.94 PJM incentivizes
these programs by offering significant savings
when the City is able to reduce a facility’s energy
consumption when called upon.95 Currently, the
City’s 20 largest energy consumers participate in
PJM’s Demand Response Programs because it is
cost effective to enroll in the program.96 Since 2010,
the City’s general fund participation has resulted in
nearly $1.8 million dollars.97
The PLC Predictor Program and the Emergency
Demand Response program will see diminishing
returns over time.98 The financial incentives for
the Emergency Demand Response and the PLC
Predictor programs work against one another.99 As
a facility lowers its demand charge year after year, it
becomes increasingly more difficult for that facility
to achieve the reduction required for it to continue
its participation in the Emergency Demand Response
Program.100 In a few years, the City will not be
able to take advantage of the Emergency Demand
Response program in its current form since it will
have brought its facilities’ PLC demand charges
down below the threshold.101
DEMAND
RESPONSE
VS. PEAK LOAD
CONTRIBUTION
COMPARISON102
Number of Participating Facilities
20 Any facility can participateDemand Response buildings are encouraged to participate because their consumption can be metered. As the largest consumers, cost avoidance ia also much greater with their participation.
Varies with summer temperaturesSummer 2014: 1 eventSummer 2013: 4 events
Varies: dependent on number of events and dollars/MW based on the capacity
Reduction in Demand Charge year after year + Capacity
5 PLC Predictor Days(determined by PJM based on PECO data)
Number of Events
Range of Revenue/ Cost Avoidance
REVENUE:
Demand ResponseSAVINGS:
Peak Load Contribution
“ By quickly
responding to
changing energy
demands, the City
can save money,
help reduce its
carbon footprint,
and help prevent
power outage from
disrupting City
operations.”

Municipal Energy Profile: The General Fund 19
INCENTIVIZING BEHAVIOR CHANGE: THE DEPARTMENTAL ENERGY
EFFICIENCY INCENTIVE PILOT PROGRAM
Behaviorchangeisafundamentalcomponentin
managing energy consumption. One of the ways the
current administration is seeking behavior change
is through the Departmental Energy Efficiency
Incentive Pilot Program (DEEIP). On July 1, 2013
DEEIP was launched to increase tenant and employee
engagement in reducing energy consumption. It
was the first time the City financially incentivized
departmental behavior change, and explored the
feasibility of overcoming budget process disconnect.
The pilot aims to connect departments to their
energy use and cost.103 Data from the pilot is still
being analyzed.
The pilot program’s goals were to:104
• Contribute to Greenworks goal of lowering
City government energy consumption by
30% by 2015
• Reduce wasteful energy use
• Raise awareness about behaviors to help reduce
waste
• Recognize effective behaviors and measures
• Financially reward departments for valuing
energy conservation
• Create a culture of prioritized energy
conservation in City departments
The Department of Public Property, Parks and
Recreation, the Fire Department, the Police
DepartmentandtheHealthDepartmentall
voluntarily participated in the first year of the
pilot program.105 A total of 618 City buildings
were included in the pilot, with over half of the
buildings residing in Parks and Recreation.106
There was a significant education component in the
deployment of the pilot, including over forty on-site
educational workshops and some facility energy
audits.107 The workshops educated employees on
their individual department’s energy use compared
that of to other departments and outlined energy
saving strategies specific to their facility and type of
work. Departmental energy savings are calculated
at six-month intervals (July-December and January-
June) and “rebates” are distributed after the end of
each fiscal year (July-June).108
Given a 5%+ reduction in consumption, tied to a
baseline, the savings are distributed as follows:109
• 50% to the General Fund
• 25% to the Department (for immediate use)
• 25%totheDepartment’sEnergyBank110
Given an increase in consumption:
• 50% will be absorbed by the General Fund
• 50%bytheDepartment’sEnergyBank
The departments are encouraged to reinvest their
savings into energy efficiency upgrades to further
theCity’senergygoals.However,currentlythe
ultimate decision rests with the leadership of each
department.
The continuation and
expansion of programs
to encourage behavior
change, which can
result in significant
energy savings.
PEA
SUPPORTS...

Municipal Energy Profile: The General Fund20
Regularly evaluating
procurement strategies
for all energy sources
as the energy market
evolves using comparable
cities as a guide.
PEA
SUPPORTS...
ELECTRICITY
62.7%Electricity accounts for 62.7%111 of the City’s
utility bill, making it a priority. There are various
costs associated with purchasing electricity that
must be understood. Generation, transmission
and distribution charges make up the bulk of any
electricity bill, along with other service charges
and fees.112 Generation costs are determined by
the electricity supplier which generates the power.
These costs vary based on the price of the fuel the
supplier chooses to use and the actual cost of power
generation.113 Transmission charges are determined
by PJM, the regional grid operator, and are
associated with the movement of electricity through
high voltage transmission lines.114 Distribution
charges are determined by PECO, Philadelphia’s
local electricity distributor, and are associated
with the movement of electricity through the local
electricity grid.115
Since the passage of the Electricity Generation
Customer Choice and Competition Act, the City
has had a choice of generation suppliers to purchase
electricity from to procure the lowest rates. The City
has no control over transmission and distribution
charges which are set by PJM and PECO.
The primary goal of the current procurement plan is
to create budget certainty and to avoid single points
of market exposure.116 This procurement strategy
allows the City to average the cost of electricity
supply for maximum stability and to hedge against
price fluctuations in today’s volatile energy market.
Bothfixedrateonandoffpeakblocksofpowerare
purchased through the PJM subaccount to secure
electricity for future use. Forward purchasing of
expected power load are purchased from 3–30
months in advance to fix the energy supply cost for
80%-90% of the City’s estimated use in order to
prevent the City from purchasing more power than
what will be needed.117 The remaining 10%–20%
is purchased on the PJM Day Ahead Market at the
current market price.118
energy supply
The Energy Office is the central procurement
entity for the City energy supply, including vehicle
fuel. Each of the fuels has its own strategy.
Philadelphia
New York
Seattle
Chicago
Denver
Boston
Columbus
Phoenix
San Francisco
Portland 13.75
13
12.25
11.25
11
11
10.75
10.75
10.5
10.5
OIL
STEAM
NATURAL GAS ELECTRICITY
76.75
70
69.75
69.75
65.25
62
56
55.25
54.75
54.5

Municipal Energy Profile: The General Fund 21
NATURAL GAS
25%There are 450 natural gas accounts in the General
Fund consuming over 722 MCF annually.119 This
represents approximately 25% of the City’s utility
bill. Philadelphia Gas Works (PGW) is the City’s
main natural gas supplier and distributor; however,
the 20 largest accounts have a Natural Gas Cost
Management and Procurement Plan and receive their
commodity supply from a third party supplier and
use PGW as their distributor.120
The City must pay both commodity costs and
basis costs for natural gas as well as PGW’s
distribution charges. Commodity costs are based
on the value of the physical commodity itself, the
natural gas.121Basiscostsreflectthecostassociated
with maintaining natural gas infrastructure and
transporting natural gas between the refinery and
the user.122Boththecommodityandbasismarkets
have always been volatile. PGW’s distribution costs
are not market-based, instead set by tariffs, making
them highly stable.123
STEAM
11.6%Steam makes up 11.6% of the City’s total utility
expenditure.124 Approximately ten City buildings
utilizesteamgenerationfromVeoliaforheatand
humidification, including the Art Museum, which is
the largest user in the General Fund.125Veoliaisthe
only producer of steam in Philadelphia, and the City
has a negotiated contract in place.
FUEL OIL
1%Less than 1% of the City’s energy budget126 is
allocated for fuel oil. It is used to heat a minimal
number of City buildings.
VEHICLE FUEL
In 2013, the Managing Director put out a directive for the City to begin
purchasing vehicle fuel strategically. Fixed rate purchases of fuel for the City’s
fleetaremadeinaccordancewiththeVehicleFuelCostManagementPlanor
attimeswhenthemarketallowsforValueBuys,whenthepriceofoildrops
significantly.127 The goal of the Cost Management Plan is to guarantee future
fuel supply and to ensure budget certainty.
Municipal Energy Profile: The General Fund22
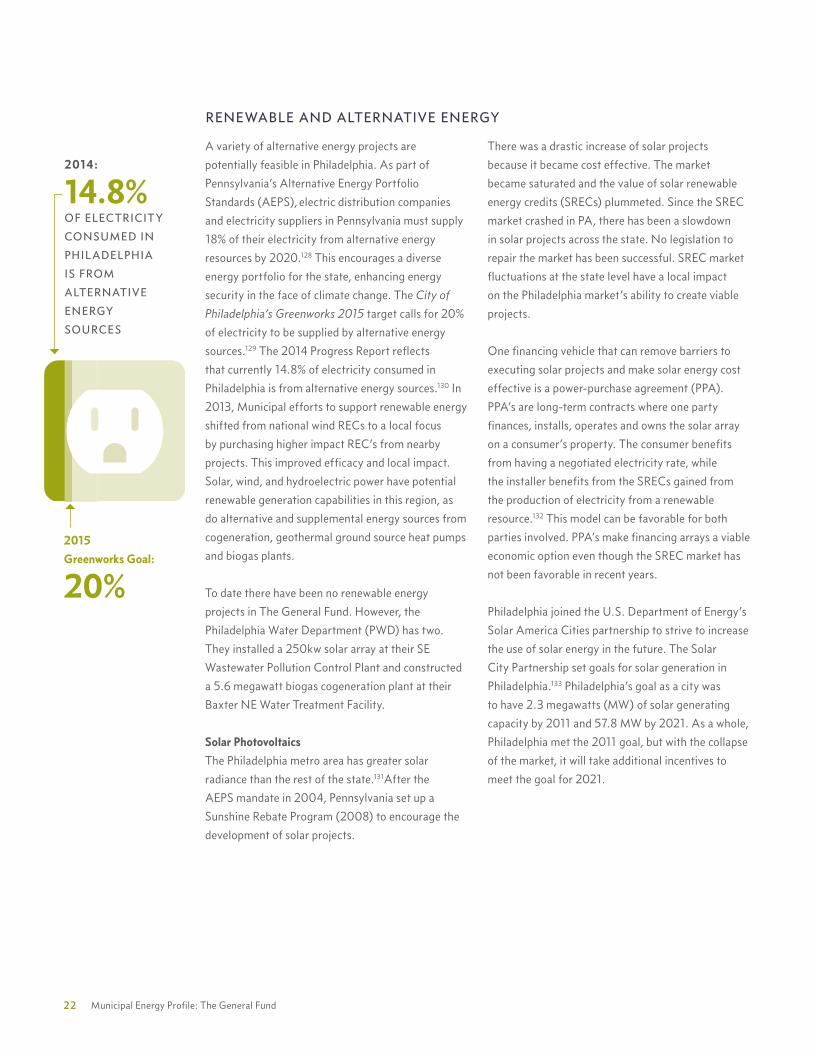
RENEWABLE AND ALTERNATIVE ENERGY
A variety of alternative energy projects are
potentially feasible in Philadelphia. As part of
Pennsylvania’s Alternative Energy Portfolio
Standards (AEPS), electric distribution companies
and electricity suppliers in Pennsylvania must supply
18% of their electricity from alternative energy
resources by 2020.128 This encourages a diverse
energy portfolio for the state, enhancing energy
security in the face of climate change. The Cityof
Philadelphia’sGreenworks2015 target calls for 20%
of electricity to be supplied by alternative energy
sources.129 The 2014 Progress Report reflects
that currently 14.8% of electricity consumed in
Philadelphia is from alternative energy sources.130 In
2013, Municipal efforts to support renewable energy
shifted from national wind RECs to a local focus
by purchasing higher impact REC’s from nearby
projects. This improved efficacy and local impact.
Solar, wind, and hydroelectric power have potential
renewable generation capabilities in this region, as
do alternative and supplemental energy sources from
cogeneration, geothermal ground source heat pumps
and biogas plants.
To date there have been no renewable energy
projectsinTheGeneralFund.However,the
Philadelphia Water Department (PWD) has two.
They installed a 250kw solar array at their SE
Wastewater Pollution Control Plant and constructed
a 5.6 megawatt biogas cogeneration plant at their
BaxterNEWaterTreatmentFacility.
Solar Photovoltaics
The Philadelphia metro area has greater solar
radiance than the rest of the state.131After the
AEPS mandate in 2004, Pennsylvania set up a
Sunshine Rebate Program (2008) to encourage the
development of solar projects.
There was a drastic increase of solar projects
because it became cost effective. The market
became saturated and the value of solar renewable
energy credits (SRECs) plummeted. Since the SREC
market crashed in PA, there has been a slowdown
in solar projects across the state. No legislation to
repair the market has been successful. SREC market
fluctuations at the state level have a local impact
on the Philadelphia market’s ability to create viable
projects.
One financing vehicle that can remove barriers to
executing solar projects and make solar energy cost
effective is a power-purchase agreement (PPA).
PPA’s are long-term contracts where one party
finances, installs, operates and owns the solar array
on a consumer’s property. The consumer benefits
from having a negotiated electricity rate, while
the installer benefits from the SRECs gained from
the production of electricity from a renewable
resource.132 This model can be favorable for both
parties involved. PPA’s make financing arrays a viable
economic option even though the SREC market has
not been favorable in recent years.
Philadelphia joined the U.S. Department of Energy’s
Solar America Cities partnership to strive to increase
the use of solar energy in the future. The Solar
City Partnership set goals for solar generation in
Philadelphia.133 Philadelphia’s goal as a city was
to have 2.3 megawatts (MW) of solar generating
capacity by 2011 and 57.8 MW by 2021. As a whole,
Philadelphia met the 2011 goal, but with the collapse
of the market, it will take additional incentives to
meet the goal for 2021.
2014:
14.8%
OF ELECTRICITY
CONSUMED IN
PHILADELPHIA
IS FROM
ALTERNATIVE
ENERGY
SOURCES
2015
Greenworks Goal:
20%

Municipal Energy Profile: The General Fund 23
projects ENERGY EFFICIENCY PROJECTS AND GUARANTEED ENERGY SAVINGS AGREEMENTS
TheQuadplexproject(highlightedonthenextpage)
is the City’s first Guaranteed Energy Savings Act
(GESA) project. GESA projects are large energy
efficiency projects that provide long term energy
and cost savings through a performance contract.
GESAs have complex financing arrangements
and use multiple funding sources, but often use
savings to pay for the costs of the project. The
City’sQuadplexGESAprojectbeganin2012andis
expected to realize over $10 million in savings for the
City over the duration of the project.138 This project
tookadvantageofQualifiedEnergyConservation
Bonds(QECB), a type of revenue bond with a low
interest rate to be used for energy efficiency capital
expenditures in public buildings to reduce energy
consumption by at least 20 percent.139 The City is
considering the GESA model for large facility energy
efficiency projects, like museums
and prisons, in the future.140
The cost-effectiveness of the GESA/ESCO model
have been debated. Allegheny County compared
their traditional project process with a GESA/
ESCO project and concluded it would have cost the
county more to do the same project internally.141
Often the standard administrative costs (project
management, procurement, design specifications)
and lost opportunity costs are overlooked.142 Paying
an ESCO ensures that the project will be completed
in a reasonable time frame and minimizes the risk,
since the ESCO guarantees the savings.
Ground Source Heat Pumps
Another alternative energy source that can be
utilized by smaller facilities is ground source heat
pumps.134 Ground source heat pumps take advantage
of consistent annual groundwater temperatures
(50°F-60°F). It can be used to help heat buildings
in the winter and help remove heat from buildings
in the summer. The volatile energy market has no
effect on the cost of this technology and life cycle
costs for the system are low with a high return on
investment. A system has been installed by the City
at the Philadelphia Police Department Regional
Tactical Training Facility.135
There is also potential for sewage or wastewater
infrastructure to be used with ground source
heat pumps.136 There is a wastewater geothermal
installation in operation at PWD’s Southeast Water
Pollution Control Plant. This technology has helped
reduce the amount of energy needed to heat and cool
the building and saves PWD $18,000 annually.137

Municipal Energy Profile: The General Fund24
The Quadplex Guaranteed Energy Savings Project,
an initiative of the Mayor’s Office of Sustainability,
the Department of Public Property, and the Mayor’s
Office of Transportation & Utilities uses the savings
from increased building energy efficiency to
pay for retrofits and other upgrades. Project
goals included: reduce energy use & cost,
improve tenant comfort, proactively invest in
facilities, and enable sustainable practices.
TheQuadplexGESAProjecthasbeenintheworks
since late 2008. In late 2009 the City selected
the energy service company Noresco to complete
an energy audit, develop energy conservation
measures, and to manage their implementation.
Improvement to four of the City’s biggest energy
users,knowncollectivelyasthe“Quadplex,”(City
Hall,theMunicipalServicesBuilding,OneParkway,
and the Criminal Justice Center) recently completed
construction in January 2015.
Many of the upgrades are invisible to building users.
These include improvements to boilers, steam pipe
insulation,andHVACdrivesandfilters.Inaddition,
the City has adopted new building control systems.
These systems include web-based software that
allows city staff to remotely monitor and manage,
inreal-time,buildingHVACsystems.Increased
capacitytocontrolHVACisparticularlyimportant
because building heating and cooling account for
between50-60%ofQuadplexbuildingenergyuse.
QUADPLEX GESA PROJECT
PROJECT GOALS
REDUCEenergy use and cost
ONE PARKWAY
JUSTICE JUANITA KIDD STOUT
CENTER FOR CRIMINAL JUSTICE
IMPROVEtenant comfort
INVESTin facilities
ENABLEsustainable practices

Municipal Energy Profile: The General Fund 25
SomeoftheQuadplexupgradesaremorevisibleto
building users, such as the installation of low-flow
water fixtures. In addition, those who enter the
MunicipalServicesBuildingfromtheunderground
concourse may have noticed newly sealed doors.
VisitorstoCityHallmaynoticenewLEDlighting
in the entrance vestibules and the clocktower.
In addition to cost savings, there are significant
operational benefits associated with upgrading to
more energy efficient building features. For example,
LED lights require replacement far less frequently
than traditional fluorescent light bulbs.
AfteroneyeartheQuadplexGESAProjecthasa
positive cash flow. All bonds will be completely paid
in 15 years, but savings will continue.
PROJECT SNAPSHOT 143
Total Cost $12,285,000
Current Energy Costs in the Four Buildings (Annual, 4-year Average)
$5,221,000
First Year Energy Cost Savings $1,340,000
First Year Bond Payment ($988,000)
Net Cash Flow (First Year)Increaseswithincreasesinenergyprices.
$352,000
Air Quality Benefits Equivalent of removing 2,156 cars from the road
M/W/DS Business Enterprise participation 22%
PROJECTED
UTILITY SAVINGS
IN THE FIRST
YEAR OF THE
PERFORMANCE
PERIOD
MUNICIPAL
SERVICES
BUILDING
CITY HALL
$1.4
MILLION
Lighting improvements
to enhance energy efficiency
Water conservation improvements
that reduce water usage with new low flow devices
Energy management system improvements
that improve temperature control and operability
Entryway improvements
that help seal the building
ONE PARKWAY
Illustration provided by Philadelphia Energy Office

Municipal Energy Profile: The General Fund26
financing
Todate,withtheexceptionoftheQuadplexproject,
General Fund projects continue to use a traditional
financing approach using operating or capital dollars
to fund energy efficiency projects. Most specific City
energy-efficiency projects have been funded through
the MOS’s capital budget, dispersed through the
Energy Efficiency Fund. In FY 2014 the budget
was $500,000.144 Other financing sources have
included:
Energy Efficiency and Conservation Block Grant
(EECBG)
• One time American Recovery and Reinvestment
Act (ARRA) funding from the U.S. Department
of Energy
• CityofPhiladelphiainitiativessupportedbythe
$14.1millionEECBGincludedinstallationand
verification of traffic LED lights, establishing
Energy Works loan funds, installation of RFIDs for
incentivebasedrecycling,installationofBigBelly
solar compacting litter baskets, installation of bike
racksandinstallationofa171kwPVsystemfor
Philadelphia Water Department. Other supported
initiatives include city’s first GESA Project, MOS
energy efficiency efforts, Greenworks, green
building training and outreach and purchase of
wind renewable energy credits145
Qualified Energy Conservation Bond (QECB)
• The City has approximately $9 million in
unallocatedQECBs.Theydonotexpire.146
Projects under consideration include the prisons
and the Philadelphia Museum of Art147
General Fund Operating Dollars
• A few very small projects have been
completed by departments using their own
General Fund dollars148
Grant Funding
• The City won a $400,000 Pennsylvania Energy
Development Authority grant in 2011, which
was used for lighting retrofits at six recreation
centers149
NOTE: Project financing is technical and complex. This report presents an overview of innovative opportunities for the City in regards to financing energy efficiency. For more information on energy efficiency finance refer to: Wilson Sonsini Goodrich & Rosati (WSGR) InnovationsandOpportunitiesinEnergyEfficiencyFinance, 2nd edition (May 2012) & 3rd edition (May 2013).
Leveraging the
unallocated QECB
funding and
Guaranteed Energy
Savings Agreements
(GESAs) to explore
new large scale energy
projects, such as the art
museum and prisons,
and to improve the
energy efficiency of
existing buildings.
PEA
SUPPORTS...

Municipal Energy Profile: The General Fund 27
CURRENT REBATE ACCOUNTING
Pursuing rebates is disincentivized by City accounting
practices. Currently, rebates are viewed as revenue
and are deposited to the General Fund versus being
credited to the project’s bottom line. As a result,
rebates are not being effectively leveraged in current
and future projects. When budgets are scrutinized,
energy efficiency measures may be interpreted as an
added cost and eliminated from the project scope,
even though they may be funded through rebates.
It is critical for rebates to offset the efficiency
investments they fund. Rebates reduce expense
and provide a means to get efficiency projects
implemented. It is not revenue.
There is an additional lost opportunity cost. PECO’s
ACT 129 Smart Ideas rebate pool is significant and
funded by all PECO customers, including the City,
through an energy efficiency program charge. The
rebates are awarded in order of request, so the City is
eligible to receive more than they contribute. Money
will be left on the table if not proactively pursued.
INNOVATION IN ENERGY EFFICIENCY FINANCE
The goal of energy efficiency finance is to provide
building owners with a cost effective alternative
to using their own funds for the purchase or
installation of energy efficiency improvements.
Energy efficiency finance structures provide building
owners with access to up-front capital and other
forms of financing for a specific set of facility energy
improvements. The debt is typically repaid over time
as energy savings are generated. Financing models
are project specific and are determined based on
project size, the desired payback period, and utility
incentives and rebates available.
Recent innovations in energy efficiency finance and
the development of new business models to address
the additional upfront cost (first cost issue) and other
market barriers have accelerated mobilization of
capital for energy efficiency projects.150 There are
three financing models that are attracting significant
interest from public sector stakeholders.
All of these models can be structured to be on or off
the balance sheet, to allow for extensive retrofits,
and are repaid through energy savings.151 They
include:152
1. Energy Savings Performance Contracting (ESPC)
2. Energy or Efficiency Services Agreement (ESA)
3. Managed Energy Services Agreements (MESA)
The financing toolbox is evolving and creates
additional opportunities for municipalities that
benefit from long term ownership. Each of the
models listed above achieves this balance in a
different way and addresses major barriers including:
first cost hurdle, useful life timing mismatch,
scalability, existing property or financing restrictions
and energy baseline measurements.

Municipal Energy Profile: The General Fund28
Significant progress has been made over the years to manage energy effectively yet energy efficiency
continues to be an underutilized resource in the design and maintenance of buildings. It is difficult to
balance program needs and project budgets when capital dollars are scarce, leaving the temptation to
be penny wise and dime foolish. The City would significantly benefit from further implementing policies
and processes that encourage energy awareness and conservation.
LOOKING FORWARD
governancePhiladelphia has already taken the first steps to
reduce energy use in municipal buildings, but there
needs to be greater accountability to achieve more
successful results. An opportunity exists to expand
and restructure the Energy Office to incorporate
energy priorities into daily operations within every
department. It is vital to increase dedicated energy
management staff for optimal conservation and
savings. Energy is a non-discretionary expense and
it is important that Philadelphia, as the fifth largest
City in America, become a national leader in energy
policy, management, and implementation.
`
For example, New York City has one energy
personnel in every department of its city government.
Those individuals take care of all energy needs in his
or her department and work with the Office of Long
Term Planning and Sustainability and the Department
of Citywide Administrative Services.153 This structure
increases energy reduction accountability in each
department and positions energy management as a
fundamental operating issue, not an optional add-on.
Ideally, Philadelphia would incorporate energy
efficiency into each department by having
department leadership coordinate with the Energy
Office for energy efficiency projects, behavioral
changes, and effective and unique energy
management solutions specific to each department.
The tracking, managing and reporting of energy data
is a critical component of the City’s energy strategy
to progress towards its energy-efficiency goals. The
ACEEE reported that it is critical for staff members
to be exclusively dedicated to energy management
to effectively implement tasks required and achieve
energy-related goals.154
Philadelphia
New York
Seattle
Chicago
Denver
Boston
Columbus
Phoenix
San Francisco
Portland 13.75
13
12.25
11.25
11
11
10.75
10.75
10.5
10.5
OIL
STEAM
NATURAL GAS ELECTRICITY
76.75
70
69.75
69.75
65.25
62
56
55.25
54.75
54.5
ACEEE CITY SCORECARD: LOCAL GOVERNMENT OPERATIONS
Philadelphia ranks alongside NYC with 10.5 out of 15 possible points.
Points are based on:
• energyefficiencygoals
• energystrategyimplementation
• procurementandconstructionpolicies
• integrationofenergyefficiencyintoassetmanagement and maintenance strategies155
Departmental
leadership coordinating
efficiency projects,
behavior changes and
energy management
solutions with the
Energy Office
PEA
SUPPORTS...

Municipal Energy Profile: The General Fund 29
legislation and policy PENNSYLVANIA’S BUILDING ENERGY CODE
Buildingsrepresentapproximately41%of
total Pennsylvania energy consumption.156
Without updating the current state energy code,
“Pennsylvania is erecting new buildings that are
unnecessarily wasting energy and are built to lower
construction and safety standards that the industry
can cost-effectively and technically achieve.”157
Leadership in Philadelphia needs to understand the
full impact of the state’s current decision and choose
a new path for Philadelphia by adopting voluntary
codes such as the International Code Council’s 2012
International Green Construction Code (IgCC),
incentivizing building better than code, or petitioning
the state for its own code.
The City has the ability to petition the state to
require buildings in Philadelphia to exceed the
state’s current (2009) building code, however,
there are both advantages and disadvantages to
doing so. While the code would be more stringent
and potentially meet or exceed the 2012 ICEE, the
petition process is lengthy, and mandating a stricter
code reduces the municipality’s flexibility in meeting
local needs.158
The City can incentivize building owners to
exceed the current energy code through policy.
One way to do this would be to mandate that
buildings meet or exceed the 2012 IgCC. The
IgCC “creates a regulatory framework for new and
existing buildings, establishing minimum green
requirements for buildings and complementing
voluntary rating systems, which may extend
beyond baseline of the IgCC.”159 The IgCC
includes provisions from the International Energy
Conservation Code and ICC-700, the National
GreenBuildingStandard,andASHRAEStandard
189.1.160 This code allows for multiple levels of
compliance, providing flexibility for states or
municipalities who choose to adopt it.161Bothstates
and individual cities have made commitments to
incorporate the IgCC into their buildings codes
including states such as Florida, North Carolina,
Oregon, Rhode Island, Maryland and cities such
as Phoenix and Scottsdale, Arizona; Richland,
Washington,andKeene,NewHampshire.162
Petitioning the state for
its own code,
incentivizing building
better than code, or
adopting voluntary
codes such as the IgCC
PEA
SUPPORTS...

Municipal Energy Profile: The General Fund30
potential planning process policies and measures
There are other strategies the City can implement
to maximize building performance and reduce
wastedenergy.Buildingsystemsareselectedearly
in the design process and determine operating
expenses for the life of the building. Installing cheap,
inefficient systems obligates the City to a long term
energy expense. The real cost of a facility includes
construction, operations, and maintenance expenses
over the lifetime of the building. Occupant behavior,
maintenance, and volatile energy prices also play
a role in operating costs. It is vital to recognize
that a building is a complicated interwoven series
of systems. Isolated design decisions during the
design process have long-term operating liability
consequences.
To further complicate the matter, standard
accounting and budgeting processes do not
recognize the interconnectedness of a building’s
systems. This encourages isolated design decisions
that are initially made to reduce the upfront cost
of the building, but ultimately render the building
inefficient. Although energy-wise decisions may
slightly increase the initial upfront cost of the project,
they have the potential to significantly reduce a
building’s total lifetime cost. Future project planning
policies and strategies that could benefit the City
long term are described below.
HOLISTIC AND INTEGRATED DESIGN APPROACH
It is generally recognized that whole-building
design can achieve significant energy savings.163
Integrating conservation-minded thinking into all
aspects of project planning management, including
the initial design and construction of a building, to
procurement of energy for that building, to effective
ongoing operation management. 20-50% energy
savings can be realized per facility164 with the correct
policies and management strategies in place. With
a holistic approach, the City can achieve significant
reductions in energy consumption to lower its
energy cost.
TheStreetadministration’s“PhiladelphiaHigh
PerformanceBuildingRenovationGuide,”outlines
integrated whole building approaches for roof,
window,lighting,automation,HVACandelectrical
systems upgrades that are still relevant today.
“ The renovation
process needs to
evolve from isolated
repairs to an
integrated design
approach...”

Municipal Energy Profile: The General Fund 31
RETURN ON INVESTMENT ANALYSIS
Return on Investment (ROI) Analysis is a
commonly used financial measure to determine the
comprehensive benefits of a project that are not
captured in a traditional budget sheet. ROI analysis
requires comprehensive information about facilities
enabling departments to determine operating,
lifecycle, replacement and return on investment
costs.165 ROI is a powerful tool that can be used
to determine the payoff of energy efficiency over
many years. It can determine if additional up-front
costs for energy efficiency measures are justified
over the useful life of the project.
InFiscalYear(FY)2014theOfficeofBudgetand
Program Evaluation piloted an ROI analysis for
capital projects in several departments.166
The pilot identified the incremental capital and
operating costs associated with each project as well
as any operational savings, incremental revenue, or
outside capital funding generated. As a result, cost
benefit legislation was passed. Starting in
FY 2016, the mayor is required to submit a cost-
benefit analysis for any new capital project to City
Council. The analysis, approved by the finance
director, shall include return on investment, payback
and life cycle cost of the project. The analysis shall
also include benefits of the proposed project and
alternates to the proposed project. The rationale for
proceeding with the project is required for projects
that are not calculable or for which the costs exceed
the benefits.167
The Mayor’s Task Force on City-Owned Facilities
recommends implementing a strategic asset
management program (AMP) to issue work
orders, generate reports, and track metrics
including: energy use, material and labor costs
of maintenance, useful life of components,
replacement dates and warranties, end-of-useful-
life dates and capital investments.
LIFE CYCLE COST ASSESSMENT
Understanding how much a facility is going to cost
to operate and maintain throughout the life of the
facility is a crucial component to determine how
to approach the first cost investment. Life Cycle
Costing (LCC), also known as Life Cycle Cost
Analysis (LCCA), can be used to determine if a
higher initial cost for an energy efficient design
is justified. “LCC provides a basis for contrasting
initial investments with future costs over a specified
time period.”168 Future costs are discounted to
make current economic comparisons between
alternative designs.169
LCC is advantageous because it incorporates all
relevant costs for a building, such as the initial
capital cost, occupation costs, operating and
maintenance costs, and the cost incurred or
benefited from its disposal.170 “LCC can evaluate
the life cycle cost of the option and help in selecting
the most suitable option based on a limited budget
and calculated payback period, while simultaneously
managing environmental impacts.” The City should
mandate LCCA and energy efficiency design
information for it’s facilities. Decisions regarding
repairs, replacement, or new construction should be
informed by ROI and LCCA.171
Implementing a strategic
asset management
program to track ROI for
capital projects.
Mandating life-cycle
cost analyses and
energy efficient design
information for City
facilities.
PEA
SUPPORTS...
Municipal Energy Profile: The General Fund32
BUILDING OPERATOR TRAINING
Efficient operations and maintenance (O&M) plans
allow buildings to meet the needs of occupants
while requiring the least amount of energy and
investment.172 It is important to train facilities
personnel to execute O&M plans, encourage energy
reduction through operations and behavior change,
and work to raise awareness and accountability for
employee energy management actions. The City has
offered training to facilities managers, but only when
grant funding is available.173
New York City’s Department of Citywide Adminis-
trative Services recently joined in partnership with
the City University of New York (CUNY) to form
a comprehensive Energy Management Institute to
train NYC city personnel.174 Their goal is to raise
awareness, increase knowledge, and transform
the efficiency of city buildings to reduce energy
consumption by 10 to 15% a year.175 This type of
consistent training for facilities managers and City
personnel would strongly benefit the City’s efforts.
LEVERAGING REBATES AS A FUNDING STREAM
Rebate income is currently viewed as revenue and
is deposited to the General Fund.176 Accounting
practices need to be updated and aligned to
compliment current energy policies. It is critical for
rebates to be credited back to the final project cost.
As budgets are scrutinized, energy efficiency
measures may be interpreted as an added cost and
eliminated from the project scope, even though they
may be funded through rebates.
Project rebate eligibility should be included in project
planning. This funding source is time sensitive but
can be significant.
PECO’S SMART BUSINESS SOLUTIONS DIRECT INSTALL PROGRAM
PECOhaslaunchedaSmartBusinessSolutions
Direct Install Program,177 which could provide the
City with a contract vehicle to efficiently complete
a high volume of small “low-hanging fruit” energy
upgrades such as lighting retrofits and other energy
conservation measures. This program would provide
the City a single point of contact for management
and accountability.178
The rebate is built into the service fee minimizing
upfront investment and eliminating rebate
administration.179 This program is limited to small
facilities with a demand under 100 kW and would be
most applicable to the City’s fire stations, libraries
and recreation centers.180
Training facility
managers and City
personnel to execute
efficient operations and
maintenance plans.
Expanding proactive
rebate management.
Using PECO’s Smart
Business Solutions
Direct Install program
as a contract vehicle for
small energy upgrades.
PEA
SUPPORTS...
Municipal Energy Profile: The General Fund 33
reducing demand
DEPARTMENTAL ENERGY EFFICIENCY INCENTIVE PROGRAM
A future policy option to explore would be for departmental leadership or the Mayor to stipulate that
departmental rebates must be allocated for energy efficiency upgrades.
DEPARTMENTAL ACCOUNTABILITY POLICY
BlanketutilitypaymentsbytheCityonbehalfofall
departments provide no incentive for cost control
in current or future facilities. As a result, energy
efficiency is a vulnerable and optional program
element.
Project leadership is evaluated solely on schedule
and construction budget metrics. Life cycle cost
implications are optional program considerations,
but commit the City to considerable long term
expenses.
Future policy options for the City
to explore include:
• Explorelinkingdepartmentalperformance
reviews with departmental energy efficiency
• Holdallprojects(renovationandnew
construction, leased or owned) and individuals
to a utility efficiency standard 181
emerging data management technologiesAs the City explores potential planning policies and management improvements, there are technological
considerations. Technology is making it easier to track and store data to increase knowledge, raise awareness,
and improve accountability. A few opportunities that exist are explained below:
SMART METER TECHNOLOGY
A smart meter records electricity data, but it is
distinguished from older electricity meters by the
capacity to electronically transmit and receive data
between the meter and a utility’s central system.182
The sensors can convey information at frequent
intervals about power consumption, changes in
power quality, and power outages. Act 129 was
passed in 2008 by Pennsylvania legislature and
requires large utility providers to switch to smart
meters by 2024.183
The City is working with PECO to equip facilities
with smart meter technology184 in order to improve
the analysis of energy use and to respond more
effectively to fluctuating energy demands. PECO’s
smart meters track electricity consumption on an
hourly basis and enables PECO to set pricing in
accordance with demand.185
Linking departmental
performance reviews to
energy efficiency
Holding all projects to
an energy efficiency
standard
PEA
SUPPORTS...
Municipal Energy Profile: The General Fund34
SUBMETERING
Submetering is the process of installing separate
electricity meters on individual facilities or on
separate portions of a facility to evaluate and identify
areas of high energy use that could benefit from
energy conservation measures.186 The City has been
evaluating buildings for submetering candidates that
could benefit from energy conservation measures.
The Philadelphia Museum of Art is a prime
candidate.187
Currently, the Art Museum’s one meter system
misses the granular detail about the individual
sections of the museum complex.
OPEN DATA STRATEGY
The EnergyCAP database has an additional feature,
application program interface (API), that the City
Energy Office plans to develop further in 2015. This
platform can accommodate an Open Data portal to
share energy consumption information with all City
agencies. The Energy Office is working with the
City’s Office of Information Technology (OIT) to
schedule the release of an Open Data portal for use
within City departments.188
The Energy Office is also exploring options to
develop a front-facing Open Data portal to display
energy consumption data to the general public. The
City has evaluated case studies from other cities
which have explored Open Data interfaces including
New York City189 and Washington DC.190, 191, 192
ELECTRONIC DATA INTERFACE
PECO utilizes an electronic bill payment system,
Electronic Data Interface (EDI). EDI has the ability
to provide a detailed and granular breakdown of
all charges directly to the Finance Department
for automated payment and to the City’s energy
management database.
This system provides easier access to current bills,193
but would require automatic payment to PECO.
The City should explore the benefits and
consequences of implementing PECO’s Electronic
Data Interface billing platform and its direct benefit
on responsive energy management practices.
Implementing real-
time data analysis
using submetering
technology, building
automation systems,
remote operation of
buildings, and smart
meters
The City exploring
the benefits and
consequences of
implementing
PECO’s Electronic
Data Interface
billing platform
PEA
SUPPORTS...

Municipal Energy Profile: The General Fund 35
barriers to energy efficiency There are four inter-related barriers that prevent
energy efficiency from being consistently incorpo-
rated into City projects:
1. Lack of utility user accountability
BlanketutilitypaymentsbytheCityonbehalfofall
departments provide no incentive for cost control in
current or future facilities. Departments who drive
project design are currently viewed as clients by DPP,
and energy efficiency is rarely a priority because the
users are completely disconnected and unaccountable
for their energy consumption.
2. Energy efficiency is not a required program
element in project planning There are over 189 steps in the design process for
the construction or renovation of capital projects.194
Energy efficiency evaluation is not currently included
in this administratively burdened process and, with
perceived schedule pressures, there is understandably
little interest in adding additional steps.
3. Incorrect rebate accounting
Rebate income is currently viewed as revenue and
is not credited back to the final project cost. Energy
efficiency measures are interpreted as an added cost
and eliminated from the project scope, even though
they may be funded through rebates.
4. Lack of holistic design approach
Frequently, the scope of a project is established
without recognizing the interdependence of
architectural, mechanical, and electrical systems.
As a result, buildings systems are inefficient. In
addition, efficiency opportunities are missed when
isolated system repairs or modifications are made to
existing systems. The renovation process needs to
evolve from isolated repairs to an integrated design
approach, implementing comprehensive facility
investments in the proper sequence to improve
operational and thermal performance of the total
building.
$
OPE
RATING & MAINTENAN
CECO
STS ARE REDUCEDDepartments are held accountable
for energy use
Raise the Baseline:Incentives for exceeding
current energy code
Departments are incentivized for energy efficiency design
and construction
20-50%ENERGYSAVINGS
Policies are fullyintegrated into
operations
Project Planning
Energy anaylysis and ROIare required in project
and maintenance plans
Capital projects are evaluated on total cost of ownership and have
a stake in operating expenses
Prioritizing Rebates
$ $$
Rebates are proactively pursued and offset energy efficiency
investments
$
LOOKING FORWARD: COMPREHENSIVE INTEGRATION OF ENERGY EFFICIENCY

Municipal Energy Profile: The General Fund36
PEA CALLS TO ACTION
Utilities are not a fixed expense; they can be changed and managed. Energy is not an annual project; it is the
management and optimization of future expenses and a critical component of fiscal prudence. Our research
uncovered significant opportunities for PEA to facilitate action and resolve disconnects between policy and
practice that are unintentionally hindering energy cost and consumption reductions.
There are three specific goals resulting from this Profile:
Daily practices and procedures need to be aligned with current energy policies. Design and properly
resource an organizational structure that builds capacity for municipal energy leadership and integrates an
accountability mechanism.
RECOMMENDATIONS:
• Explore centralizing the functions of utility
management and elevate the office to a place
of authority, reflecting its relevance to all
departments
> Conduct a case study of peers (energy
office capacity, management, utility
procurement, utility payment, bill validation
& explanation, analysis, data management,
project management)
• Evaluate current governance for consistently
motivating long term energy planning and
management
• Determine the actual value of the Energy
Office by calculating savings related to energy
efficiency strategies
• Provide appropriate staffing capacity and
resources for utility management including:
administration of supply & demand, technical
analysis, opportunity evaluation, and project
management
• Recognize innovation and empower staff
with proper authority to hold departments
accountable
• Implement an organizational structure with an
accountability mechanism
1. INCREASE CAPACITY OF THE ENERGY OFFICE AND ACHIEVE ENERGY MANAGEMENT EXCELLENCE

Municipal Energy Profile: The General Fund 37
BlanketutilitypaymentsbytheCityonbehalfofalldepartmentsprovidenoincentiveforcostcontrol
in current or future facilities. As a result, energy efficiency is a vulnerable and discretionary program
element. Project leadership is evaluated solely on schedule and construction budget metrics. Life cycle cost
implications are an optional program consideration but obligate the City to significant long term expenses.
RECOMMENDATIONS:
• Explore linking departmental performance
reviews with departmental energy efficiency
• Holdallprojects(renovationandnew
construction, leased or owned) and individuals
to an utility efficiency standard195
• Adopt a utility performance standard for all
City facilities (leased or owned). All renovations
and new construction should meet sustainability
standards.196
Energy efficiency has the potential to yield 20% savings in electricity consumption, 10% of natural gas
consumption and over 50 percent or more of the expected load growth by 2025.197 It is crucial to coordinate
policies that strongly incentivize “better than code” practices and support the implementation of best
available technology. This will ensure that new construction and major renovations are designed to use
energy effectively and efficiently.
RECOMMENDATIONS:
• Review and evaluate current energy efficiency
design guidelines
• Confirm current requirements are being met
• Revise guidelines to serve as an authoritative
tool to enforce policy
• Develop effective tools that build energy
leadership capacity and strengthen the project
process (statement of work for consultants,
owner checklist, draft questions, develop
metrics to report, develop a project energy
questionnaire)
• Continue/expandpreventativemaintenance
plans
2. CREATE UTILITY ACCOUNTABILITY FOR USERS
3. BUILD CULTURE OF ENERGY AWARENESS & DECISION MAKING THAT PRIORITIZES TOTAL COST OF OWNERSHIP
Thispublicationisthebeginningofamuchlargercriticalconversation.Eachsectionhasthepotentialtobean
individualreport.TheAuthorityplanstoreleaseadditionalreportsrelevanttothePhiladelphiaenergymarket.

Municipal Energy Profile: The General Fund38
references
1. City of Philadelphia Energy Office. FY 2013 Energy Cheat Sheet.
2. American Council for an Energy-Efficient Economy. ExecutiveSummary:2013StateEnergyEfficiencyScorecard. (Nov 2013). http://www.aceee.org/files/pdf/summary/e13k-summary.pdf
3. The Natural Resource Defense Council and Institute for Market Transformation. The City Energy Project. About. http://www.cityenergyproject.org/about/
4. TheWorldBank.TheWorldBankAnnualReport:YearInReview. (2010). http://siteresources.worldbank.org/EXTANNREP2010/Resources/WorldBank-AnnualReport2010.pdf
5. International Energy Agency. WorldEnergyOutlook. (2009). http://www.worldenergyoutlook.org/media/weowebsite/2009/WEO2009.pdf
6. United Nations Environmental Programme SustainableBuildingsandClimateInitiative.BuildingsandClimateChange:SummaryforDecisionMakers. (2009).
7. Mackres, E., Johnson, K., Downs, A., et. al. American Council for an Energy-Efficient Economy. The 2013 City Energy Efficiency Scorecard. (Sept. 2013). Washington, District of Columbia.
8. Ibid.
9. Ibid.
10. Ibid.
11. Ibid.
12. Ibid.
13. Ibid.
14. American Council for an Energy-Efficient Economy. Entire State Database. http://database.aceee.org/
15. Dews, A. and Freeh, R. City of Philadelphia Mayor’s Office of Sustainability. PhiladelphiaBuildingBenchmarkingYearOneReport. (2012). http://www.phillybuildingbenchmarking.com/images/uploads/documents/2012-philly-benchmarking-resultsFINAL.pdf
16. Ibid.
17. http://www.eia.gov/
18. City of Philadelphia Municipal Energy Office. Municipal Energy Office Strategic Plan. (1994). Philadelphia, Pennsylvania.
19. Ibid.
20. Boonin,D.,DirectorofUtility&RegulatoryAffairs, Mayor Goode Administration. (2015, March 18). Informal Interview with Jill Kowalski. Philadelphia, Pennsylvania.
21. http://www.eia.gov/
22. Mondre, J., Former Executive Director of Municipal Energy Office. (2014). Informal Interview with Jill Kowalski. Philadelphia, Pennsylvania.
23. Ibid.
24. Ibid.
25. Ibid.
26. The General Assembly of Pennsylvania. Electricity Generation Customer Choice and Competition Act, 66 Pa.C.S. § 2801. (Dec.1996).Harrisburg,Pennsylvania.
27. Tuluca,A.,Graham,I.,Zumwalt-Hathaway,A., et. al. City of Philadelphia. PhiladelphiaHighPerformanceBuildingRenovationGuidelines. (2004). http://www.phila.gov/pdfs/PhiladelphiaGreenGuidelines.pdf
28. Mayor Nutter, M. City of Philadelphia. Executive Order 6-10 City Purchase of Electricity Supply. (Dec. 2010) Philadelphia, Pennsylvania.
29. City of Philadelphia Mayor’s Office of Transportation and Utilities. Electricity Procurement Plan. (2013). Philadelphia, Pennsylvania.
30. GreenworksPhila.ABlogbytheMayor’sOffice of Sustainability. Mayor Nutter Announces Philadelphia To Participate In National Effort To Reduce Climate Pollution. (Jan. 2014).
31. The General Assembly of Pennsylvania. Act 29 Guaranteed Energy Savings Act. (1996). Harrisburg,Pennsylvania.
32. The General Assembly of Pennsylvania. Guaranteed Energy Savings Contracts, Contracting Procedures, and Contract Provisions.(2010).Harrisburg,Pennsylvania.
33. Ibid.
34. http://www.legis.state.pa.us/cfdocs/legis/li/uconsCheck.cfm?yr=2010&sessInd=0&act=39
35. http://www.dsireusa.org/incentives/incentive.cfm?Incentive_Code=PA06R&re=0&ee=0
36. Ibid.
37. http://www.eia.gov/state/?sid=pa
38. Optimal Energy, Inc. Pennsylvania2013-2018EnergyEfficiencyGoals. Penn Future. (Dec. 2011). http://www.pennfuture.org/UserFiles/File/FactSheets/Report_Act129goals_20111220.pdf
39. Ibid.

Municipal Energy Profile: The General Fund 39
references
40. Penn Future. The good, the bad and the ugly. (Aug 2012). http://my.pennfuture.org/site/MessageViewer?em_id=50401.0
41. The General Assembly of Pennsylvania. HouseBillNo.2200.(Oct.2008).Harrisburg,Pennsylvania.
42. Penn Future. The good, the bad and the ugly. (Aug 2012). http://my.pennfuture.org/site/MessageViewer?em_id=50401.0
43. CleanEnergyWins.APolicyRoadmapforPennsylvania. (March 2004). http://cleanenergywins.org/wp-content/uploads/2014/03/CleanEnergyWins_PolicyRoadmap.pdf
44. Ibid.
45. Ibid.
46. City of Philadelphia Mayor’s Office of Transportation and Utilities. 2013 Annual Energy Reports for Municipal Departments.
47. Dews, A. and Freeh, R. City of Philadelphia Mayor’s Office of Sustainability. PhiladelphiaBuildingBenchmarkingYearOneReport. (2012). http://www.phillybuildingbenchmarking.com/images/uploads/documents/2012-philly-benchmarking-resultsFINAL.pdf
48. EnergyCAP Inc. City of Philadelphia Energy Management Database. (2014).
49. http://www.phila.gov/green//index.html
50. http://www.phila.gov/motu//index.html
51. Agalloco, A., City Energy Manager for the Philadelphia Energy Office. (2014). Informal Interview with Jill Kowalski. Philadelphia, Pennsylvania.
52. Ibid.
53. Philadelphia Energy Authority. Philadelphia Energy Authority Webpage. (2014). http://www.philaenergy.org/
54. Ibid.
55. Ibid.
56. CityofPhiladelphiaCityCouncil.BillNo. 080025. (Dec. 2009). Philadelphia, Pennsylvania. http://www.usgbc.org/Docs/Archive/General/Docs7229.pdf
57. Ibid.
58. Ibid.
59. Mayor Street, J.F. Executive Order 1-07. (April 2007). Philadelphia, Pennsylvania. http://www.phila.gov/ExecutiveOrders/Executive%20Orders/1-07.pdf
60. CityofPhiladelphiaCityCouncil.BillNo. 090923. (April 2010). Philadelphia, Pennsylvania. http://legislation.phila.gov/attachments/10096.pdf
61. City of Philadelphia City Council. Ordinance:BillNo.100368PurchaseObligationBill(2010).Philadelphia,Pennsylvania.
62. Ibid.
63. Dews, A. and Freeh, R. City of Philadelphia Mayor’s Office of Sustainability. PhiladelphiaBuildingBenchmarkingYearOneReport. (2012). http://www.phillybuildingbenchmarking.com/images/uploads/documents/2012-philly-benchmarking-resultsFINAL.pdf
64. Ibid.
65. City of Philadelphia Department of Public Property. Preventative Maintenance Policy Statement Effective March 5, 2013. (2013). Philadelphia, Pennsylvania.
66. City of Philadelphia Department of Public Property. Preventative maintenance Report: FY 2013-2014 Summary and Recommendations. (2013). Philadelphia, Pennsylvania.
67. Ibid.
68. City of Philadelphia Department of Public Property.BillPayMemo(May2012).Philadelphia, Pennsylvania.
69. Agalloco, A., City Energy Manager for the Philadelphia Energy Office. (2014). Informal Interview with Jill Kowalski. Philadelphia, Pennsylvania.
70. Ibid.
71. Ibid.
72. Knox, T. City of Philadelphia Sustainability Working Group. Mayor’s Task Force on City-Owned Facilities: Final Report and Recommendations. (Nov. 2013).
73. Ibid.
74. Ibid.
75. EnergyCAP Inc. City of Philadelphia Energy Management Database. (2014).
76. Ibid.
77. Ibid.
78. EnergyCAP Inc. Normalization. https://www.energycap.com/products/energycap-express-features/utility-bill-normalization
79. EnergyCAP Inc. City of Philadelphia Energy Management Database. (2014).
80. Ibid.
81. Ibid.
82. DeSeve,G. PECO. (2014). Informal Interview with Jill Kowalski. Philadelphia, Pennsylvania.
83. Ibid.
84. Ibid.
85. The International Society of Automation. BuildingAutomation.https://www.isa.org/technical-topics/building-automation/
86. Ibid.
87. Ibid.

Municipal Energy Profile: The General Fund40
references
88. Agalloco, A., City Energy Manager for the Philadelphia Energy Office. (2014). Informal Interview with Jill Kowalski. Philadelphia, Pennsylvania.
89. Ibid.
90. Ibid.
91. PJM. Demand Response. http://www.pjm.com/markets-and-operations/demand-response.aspx
92. Ditze, M., City Energy Analyst for the Philadelphia Energy Office. (2014). Informal Interview with Jill Kowalski. Philadelphia, Pennsylvania.
93. Ibid.
94. PJM. Demand Response. http://www.pjm.com/markets-and-operations/demand-response.aspx
95. City of Philadelphia Mayor’s Office of Transportation and Utilities. Utility Update: City Facilities Recognized for Participation in Demand Response. (Dec. 2013). http://phillymotu.wordpress.com/2013/12/12/utility-update-city-facilities-recognized-for-participation-in-demand-response/
96. Ditze, M., City Energy Analyst for the Philadelphia Energy Office. (2014). Informal Interview with Jill Kowalski. Philadelphia, Pennsylvania.
97. Ibid.
98. Sullivan, K., City Energy Manager for the City of Philadelphia Mayor’s Office of Transportation and Utilities.(2014). Informal Interview with Jill Kowalski. Philadelphia, Pennsylvania.
99. Ibid.
100. Ibid.
101. Ibid.
102. Ditze, M., City Energy Analyst for the Philadelphia Energy Office. (2014). Informal Interview with Jill Kowalski. Philadelphia, Pennsylvania.
103. City of Philadelphia Energy Office. Departmental Energy Efficiency Incentive Pilot Overview: For Tenant and Employee Engagement. Philadelphia, Pennsylvania.
104. Ibid.
105. Ibid.
106. Ibid.
107. Ibid.
108. Ibid.
109. Ibid.
110. Ibid.
111. EnergyCAP Inc. City of Philadelphia Energy Management Database. (2014).
112. Pennsylvania Public Utility Commission. ElectricBillBreakdown:UnderstandingYourElectricBill (June 2013). https://www.puc.state.pa.us/general/consumer_ed/pdf/Electric_Bill_Breakdown_FS.pdf
113. PECO: An Exelon Company. Learn what Customer Choice means to you. (2014). https://www.peco.com/CustomerService/CustomerChoice/Pages/EnergyChoice.aspx
114. Ibid.
115. Ibid.
116. Mayor Nutter, M. City of Philadelphia. Executive Order 6-10 City Purchase of Electricity Supply. (Dec. 2010) Philadelphia, Pennsylvania.
117. Ibid.
118. Ibid.
119. EnergyCAP Inc. City of Philadelphia Energy Management Database. (2014).
120. City of Philadelphia Mayor’s Office of Transportation and Utilities. Natural Gas Cost Management and Procurement Plan (2013). Philadelphia, Pennsylvania.
121. Ibid.
122. Ibid.
123. Ibid.
124. EnergyCAP Inc. City of Philadelphia Energy Management Database. (2014).
125. Ibid.
126. Ibid.
127. City of Philadelphia Managing Director’sOffice.FleetVehicleFuelCost Management Plan Memo (2013). Philadelphia, Pennsylvania.
128. The Pennsylvania General Assembly. State Bill1030.(November2004).Harrisburg,Pennsylvania.
129. City of Philadelphia Mayor’s Office of Sustainability. GreenworksPhiladelphiaProgressReport. (2014). http://www.phila.gov/green/PDFs/Greenworksprogressreport.pdf
130. Ibid.
131. http://www.nrel.gov/gis/images/map_pv_national_hi-res_200.jpg
132. NREL: National Renewable Energy Laboratory. PowerPurchaseAgreementChecklistforStateandLocalGovernments. (Oct. 2009). http://www.nrel.gov/docs/fy10osti/46668.pdf
133. City of Philadelphia Mayor’s Office of Sustainability. The Solar America Cities Program. http://www.phila.gov/green/guidebookIntroduction.html
134. Manitoba, CA Municipal Government. Why Geothermal? http://www.gov.mb.ca/ia/energy/geothermal/why_geo.html
135. City of Philadelphia Mayor’s Office of Sustainability. GreenworksPhiladelphia2014ProgressReport (2014). http://www.phila.gov/green/PDFs/Greenworksprogressreport.pdf
136. Cardno, C.A. New Geothermal Source Ideal for Urban Areas. (2014). The American Society of Civil Engineers. http://www.asce.org/CEMagazine/Article.aspx?id=25769808225#.VDXtHPldVHU
137. Philadelphia Water Department. SewageGeothermalInstallationFactSheet. PWD’s Energy Plan Progress. http://www.phillywatersheds.org/doc/Energy/SewageGeothermalFactSheet.pdf.

Municipal Energy Profile: The General Fund 41
references
138. City of Philadelphia Mayor’s Office of Transportation and Utilities. Utility Update: City buildings get energy efficient upgrades. (May 2014). http://phillymotu.wordpress.com/tag/gesa/
139. United States Department of Energy. State andLocalSolutionCenter.QualifiedEnergyConservationBond(QECB).http://www1.eere.energy.gov/wip/solutioncenter/qecb.html
140. Agalloco, A., City Energy Manager for the Philadelphia Energy Office. (2014). Informal Interview with Jill Kowalski. Philadelphia, Pennsylvania.
141. http://www.alleghenycounty.us/alleghenygreen/EnergyConservation/contracting.aspx
142. Sullivan, K., City Energy Manager for the City of Philadelphia Mayor’s Office of Transportation and Utilities.(2014). Informal Interview with Jill Kowalski. Philadelphia, Pennsylvania.
143. Philadelphia Energy Office. EnergySalon:EnergyEfficiencyParalysis, presentation by Agalloco, A.
144. City of Philadelphia City Planning Commission. TheRecommendedFY2015-2020CapitalProgram. (Feb. 2014). http://phlcouncil.com/wp-content/uploads/2014/03/RecommendedFY15_20CapitalProgram.pdf
145. DOE Audit Report, TheDepartmentofEnergy’sEnergyEfficiencyandConservationBlockGrantProgramFundedundertheAmericanRecoveryandReinvestmentActfortheCityofPhiladelphia http://energy.gov/sites/prod/files/OAS-RA-12-09.pdf
146. Ibid.
147. Agalloco, A., City Energy Manager for the Philadelphia Energy Office. (2014). Informal Interview with Jill Kowalski. Philadelphia, Pennsylvania.
148. Ibid.
149. Pennsylvania Department of Environmental Protection. ThePennsylvaniaEnergyDevelopmentAuthorityAnnualReport. (Jan. 2012). http://www.elibrary.dep.state.pa.us/dsweb/Get/Document-86683/7000-MN-DEP4302%20%20PEDA%20Annual%20Report%20July%201%202010%20-%20June%2030%202011.pdf
150. Wilson Sonsini Goodrich & Rosati. InnovationsandOpportunitiesinEnergyEfficiencyFinance.3rded. (May 2013). http://www.wsgr.com/publications/PDFSearch/WSGR-EE-Finance-White-Paper_13.pdf
151. Ibid.
152. Ibid.
153. American Council for an Energy Efficient-Economy. State and Local Policy Database. http://database.aceee.org/
154. American Council for an Energy-Efficient Economy. Entire State Database. http://database.aceee.org/
155. Ibid.
156. U.S.Energy Information Administration. Energy Consumption by End-Use Sector, ranked by State. (2011). State Energy Data System (SEDS).
157. CleanEnergyWins.APolicyRoadmapforPennsylvania. (March 2004). http://cleanenergywins.org/wp-content/uploads/2014/03/CleanEnergyWins_PolicyRoadmap.pdf
158. Ibid.
159. International Code Council. International Green Construction Code. http://www.iccsafe.org/CS/IGCC/Pages/default.aspx
160. Ibid.
161. Ibid.
162. International Code Council. ICCFactSheet:FirstInternationalGreenConstructionCode(IgCC)Adoptions. http://www.iccsafe.org/cs/IGCC/Documents/First_IgCC_Adoptions_FactSheet.pdf
163. United States Environmental Protection Agency. National Action Plan for Energy EfficiencyVisionfor2025:AFrameworkfor Change. (2008). http://www.epa.gov/cleanenergy/documents/suca/vision.pdf
164. Ibid.
165. Knox, T. City of Philadelphia Sustainability Working Group. Mayor’sTaskForceonCity-OwnedFacilities:FinalReportandRecommendations. (Nov. 2013).
166. City of Philadelphia Mayor’s Office of Sustainability. GreenworksPhiladelphiaProgressReport. (2014). http://www.phila.gov/green/PDFs/Greenworksprogressreport.pdf
167. Chapter21-2200.Cost-BenefitAnalysisforCapitalBudgeting47.https://law.resource.org/pub/us/code/city/pa/Philadelphia/title21.html
168. Bayer,C.,Gamble,M.,Gentry,R.,Joshi,S. AIAGuidetoBuildingLifeCycleAssessmentinPractice. (2010). The American Institute of Architects. http://www.aia.org/aiaucmp/groups/aia/documents/pdf/aiab082942.pdf
169. Ibid.
170. Ibid.
171. Knox, T. City of Philadelphia Sustainability Working Group. Mayor’sTaskForceonCity-OwnedFacilities:FinalReportandRecommendations. (Nov. 2013).
172. http://www.nyc.gov/html/dem/html/conservation/operations.shtml
173. Agalloco, A., City Energy Manager for the Philadelphia Energy Office. (2014). Informal Interview with Jill Kowalski. Philadelphia, Pennsylvania.
174. http://www.nyc.gov/html/dem/html/training/training.shtml
175. http://www.nyc.gov/html/dem/html/conservation/operations.shtml

Municipal Energy Profile: The General Fund42
references
176. Agalloco, A., City Energy Manager for the Philadelphia Energy Office. (2014). Informal Interview with Jill Kowalski. Philadelphia, Pennsylvania.
177. Ibid.
178. Ibid.
179. Ibid.
180. Ibid.
181. Knox, T. City of Philadelphia Sustainability Working Group. Mayor’sTaskForceonCity-OwnedFacilities:FinalReportandRecommendations. (Nov. 2013).
182. Pennsylvania Public Utilities Commission. SmartMeterQ&A. http://www.puc.pa.gov/General/consumer_ed/pdf/13_Smart%20Meters.pdf
183. Energy Coordinating Agency. PECO to Install Smart Meters for 1.6 Million by End of 2014. Energy News. http://ecasavesenergy.org/news/peco-install-smart-meters-16-million-end-2014
184. Smart Grid Consumer Collaborative. BecomeaSmartPowerConsumer. (May 2013). http://smartgridcc.org/wp-content/uploads/2013/05/SGCC-Pricing-FactSheet.pdf
185. Ibid.
186. Agalloco, A., City Energy Manager for the Philadelphia Energy Office. (2014). Informal Interview with Jill Kowalski. Philadelphia, Pennsylvania.
187. Ibid.
188. Ibid.
189. The City of New York. NYC Open Data. https://nycopendata.socrata.com/
190. TheDistrictofColumbia.BuildSmartDC.http://www.buildsmartdc.com/
191. The District of Columbia Office of the City Administrator. Open Data Catalog. http://data.dc.gov/
192. The District of Columbia. OpenDataDC. http://www.opendatadc.org/
193. Agalloco, A., City Energy Manager for the Philadelphia Energy Office. (2014). Informal Interview with Jill Kowalski. Philadelphia, Pennsylvania.
194. Ibid.
195. Knox, T. City of Philadelphia Sustainability Working Group. Mayor’sTaskForceonCity-OwnedFacilities:FinalReportandRecommendations. (Nov. 2013).
196. Ibid.
197. CleanEnergyWins.APolicyRoadmapforPennsylvania. (March 2004). http://cleanenergywins.org/wp-content/uploads/2014/03/CleanEnergyWins_PolicyRoadmap.pdf

Municipal Energy Profile: The General Fund 43
acknowledgements
This report is a result of compiling over 200
documents provided by the Energy Office, informal
interviews, case study research, and on-going
working group sessions. It was an ambitious task, but
a valuable exercise in creating a consolidated record
of General Fund energy management. It would not
have been possible without collaboration with the
Energy Office, MOTU and MOS.
CITY WORKING GROUP:
Adam Agalloco, Energy Office
Mardi Ditze, Energy Office
Katherine Gajewski, Mayor’s Office of Sustainability
Andrew Stober, Mayor’s Office of Transportation and Utilities
Kristin Sullivan, Former Mayor’s Office of Transportation and Utilities
CONTRIBUTORS:
J.BarryDavis,OfficeoftheLawDepartment
Judith Mondre, Mondre Energy, Inc.
ResearchInterns: Adebayo Adejare, Philadelphia Energy Authority
BarbaraMcNutt,PhiladelphiaEnergyAuthority
Paul Molta, Philadelphia Energy Authority
Christian Pezanowski, Philadelphia Energy Authority
Lu Xu, Philadelphia Energy Authority
PEA BOARD OF DIRECTORS:
Christopher A. Lewis, Chairman
EmilySchapira,ViceChair
E. Mitchell Swann, Secretary
Ken Ogawa, Treasurer
BarbaraAdams,Director
PRIMARY AUTHORS:
Jill Kowalski, Philadelphia Energy Authority
Samantha Merkh, Philadelphia Energy Authority

Municipal Energy Profile: The General Fund44
CityHall
Room 780
Philadelphia, PA 19107
(215) 356.2316