munich personal repec archive - uni-muenchen.de · munich personal repec archive ... forma annual...
TRANSCRIPT

MPRAMunich Personal RePEc Archive
A simulation model of corporatefinances: A study of the companies listedon Karachi stock exchange
Mehar Ayub
1998
Online at https://mpra.ub.uni-muenchen.de/443/MPRA Paper No. 443, posted 13 October 2006

1
A SIMULATION MODEL OF CORPORATE FINANCES:
A STUDY OF THE COMPANIES LISTED ON KARACHI STOCK EXCHANGE
BY
DR. AYUB MEHAR
DIRECTOR, KARACHI INSTITUTE OF ECONOMICS AND TECHNOLOGY
KARACHI (PAKISTAN) 1998
Address: B-98, Kehekshan Society, Malir Halt, Karachi 75210 (PAKISTAN). Phone: 4581196, 4582639 Fax: 4581196.
Email: [email protected]

2
A SIMULATION MODEL OF CORPORATE FINANCES:
A STUDY OF THE COMPANIES LISTED ON KARACHI STOCK EXCHANGE __________________________________________________________________________________________ JEL Classification Number: C15; C51; G30; G31; M41; Key Words: Simulation Modeling; 3SLS; Above the Line Profit; Generalized Accounting Principles; Predictive Power; Dividend Policy; ABSTRACT The study is a part of the series of financial models included in a doctoral dissertation completed at the Karachi University (Mehar: 1994). An Econometric model has been constructed in the study and a Three-Stage Least Square (3SLS) technique was applied for the estimation of the model. The results reveal some interesting observations. It has been found that both the components of equity financing - Paid up capital (OSCAP) and Reserves Funds (SURPLUS) - play a central role in the determination of the liquidity position of a firm. It has also been found that Debt Financing may be a cause of the deterioration in the liquidity position of a firm.
3
I. INTRODUCTION
Financial simulation models have become an important addition to the quantitative toolkit of the financial analysts, economists and corporate planners. They are particularly valuable for financial planning because they provide a consistent framework that simultaneously accounts for the entire interrelationship in a firm’s financial structure. By simulating the model into the future one can forecasts and analyze the effects of economic conditions and policies on the firm’s financial position, in alternative financial strategies. The models can be used to generate Pro-forma annual accounts i.e. the balance sheet and income statement that would apply in future under specific assumptions about Capitalization, Debts, Equity, Retained Earnings, Profits, Cash Balances, Receivables, Payables and Inventories etc.
A major advantage of simulation is to be able to handle complex problems that are impossible to solve via analytical approaches. In our study, only models of a mathematical and symbolic nature will be dealt with ones that can be computerized. The results from the computer program/ software can then be analyzed. An econometric model that does not produce forecasts of acceptable quality cannot be considered seriously as a model for the testing of economic hypothesis. Of course, econometricians assume that econometric predictions are reasonably reliable and they believe them to be also more accurate than predictions generated with alternative techniques. Any discrepancy between forecast and actual performance should be blamed on both model specification errors and erroneous a priori judgement regarding the values assigned to exogenous variables. The first type of error depends on econometricians’ ability in understanding the accounting process and techniques of modeling. In order to understand the second kind of error, we simply have to observe that when a forecaster start to construct the econometric model, he will have to decide which economic or financial phenomena the model will describe and which it will not. The phenomena which is not described (also called exogenous) are monetary and fiscal policies, agricultural output, and international environment (upon which firm has only limited impact). Although such economic variables remain exogenous, they will still appear in the model and therefore have to estimate one way or the other to allow the model to run. For any of the financial indicators wherein policy makers and managers are interested, the forecasters will identify and select those factors which are contributing to or explaining most of the indicators’ behavior or trend. In selecting such explicit factors the econometricians will rely on both statistical techniques and economic theories. Econometric techniques do not only help us in selecting the most significant explicit factors, they also determine numerically how each factor is actually contributing in explaining the behavior of the economic and financial indicators. These are the reason to apply an econometric based simulation modeling in financial analysis of the joint stock companies. By such a model one can study the real determinants of the financial structure of a listed company. In this study we constructed a model of corporate finances at firm level. The study is a part of the doctoral dissertation completed at the Karachi University (Mehar: 1994).
II. OBJECTIVES OF THE STUDY
The objective of the study is to design a simulation model for financial planning of joint stock companies under various conditions and scenarios. The objective of the model is to generate pro-forma financial statements that describe the financial condition of the firm for any assumed pattern of capital structure in the future. Particular attention has been paid to the determination of Short-term Borrowing, Cash Accounts, Credit Sales, Dividends, Fixed Assets and Additional Funds through Internal Equities.

4
All the major factors and components of the corporate finance, namely Sales Revenue (SALES), Equities (EQUITY), Paid up Capital (OSCAP), Reserves and Surplus Funds (SURPLUS), Accounts Receivables (DBTRS), Inventories (SLCTOCK), Short Term Financing (CURLIBL), Long Term Debts (LTDBT), Dividend Pay out (DIVEDN), Petty Cash and Bank Balances (LASST), have been included in the analysis. The constitutional and legal parameters of the Pakistan economy have also been incorporated. Within such a quantitative framework, even inadequate explanation point out the many gaps that have to be closed before we may processes further. Our simulation model may be used for the following purposes: -
1) Preparation of the Pro-forma Annual Accounts (Balance Sheet, Income Statement, Cash or Funds Flow Statement and the key indicators of the financial position).
2) Forecasting for the financial position of a firm (The liquidity and leverage position of a company).
3) Measurement of the impacts of Sales, Profit and Dividend on the Net Worth of a firm.
4) Quantification of the impacts of managerial decisions on the firm's financial position.
In Pakistan, the methodological issues in corporate finance have not received much attention. Ready-made formulae and ratio analysis are applied for the estimation of various ‘stochastic’ relationships. Here a gap has been observed between financial analysts and econometricians. The financial analysts have a little knowledge about the econometrics and applied economics. So they can not derive or modify the formulae according to the local requirements. Naqvi, Kemal and Rashid (1982), AERC (1988), Mehar (1992), and PIDE (1992) have applied econometric techniques in the construction of the simulation models. But, all of those studies are concerned with macroeconomics. They do not cover the financial modeling of the joint stock companies and the structure of corporate’ accounts. Surprisingly, PIDE (1992) and AERC (1988) did not include the corporate sector and financial market in their macro-econometric models. An attempt is made in the study to fill the vacuums.
III. REVIEW OF THE LITERATURE
In the literature of corporate finance, the use of simulation model is a relatively new development. There are a number of studies [(Brackus, Brainard and Tobin: 1980); (Robert and Philip : 1982); (Kramer, Moverick, Fase and Van : 1990); (Hughes : 1991); (Bandt and Jacquinot : 1992); (Gerald, Brald and Thomas : 1992) and (MEFISTOTE : 1992)] where simulations' models have been applied in the corporate finance. The estimation and application of financial models have been originated by the academicians, but now it is a fast growing area in the corporate world. The large corporations are hiring financial modelers as a part of the top-level financial management.
The studies on the corporate finance in Pakistan [(Barings: 1994); (Mehar: 1994); (Mehar and Salam: 1994); and (ASK Securities: 1994)] are based on the financial accounting and arithmetic calculations. While, the studies on the financial economics in Pakistan [(Bilgrami and Nishat : 1990); (Nishat and Saghir : 1991); (Mehar, Javed and Aijaz : 1992) and (Nishat and Saghir : 1992)] are focused on the regression analysis. Such studies, no doubt, provide useful information and analysis on the relationship between the economic and financial variables. However, they do not cover the legal, managerial and accounting aspects of the corporate finance.
This study is based on the assumption that financial variables in a balance sheet and income statement have a circular relationship and a firm can not change the magnitude of a variable without affecting the others. So, the model deviates from the traditional theories of limited impacts. The relationship among the variables has been presented in figure: 1.

5
In the literature of corporate finance, many capital structure models are based on the assumptions that managers of large corporations always act in the shareholders’ interests (e.g., Modigliani and Miller, the static trade-off theory, and the pecking order theory). The theory of optimal capital structure has been hotly debated since the irrelevance and tax shield propositions of Modigliani and Miller (1958, 1963). The using agency theory, on the other hand, identifying situations in which managers may deviate from value maximizing financing decisions and pursue their own self interest (Jenson and Mecking: 1976). The argument rests of the assumption that managers who are responsible for financial decisions are unable to diversify their human capital (Fama: 1970). According to the agency theory, incentive compensation schemes, direct equity ownership (Jensen and Mackling : 1976) and monitoring by the Board of Directors (Fama and Jensen : 1973) and major shareholders (Sheilfer and Vishny: 1986), mitigate the incentive conflict between managers and shareholders.
Jensen and Macling (1976), see the modern corporation as a nexus of contracts. They suggest that the firm’s ownership structure, executive compensation, and control mechanisms are interrelated. Subsequent theoretical research reinforces such a link. Ross (1977) presents a model for an optimal capital structure to maximize managers' wealth.
It is concluded in the various studies that corporate investment, dividend, compensation and financial policies are interrelated and the debt & equity are alternative “Governance Structures” rather than just “Financial Structures”. A firm with higher asset specificity will find debt financing very expensive. Williamson (1988) also suggests that the board of directors’ acts not only to monitor the management team, but also “as a way by which to reduce the cost of capital for projects that involve limited redeployability”.
Debt may also impose costs on the firm. [(Lintenberger and Horne : 1978); (Scott : 1977); (Kim : 1978)and (Smith : 1980)]. A number of agency costs associated with debt have also been identified. Such costs are associated with claim dilution (Fama and Miller: 1972) and under investment (Myers: 1977).
A noted agency cost is the conflict between managers and shareholders due to financing decisions. Such conflict could arise as a result of differential in risk exposure. Shareholders may care only about the systematic risk of a firm’s security because they hold well-diversified portfolios. Managers, on the other hand, may be more concerned with the firm’s total risk.
Although, agency theory recognizes the conflict between managers and shareholders, it also identifies some potential solutions to the problem of risk aversion. First, compensation contracts can be designed so they relate managers’ compensation to their performance (Holmstrom: 1982). Haugen (1991) and Smith and Watts (1992) have argued that stock options may motivate managers to increase the firm’s risk. Smith and Watts (1922) also argue that executive action planes control the under leverage problem. According to the authors, managers have incentives to increase the firm’s leverage as the percentage of their compensation in unexercised stock options increases. However, the reverse could also be true. Second, direct managerial equity investment makes the interests of managers and shareholders more compatible (Jensen and Meckling: 1976).
Shareholders expects to the board who are not under the control of the chief executive officer (CEO), can monitor managers more effectively (Fama and Jensen: 1973). Monitoring by outside board members, supported by Morck, Shleifer and Vishny (1988) may improve the financial structure of the firm. In addition, by concentrating ownership, shareholders can monitor the management team more effectively (Shleifer and Vishny : 1986). The empirical work provides indirect support for the argument that ownership concentration creates stronger incentives to monitor managers (Brickley, Lease and Smith : 1988).
There is also large literature on the role of the stock market in the efficient allocation of risk [(Arrow : 1964); (Leland : 1978) and (Hirshleifer : 1972)]. But, relatively less work on its roll in
6
guiding investment in corporations. However, there are two strands of literature that do link stock prices and investment decisions: q-theory in Economics and capital budgeting in Finance.
Although, there are differences among the models, these are all consistent with the conclusion that leverage is not only an outcome of the governance and incentive structure of the firm, but also a part of that structure.
Hill (1987) developed a model of shares’ valuation. Model consists of four simultaneous equations. According to him equity capitalization rate depends on ‘Risk element’ and ‘Return on shareholders wealth’. By and large it was a modification of capital assets’ pricing model (CAPM). Moreover, Jensen and Meckling (1976), suggest that managerial equity investment is an important determinant of the firm’s capital structure. On one hand, as manager’s stock in the firm rise, higher leverage becomes more attractive, since leverage increases the share price and thus the value of the managers’ holdings. On the other hand, at sufficiently high levels of ownership, managers are unlikely to hold a well-diversified portfolio and increase in leverage can impose a high cost on their human capital. Therefore, they may reduce the risk of the firm (Smith: 1987). If risk is reduced by under leveraging, we might observe an inverse relationship between leverage and managerial ownership beyond some level.
IV. THE DATA AND VARIABLES A) FINANCIAL ACCOUNTING ASPECTS OF THE MODEL. We adopted an econometric approach in this study. However, it is useful to recall the main insight of financial accounting on which the most of the corporate finances’ models are based. The accounting and the economic approaches in the literature are differed fundamentally. The accounting studies focus attention on the preparation of the flow of funds (where from funds comes and where to go). While attention in the economic theories are paid on the behavior of investors and managers; that why funds from come and why to go. Consequently, those studies on answering various questions that are not addressed by the accounting literature. The Generally Accepted Accounting Policies have been followed in the study and the standard accounting definitions and formats have been adopted for the presentation of variables in the financial statements.
Various companies have different accounting policies. Particularly in Depreciation Accounting, Inventories Valuation and Bad Debts Estimates, policies may be significantly differed. We adopted a methodology where effects of accounting policies have been minimized. Moreover, we converted all the accounts into a “Uniform Accounting System”. The structure of the complete model may be seen in figure: 3. However, from the accounting point of view model may be categorized in the following four blocks: (a) Balance sheet ---- Debit side.
The following variables are included: - 1) Liquid Assets (LASST): Petty Cash Accounts, Bank's Balance and Short-term Investment in
portfolios and Commercial Papers are included in those assets. All the heads of accounts, which can be, shortly and easily converted into cash, have been, defined as Liquid Assets.
2) Accounts Receivables (DBTRS): They cover Sundry Debtors, Bills Receivable, Pre-paid
Expenses and Accrued Income. This head of accounts covers Trade Debtors mainly, but Pre Paid Expenses and Accrued Income have also been included in the head. It is net of bad and doubtful debts.

7
3) Closing Inventories (CLSTOCK): The ending stock of Finished Goods, Work-in-Progress and Raw Materials are included in this account. All the inventories are based on the first-in-first-out (FIFO) method of cost accounting.
4) Current Assets (TCRASST): Total Current Assets are the sum of Liquid Assets and Non-
Liquid Assets (Accounts Receivables and Closing inventories). 5) Fixed Assets at Cost (FASSTC): We are taking all of Fixed Assets at their historical value.
For the uniformity in accounting policy, we applied the Reserves Fund Method for Depreciation Accounting. The Assets are appeared in the financial statements at their historical value, while Accumulated Depreciation Fund Account has been created at the credit side of the balance sheet.
6) Total Assets and Properties (TOTASST) : This shows the amount in the footing of a
balance sheet. It is the summation of total investment at book value.
(b) Balance sheet ---- Credit side.
On the credit side, we categorized the liabilities and equities in the following heads: - 1) Paid up Capital (OSCAP): It indicates the Ordinary Shares issued by a company. It is
notable that partly paid shares can not be subscribed in Pakistan. So, only fully paid shares have been included in the ordinary share's capital. Paid up capital consists of Initial Public Offering, Sponsors’ Equity and Right or Bonus issued in the past.
2) Surplus and Reserves Funds (SURPLUS): It is the summation of the outstanding balances
in the ledgers of those accounts, which have been created at below the line. Such accounts may have different accounting titles like Capital Reserve Account, Dividend Equilibrium Fund, Contingent Liabilities, Retained Earnings, Un-appropriated Profit, Statuary Reserve Account etc. According to our definition, the outstanding and unpaid balances of below the line income are considered as a Surplus and Reserve Fund (SURPLUS). Shares Premium Account, Preliminary Expenditures and all of those accounts for which, the Board of Directors has discretionary powers are included in this head.
3) Equity (EQUITY): It is the summation of paid up capital (OSCAP) and Surplus and
Reserves Fund (SURPLUS). It indicates the Owners’ Equity or Net Worth of a company. 4) Accumulated Depreciation Fund (ACMDEP): It shows the balance in the Depreciation
Fund of Fixed Assets. Depreciation is a permissible expenditure in tax accounting and its accounting has legal dimensions. So, Depreciation Fund can not be a part of the equity. However, some time accounting depreciation may be greater than tax depreciation. This excess depreciation would be a part of the directors' discretion (Lee Vs. Neuchatel Asphalete Co: 1889). But, for simplification we have assumed that Depreciation expenditures are provided at above the line.
5) Long Term Debt (LTDBT): This is a broad category of liabilities. In this head, all those
financing have been included which can not be considered as Equity Financing or Current Liabilities. So, the head covers Borrowing from Financial Institutions, Bonds or Debentures issued by a company, Internally Generated Funds at above the line profits (e.g. Pension Funds; Gratuity; Depreciation Fund etc.) and Preference Share Capital. Because, Preference Shareholders are not the owners of a company (Bond Vs Barrow Hoemalite Steel Co.: 1902).
6) Employed Capital (CAPITAL): This is the aggregate amount of Equity and Long-term
Debts.

8
7) Current Liabilities (CURLIBL): This source of finance represents the Short- term Payables. It covers Sundry Creditors (Accounts Payables), Bills (or Notes) Payables, Unearned income and Outstanding expenditures etc.
8) Total Equity and Liabilities (TOTLIBL): It is the amount in the footing of a balance sheet,
on credit side. (c) Appropriation of Profit and Loss Accounts.
The following have been included in the third block of variables: -
1) Sales Revenue (SALES) : They indicate the Annual Revenue from business activities of a company.
2) Cost of Goods Sold (CGS): It represents the direct expenditure involved in the Cost of
Goods sold. They have been extracted from the trading accounts of the companies. 3) Net Profit before Tax (NPBT): It is the difference between the total income and total
expenditures. A negative net profit indicates net loss. The cost of goods sold, administrative expenditures, financial expenses and the selling and distributions expenses are included in total expenditures. Similarly, operating and non-operating incomes are included in the total income.
4) Provision for Income Tax (TXPROV): It shows the estimated tax liability for the current
year. Its estimation does not depend on accounting policies only but legal requirements are also a major factor of the estimation.
5) Net Profit after Tax (NPAT): It is the Divisible Profit from the current year’s income. The
directors have discretionary powers to use this profit for the business enhancement. The decision regarding the distribution or retention of this profit is made in the annual general meeting of a company.
6) Dividend (DIVEDN): The variable shows the Dividend declared out of Profit or Reserves
and Surplus Account of a company. It is a below the line account and depends on the director’s discretion, subject to the Companies Ordinance 1984 and the Securities and Exchange Ordinance 1969.
7) Retained Earnings (RTNTN): This is the residual of net profit after tax and dividend
payments. It may consist of the different heads of accounts.
(d) Key Ratios and Indicators.
Following key ratios and performance indicators have also been introduced in the simulation and projections to show the financial position of a company under various policies: - 1) Cash Flow (CFLOW): This is the difference between the amount of Cash shown in the last
and the present year's balance sheet. The Cash Flow can also be extracted from the Cash book of a company.
2) Net Current Assets (NCRASST): This indicates the working capital of a company. It is
applied to measure the solvency position of a firm. 3) Change in the Capital (CHCAP): The variable shows the change in the employed capital
over the last year. In fact, it is the real investment in a company in economic term. 4) Acid Test Ratio (ACIDTST): This is an indicator of the liquidity position. It shows the
availability of Liquid Assets for the repayments of Short-term Debts.
9
5) Current Ratio (CRNTR): It is also an indicator to measure the solvency of a firm. Basically it is the ratio of Current Assets to Current Liabilities. The ratio is also recommended by the State Bank of Pakistan, in the prudential regulations to measure the liquidity position of a firm.
6) Average Rate of Depreciation (DEPRAT): It means weighted average rate of depreciation.
It is calculated through the division of the Annual Depreciation Cost by the Historical Value of the Foxed Assets.
7) Dividend to Equity Ratio (DIVTOEQ): It is the rate of return on equity at book value. It is
net of retention. 8) Dividend Yield (DYIELD): It is the rate of return on equity at market value. So to say, it is
the rate of return to the shareholders from the company. 9) Gearing Ratio (GEARING): This is one of the famous measures of debt position. This ratio
shows the percentage of debt in employed capital of a firm. 10) Leverage Ratio (LEVRG): Basically it is the debt-equity ratio. A higher leverage ratio leads
to higher chances of the bankruptcy. 11) Pay out Ratio (PAYRTO): It is the percentage of profit declared as dividend. In fact, it
shows how much profit has distributed among the shareholders and how much retained for investment.
12) Retention ratio (RTNRTO): It is the residual of pay out ratio. This shows the percentage of
profit retained for reinvestment in the company. 13) Self-Financing Rate (SFINRT): It is calculated through the division of Retained Earnings by
the Change in Capital. It shows that how much investment (addition in the employed capital) is being generated by the internal resources of a company.
14) Valuation Ratio (VRATIO): This is a ratio between market value (market capitalization) and
book value of a firm. A higher valuation ratio indicates a good reputation of a company in the secondary market.
The above mentioned variables have been summarized in table: 1. While, figure: 1 shows a simplified picture of the interrelationship between the variables. B) THE DESCRIPTION OF THE DATA
The model has been estimated through the pooled data of annual audited accounts of 225 companies listed on the Karachi Stock Exchange. These accounts cover the period of 1980 to 1994 giving us 3375 observations (225 companies and 15 years). The data have been obtained from a variety of sources, depending upon the definitions and the nature of the variables. A large data on different variables have been extracted from the annual reports of the listed companies. However, the data for some variables have also been extracted from various issues of the Pakistan Economic Survey (Government of Pakistan: 1996, 1988, 1986, 1982), the Budget in Brief (Various years), the Explanatory Memorandum of the Budget (various years), and Annual Reports of the State Bank of Pakistan (State Bank of Pakistan: 1995-96, 19990-91, 1986-87, 1982-83). All the variables are in million of rupees except D2, D6, D7 and TIME which are the dummy and trend variables. Those variables have been defined in table: 2. While, their economic justifications have been discussed in the next section. ‘Time’ is a trend variable, taking 1980 as 1 and so on. The description and abbreviated names of the variables are listed in table: 2.

10
C) THE INDUSTRIAL BACKGROUND OF THE COMPANIES .
The analysis covers the eight important sectors of the Pakistan Industry. The companies are classified on the basis of their products. The following are a brief description of the sectors, which have been included in the analysis: (a) Textile Sector. Eighty-nine companies are belonged to this sector. Two out of them belong to the public sector. Companies in this sector have large variation in the size of capital. The majority of the companies are working at small scale in relative term, but some belong to the leading industrial groups. For example, Kohinoor Industries (Saehgal group), Crescent Textile (Crescent group), Dewan Textile (Dewan group), Saphire Fibres (Nishat/ Mansha group) etc are included in the leading groups of companies. The sector covers the spinning, weaving and composite units of the textile industry. (b) Chemical and Pharmaceutical Sector. This is a capital-intensive sector of the industry. Almost, all of the companies in the sector belong to the multinational corporations. The local subsidiaries of the multinational corporations are listed and registered in Pakistan. Their products have been classified into three groups namely A, B, and C. Those Groups have been formed by the Ministry of Health, on the bases of the importance of a product for health. Group ‘A’ indicates the life saving drugs. The Ministry of Health controls the prices of those products. The Cost of Production in the industry depends on the imported raw material largely from the parent companies. So, pricing policies of the parent companies play an important role in determination of the Cost of Production. The Research and Development Expenditure is another major cost of companies in the sector. (c) Engineering Sector. This is also a capital-intensive sector. One-third companies of the sector belong to the public sector. It is relatively a small sector, from the number of companies’ point of view. (d) Sugar and Allied Product Sector. This is a seasonal industry in Pakistan. Its raw material has to be acquired before the starting of a production or sales cycle. To, maintain the current ratio and a positive working capital is a difficult task for companies in the sector. Companies in the sector also earn some profits through the various by-products. (e) Paper, Printing and Allied Products. Nine out of ten companies in the sector belong to the private sector. Most of the companies in the sector belong to the big industrialist groups of Pakistan. (f) Cement Sector. It is one of the highly capital intensive industry. Although, now, more than 15 companies have been listed but due to the constraint of time-series in our pooled data only 5 companies have been included in this sector. Energy is the most important input in the production of cement. Companies in this sector are applying two different type of production process (Wet process and Dry process). Transport and Packaging is another important element of the cost in this sector. Due to the physical nature of the product, its transportation and packaging is one of the main components of the cost of goods sold. Due to rush delivery and shortage of cement in the country, cement is sold on cash on delivery (COD) or cash before delivery (CBD) basis. So, companies in this sector have good liquidity position.
(g) Fuel and Energy Sector. The majority of the companies in this industry belong to public sector. However, now, government is encouraging to private investment in this sector. Companies in the sector can be classified into fuel and energy sections. Pakistan State Oil (PSO), Karachi Electric Supply Corporation (KESC), Sui-Southern Gas Company (SSGC) and Sui-Northern Gas Company (SNGC) are the important names in the sector. The Collection of cash at spot in fuel sector and cash from the monthly billing
11
for energy consumption determine the liquidity position of the companies. This is the answer that why companies in this sector have higher cash balances. Not only Petty Cash and Bank Balances of those companies should be higher but Cash disbursement requirements are also higher for those companies. They have to pay the cost of their inputs to the Pakistan National Refinery and Oil and Gas Development Authority. So, the higher cash balances do not imply the excess cash balance.
(h) Others Product’s Sector. This is a broad category of the listed companies. Foods, Transportation, Services, and the all other companies are included in this sector. From the organizational set up point of view, the companies have been classified into public and private sectors.

12
TABLE : 1 LIST OF ACCOUNTING VARIABLES
SR. NO DESCRIPTION OF VARIABLE Balance Sheet ------ Assets (Debit) Side
1 Cash and bank accounts (CASH) 2 Short term investment (INVST) 3 Liquid assets (LASST) 4 Accounts receivables (DEBTRS) 5 Closing inventories (CLSTOCK) 6 Total current assets (TCRASST) 7 Fixed assets at historical cost (FASSTC) 8 Total assets and properties (TOTASST)
Balance Sheet ------ Liabilities (Credit) Side 1 Ordinary shares capital (OSCAP) 2 Reserves and surplus funds (SURPLUS) 3 Shareholders’ equity (EQUITY) 4 Accumulated depreciation funds (ACMDEP) 5 Preference shares capital (PSCAP) 6 Bonds / debentures (DBNTUR) 7 Other fixed liabilities (OFXDLIB) 8 Total Fixed liabilities (LTDEBT) 9 Employed capital (CAPITAL) 10 Current Liabilities (CURLIBL) 11 Total liabilities (TOTLIBL)
Trading, Profit and Loss Accounts 1 Sales revenue (SALES) 2 Opening inventory (OPSTOCK) 3 Cost of production (CSTPRD) 4 Closing inventory (CLSTOCK) 5 Cost of goods sold (CGS) 6 Gross profit (GP) 7 Operating expenditures (EXPENS) 8 Operating income (INCOM) 9 Depreciation for the year (DEPRCT) 10 Other revenue (OINCOM) 11 Net profit before tax (NPBFTX)
Distribution of Profit and Flow of Funds 1 Provision for corporate tax (TXPROV) 2 Net profit after tax (NPAFTX) 3 Dividend declared for the year (DIVDND) 4 Bonus shares issued (BNSSHR) 5 Retention / retained earnings (RTNTN)
Financial Indicators and Key Ratios ------ Stock Concept 1 Cash Flow (CFLOW) 2 Net current assets (NCRASST) 3 Change in capital (CHCAP) 4 Acid test ratio (ACIDTST) 5 Current Ratio (CRNTR) 6 Average Rate of Depreciation (DEPRAT) 7 Dividend to equity Ratio (DIVTOEQ) 8 Dividend yield (DYIELD) 9 Gearing ratio (GEARING) 10 Leverage ratio (LEVRG) 11 Pay-out ratio (PAYRTO) 12 Retention ratio (RTNRTO) 13 Self-financing rate (SFINRT) 14 Valuation ratio (VRATIO)

13
FIGURE 1 THE SIMULTANEITY IN THE FINANCIAL STRUCTURE OF A FIRM
POLICY VARIABLES SYSTEM VARIABLES ACCOUNTING VARIABLES (Exogenous ) (Endogenous by Behavioral Equations) (Endogenous by Identities)
Time / Trend
Variable
Legal Structur
e
Industrial
Sector
Inputs’ Prices
Non-Operating
Income
Shares Held by
the
Paid-up Capital
Dividend Announce
ment
Bonds / Debentur
Cost of Production
Sales Revenue
Operating Expenditu
res
Depreciation Fixed
Assets at Cost
Closing Inventory
Accounts Receivables
Petty Cash and Bank Balance
Dividend Bonus Issue
Reserve Funds
and Surplus Current
Liabilities
Gross Profit
Net Profit before
Tax
Direct Taxes
Profit After Tax
Retention
Change in Capital
Employed Capital
Equity
Return on Equity
Funds’ Flow
Cash Flow
Accum-ulated Depre-ciation
Net Current Assets
Total Current Assets
Total Assets

14
TABLE: 2
DESCRIPTION OF THE VARIABLES
SR. NO.
VARIABLE DESCRIPTION
(A) SYSTEM VARIABLES : ENDOGENOUS BY BEHAVIORAL EQUATIONS.
1 CLSTOCK Value of merchandize inventories at closing date. 2 CURLIBL Current liabilities. 3 DEBTRS Accounts receivables including bills/ notes receivables and pre
paid expenses. 4 DIVIDEN Amount of dividend declared 5 FASSTC Fixed assets at cost 6 LASST Balance of petty cash plus bank accounts (liquid assets)
(B) ACCOUNTING VARIABLES : ENDOGENOUS BY IDENTITIES.
7 ACMDEP Accumulated depreciation 8 CAPITAL Equities plus fixed (long term) liabilities 9 CFLOW Cash flow as per cash flow statement 10 CHCAP Change in capital 11 EQUITY Shareholders’ equity 12 NCRASST Net current assets 13 NPAFTX Net profit after tax 14 OSCAP Ordinary shares (paid up) capital. 15 RIGHT New issues in the form of right shares 16 RTNTN Retention / Retained earnings 17 SURPLUS Outstanding balance of retained earnings (surplus and reserves
funds) 18 TCRASST Total current assets 19 TOTASST Total assets and properties (footing of balance sheet) 20 TOTLIBL Total equity and liabilities (footing of balance sheet)
(C) FINANCIAL RATIOS AND KEY INDICATORS
21 ACIDTST Acid test ratio 22 CRNTR Current ratio 23 DEPRAT Average depreciation rate 24 DIVTOEQ Dividend on equity 25 DYIELD Dividend yield 26 GEARING Gearing ratio 27 LEVRG Leverage ratio 28 PAYRTO Pay out ratio 29 RTNRTO Retention ratio 30 SFINRT Self-financing rate 31 VRATIO Valuation ratio
15
DESCRIPTION OF THE VARIABLES
SR. NO.
VARIABLE DESCRIPTION
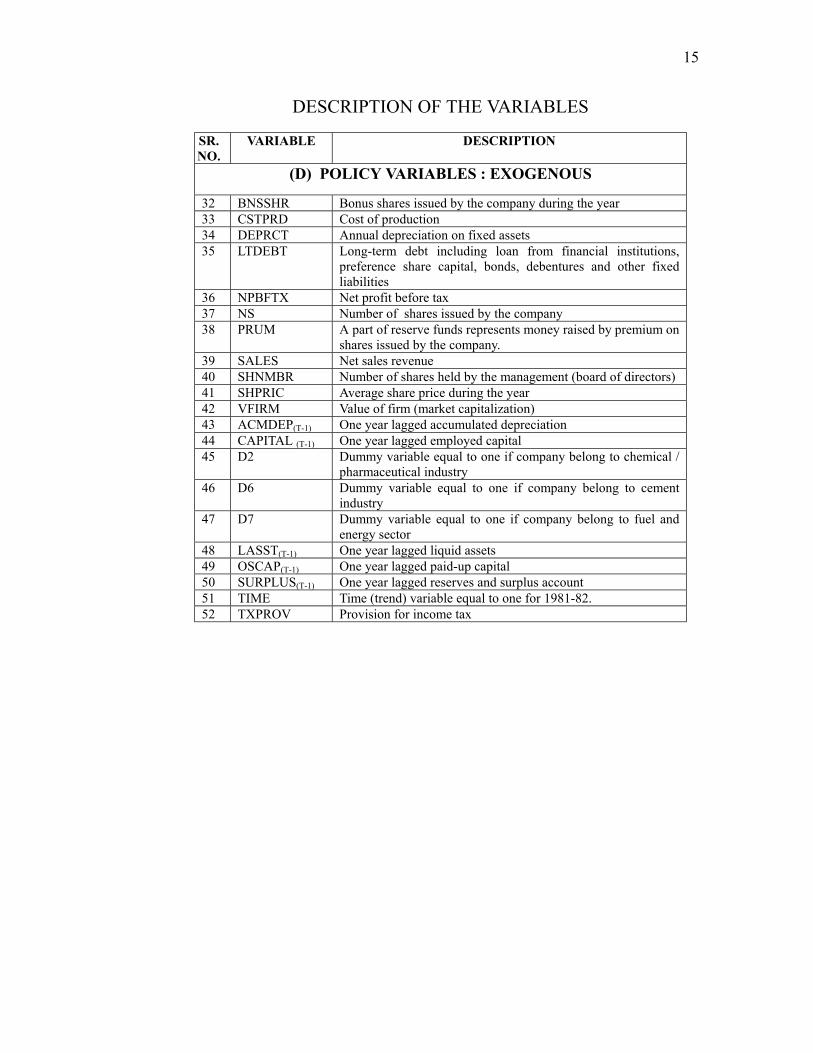
(D) POLICY VARIABLES : EXOGENOUS
32 BNSSHR Bonus shares issued by the company during the year 33 CSTPRD Cost of production 34 DEPRCT Annual depreciation on fixed assets 35 LTDEBT Long-term debt including loan from financial institutions,
preference share capital, bonds, debentures and other fixed liabilities
36 NPBFTX Net profit before tax 37 NS Number of shares issued by the company 38 PRUM A part of reserve funds represents money raised by premium on
shares issued by the company. 39 SALES Net sales revenue 40 SHNMBR Number of shares held by the management (board of directors) 41 SHPRIC Average share price during the year 42 VFIRM Value of firm (market capitalization) 43 ACMDEP(T-1) One year lagged accumulated depreciation 44 CAPITAL (T-1) One year lagged employed capital 45 D2 Dummy variable equal to one if company belong to chemical /
pharmaceutical industry 46 D6 Dummy variable equal to one if company belong to cement
industry 47 D7 Dummy variable equal to one if company belong to fuel and
energy sector 48 LASST(T-1) One year lagged liquid assets 49 OSCAP(T-1) One year lagged paid-up capital 50 SURPLUS(T-1) One year lagged reserves and surplus account 51 TIME Time (trend) variable equal to one for 1981-82. 52 TXPROV Provision for income tax

16
FIGURE: 2
SPECIFICATION OF THE MODEL No. Explained Variable Explanatory Variables Expected
Sign 1. Liquid Assets Fixed Asset at Historical Cost + Net Profit After Tax + Retained Earnings - Special Characteristics of Cement Industry + Special Characteristics of Fuel and Energy
Sector +
2. Accounts Receivables Sales Revenue + Short-term Liabilities + Reserve and Surplus Funds + Cost of Production - Liquid Assets - Depreciation - 3. Closing Inventories Sales Revenue + Accounts Receivables - Time / Trend Variable + 4. Fixed Assets at Historical
Cost Total Current Assets
-
Short-term Liabilities + Paid up Capital + Reserve and Surplus Funds + Net Profit After Tax + 5. Short-term Liabilities Liquid Assets + Accounts Receivables + Closing Inventories + Fixed Assets at Historical Cost + Paid-up Capital - Reserve and Surplus Funds - Accumulated Depreciation - Net Profit Before Tax - Cash Flow - 6. Dividend Net Profit After Tax + Net Current Assets + Bonus Shares - Tax Provision - Shares Held by the Directors + Special Characteristics of Pharmaceutical and
Chemical Industry +
17
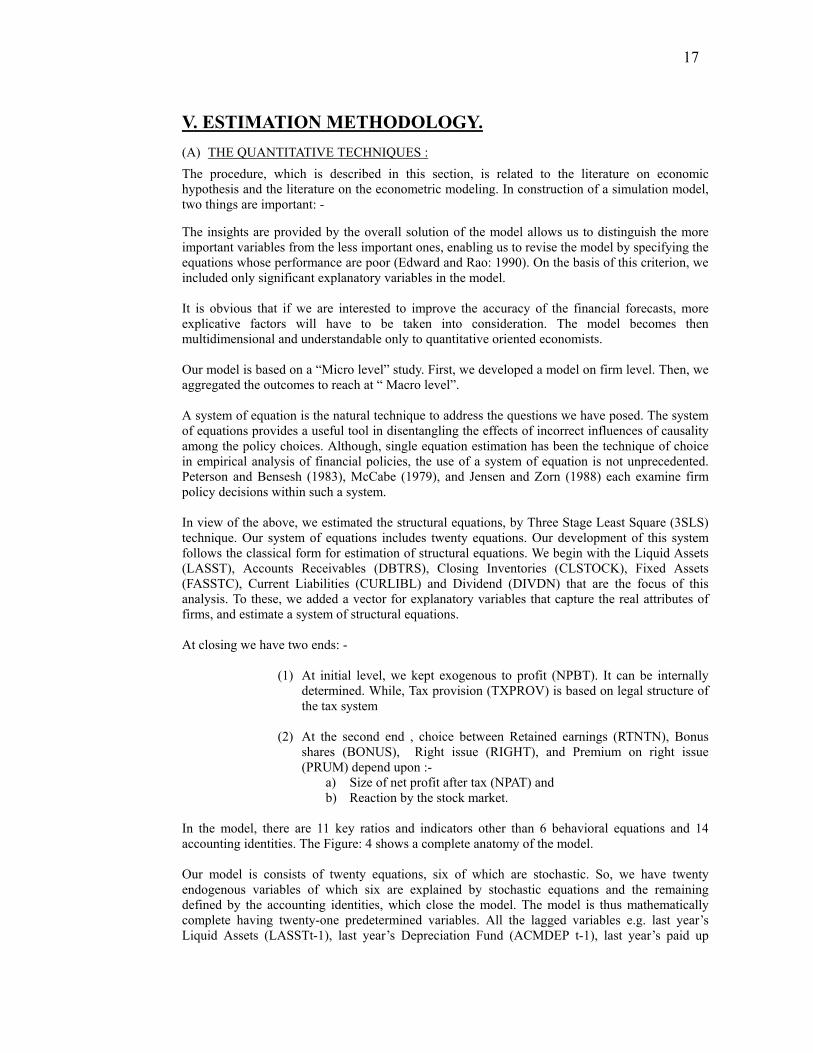
V. ESTIMATION METHODOLOGY. (A) THE QUANTITATIVE TECHNIQUES :
The procedure, which is described in this section, is related to the literature on economic hypothesis and the literature on the econometric modeling. In construction of a simulation model, two things are important: - The insights are provided by the overall solution of the model allows us to distinguish the more important variables from the less important ones, enabling us to revise the model by specifying the equations whose performance are poor (Edward and Rao: 1990). On the basis of this criterion, we included only significant explanatory variables in the model. It is obvious that if we are interested to improve the accuracy of the financial forecasts, more explicative factors will have to be taken into consideration. The model becomes then multidimensional and understandable only to quantitative oriented economists. Our model is based on a “Micro level” study. First, we developed a model on firm level. Then, we aggregated the outcomes to reach at “ Macro level”. A system of equation is the natural technique to address the questions we have posed. The system of equations provides a useful tool in disentangling the effects of incorrect influences of causality among the policy choices. Although, single equation estimation has been the technique of choice in empirical analysis of financial policies, the use of a system of equation is not unprecedented. Peterson and Bensesh (1983), McCabe (1979), and Jensen and Zorn (1988) each examine firm policy decisions within such a system. In view of the above, we estimated the structural equations, by Three Stage Least Square (3SLS) technique. Our system of equations includes twenty equations. Our development of this system follows the classical form for estimation of structural equations. We begin with the Liquid Assets (LASST), Accounts Receivables (DBTRS), Closing Inventories (CLSTOCK), Fixed Assets (FASSTC), Current Liabilities (CURLIBL) and Dividend (DIVDN) that are the focus of this analysis. To these, we added a vector for explanatory variables that capture the real attributes of firms, and estimate a system of structural equations. At closing we have two ends: -
(1) At initial level, we kept exogenous to profit (NPBT). It can be internally determined. While, Tax provision (TXPROV) is based on legal structure of the tax system
(2) At the second end , choice between Retained earnings (RTNTN), Bonus
shares (BONUS), Right issue (RIGHT), and Premium on right issue (PRUM) depend upon :-
a) Size of net profit after tax (NPAT) and b) Reaction by the stock market.
In the model, there are 11 key ratios and indicators other than 6 behavioral equations and 14 accounting identities. The Figure: 4 shows a complete anatomy of the model. Our model is consists of twenty equations, six of which are stochastic. So, we have twenty endogenous variables of which six are explained by stochastic equations and the remaining defined by the accounting identities, which close the model. The model is thus mathematically complete having twenty-one predetermined variables. All the lagged variables e.g. last year’s Liquid Assets (LASSTt-1), last year’s Depreciation Fund (ACMDEP t-1), last year’s paid up

18
capital (OSCAP t-1), last year’s Reserves and Surplus (SURPLUS t-1), and trend variable (TIME) are treated as exogenous variables. B) THE MODEL SPECIFICATION:
An econometric model of financial planning is often a mixture of accounting framework and economic theories. Financial economists provided theoretical background for the model in different studies. We have merged the various functional approaches within a complete simulation model, which finds its statistical base in an accounting framework as presented in figure: 3. One of the properties of the model is that managerial and legal parameters - in the context of Pakistan - have been incorporated in the simulations. This implies that the estimates and forecasts can be simulated in realistic scenarios. The specifications of the individual equations are briefly discussed as follows: -
(a) Liquid Assets (LASSTS). The first equation of the model explains the volume of the Liquid Assets (LASSTS) in a Balance Sheet. Petty Cash, Short-term Investment and Bank Balance are the components of the Liquid Assets (LASSTS). There are three major determinants of Liquid Assets (LASSTS):
(a) Fixed Assets at their historical value (FASSTC): A higher value of fixed assets (FASSTC) always requires a higher value of Liquid Assets (LASSTS). Bandt and Pascal (1992) found a positive correlation between Capital and Cash Flow. (By definition, Cash Flow is the Change in Liquid Assets). According to our hypothesis Liquid Assets are positively correlated with Fixed Assets. An increase in the Fixed Assets will lead to the increase in Depreciation Expenditure, so, availability of the funds will be increased without a decline in the Cash Balance.
(b) Retained Earnings (RTNTN): They also determine the Liquid
Assets (LASSTS). It is commonly observed that higher retention leads to increase in the Cash Balance with a credit balance in Surplus and Reserve Fund (SURPLUS). The retention shows that firm has a positive profit but it is not disbursing the profit. So, the Cash Earning will not go out from the company. In fact, Depreciation (DEPRCT) plays a role to decrease Cash Outflow at above the line and the Retained Earnings (RTNTN) decrease the outflow of cash at below the line.
(c) Net Profit after Tax (NPAT): It also plays an important role in the
determination of Liquid Assets (LASSTS) of a company. It is generally thought that profit and liquidity have significant positive correlation.
Besides those three explanatory variables, two dummy variables have also been incorporated to capture the impacts of the Cash Flow patterns of the Cement Industry (D6) and the Energy sector (D7). (b) Accounts and Notes Receivables (DBTRS) . It has been hypothesized that Reserves Fund and Surplus (SURPLUS), Short-term Liabilities (CURLIBL), Liquid Assets (LASST) and Sales Revenue (SALES) have direct relationship with the Receivables from Debtors (DBTRS). All of those variables lead the improvement in liquidity position of a firm; while, a good liquidity position leads a soft policy for sales on credit. Mian and Smith (1972) included Sales Revenue (SALES) in the equation of the Receivables from Debtors (DBTRS) as a proxy of market power.

19
It is also commonly intuitive that addition in the Cost of Production (CSTPRD) and Depreciation Expenditures (DEPRCT) leads the lower sale on credit. So, they also have been taken as independent variables.
(c) Closing Inventories (CLSTOCK). Mats, Cury, Frank and Khan (1982) estimated that Inventories in balance sheet cover one third of the total assets’ value. However, the specification of the Closing Inventories (CLSTOCK) is not a simple task. Traditional studies in cost accounting recommend Economic Order Quantity (EOQ), and Buffer Stock techniques. Such techniques are based on the assumption that sales volume is be equal to the production volume. So, it is hypothesized that Closing Inventories (CLSTOCK) depend on Sale Volume (SALES) largely. A higher amount of sales (SALES) implies a higher volume of Closing Inventories (CLSTOCK). It is also hypothesized that the Receivable from Debtors (DBTRS) is a substitute of Closing Inventories (CLSTOCK). So, in the presence of a higher amount of Receivables (DBTRS) the volume of Closing Inventories (CLSTOCK) should be lower. Moreover, time (TIME) is a most important factor of the Closing Inventories (CLSTOCK). Time indicates the addition in the value of Inventories (CLSTOCK) over the years. This also incorporates the effects of the improvement in Inventory Management, Storage Facilities, Buffer Stock Estimation and Economic Order Quantity (EOQ) levels.
(d) Fixed Assets at Historical Cost (FASSTC). Some important and interesting aspects of the equation of Fixed Assets at Historical Cost (FASSTC) will be discussed in the next section. The explanatory variables of the Fixed Assets (FASSTC) are Paid up Capital (OSCAP), Reserves and Surplus Fund (SURPLUS), Total Current Assets (TCRASST), Net Profit after Tax (NPAT) and Current Liabilities (CURLIBL). Equities (OSCAP plus SURPLUS) are obviously one of the most influential factors of the acquisition of Fixed Assets. So, its inclusion in the model is obvious. A higher magnitude of Current Assets (TCRASST) may be a cause of lower investment in Fixed Assets (FASSTC), because, total financing will be distributed between the two categories of assets.
(e) Short Term Liabilities (CURLIBL). It is hypothesized that Short-term Financing depends on the equity capital of a firm (EQUITY). The equity financing is higher, the short-term financing will be lower. The payments of Staff Salaries, Utility Bills, Bills of the vendors and the suppliers of raw material etc. will not be delayed if a firm has a higher equity. However, to isolate the effects of Paid up Capital (OSCAP) and Reserves and Surplus Fund (SURPLUS), both the variables have been included individually. Depreciation Fund (ACMDEP) is also a source of financing. So, it may be a substitute of the Short-term Financing (CURLIBL). The components of the Current Assets - Liquid Assets (LASSTS), Receivables from Debtors (DBTRS) and Closing Inventories (CLSTOCK) - may also be a cause of the change in the Current Liabilities (CURLIBL), because of management decision to maintain the Current Ratio or Working Capital level. If, a firm want to maintain a higher value of Liquid Assets (LASSTS) the Current Liabilities (CURLIBL) may also be increased. Moreover, a positive relation between the Current Liabilities (CURLIBL) and Receivables from Debtors (DBTRS) is commonly viewed; Because, a large Sales on Credit will tight the liquidity potential of a firm. As a result, firm will has to purchase the inputs on credit basis. Similarly, Cash Flow (CFLOW) is a phenomenon of Liquidity Position. If Cash Flow (CFLOW) increases, the Current Liabilities (CURLIBL) will decrease. It is also hypothesized that Fixed Assets (FASSTC) will lead to increase in Short- term Financing (CURLIBL).
20
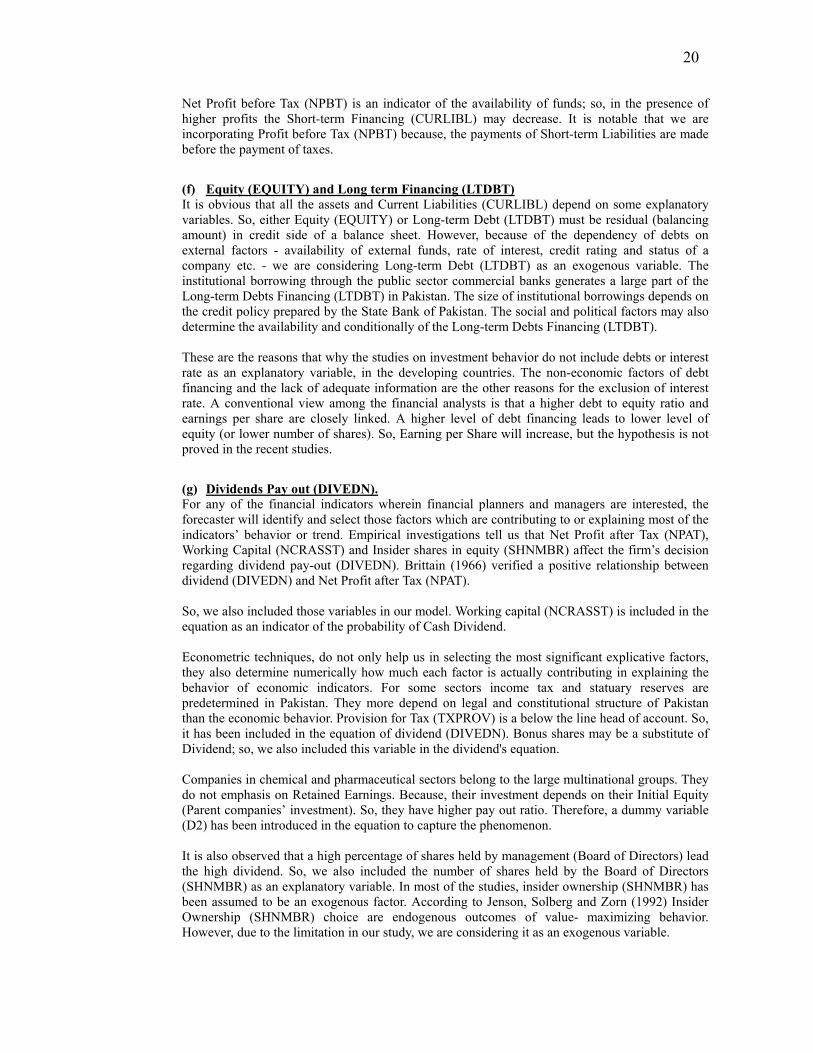
Net Profit before Tax (NPBT) is an indicator of the availability of funds; so, in the presence of higher profits the Short-term Financing (CURLIBL) may decrease. It is notable that we are incorporating Profit before Tax (NPBT) because, the payments of Short-term Liabilities are made before the payment of taxes.
(f) Equity (EQUITY) and Long term Financing (LTDBT) It is obvious that all the assets and Current Liabilities (CURLIBL) depend on some explanatory variables. So, either Equity (EQUITY) or Long-term Debt (LTDBT) must be residual (balancing amount) in credit side of a balance sheet. However, because of the dependency of debts on external factors - availability of external funds, rate of interest, credit rating and status of a company etc. - we are considering Long-term Debt (LTDBT) as an exogenous variable. The institutional borrowing through the public sector commercial banks generates a large part of the Long-term Debts Financing (LTDBT) in Pakistan. The size of institutional borrowings depends on the credit policy prepared by the State Bank of Pakistan. The social and political factors may also determine the availability and conditionally of the Long-term Debts Financing (LTDBT). These are the reasons that why the studies on investment behavior do not include debts or interest rate as an explanatory variable, in the developing countries. The non-economic factors of debt financing and the lack of adequate information are the other reasons for the exclusion of interest rate. A conventional view among the financial analysts is that a higher debt to equity ratio and earnings per share are closely linked. A higher level of debt financing leads to lower level of equity (or lower number of shares). So, Earning per Share will increase, but the hypothesis is not proved in the recent studies.
(g) Dividends Pay out (DIVEDN). For any of the financial indicators wherein financial planners and managers are interested, the forecaster will identify and select those factors which are contributing to or explaining most of the indicators’ behavior or trend. Empirical investigations tell us that Net Profit after Tax (NPAT), Working Capital (NCRASST) and Insider shares in equity (SHNMBR) affect the firm’s decision regarding dividend pay-out (DIVEDN). Brittain (1966) verified a positive relationship between dividend (DIVEDN) and Net Profit after Tax (NPAT). So, we also included those variables in our model. Working capital (NCRASST) is included in the equation as an indicator of the probability of Cash Dividend. Econometric techniques, do not only help us in selecting the most significant explicative factors, they also determine numerically how much each factor is actually contributing in explaining the behavior of economic indicators. For some sectors income tax and statuary reserves are predetermined in Pakistan. They more depend on legal and constitutional structure of Pakistan than the economic behavior. Provision for Tax (TXPROV) is a below the line head of account. So, it has been included in the equation of dividend (DIVEDN). Bonus shares may be a substitute of Dividend; so, we also included this variable in the dividend's equation. Companies in chemical and pharmaceutical sectors belong to the large multinational groups. They do not emphasis on Retained Earnings. Because, their investment depends on their Initial Equity (Parent companies’ investment). So, they have higher pay out ratio. Therefore, a dummy variable (D2) has been introduced in the equation to capture the phenomenon. It is also observed that a high percentage of shares held by management (Board of Directors) lead the high dividend. So, we also included the number of shares held by the Board of Directors (SHNMBR) as an explanatory variable. In most of the studies, insider ownership (SHNMBR) has been assumed to be an exogenous factor. According to Jenson, Solberg and Zorn (1992) Insider Ownership (SHNMBR) choice are endogenous outcomes of value- maximizing behavior. However, due to the limitation in our study, we are considering it as an exogenous variable.

21
FIGURE: 3 THE MODEL IN FUNCTIONAL FORM
STRUCTURE OF CORPORATE FINANCE A) Behavioral Equations :
1. LASST = f (CONST, FASSTC, NPATX, RTNTN, D6, D7) 2. DBTRS = f ( CONST, LASST, CURLIBL, SURPLUS,
DEPRCT, SALES, CSTPRD)
3. CLSTOCK = f (CONST, DBTRS, SALES, TIME) 4. FASSTC = f ( CONST, CURLIBL, SURPLUS, OSCAP,
NPATX, TCRASST) 5. CURLIBL = f (CONST, LASST, DBTRS, CLSTOCK, FASSTC, SURPLUS, OSCAP, ACMDEP, CFLOW, NPBTX)
6. DIVEDN = f (CONST, NPATX, NCRASST, BNSHR, TXPROV, SHRNBR, D2) B) Accounting Identities :
7. CFLOW = LASST – LASST(T – 1) 8. TCRASST = LASST + DBTRS + CLSTOCK 9. NCRASST = TCRASST – CURLIBL 10. TOTASST = TCRASST + FASSTC 11. TOTLIBL = TOTASST 12. NPATX = NPBTX – TXPROV 13. RTNTN = NPATX – DIVEDN 14. SURPLUS = SURPLUS(T-1) + RTNTN + PRUM 15.CAPITAL = TOTLIBL – CURLIBL 16. EQUITY = CAPITAL – LTDBT 17. OSCAP = EQUITY – SURPLUS 18. RIGHT = OSCAP – OSCAP(T-1) – BNSHR
19. CHCAP = CAPITAL – CAPITAL (T-1) 20. ACMDEP = ACMDEP(T-1) + DEPRCT 21. ACIDTST = LASST / CURLIBL 22. CRNTR = TCRASST / CURLIBL 23. DEPRAT = DEPRCT / FASSTC
C) Key Ratios : 24. DIVTOEQ = DIVDEN / EQUITY 25. DYIELD = DIVDEN / VFIRM 26. GEARING = LTDBT / CAPITAL 27. LEVRG = LTDBT / EQUITY 28. PAYRTO = DIVIDEN / NPATX

22
THE MODEL IN FUNCTIONAL FORM
STRUCTURE OF CORPORATE FINANCE D) Exogenous Variables :
29. RTNRTO = RTNTN / NPATX 30. SFINRT = RTNTN / CHCAP 31. VRATIO = VFIRM / EQUITY 32. DEPRCT = DEPRCT 33. SALES = SALES 34. CSTPRD = CSTPRD 35. LTDBT = LTDBT 36. NPBTX = NPBTX 37. TXPROV = TXPROV 38. BNSHR = BNSHR 39. SHNMBR = SHNMBR 40. SN = SN 41. SHPRIC= SHPRIC 42. VFIRM = VFIRM 43. PRUM = PRUM 44. LASST (T-1) = LASST (T-1)
45. ACMDEP (T-1) = ACMDEP (T-1) 46. SURPLUS (T-1) = SURPLUS (T-1) 47. OSCAP (T-1) = OSCAP (T-1) 48. CAPITAL (T-1) = CAPITAL (T-1)
49. TIME = TIME 50. D2 = D2 51. D6 = D6 52. D7 = D7
* Where, ‘CONST’’ is used for the constant term / intercept of the equation.

23
FIGURE: 4 ANATOMY OF THE MODEL
(A) Analysis of the Data 1) Estimated Period 1980-1994 2) Ex-post Forecasts 1995 -1997 3) Ex-ante Forecasts 1998-1999 4) Number of Companies 225 5) Number of Industrial Sectors 8
(B) Distribution of the Companies
Legal / Organizational Set up Industrial Sector Total Public
Sector Private Sector
1 Textile 89 2 87 2 Chemical and Pharmaceuticals 20 2 18 3 Engineering 24 8 16 4 Sugar and Allied 17 1 16 5 Paper, Printing and Allied 10 1 9 6 Cement 5 4 1 7 Fuel and Energy 12 7 5 8 Others 48 11 37
Total : 225 36 189
(C) Analysis of Variables
1) Total Variables : 52 2) Endogenous Variables : 31 a) System Variables : 06 b) Accounting Variables : 14 c) Key Ratios and Indicators : 11 3) Exogenous Variables : 21 a) Exogenous in the Model : 12 b) Dummy Variables : 03 c) Lag Variables and Time : 06

24
ANATOMY OF THE MODEL
(D) ANALYSIS OF THE EQUATIONS 1) Number of Behavioral Equations : 6 2) Number of Accounting Identities : 14 3) Number of Key Ratios and Indicators : 11 4) Number of Estimated Parameters : 40 a) Number of Constants : 06 b) Slopes of Exogenous Variables : 10 c) Slopes of Endogenous Variables : 24 i) Behavioral Endogenous : 9 ii) Accounting Endogenous : 15
(E) Distribution of Estimated Parameters (Slopes) Endogenous by
Behavioral Equations Endogenous by
Accounting Identities Exogenous
Variable No. of Para-meters
Variable No. of Para-meters
Variable
No. of Para-meters
CURLIBL 2 SURPLUS 3 SHNMBR 1 FASSTC 2 TXPROV 1 DEPRCT 1 DBTRS 2 NPAFTX 3 SALES 2 CLSTOCK 1 NCRASST 1 CSTPRD 1 LASST 2 NPBFTX 1 BNSHR 1 CFLOW 1 TIME 1 ACMDEP 1 D2 1 TCRASST 1 D6 1 RTNTN 1 D7 1 OSCAP 2 9 15 10

25
V. THE RESULTS AND SIMULATIONS
A) THE SIGNIFICANCY AND LIMITATIONS OF THE PARAMETERS.
The estimated equations have been shown in table: 3. The estimated t-ratios, F-statistics, and the adjusted coefficient of determination (R2) are also listed in table: 3. All the equations have good fits. The high values of F-statistics confirm the validity of the results. The t-ratios are also highly significant, reflecting that the explanatory variables are the significant determinants of the dependent variables. Our analysis has some potential limitations. First, our data employ a broad definition of the Long-term Debts (LTDBT). It covers the Debts from Commercial Banks, Debts from Development Finance Institutions, Corporate Bonds, Fund Generated at Above the Line (Pension Fund, Depreciation Fund, Redemption Fund) and even Preference Share Capital. So, the net effects of debt on financing pattern can not be clearly captured. Sometimes, the source and type of debt may be more important than the size of debt. Second, off balance sheet financing is a common practice for funds' raising. For example, we highlighted the factors of Fixed Assets, but a firm can finance the Fixed Assets through leasing. We do not know how much of the total variation is the result of variation among explanatory variables and how much is due to the lease financing facility. Similarly, we do not have the data on interest rates. Thus, we can not identify the variation in the Long-term Debts attributable to differential in interest rates. Third, we can not incorporate the socio-political and the socio-economic factors like as subsidized debts to a company, concession and relaxation in various taxes, political advantages in terms of cost of utilities. In closing identities we estimated the Long-term Debts and Equity. We concluded that if a firm has not enough profit for retention and Bonus, it would have to choose an option between the Right Issue, and Debt Financing. However, the funds raising either by the Debt Financing or by the Right Issue is not a simple matter. Chadwick (1987) recognized the effects of funds’ providers’ attitude, external environment, characteristics of the particular industry and financial structures of the other firms within the sector on the financial structure of a company. Finally, we cannot convert the corporate accounts completely in a uniform system, because of large variations in the accounting policies regarding Inventory Valuation, Depreciation Accounting, and the Creation of Secret Reserves. B) IMPLICATIONS IN THE RESULTS.
We examined several hypotheses that predict the variation in the financial structures of a firm. Our primary focus is to provide a better understanding of the relative importance of financial and dividend policies. The empirical results are robust to alternative measures of the independent variables. Our methods also suggest that Equity Capital is important in explaining both the Fixed Assets and the Current Assets of a company. The results reveal the following interesting observations:
1) The first important observation is that we provide evidence of a strong association between the volume of Fixed Assets and Short-term Liabilities. This is consistent with the observation that firms also rely on Short-term Capital Budgeting. We also document a reliably positive association between the existence of a Reserve Fund and Fixed Asset.
2) Another important finding is that the “ Bonus shares” is not a substitute of the “Cash dividend”. But, both are complements. It can be viewed at Pakistani stock market.

26
3) Time is the strongest variable, which explains the size of Closing Inventories. 4) A negative relationship between the Retained Earnings and Liquid Assets is
observed. The reason is that an increase in Retained Earnings indicates the urgent cash requirement of a firm. Because, for long term investment firm can arrange Equity and Debt financing. But for urgent nature expenditure firm arrange through retention. As a result firm has to decrease the Liquid Assets.
5) Insider ownership leads the higher dividend pay out. It is commonly observed in the market that closed companies pay higher dividend.
Now we discuss the implications in the results by individual equations. (a) Liquid Assets (LASSTS):
After Tax Profit (NPATX) is a major source of cash flow, while the volume of Non-current Assets is also a cause of higher Cash Balance; Because Cash will not flow out by Depreciation and above the line deductions. Results do not accept the hypothesis of a positive relation between Cash Balance and creation of Reserves at below the line. There is a significant negative relation between Liquid Assets and Retention. This implies that avoidance from dividend payment despite of higher profits, is an indicator of the weak liquidity. A higher liquid balance of the companies in the cement and energy sectors shows that cash dealings in those companies are significantly higher. (b) Accounts receivables (DBTRS) :
It is observed that five percent of Sales Revenue is generated through credit facility. It indicates the direct relation between Sales and Receivables. The results are consistent with Mian and Smith (1972) study. Higher Depreciation Expenditures (DEPRCT) and the higher Cost of Production (CSTPRD) will lead a tendency of avoidance from Sale on Credit. In case of a higher Cost of Production, company will prefer to sale on cash bases. Closing Inventories and Liquid Assets have been classified as a substitute of Receivables. While, financing through Retained Earrings (RTNTN) and Short-term Liabilities (CURLIBL) leads the enhancement in Accounts / Notes Receivables. (c) Closing Inventories (CLSTOCK) :
Specification of this equation has some interesting implications. It is interesting that twenty-nine percent of incremental inventories will be generated through Sales enhancement. Sales on credit have been confirmed as a substitute of Closing Inventories. Time is proved as a most important variable in determining the level of Inventories. (d) Fixed Assets at Historical Cost :
We considered fixed assets at their historical value, so that effect of any appreciation and depreciation may excluded. A negative sign with the Total Current Assets in the equation shows the distribution of total financial resources between the Current and Non-current Assets. The parameter associated with the Current Assets (TCRASST) indicates that Forty-three percent of additional resources will be transferred in the Current Assets and addition in the Fixed Assets will be 2.3 times of addition in the Current Assets (TCRASST). A forty-three percent deletion in Current Assets will create a hundred percent additional debit balance in the Non-current Asset. It is also estimated that 17.40 percent of the additional Fixed Assets are financed by the Short-term measures financing (CURLIBL). Such a part of financing may be the rental payment of finance lease, or current installments of the Long-term Debts.

27
Addition in Equity - either through Paid up Capital (OSCAP) or through Retention (RTNTN)- will be a cause of enhancement in Fixed Assets. The addition in Fixed Assets will be three times more as of addition in Equity. Surprisingly, Short-term Financing also leads to enhance the volume of Fixed Assets. While, Net Profit has a negative relation with Fixed Assets. (e) Current Liabilities (CURLIBL) :
It is also proved that Equity Capital and particularly Reserves and Surplus Fund (SURPLUS) is a substitute of Short-term Liabilities (CURLIBL). Similarly, Depreciation Fund for Fixed Assets is also a substitute of Short-term Financing. It is evident that a higher Net Profit before Tax (NPBT) and Cash Inflow (CFLOW) are the causes of decrease in Short-term Liabilities (CURLIBL). Liabilities like payments of Outstanding Bills for Utilities, Salaries, Fringe Benefits, and Vendor's Payments etc. can be paid through Net Profit before Tax (NPBT). The increases in the components of Current Assets (TCRASST) - Liquid Assets (LASST), Receivable (SBTRS), and Inventories (CLSTOCK) - are the other causes of increase in Current Liabilities. (6) Dividend Pay out (DIVIDEN):
Our evidence provides less support for the hypothesis that firm use working capital for payment of dividend. Although, the estimated coefficient of the Net Current Assets (NCRASST) is significantly negative, the economic impact of this variable is trivial. The results are consistent; however, with the hypothesis that firms with more insider holdings pay more dividend. Our examination of the determination of dividend, support the hypothesis that firms with more net profit (NPAT), pay more dividend. This result is consistent with Brittain’s finding (1966). We also found that companies in the Chemical and Pharmaceutical sector pay higher dividend as compare to companies in other sectors. Another interesting thing, in relation with dividend, has also mentioned that issuance of bonus shares (BONUS) is not a substitute of cash dividend (DIVDEN) but, to some extent, it is classified as a complement of the cash dividend (DIVDEN).

28
TABLE : 3 ESTIMATED RESULTS (3SLS)
Equation Number
Dependent Variable
Independent Variable
Coefficient T- Statistics
R-Square F- Statistics
1. LASST CONST 0.779 1.12 0.5435 394.08 FAASTC 0.069 18.11 NPATX 0.614 9.80 RTNTN - 0.348 - 4.37 D6 13.548 2.92 D7 23.142 6.48 2. DBTRS CONST 7.635 5.38 0.9823 11536.19 SURPLUS 0.266 16.85 CURLIBL 0.275 62.27 LASST -0.424 - 9.15 DEPRCT -0.788 - 7.90 SALES 0.051 12.71 CSTPRD -0.024 - 6.06 3. CLSTOCK CONST 50.422 8.51 0.9215 4846.30 DBTRS - 0.982 -135.86 SALES 0.290 50.46 TIME 3.435 3.93 4. FASSTC CONST -26.948 - 3.83 0.9148 3544.37 OSCAP 3.294 18.80 SURPLUS 3.288 77.96 TCRASST - 2.306 - 21.83 NPATX - 1.595 - 4.79 CURLIBL 2.469 22.90 5. CURLIBL CONST 7.232 5.89 0.9536 3770.99 OSCAP -0.424 - 3.34 SURPLUS -0.442 - 27.52 LASST 1.055 22.31 FASSTC 0.174 24.496 NPBTX -0.283 - 4.88 CFLOW -0.316 - 4 .18 ACMDEP -0.164 - 18.77 DBTRS 0.938 103.58 CLSTOCK 0.908 103.91 6. DIVEDN CONST -1.022 - 5.96 0.8305 1114.52 NCRASST -0.035 - 12.85 NPATX 0.155 19.35 SHNMBR 0.627 26.51 TXPROV 0.297 25.10 BNSHR 0.103 2.17 D2 1.319 2.48

29
C) THE SIMULATIONS AND PREDICTIVE POWER
To test the validity of the model in future, we have forecasted for the year from 1995 to 2000. We have taken following assumptions for the future projections:
(1) Net Profit before Tax (NPBFTX), Sales Revenue (SALES), and Cost of Production (CSTPRD) will increase by ten percent per annum.
(2) Average tax rate will be remained constant. (3) There will be no change in management holding of shares. (4) Market capitalization has forecasted on the base of a simulation study completed at
the Karachi University (Mehar: 1994). (5) Long term debt (LTDBT) will increase by five percent per annum compounded. (6) Average depreciation rate is assumed at 9.5 percent. (7) There will be no issue of bonus shares for the years of projections.
The results of ex-post and ex-anti simulations have been presented in appendix: II. We have observed that our ex-post simulations are closed to actual outcome. It is an indicator of the reliability and predictability of the model. We have also calculated the predictive power of the model through historical simulations. We applied three different test of predictability, namely: -
1) Mean Absolute Error (MAE) 2) Root Mean Square Percentage Error (RMSPE) 3) Thiel Index of Inequality
The model has been proved as a good toolkit for the predictions of the overall size of investment and financing. Similarly, it can predict the working capital requirement in future. By using the model, we can easily predict the solvency and liquidity position of a firm. On the basis of the model, we have prepared pro-forma accounts. The consolidated pro-forma accounts have been shown in appendix: II. The key ratios and indicators have also been shown in appendix: II. It is important that, in our model Sales and Net Profit before Tax are exogenous variables. Those variables are strongly related with the socio-economic and market conditions. Market will determine the prices, sales volume, input cost, capital expenditures and other factors of profit. The model can be extended by endogenization of those variables. However, at this level we can not extend the model due to our limitations. We observed in this study that the prediction of investment pattern (Structure of Assets) is relatively easy. While, prediction of financing pattern (Structure of Liabilities) is relatively a difficult task.
30
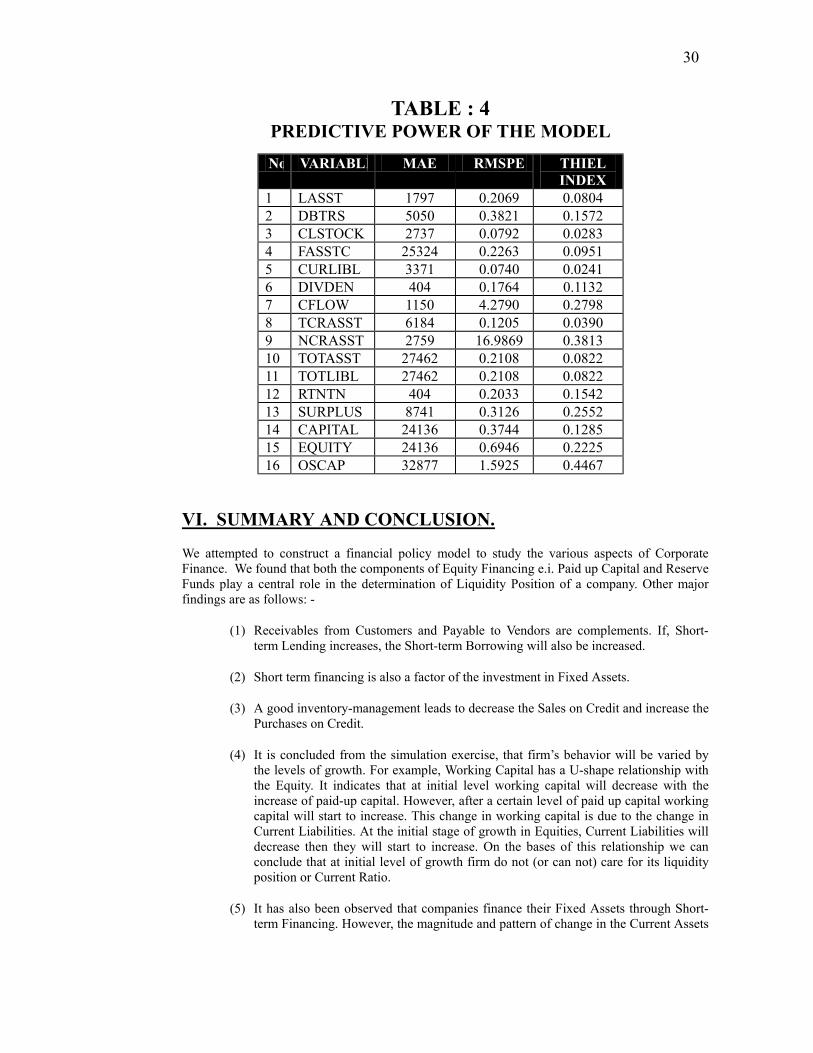
TABLE : 4 PREDICTIVE POWER OF THE MODEL
No. VARIABLE MAE RMSPE THIEL
INDEX 1 LASST 1797 0.2069 0.0804 2 DBTRS 5050 0.3821 0.1572 3 CLSTOCK 2737 0.0792 0.0283 4 FASSTC 25324 0.2263 0.0951 5 CURLIBL 3371 0.0740 0.0241 6 DIVDEN 404 0.1764 0.1132 7 CFLOW 1150 4.2790 0.2798 8 TCRASST 6184 0.1205 0.0390 9 NCRASST 2759 16.9869 0.3813 10 TOTASST 27462 0.2108 0.0822 11 TOTLIBL 27462 0.2108 0.0822 12 RTNTN 404 0.2033 0.1542 13 SURPLUS 8741 0.3126 0.2552 14 CAPITAL 24136 0.3744 0.1285 15 EQUITY 24136 0.6946 0.2225 16 OSCAP 32877 1.5925 0.4467
VI. SUMMARY AND CONCLUSION.
We attempted to construct a financial policy model to study the various aspects of Corporate Finance. We found that both the components of Equity Financing e.i. Paid up Capital and Reserve Funds play a central role in the determination of Liquidity Position of a company. Other major findings are as follows: -
(1) Receivables from Customers and Payable to Vendors are complements. If, Short-term Lending increases, the Short-term Borrowing will also be increased.
(2) Short term financing is also a factor of the investment in Fixed Assets.
(3) A good inventory-management leads to decrease the Sales on Credit and increase the Purchases on Credit.
(4) It is concluded from the simulation exercise, that firm’s behavior will be varied by the levels of growth. For example, Working Capital has a U-shape relationship with the Equity. It indicates that at initial level working capital will decrease with the increase of paid-up capital. However, after a certain level of paid up capital working capital will start to increase. This change in working capital is due to the change in Current Liabilities. At the initial stage of growth in Equities, Current Liabilities will decrease then they will start to increase. On the bases of this relationship we can conclude that at initial level of growth firm do not (or can not) care for its liquidity position or Current Ratio.
(5) It has also been observed that companies finance their Fixed Assets through Short-term Financing. However, the magnitude and pattern of change in the Current Assets

31
is so complicated. The rate of change in Current Assets will be smaller at initial stage but later on it will be greater.
(6) On the base of simulation exercises, it is concluded that working capital would decrease with the increase in Fixed Assets. But, after a certain level it will increase. In brief, Working Capital has a U-shape relation with the Fixed Assets. The results indicate that the Liquidity Position of a firm will be deteriorated by the addition in Fixed Assets in the short term. But, in the Long-term, a large addition in Fixed Assets will be a cause of improvement in the Liquidity Position of a firm.
(7) It is interesting that Long-term Debt is a cause of the deterioration in Liquidity Position of a firm. It may be a result of the repayments of debts in regular installments.

32
REFERENCES 1. A.E.R.C., 1988 “Macro-econometric Model of the Pakistan Economy”, Karachi:
AERC.
2. Agrawal. A., and G Mandelker, 1987 “Managerial Incentives and Corporate Investment and Financing Decisions”, Journal of Finance, September 1987, 823-838.
3. AICPA, 1986 “Accounting Trends and Techniques”, New York, The American Institute of Certified Public Accountants.
4. Altman, Edward, 1968 “Financial Ratios Discrimination Analysis and the Prediction of Corporate Bankruptcy”, Journal of Finance, September 1968, 589-609.
5. Arrow, Kenneth J., 1964 “The Role of Security in the Optimal Allocation of Risk-Bearing”, Review of Economic Studies, 1964, 91-96.
6. ASK Securities, (Various Issues) “Economic and Financial Review”, Karachi, ASK Securities, Karachi Stock Exchange.
7. Bandt Olivier de and Jacquinot Pascal, 1992 “The Financing of Corporate Firms in France – An Econometric Model”, The Economic Modeling, July 1992, 253-269.
8. Baring Securities, 1994 “Pakistan Stock Market Review”, September 1994.
9. Bilgrami, N and M. Nishat, 1990 “The determinants of Corporate Savings in Pakistan -A Case Study of Companies, Registered with Karachi Stock Exchange”, Karachi: The Applied Economics Research Center, University of Karachi: Discussion Paper No.137, 1992.
10. Brackus D., Brainard W.C., Smith G., ant Tobin J., 1980 “A Model of US Financial and Non-financial Economic Behavior”, Journal of Money, Credit and Banking, 1980 (12), 259-293.
11. Brittain, 1966 “Corporate Dividend Policy”, Brooking Institutions Papers, 1966.
12. Chadwick, L., 1987 “ Financial Structure”, The Newsletter of the Chartered Association of Certified Accountants, February 1987, 12-19.
13. Edward, E. Ghartey, and U.L.G. Rao, 1990 “A Short run Forecasting Model of Ghana”, Economic Modeling, July 1990, 290-308.
14. Fama, E.F., 1970 “Efficient Capital Market: A Review of Theory and Empirical Work”, Journal of Finance, May 1970, 383-417.
15. Fama, E.F., and J. MacBeth, 1973 “Risk, Return, and Equilibrium: Empirical Tests”, Journal of Political Economy, May-June 1973, 607-636.

33
16. Fama, E.F., and M.H. Miller, 1972; " The Theory of Finance"; Holt, Rinehart and Winston, New York, 1972.
17. Gearald R., J. Donald, P.Solberg and S. Thomas (1992); “Simultaneous Determination of Insider Ownership, Debt and Dividend Policies”, The Journal of Financial and Quantitative Analysis, 27 (2), 247-263.
18. Government of Pakistan, “Investment Finance Companies Rules”, Islamabad: 1987.
19. Government of Pakistan, Various Issues, “Economic Survey”, Islamabad, Ministry of Finance.
20. Government of Pakistan, Various Issues, “Explanatory Memorandum of the Budget”, Islamabad, Ministry of Finance.
21. Government of Pakistan, Various issues, “Budget in Brief”, Islamabad, Ministry of finance.
22. Government of Pakistan, Various Issues, “Statistical Year Book of Pakistan”, Islamabad, Federal Bureau of Statistics.
23. Harriss , Milton and Artur Raviv, 1991,"The Theory of Capital Structure", Journal of Finance, 46, 297-355
24. Hill, R.A., 1987 “Shares Valuation Theories”, The Newsletter of the Chartered Association of Certified accountants, May-June 1987.
25. Hirshleifer, J.,1972 “ The Private and Social Value of Information and the Reward to Incentive Activity”, American Economic Review, 1972 (61), 561-574.
26. Holmstrom, Bengt and Jean Tirole, 1982 “ Market Liquidity and Preference Monitoring”, Journal of Political Economy 101, 678-709.
27. Hughes, Merritt, 1991 “General Equilibrium of a Regional Economy with a Financial Sector – Part I: An Accounting Framework with Budget and Balance Sheet Linkages”, Journal of Regional Science, 1991 (4), 385-396.
28. Inman, Mark L.,1987b “Multivariate Analysis”, The Newsletter of the Chartered Association of Certified Accountants, March 1987b, 16-28.
29. International Accounting Standard Committee, (Various Issues), “International Accounting Standards Exposure and Approved Drafts”, London.
30. International Accounting Standard Committee, 1989 “ Consolidated Accounting Statements and Accounting for Investment in Subsidiaries”, London: IAS No.28.
31. International Accounting Standard Committee, 1989 “Accounting for Investment in Associates”, London: IAS No.28.
34
32. International Accounting Standard Committee, "Comparative Position of IAS-2 with Accounting Rules and Principles in Certain Major Areas around the World”, London: Earnest and Whinney International.
33. Jensen, G. and T. Zorn, 1988, “An Empirical Examination of the Capital Structure Decision in a Simultaneous Equations Framework”, University of Nebraska, Department of Finance, Working Paper, 1988.
34. Jensen, G., Solberg S.P., and Zorn, T.S., 1992 “Simultaneous Determination of Insider Ownership, Debt and Dividend Policies”, Journal of Financial and Quantitative Analysis, 1992 June, 247-263.
35. Jensen, M. and W. Meckling, 1976 “Theory of the Firm: Managerial Behavior, Agency Costs and Ownership Structure”, Journal of Financial Economics, October 1976, 305-360.
36. Karachi Stock Exchange (1980-1994), "Annual Reports of the Companies". Karachi.
37. Karachi Stock Exchange, 1994 “ Rules and Regulations”, Karachi.
38. Kim E. Han and John J. McConnel, 1978, “Corporate Merger and the Co-insurance of Corporate Debt”, Journal of Finance, January 1978,
39. Kim Yong H. and Joesph C. Atkins, 1978 “Evaluating Investments in Accounts Receivable: A Wealth Maximization Framework”, Journal of Finance, May 1978, 413-412.
40. Kramer, P. Van Den Bosch, Movrik T.J., Fase M.G. and Van Navta Lemake, 1990, “FYSION Macroeconomics in Computer Graphics”, Economic Modeling, April 1990, 148-160.
41. Leland, Hayne, 1978, “Information, Managerial Choice and Stockholder Unanimity”, Review of Economic Studies, 1978 (45), 527-534.
42. Litzenberger Robert H. and James C.V. Horne, 1978, “Elimination of the Double Taxation Dividends and Corporate financial Policy”, Journal of Finance, June 1978, 737-749.
43. Matz, Curry, Franks and Khan, A.R.1982; "Cost Accounting: An Emphasis to Management", Karachi: ICMAP.
44. Mayer C.,1988 “New Issues in Corporate Finance”, European Economic Review, 1988, 1167-1189.
45. McCabe, G.M. 1979, “The Empirical Relationship Between Investment and Financing: A New Look”, Journal of Financial and Quantitative Analysis, 1979 March, 119-135.

35
46. MEFISTOTE, TEAM, 1992, “A Model of the French Financial System at the Bank of France-MEFISTOTE Version 1 (Modeling the Evolution of Financial Stocks)”, Economic Modeling, 1992 July, 211-252.
47. Mehar, M. Ayub K. and M.T. Salam, 1994 “Equity Analysis – 1994 : An Overview”, ASK Securities, Karachi Stock Exchange.
48. Mehar, M. Ayub K., 1992 “ A Forecasting Model of Public Finance: An Experience from the Pakistan Economy”, M. Phil Dissertation, Karachi: AERC.
49. Mehar, M. Ayub K., 1993 “Multivariate Analysis for Financial Comparison of Companies in Pharmaceutical Sector”, Economic and Financial Review, 1993.
50. Mehar, M. Ayub K., 1993 “Tax Revenue Forecasting”, Report Submitted to the Central Board of Revenue (CBR)”, Karachi “ Applied Economics Research Center.
51. Mehar, M. Ayub K., 1994 “Stock Stabilization Fund”, Report Submitted to the President Karachi Stock Exchange (Guarantee) Limited.
52. Mehar, M. Ayub K., 1994, "A Simulation Model of Corporate Finances: A Study of Companies Listed on the Karachi Stock Exchange", Karachi. Ph.D. Dissertation.
53. Mehar, M. Ayub K., Sohail Javed, and Samina Aijaz, 1993, “Short Term Financing, Accounts Receivables, and Liquidity Position of the Firm”, Pakistan Economic and Social Review, 1993 (2).
54. Mian L.Shehzad, and Clifford W. Smith, 1972, “Account Receivable Management Policy: Theory and Evidence”, The Journal of Finance, 1972 (1), 169-200.
55. Modigliani, F. and M .Miller 1958 “ Some Estimates of the Cost of Capital to the Electric Utility Industry 1954-57”, American Economic Review, June 1958, 261-297.
56. Modigliani, Franco and Merto H. Miller, 1963 “Corporate Income Taxes and the Cost of Capital: A Correction”, American Economic Review, 1963 (53), 433-443.
57. Morck, R., Sheleifrer A., and Vishny R., 1988, “Management Ownership and Corporate Performance: An Empirical Analysis”, Journal of Financial Economics, March 1988, 293-316.
58. Myers, S., 1977, “Determinants of Corporate Borrowing”, Journal of Financial Economics, 1977 (November), 147-175.
59. Myers, S.C., 1984, “The Capital Structure Puzzle”, Journal of Finance, July 1984, 575-592.
60. Naqvi, S.N.Haider, A.R. Kemal, Rashid Aziz and Associates, 1982, “The PIDE Econometric Model of Pakistan Economy (1959-60 to 1978-79)”, Islamabad: The PIDE.

36
61. Nishat, M. and Saghir, Asif, 1991, “ The Stock Market and Pakistan Economy 1964-87”, Savings and Development, 1991 (2), 131-146.
62. Nishat, M. and Saghir, Asif, 1992, “The Impact of Monetary and Fiscal Policy Action on Stock Market in Pakistan”, Karachi: The AERC, Discussion Paper No.165.
63. P.I.D.E., 1992, “Macro Econometric Model of Pakistan Economy”, Islamabad, Pakistan Institute of Development Economics.
64. Peterson, P.P. and GA Bennett, 1983, “ A Reexamination of the Empirical Relationship between Investment and Financing Decision”, Journal of Financial and Quantitative Analysis, 1983 (18), 429-453.
65. Robert B. Anthonyson and J. Philip Cooper, 1982, “Simulation Model for Corporate Planning”, Cambridge, Mass. Dynamic Associates Incorporated, 1982.
66. Ross Stephen A., 1977, “The Determination of Financial Structure: The Incentives Signaling Approach”, Bell Journal of Economics, Spring 1977, 23-40.
67. Scott, James, 1977 “Bankruptcy, Secured Debt and Optimal Capital Structure”, Journal of Finance, 1977 (32), 1-19.
68. Shleifer, A. and R. Vishny, 1986, “Large Shareholders and Corporate Control”, Journal of Political Economy, June 1986, 461-488.
69. Smith, Cliord W., Jr., and Ross L. Watts, 1992, " The Investment Opportunity Set and Corporate financing, Dividend and Compensation Policies", Journal of financial Economics, 32, 263-292
70. Smith, Janet Kiholm, 1987, “Trade Credit and Informational Asymmetry”, Journal of Finance, 1987 (62), 863-871.
71. Smith, Keith,1980, “Readings on the Management of Working Capital”, West Publishing Company.
72. State Bank of Pakistan, (Various Issues), "Annual Report ", Karachi.
73. State Bank of Pakistan, Various Issues, “Balance Sheet Analysis” Karachi: The State Bank of Pakistan.
74. Welch Ivo, 1994, “The Cross-Sectional Determinants of Corporate Capital Expenditures: A Multinational Comparison", UCLA Working Papers.
75. Williamson, G.H., 1987, “ An Approach to Modeling in Business and Industry via Simulation”, The Newsletter of the Chartered Association of Certified Accountants, November, 23-29.
76. Williamson, O.E. 1988, " Corporate Finance and Corporate Governance", The Journal o Finance.

37
APPENDIX: I
ACTUAL DATA
CONSOLIDATED BALANCE SHEET: DEBIT SIDE (RS. / MILLION)
YEAR Liquid Assets
Receivables Inventories Non-Liquid Current Assets
Total Current Assets
Fixed Assets at Actual
Cost
Fixed Assets at Written
Down Value
Total Assets
1980 2727 4036 15411 19447 22174 34769 23637 45811
1981 2690 4884 18142 23026 25716 38955 26133 51849
1982 3113 6089 20789 26878 29991 45186 29932 59923
1983 4202 6499 22127 28626 32828 52155 34585 67413
1984 4275 7207 24979 32186 36461 64948 42046 78507
1985 5530 8612 27204 35816 41346 75741 49885 91231
1986 6269 10195 29411 39606 45875 84619 55325 101200
1987 5827 11132 32291 43423 49250 92105 59392 108642
1988 7615 12077 37049 49126 56741 106048 67599 124340
1989 10597 14076 43709 57785 68382 133818 81907 150289
1990 15767 17929 52179 70108 85875 162249 104643 190518
1991 20398 22457 64021 86478 106876 192533 124258 231134
1992 21553 23135 79180 102315 123868 242023 164747 288615
1993 27815 28357 93786 122143 149958 296090 192049 342007
1994 36244 32283 106828 139111 175355 356437 244750 420105
CONSOLIDATED BALANCE SHEET: CREDIT SIDE (RS. / MILLION)
YEAR Paid up Capital
Reserves and
Surplus
Owners’ Equity
Long-term Debt
Employed Capital
Short-term Liabilities
Total Equities and Liabilities
1980 7083 5376 12459 9834 22293 23518 45811
1981 7614 6505 14119 11994 26113 25736 51849
1982 8552 7760 16312 15345 31657 28266 59923
1983 9185 9038 18223 18324 36547 30866 67413
1984 10663 10856 21519 22177 43696 34811 78507
1985 12158 13213 25371 25593 50964 40267 91231
1986 13092 17888 30980 26640 57620 43580 101200
1987 14385 18704 33089 29381 62470 46172 108642
1988 16359 20686 37045 32563 69608 54732 124340
1989 19183 25197 44380 40420 84800 65489 150289
1990 24420 35268 59688 49370 109058 81460 190518
1991 28740 38141 66881 61589 128470 102664 231134
1992 43185 43134 86319 83313 169632 118983 288615
1993 48853 51208 100061 92468 192529 149478 342007
1994 63180 60457 123637 119525 243162 176943 420105

38
SOLVENCY AND PROFITABILITY (RS. / MILLION)
YEAR Cash Dividend
Cash Flow
Net Current Assets
Net Profit After Tax
Retained Earnings
1980 805 0 -1344 1402 597
1981 942 -37 -20 1715 773
1982 1050 423 1725 1900 850
1983 1134 1089 1962 2178 1044
1984 1230 73 1650 1920 690
1985 1586 1255 1079 2617 1031
1986 1824 739 2295 3740 1916
1987 1948 -397 3078 3290 1342
1988 2312 1743 2009 4872 2560
1989 2892 2982 2893 5879 2987
1990 2967 5170 4415 6684 3717
1991 2980 4631 4212 6490 3510
1992 4756 1155 4885 7226 2470
1993 4805 6262 480 8977 4172
1994 5385 8429 -1588 10236 4851
KEY RATIOS AND INDICATORS (CONSOLIDATED POSITION)
YEAR Acid Test
Ratio Current
Ratio Rate of
Depreciation
Dividend to Equity Ratio
Dividend Yield
Gearing Ratio
Leverage Ratio
Pay Out
Ratio
Reten-tion
Ratio
Self Financ-ing Rate
Valuation Ratio
1980 0.12 0.94 5% 0.06 0.12 0.44 0.79 0.57 0.43 --- 0.54
1981 0.10 1.00 5% 0.07 0.14 0.46 0.85 0.55 0.45 0.20 0.48
1982 0.11 1.06 6% 0.06 0.11 0.48 0.94 0.55 0.45 0.15 0.58
1983 0.14 1.06 6% 0.06 0.09 0.50 1.01 0.52 0.48 0.21 0.73
1984 0.12 1.05 5% 0.06 0.06 0.51 1.03 0.64 0.36 0.10 0.91
1985 0.14 1.03 5% 0.06 0.07 0.50 1.01 0.61 0.39 0.14 0.87
1986 0.14 1.05 6% 0.06 0.07 0.46 0.86 0.49 0.51 0.29 0.79
1987 0.13 1.07 6% 0.06 0.06 0.47 0.89 0.59 0.41 0.28 0.96
1988 0.14 1.04 6% 0.06 0.06 0.47 0.88 0.47 0.53 0.36 1.03
1989 0.16 1.04 5% 0.07 0.07 0.48 0.91 0.49 0.51 0.20 0.99
1990 0.19 1.05 5% 0.05 0.06 0.45 0.83 0.44 0.56 0.15 0.81
1991 0.20 1.04 5% 0.04 0.04 0.48 0.92 0.46 0.54 0.18 1.02
1992 0.18 1.04 6% 0.06 0.02 0.49 0.97 0.66 0.34 0.06 2.53
1993 0.19 1.00 5% 0.05 0.02 0.48 0.92 0.54 0.46 0.18 2.14
1994 0.20 0.99 5% 0.04 0.01 0.49 0.97 0.53 0.47 0.10 3.27
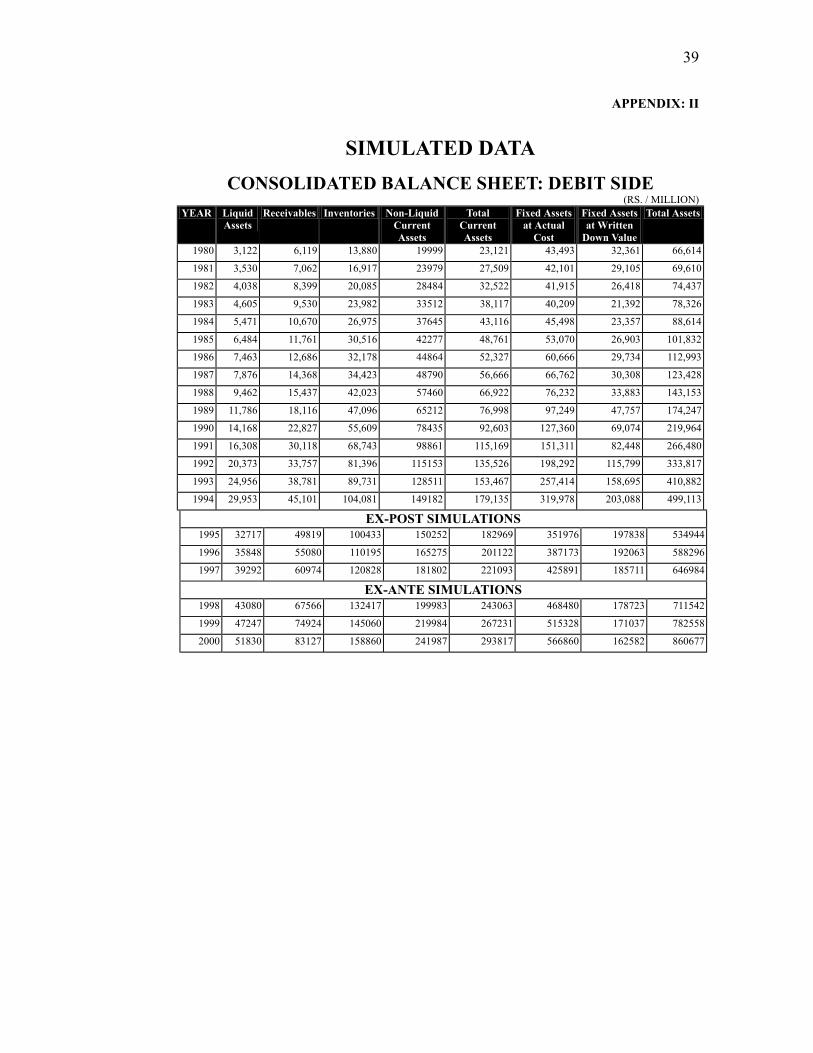
39
APPENDIX: II
SIMULATED DATA
CONSOLIDATED BALANCE SHEET: DEBIT SIDE (RS. / MILLION)
YEAR Liquid Assets
Receivables Inventories Non-Liquid Current Assets
Total Current Assets
Fixed Assets at Actual
Cost
Fixed Assets at Written
Down Value
Total Assets
1980 3,122 6,119 13,880 19999 23,121 43,493 32,361 66,614
1981 3,530 7,062 16,917 23979 27,509 42,101 29,105 69,610
1982 4,038 8,399 20,085 28484 32,522 41,915 26,418 74,437
1983 4,605 9,530 23,982 33512 38,117 40,209 21,392 78,326
1984 5,471 10,670 26,975 37645 43,116 45,498 23,357 88,614
1985 6,484 11,761 30,516 42277 48,761 53,070 26,903 101,832
1986 7,463 12,686 32,178 44864 52,327 60,666 29,734 112,993
1987 7,876 14,368 34,423 48790 56,666 66,762 30,308 123,428
1988 9,462 15,437 42,023 57460 66,922 76,232 33,883 143,153
1989 11,786 18,116 47,096 65212 76,998 97,249 47,757 174,247
1990 14,168 22,827 55,609 78435 92,603 127,360 69,074 219,964
1991 16,308 30,118 68,743 98861 115,169 151,311 82,448 266,480
1992 20,373 33,757 81,396 115153 135,526 198,292 115,799 333,817
1993 24,956 38,781 89,731 128511 153,467 257,414 158,695 410,882
1994 29,953 45,101 104,081 149182 179,135 319,978 203,088 499,113
EX-POST SIMULATIONS 1995 32717 49819 100433 150252 182969 351976 197838 534944
1996 35848 55080 110195 165275 201122 387173 192063 588296
1997 39292 60974 120828 181802 221093 425891 185711 646984
EX-ANTE SIMULATIONS 1998 43080 67566 132417 199983 243063 468480 178723 711542
1999 47247 74924 145060 219984 267231 515328 171037 782558
2000 51830 83127 158860 241987 293817 566860 162582 860677

40
CONSOLIDATED BALANCE SHEET: CREDIT SIDE
(RS. / MILLION) YEAR Paid up
Capital Reserves and
Surplus Owners’ Equity
Long-term Debt
Employed Capital
Short-term Liabilities
Total Equities and Liabilities
1980 28,234 5,376 33,610 9834 43,444 23,170 66,614
1981 25,407 5,984 31,391 11994 43,385 26,224 69,610
1982 22,379 6,694 29,072 15345 44,417 30,019 74,437
1983 18,187 7,647 25,834 18324 44,158 34,168 78,326
1984 19,406 8,194 27,599 22177 49,776 38,838 88,614
1985 22,929 9,199 32,128 25593 57,721 44,111 101,832
1986 27,919 11,131 39,051 26640 65,691 47,302 112,993
1987 29,979 12,569 42,548 29381 71,929 51,499 123,428
1988 35,779 15,003 50,783 32563 83,346 59,808 143,153
1989 45,897 18,044 63,941 40420 104,361 69,886 174,247
1990 63,579 21,298 84,877 49370 134,247 85,716 219,964
1991 72,900 24,064 96,964 61589 158,553 107,927 266,480
1992 97,108 26,261 123,369 83313 206,682 127,136 333,817
1993 139,450 29,097 168,547 92468 261,015 149,867 410,882
1994 170,652 31,761 202,413 119525 321,938 177,175 499,113
EX-POST SIMULATIONS 1995 215252 35356 250608 125501 376109 158835 534944
1996 253541 39716 293257 131776 425034 163262 588296
1997 285221 44918 330139 138365 468504 178480 646984
EX-ANTE SIMULATIONS 1998 320168 51046 371215 145283 516498 195044 711542
1999 358727 58193 416920 152548 569468 213091 782558
2000 401276 66459 467735 160175 627910 232767 860677

41
SOLVENCY AND PROFITABILITY
(RS. / MILLION) YEAR Dividend Cash Flow Net Current
Assets Net Profit After Tax
Retained Earnings
1980 1,003 0 -49 1,402 399
1981 1,107 408 1,284 1,715 608
1982 1,190 508 2,503 1,900 710
1983 1,225 567 3,949 2,178 953
1984 1,374 866 4,278 1,920 546
1985 1,611 1,013 4,651 2,617 1,006
1986 1,808 980 5,025 3,740 1,932
1987 1,853 412 5,167 3,290 1,437
1988 2,437 1,586 7,114 4,872 2,435
1989 2,838 2,324 7,111 5,879 3,041
1990 3,430 2,382 6,887 6,684 3,254
1991 3,724 2,140 7,242 6,490 2,766
1992 5,029 4,065 8,390 7,226 2,197
1993 6,141 4,583 3,600 8,977 2,836
1994 7,573 4,997 1,960 10,236 2,663
EX-POST SIMULATIONS 1995 7666 2764 24133 11260 3594
1996 8027 3131 37860 12386 4359
1997 8425 3444 42614 13624 5199
EX-ANTE SIMULATIONS 1998 8863 3788 48019 14987 6124
1999 9344 4167 54140 16485 7141
2000 9873 4584 61050 18134 8260

42
KEY RATIOS AND INDICATORS (CONSOLIDATED POSITION)
YEAR Acid test
Ratio Current
Ratio Rate of
Depreciation
Dividend on Equity
Dividend yield
Gearing Ratio
Leverage Ratio
Pay out Ratio
Retention Ratio
Self-financ-
ing Rate
Valuation Ratio
1980 0.13 1.00 4% 0.03 0.15 0.23 0.29 0.72 0.28 --- 0.20
1981 0.13 1.05 4% 0.04 0.16 0.28 0.38 0.65 0.35 -10.33 0.21
1982 0.13 1.08 6% 0.04 0.13 0.35 0.53 0.63 0.37 0.69 0.32
1983 0.13 1.12 8% 0.05 0.09 0.41 0.71 0.56 0.44 -3.68 0.52
1984 0.14 1.11 7% 0.05 0.07 0.45 0.80 0.72 0.28 0.10 0.71
1985 0.15 1.11 8% 0.05 0.07 0.44 0.80 0.62 0.38 0.13 0.68
1986 0.16 1.11 8% 0.05 0.07 0.41 0.68 0.48 0.52 0.24 0.63
1987 0.15 1.10 8% 0.04 0.06 0.41 0.69 0.56 0.44 0.23 0.74
1988 0.16 1.12 8% 0.05 0.06 0.39 0.64 0.50 0.50 0.21 0.75
1989 0.17 1.10 7% 0.04 0.06 0.39 0.63 0.48 0.52 0.14 0.69
1990 0.17 1.08 7% 0.04 0.07 0.37 0.58 0.51 0.49 0.11 0.57
1991 0.15 1.07 7% 0.04 0.05 0.39 0.64 0.57 0.43 0.11 0.71
1992 0.16 1.07 7% 0.04 0.02 0.40 0.68 0.70 0.30 0.05 1.77
1993 0.17 1.02 6% 0.04 0.03 0.35 0.55 0.68 0.32 0.05 1.27
1994 0.17 1.01 6% 0.04 0.02 0.37 0.59 0.74 0.26 0.04 2.00
EX-POST SIMULATIONS 1,995 0.21 1.15 11% 0.03 0.03 0.33 0.50 0.68 0.32 0.10 1.01
1996 0.22 1.23 11% 0.03 0.02 0.31 0.45 0.65 0.35 0.09 1.26
1997 0.22 1.24 0.11 0.03 0.02 0.30 0.42 0.62 0.38 0.12 1.23
EX-ANTE SIMULATIONS 1998 0.22 1.25 0.11 0.02 0.02 0.28 0.39 0.59 0.41 0.13 1.21
1999 0.22 1.25 0.11 0.02 0.02 0.27 0.37 0.57 0.43 0.13 1.18
2000 0.22 1.26 0.11 0.02 0.02 0.26 0.34 0.54 0.46 0.14 1.16

43
SUMMARY OF PROFIT AND LOSS ACCOUNTS
(CONSOLIDATED INCOME STATEMENTS) (RS. / MILLION)
YEAR TIME Opening Inventories
Cost of Production
Closing Inventories
Cost of Goods Sold
Sales Revenue
Gross Profit
Other Income
Other Expenses
Net Profit Before Tax
1980 1 12000 57425 15411 54014 61344 7330 800 5791 2339
1981 2 15411 68855 18142 66124 74675 8551 1178 6850 2879
1982 3 18142 81657 20789 79010 89669 10659 830 8268 3221
1983 4 20789 93955 22127 92617 104481 11864 951 9439 3376
1984 5 22127 107270 24979 104418 117189 12771 1303 10741 3333
1985 6 24979 120665 27204 118440 134146 15706 1656 13225 4137
1986 7 27204 126872 29411 124665 145223 20558 2475 17836 5197
1987 8 29411 137627 32291 134747 156126 21379 2206 18703 4882
1988 9 32291 166966 37049 162208 185522 23314 2019 18216 7117
1989 10 37049 189423 43709 182763 209772 27009 2054 20622 8441
1990 11 43709 231970 52179 223500 252162 28662 2332 21162 9832
1991 12 52179 290245 64021 278403 312773 34370 3056 27588 9838
1992 13 64021 330893 79180 315734 358688 42954 3301 34817 11438
1993 14 79180 370927 93786 356321 405099 48778 5343 39677 14444
1994 15 93786 423810 104081 410768 467867 57099 5302 46452 15949
EX-POST SIMULATIONS 1,995 16 104,081 466,191 100,433 451845 514,654 62,809 5832 51097 17,544
1,996 17 100,433 512,810 110,195 497029 566,119 69,090 6415 56206 19,298
1997 18 110,195 564,091 120,828 546,732 622,731 75,999 7057 61828 21,228
EX-ANTE SIMULATIONS 1998 19 120,828 620,500 132,417 601,405 685,004 83,599 7763 68010 23,351
1999 20 132,417 682,550 145,060 661,546 753,504 91,959 8539 74811 25,686
2000 21 145,060 750,805 158,860 727,701 828,855 101,154 9393 82293 28,255

44
APPROPRIATION OF PROFIT AND LOSS (CONSOLIDATED STATEMENT)
(RS. / MILLION)
YEAR Net Profit Before Tax
Direct Taxes Net Profit After Tax
Cash Dividend Bonus Shares Retained Earnings
1980 2339 937 1402 805 159 597
1981 2879 1164 1715 942 173 773
1982 3221 1321 1900 1050 286 850
1983 3376 1198 2178 1134 252 1044
1984 3333 1413 1920 1230 459 690
1985 4137 1520 2617 1586 291 1031
1986 5197 1457 3740 1824 545 1916
1987 4882 1592 3290 1948 735 1342
1988 7117 2245 4872 2312 592 2560
1989 8441 2562 5879 2892 640 2987
1990 9832 3148 6684 2967 825 3717
1991 9838 3348 6490 2980 661 3510
1992 11438 4212 7226 4756 1202 2470
1993 14444 5467 8977 4805 1208 4172
1994 15949 5713 10236 5385 2282 4851
EX-POST SIMULATIONS 1995 17,544 6284 11,260 7,666 0 3,594
1996 19,298 6913 12,386 8,027 0 4,359
1997 21,228 7,604 13,624 8,425 0 5,199
EX-ANTE SIMULATIONS 1998 23,351 8,364 14,987 8,863 0 6,124
1999 25,686 9,201 16,485 9,344 0 7,141
2000 28,255 10,121 18,134 9,873 0 8,260

45
LIQUIDITY AND FINANCIAL POSITION OF THE FIRM (CONSOLIDATED ACCOUNTS)
(RS. / MILLION) YEAR Shares Held
by the Board
(MILLION)
Market Capital-ization
Net Current Assets
Cash Flow Depreciation Accumulated Depreciation
Average Rate of
Deprecia-tion
Average Rate of (Direct)
Tax
Debt to Sales Ratio
1980 709 6710 -1344 100 1651 11132 9.4 40.06 6.58
1981 762 6708 -20 -37 1864 12822 7.83 40.44 6.54
1982 854 9380 1725 423 2501 15254 9.63 41.02 6.79
1983 917 13326 1962 1089 3320 17570 11.15 35.5 6.22
1984 1065 19647 1650 73 3324 22902 9.17 42.38 6.15
1985 1217 21953 1079 1255 4026 25856 9.31 36.75 6.42
1986 1309 24422 2295 739 4765 29294 9.55 28.03 7.02
1987 1440 31617 3078 -397 5522 32713 9.77 32.61 7.13
1988 1636 38151 2009 1743 5895 38449 9.65 31.54 6.51
1989 1918 43935 2893 2982 7143 51911 10.05 30.35 6.71
1990 2440 48626 4415 5170 8794 57606 8.95 32.02 7.11
1991 2877 68439 4212 4631 10577 68275 9.85 34.03 7.18
1992 4316 218357 4885 1155 13630 77276 9.75 36.82 6.45
1993 4815 214429 480 6262 16226 104041 9.7 37.84 7
1994 6379 404578 -1588 8429 18171 111687 9.5 35.82 6.9
EX-POST SIMULATIONS 1995 6,379 253,043 24,133 2,764 37,248 154137 10.58 35.82 9.68
1996 6,379 370,465 37,860 3,131 40,972 195110 10.58 35.82 9.73
1997 6,379 407,512 42,614 3,444 45,070 240179.8 10.58 35.82 9.79
EX-ANTE SIMULATIONS 1998 6,379 448,263 48,019 3,788 49,577 289756.4 10.58 35.82 9.86
1999 6,379 493,089 54,142 4,167 54,534 344290.7 10.58 35.82 9.94
2000 6,379 542,398 61,052 4,583 59,988 404278.5 10.58 35.82 10.03

46
APPENDIX LIST OF COMPANIES
(1) TEXTILE GROUP
Serial Number
Company
PRIVATE SECTOR 1 Adamjee Industries. 2 Ahmed Spinning Mills. 3 Ali Asghar Textile Mills. 4 Allawasaya Textile & Finishing . 5 Annoor Textile. 6 Anwar Textile. 7 Ayesha Textile. 8 Babri Cotton 9 Bahawalpur Textile.
10 Burewala Textile. 11 Central Cotton. 12 Chaudhry Textile 13 Chenab Textile 14 Colony Sarhad 15 Colony Thal 16 Crescent Textile 17 D.M. Textile 18 Dawood Cotton 19 Dewan Textile 20 Dost Muhammad Cotton 21 Elahi Cotton 22 Elite Textile 23 Fateh Textile 24 Fazal Cloth 25 Fazal Textile 26 F.P. Textile 27 Ghafur Textile 28 Globe Textile 29 (OE) Globe Textile 30 Gul Ahmed Textile 31 Gulistan Textile 32 Hafiz Textile 33 Hamraz Industries 34 Hussein Industries 35 Indus Dyeing & Manufacturing 36 Island Textile 37 Jubilee Spinning & Weaving 38 Junaid Cotton 39 Karim Cotton 40 Khalid Textile 41 Khyber Textile 42 Kohat Textile 43 Kohinoor Industries

47
44 Kohinoor Spinning 45 Kohinoor Textile 46 Kotri Textile 47 M.F.M.Y. Industries 48 Mahmood Textile 49 Modern Textile 50 Muhammad Farooq 51 Mushtaq Textile 52 Nafees Cotton 53 Nakshbandi Aindustries 54 Naveed Tex 55 Nishat Mills 56 Noon Textile 57 Olympia Spinning & Weaving 58 Quetta Textile 59 Rasihid Textile 60 Sadiqabad Textile 61 Sally Textile 62 Sapphire Textile 63 Service Industries 64 Shafiq Textile 65 Shahyar Textile 66 Shaheen Cotton 67 Shams Textile 68 Sind Fine Texitle 69 Star Textile 70 Sunshine Cotton 71 Universal Textile 72 Usman Textile 73 Yousuf Textile 74 Zaman Textile 75 Bengal Fibre 76 Colony Woollen 77 Dilon Ltd 78 Karim Silk 79 Lawrencepur Wollen & Textile 80 Liberty Mills 81 Moonlite (Pak) 82 Nilom Nylon 83 Noor Silk 84 Polypropylene Products 85 United Carpets 86 Valika Art Fabrics 87 Valika Woollen
PUBLIC SECTOR
88 Harnai Woollen 89 Ravi Rayon
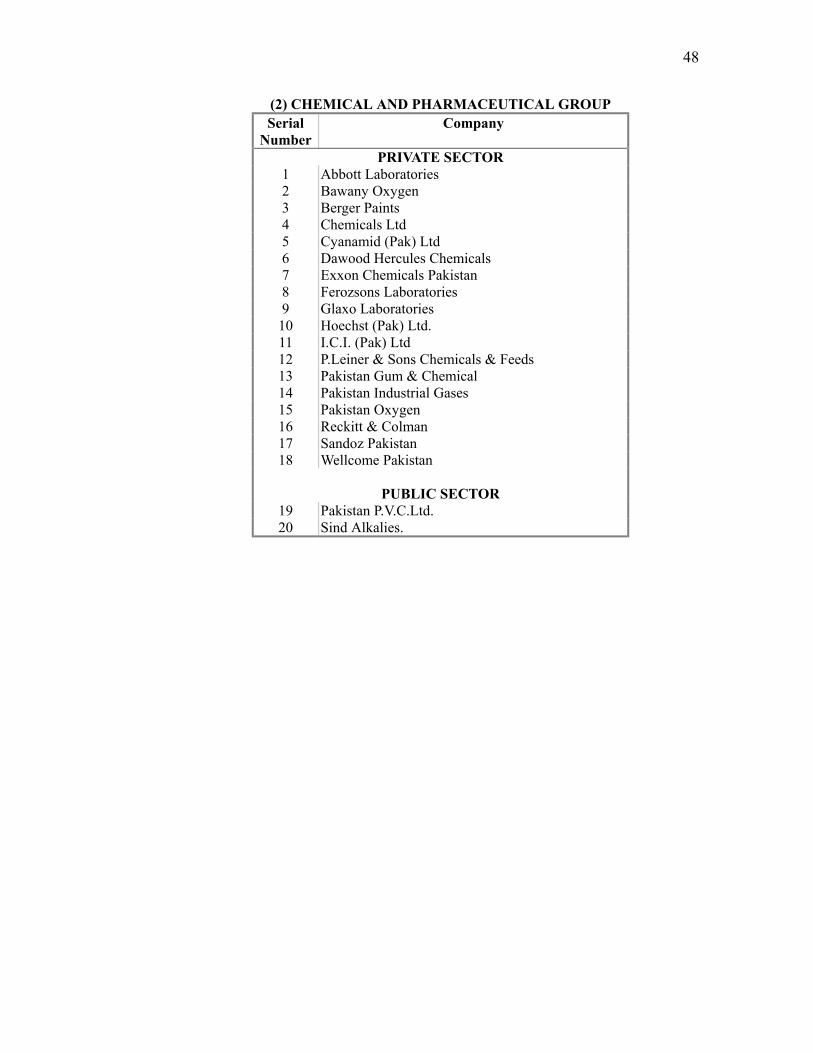
48
(2) CHEMICAL AND PHARMACEUTICAL GROUP Serial
Number Company
PRIVATE SECTOR 1 Abbott Laboratories 2 Bawany Oxygen 3 Berger Paints 4 Chemicals Ltd 5 Cyanamid (Pak) Ltd 6 Dawood Hercules Chemicals 7 Exxon Chemicals Pakistan 8 Ferozsons Laboratories 9 Glaxo Laboratories
10 Hoechst (Pak) Ltd. 11 I.C.I. (Pak) Ltd 12 P.Leiner & Sons Chemicals & Feeds 13 Pakistan Gum & Chemical 14 Pakistan Industrial Gases 15 Pakistan Oxygen 16 Reckitt & Colman 17 Sandoz Pakistan 18 Wellcome Pakistan
PUBLIC SECTOR
19 Pakistan P.V.C.Ltd. 20 Sind Alkalies.

49
(3) ENGINEERING GROUP Serial
Number Company
PRIVATE SECTOR 1 Allwin Engineering Industries 2 Aslo Electrical Industries 3 Atlas Autos 4 Climax Engineering 5 Johnson & Philips 6 K.S.B.Pumps 7 Nowshera Engineering 8 Pakistan Cables 9 Philips Electrical Industries
10 Punjab Lamp Eorks 11 R.C.D.Ball Bearings 12 Regnis Pakistan 13 Saif Nadeem Kawasaki 14 Saifee Development Corporation 15 Shaigon Electrical & Engineering 16 Siemens Engineering (pak)
PUBLIC SECTOR
17 Bela Engineers 18 Karachi Pipe 19 Mack Trucks of Pakistan 20 Metropolitan Steel Corporation 21 Millat Tractors 22 National Motors 23 Pakistan Engineering 24 Quality Steel

50
(4) SUGAR AND ALLIED GROUP Serial
Number Company
PRIVATE SECTOR 1 Al-Noor Sugar 2 Bawany Sugar 3 Charsadda Sugar 4 Crescent Sugar 5 Facto Sugar 6 Frontier Sugar 7 Habib Arkady 8 Husein Sugar 9 Kohinoor Sugar
10 Mehran Sugar 11 Mirpurkhas Sugar 12 Noon Sugar 13 Premier Sugar 14 Shahtaj Sugar 15 Shakarganj Mils 16 United Sugar
PUBLIC SECTOR
17 Thal Industries Corportation

51
(5) PAPER BOARD AND ALLIED GROUP Serial
Number Company
PRIVATE SECTOR 1 Adamjee Paper & Board 2 Baluchistan Partical Board 3 Chilya Corrugated Board 4 Crescent Board 5 Orient Straw Board & Paper 6 Packages Limited (Pvt) 7 Pakistan Paper Corporation 8 Pakistan Paper Products 9 Pakistan Paper Sack Corporation
PUBLIC SECTOR
10 Security Papers

52
(6) CEMENT GROUP
Serial Number
Company
PRIVATE SECTOR 1 Asbestos Cement Industries
PUBLIC SECTOR
2 Gharibwal Cement 3 Javedan Cement 4 Mustehkham Cement Industries 5 Zeal Pak Cement Factory

53
(7) FUEL AND ENERGY GROUP
Serial Number
Company
PRIVATE SECTOR 1 Atlas Battery 2 Burshan ( Pak) Ltd 3 Haroon Oil Ltd 4 Pakistan Burmah Shell 5 Pakistan Refinery
PUBLIC SECTOR
6 Attock Refinery 7 Karachi Electric Supply Corp 8 National Refinery 9 Pakistan Oil Fields
10 Pakistan State Oil 11 Sui Gas Transmission Co 12 Sui Northern Gas Pipelines

54
(8) THE 'MISCELLANEOUS GROUP'.
Serial Number
Company
PRIVATE SECTOR 1 Amin Fabrics 2 Crescent Jute Production 3 Indus Jute 4 Latif Jute 5 Mehran Jute 6 Pakistan Jute & Synthetics 7 Thal Jute 8 Exteaction Pakistan 9 Lever Brothers Pakistan
10 Arpak International 11 Bari Rice 12 Bata Pakistan 13 U.D.L Industries 14 Benz Industries 15 Brooke Bond Pakistan 16 Dadabhoy Padube 17 General Tyer & Rubber 18 Haji Dossa 19 Hashimi Can Company 20 Hilal Flour & General 21 Karachi Can Companyt 22 Lipton Pakistan 23 Milk Pak 24 Noon Pakistan 25 Pakistan Fisheries 26 Pakistan House International 27 Pakistan Services 28 Prince Glass 29 Security Safe Deposit Co 30 Service Industries ( Shoes) 31 Shabbir Tiles & Ceramics 32 Spencers & Co. Pakiistan 33 Syed Match Co. 34 Taj Mahal Hotels 35 Trans-Pak Corporation 36 Treet Corporation 37 Universal Leather & Footwear Industries
PRIVATE SECTOR
38 Associated Industries 39 Burma Oil Mills 40 Fazal Vegetable Ghee 41 Kakakhel Industries 42 Kohinoor Oil 43 Maqbool Company 44 Maorafco Industreis

55
45 Sh.Fazal Rehman & Sons 46 Suraj Ghee Industries 47 Universal Oil Vegetable Ghee 48 Wazir Ali Industries