munich personal repec archive - uni-muenchen.de · 0 3 5 $ munich personal repec archive the impact...
TRANSCRIPT
MPRAMunich Personal RePEc Archive
The Impact of Recentralization on PublicServices: A Difference-in-DifferencesAnalysis of the Abolition of ElectedCouncils in Vietnam
Edmund Malesky and Cuong Nguyen and Anh Tran
15. August 2013
Online at http://mpra.ub.uni-muenchen.de/54187/MPRA Paper No. 54187, posted 7. March 2014 08:12 UTC

Electronic copy available at: http://ssrn.com/abstract=2299120
1
The Impact of Recentralization on Public Services: A Difference-in-Differences Analysis of the Abolition of Elected Councils in Vietnam
Edmund J. Malesky Associate Professor
Duke University Department of Political Science
Cuong Viet Nguyen Researcher
National Economics University Hanoi, Vietnam
Anh Tran Assistant Professor
Indiana University Bloomington School of Public & Env. Affairs
Abstract: Comparative political economy offers a wealth of hypotheses connecting decentralization to improved
public service delivery. In recent years, influential formal and experimental work has begun to question the
underlying theory and empirical analyses of previous findings. At the same time, many countries have grown
dissatisfied with the results of their decentralization efforts and have begun to reverse them. Vietnam is particularly
intriguing because of the unique way in which it designed its recentralization, piloting a removal of elected People’s
Councils in ninety-nine districts across the country and stratifying the selection by region, type of province, and
urban versus rural setting. We take advantage of the opportunity provided by this quasi-experiment to test the core
hypotheses regarding the decision to shift administrative and fiscal authority to local governments. We find that
recentralization significantly improved public service delivery in areas important to central policy-makers, especially
in transportation, healthcare, and communications.
Acknowledgements: We are grateful to Jairo Acuna-Alfaro and the United Nations Development Program (UNDP) in Hanoi for sharing the respondent-level data for the Public Administration Performance Index Annual Survey. Early versions of this paper were presented at comparative politics seminars at Columbia University, University of Madison Wisconsin, University of California – San Diego, and Stanford University, and Duke University. The project was also presented at the Australia National University conference on Applied Microeconomics Research on Vietnam, the Freiburg University Conference on Methodologies for studying Southeast Asia, and the Brown University Conference on Subnational Politics. UNDP-Hanoi held a special session on the paper where comments were provided by representatives from Ministry of Home Affairs, the Vietnamese National Assembly’s Institute for Legislative Studies (ILS), and the Da Nang Department of Home Affairs. We are grateful for helpful comments provided by Pablo Beramendi, Lisa Blaydes, Anna De Le O, Do Thi Thanh Huyen, Thad Dunning, Tulia Faletti, German Fierhard, Tim Frye, Scott Gelbach, Don Green, Marcia Grimes, Guy Grossman, John Huber, Horacio Larreguy, Xiaobo Lu, Melanie Manion, Brian McCaig, Yotam Margalit, Mike Munger, Tom Pepinsky, Nancy Qian, Ken Scheve, Gunther Schultz, Sarah Shair-Rosenfield, Dororthy Solinger, Lily Tsai, Christian Van Lubke, Jeremy Wallace, Jeremy Weinstein, Erik Wibbels, Steve Wilkinson, and Meng Xin. Replication data and materials will be posted on the authors’ Dataverse websites (http://thedata.harvard.edu/dvn/dv/emalesky). All opinions and conclusions expressed herein are solely the responsibility of the authors.

Electronic copy available at: http://ssrn.com/abstract=2299120
2
In the past few decades, few comparative political economy debates have been as exciting as those concerning
whether decentralization leads to greater public service delivery. The literature has offered a wealth of intriguing
hypotheses connecting greater public participation, oversight, and accountability (often through elected councils) to
a variety of local outcomes.1 Although these studies have been highly influential for policy decisions and
international aid activities (see World Bank 1994), more recent formal and experimental work has begun to question
their underlying theory and empirical analyses (Treisman 2007). At the same time, many countries have grown
dissatisfied with the results of their decentralization efforts and have begun to reverse them (Dickovick 2011).
Unfortunately, the literature is ill suited to offer empirical predictions on recentralization efforts for two reasons: 1)
recentralization is a new phenomenon and therefore is under-theorized; and 2) the extant literature on
decentralization is fiercely contested, offering few findings that withstand theoretical and empirical scrutiny.
In this paper, we attempt to address these oversights by taking advantage of a unique quasi-experiment in
Vietnam that sheds light on the effects of allocating authority to subnational governments. When Vietnamese
leaders first began to consider the removal of District People’s Councils (DPCs), the topic was hotly debated both
within the Communist Party of Vietnam (CPV) and the Vietnamese National Assembly (VNA).2 Advocates claimed
that DPCs complicated decision-making by adding an extra node to policy design and implementation, which led to
sustained hold-ups and extra costs in service delivery, infrastructure rollouts, and land conversion, all of which were
necessary for economic development (TPCS 2009). Opponents contested the proposal on democratic grounds,
arguing that the councils represented an important forum enabling citizens to check the power of leaders and rein in
local corruption (CPV 2010). The dispute was contentious enough that Vietnamese officials followed a grand
history of pilot programs in Marxist-Leninist regimes3 and confined the recentralization intervention to ten
provinces (containing ninety-nine districts); this decision allowed them to observe the effects of DPC removal in a
1 See Wibbels (2006), Bardhan and Mookerjee (2008), and Treisman (2007) for helpful reviews. 2 Debates took place at the 5th Plenum of the CPV Central Committee 2008 and the 4th Session of the 12th VNA. 3 See Florini et al. (2012) for example.
Electronic copy available at: http://ssrn.com/abstract=2299120
3
contained setting before considering a full-scale rollout to Vietnam’s other fifty-three provinces and national-level
cities (National Assembly 2008).
What makes Vietnam particularly intriguing for researchers is the careful way in which it designed its
recentralization experiment. To ensure that the conclusions were not rooted in the particular selection of provinces,
officials stratified their selection by region, by urban versus rural, and by whether the province shared an
international border (GSRV 2009). In addition, they made sure to include provinces that varied in their initial
endowments, previous economic performance, and initial quality of public administration. Although not a
randomized control trial (RCT), the research design ensured balance on a range of pre-treatment covariates between
selected and non-selected locations. In other words, it is reasonable to consider the non-selected provinces a
plausible control group for isolating the causal effects of recentralization.
We take advantage of this quasi-experiment to test the core hypotheses of decentralization in the literature. Our
research design offers an overtime (diff-in-diff) analysis of real institutional change (not an artificial intervention)
with a clearly identified counterfactual performed at scale within one country; this design allows us to hold constant
the unobserved historical and cultural confounders that have limited previous work. As far as we know, this is the
first-ever empirical analysis with clear control and treatment groups on the abolishment of an elected council
affecting more than ten million people. The existing work on institutional change was conducted on a much smaller
scale and involved NGO or multilateral donor projects rather than national governments’ own initiatives and
ownership.
Studying a large number of services helps us avoid the temptation to cherry-pick particular outcomes that
confirm our hypotheses (Kramon and Posner 2012). We find that recentralization significantly improved a spectrum
of public services that were considered important to central policy-makers, ranging from quality of roads to
healthcare to the presence of post offices. By contrast, the intervention had no discernible effect on services
deemed important by Vietnamese citizens (education, agricultural extension, and household business development).

4
In a more speculative final section of the paper, we study the causal mechanism through which the DPC pilot
generated positive performances for services favored by central leaders. There are three candidate mechanisms that
might explain these results, including the removal of vertical accountability to citizens and improved efficiency
resulting from bureaucratic restructuring. We demonstrate that the most compelling explanation, however, is that
the pilot unblocked elite capture of the policy-making process. As researchers have argued in other contexts, the
purported benefits of decentralization for grassroots monitoring (Cheema and Rondinelli 1983; Huther and Shah
1998) can be undermined by local elites (politicians, businessmen, notables), who take advantage of their
concentrated political resources to manipulate public decisions in their favor (Reinikka and Svensson 2004; Bardhan
and Mookherjee 2006; Campos and Hellman 2005). We probe the observable implications of the elite capture
mechanism through a nationally representative public opinion poll of 9,452 respondents (UNDP 2011), showing
how recentralization reduced elite corruption in treatment districts.
1. The Literature on Decentralization
The past two decades have brought forth a rich debate in political science on the relative merits of locally
elected governments. Camps of scholars and practitioners disagree on the theoretical benefits of granting authority
to subnational units and the lessons learned from extant empirical work. At the same time, the rapid spread of
decentralization worldwide, which at its peak led to elections of local governments in 90% of countries around the
world (Rodden 2006), has subsided. A recent World Bank review of almost 500 studies reveals that the excitement
about the benefits of locally elected bodies was not met by real-world improvements in outcomes (Mansuri and Rao
2013). As a result, Argentina, Brazil, Chile, Columbia, Uruguay, South Africa, and a number of other countries have
started reversing some of these original decisions (Eaton 2004; Dickovick 2011). Vietnam is such a case.

5
Types of Decentralization
It is important to be clear from the start about where the Vietnamese DPC pilot fits into larger debates in the
literature. The pilot involved a specific Vietnamese governmental unit (the second-tier district) and a specific body
(the directly elected legislature). Scholars generally distinguish between modes of decentralization according to three
considerations:
1) The arenas in which power has been granted to local authorities: fiscal, administrative, or political (Faletti 2010;
Green 2005). A series of legal documents developed prior to the pilot provided DPCs with important fiscal
authority (over budget allocation, approval, and implementation). DPCs also have the authority to elect and remove
any member of the local executive (the District People’s Committees (DPCOMs)), procuracies, and courts. In
addition, they have oversight powers over all People’s Councils and People’s Committees of communes within their
jurisdiction.4 Thus, there are elements of fiscal and administrative decentralization (Fforde 2003). The DPCOM was
not removed in the pilot, however, so this is only partly administrative recentralization. National legislation on local
governmental organization also claimed to influence political decentralization through the DPCs’ universal election
by district citizens, but this claim is contestable. In fact, a key feature of the debate in Vietnam has concerned the
extent to which the DPC elections are actually democratic and the extent to which they provide downward
accountability to citizens (Nguyen Anh 2010).
2) The extent of the power provided: deconcentration, delegation, or devolution (Cheema and Rondinelli 1983; White
and Smoke 2005). Disentangling these three distinctions is tricky; most governments experience different types of
decentralization at the same time (Grindle 2007). Nevertheless, it is fair to say that the DPCs, because they are
under the hierarchal oversight of the Provincial People’s Council (PPC) and the leadership of the CPV, are
predominantly recipients of powers of delegation: their independent decision-making is highly circumscribed. The
ongoing recentralization experiment essentially makes district leaders agents of the province and thereby reinstitutes
deconcentration to the leaders of the treatment provinces. Following O’Donnell (1994), we can say that the move
4 See the Law on the Organization of Local People’s Councils and Committees (2003).

6
toward recentralization has shifted oversight of DPCOMs from horizontal accountability by DPCs to upward
accountability to provincial overseers.5
3) The level or node in the government hierarchy invested with authority: first tier (Rodden 2006), second tier
(Bardan and Mookerjee 2008), or below. The Vietnamese DPC is a second-tier unit, as it is accountable to the
provincial authorities above it and oversees the communes below it. What differentiates this study from previous
work on subnational elections in single-party regimes (see Tsai 2007 and Martinez-Bravo et al. 2010) is that the
district is an official part of the Vietnamese hierarchy, as opposed to the villages analyzed in China, which have very
limited authority.
The Costs and Benefits of Decentralization
The literature on decentralization is rife with controversy. A strong theoretical literature linked to some of the
most esteemed political thinkers has proffered a range of positive benefits to local engagement in politics. More
recently, a formal economic literature has generated a series of positive hypotheses regarding public service delivery
and economic performance.
Specifically, economists have argued that greater local authority in decision-making improves the efficiency of
public service delivery, because government outputs can be provided in small units and tailored directly to local
tastes (Oates 1972; Besley and Coate 2003). In addition, decentralization creates competition for capital and labor,
leading to improved governance outcomes; brings decision-making closer to citizens; and limits the role of central
government intervention in economic performance (Tiebout 1956; Inman and Rubinfeld 1997). Lab experiments by
Walker et al (2000) and Kroll et al (2007) provide suggestive evidence for the link between direct democracy and
efficient public good provision under ideal conditions. Furthermore, Hamman et al. (2011) find that democratic
5 Note that O’Donnell (1994) did not address upward accountability. He differentiated the horizontal accountability of institutions from vertical accountability to constituents.
7
delegation helps lab subjects avoid the free-rider problem and frequently achieve more efficient and equitable social
outcomes. Similar results are also found in psychology experiments (e.g. Wilke et al. 1986)
As Wibbels (2006) notes, however, work in political economy has laid bare the underlying assumptions of
decentralization theories (Weingast 1995) and in many cases has demonstrated that they are not met. Thus, the
economic benefits of decentralization often fail to appear in practice (Prud’homme 1995). Citizens and
entrepreneurs are often not fully informed about which level of government provides a particular service and
therefore either cannot take advantage of relocation (Rodden and Rose-Ackerman 1997) or are simply limited in
their mobility due to sticky labor markets and cultural differences within a country (Pepinsky and Wihardja 2011).
Newly empowered local authorities may not have the needs of citizens at heart, and they may not understand local
preferences better than their national counterparts (or than agents of the central government in the localities) (Cai
and Treisman 2004; Treisman 2007). A number of scholars have found that there is actually no clear division of
authority between the different nodes in a multi-tiered government (Bolton and Farrell 1990). As a result, service
delivery may even be less efficient, as decisions and implementation are held up by different levels of government
(Cox and McCubbins 1992; Treisman 2007) or by the loss of scale economies in provision as services are divided up
too narrowly (Bardan and Mookherjee 2008). In the language of the discipline, decentralization increases the
number of veto points in policy making, which biases toward status-quo policy choices and service provision
(Tsebelis 2002) so that multiple levels of government jointly provide poor public goods (Volden 2005; Wibbels
2005). Correspondingly, a lab-in-field experiment by Grossman (2012) suggests that centralized decision-making
(via democratic institutions) improves group outcomes.
Most importantly for our research, a subset of this literature has found that decentralization can actually
facilitate capture of the policy-making apparatus by local elites, especially by wealthy notables and large enterprises,
creating a company town atmosphere in which elections are undermined and policy is diverted to the benefit of the
powerful at the expense of other citizens (Reinikka and Svensson 2004; Campos and Hellman 2005).
Drawing on these arguments, we test the following hypothesis:

8
H1: The removal of local councils will increase the efficiency of public service delivery.
Of course, recentralization may not have the same impact on all public services equally. More likely, recentralization
may shift public services closer to the priorities set by the central government over those favored by the locality.
Martinez-Bravo et al. (2010) demonstrate that village elections and increased downward accountability in China
generated policy outcomes that were associated with local preferences. In this paper, we hypothesize that removing
locally elected councils will have the opposite effect.
In general, we can group Vietnamese public services into three very broad categories. The first category includes
transportation and communication infrastructure, such as local roads, public transport, post offices, radio, and
television networks. The second category includes health and education services to citizens, such as preventive
healthcare, health insurance, and local schools. The third category includes localized employment generation
programs, such as household business support, agricultural extension, veterinary services, tax exemptions,
subsidized credit, and the construction of market places.
The Vietnamese central government funds all categories of public services, but clearly gives top priority to
infrastructure, followed by health and education. Following an economic model in which state companies control
the leading national industries and give priority to large investors (both foreign and domestic), the central
government has offered little support to private, household farms and businesses. This order of priorities was made
clear in the 2001-2010 National Strategy for Socio-Economic Development (Central Committee 2000), which states:
“Infrastructure must move first to meet demands of socio-economic development as well as of national
defense and security. The transport system is to be smooth and safe all the year round, and modernized. The
rural transport network is to be expanded and upgraded. The dyke systems are to be fortified; the water
conservancy systems developed and most of them solidified. Electricity, telephone, other basic postal and
telecommunication services, dispensaries, solidly built schools, cultural and sports facilities are to be
available to most communes. To ensure the basic physical conditions for primary and secondary

9
schoolchildren to learn all-day at school. To provide enough hospital beds to patients” (“Strategic Goals
Section” 8-10).
The Strategy also emphasizes the leading role of government corporations (p. 10). The strategy discusses state-
owned enterprises (SOEs) at eleven points, while it mentions small and medium enterprises only three times.
Reducing agricultural output to 16-17% of the GDP and the employment rate to 50% of the total labor force are
considered two of the state’s “strategic goals.” These priorities have been operationalized in many official
documents, such as the National Five-Year Plan and the Action Plan of the Government.
Local citizens, however, seem to have a different order of priorities, according to Vietnamese responses in the
MyWorld survey. Out of 16 items, Vietnamese citizens prioritized: education (76%), healthcare (62%), responsive
government (51%), and job opportunities (45%). Better transportation and communications infrastructure ranked
much further down the list: water and sanitation (32%), transport and roads (31%), and phone and internet access
(15.4%).6 Further disaggregating preferences, health services are more frequently needed than educational services.
The 2008 VHLSS shows that 68% of citizens report that their families use local health services, while only 38% of
citizens report that their families use secondary schools. Thus, we expect:
H2. The removal of local councils will shift public service delivery toward the priorities set by the central government. In particular, we expect that improvements in infrastructure for transportation and communication are more
likely than those in health and education, which are favored by both the public and the central government, and far
more likely than those in household farm and business support, areas in which the central government has
demonstrated little interest.
6 See http://data.myworld2015.org/ for details (see Online Appendix A for full results). The MyWorld survey is an online, self-selected platform that is rife with selection bias, but similar preference orderings can be seen an econometric analysis of the 2011 UNDP-PAPI survey (see Online Appendix B (attached below) for analysis)
10
Extant Empirical Analyses
In addition to the theoretical limitations of the decentralization hypothesis, the literature has also been sharply
criticized for the quality of empirical evidence justifying the causal relationships hypothesized. Treisman (2007), for
instance, devotes the entire eleventh chapter of his book to demonstrating the contradictory empirical findings,
weak evidence, and lack of robustness of previous work. He summarizes his conclusions by quoting Litvack et al.
(1998).
“Much of the discussion of decentralization reflects a curious combination of strong preconceived beliefs
and limited empirical evidence…. It is not an exaggeration to say that one can prove or disprove almost any
proposition about decentralization by throwing together some set of cases or data” (13).
Previous work generally falls into three categories. A large number of scholars have examined the
decentralization process within individual countries both quantitatively and qualitatively, trying to derive
generalizable conclusions from their studies. While this work has shed light on the particular forms of
decentralization, these deep single-country studies have had difficulty establishing causality. In almost every case,
decentralization occurs as a uniform policy, affecting every subunit of government at a particular level at the same
time. Thus, there is no control group and no way to see the trajectory a subunit would have followed in the absence
of the decentralization policy. This is particularly problematic because decentralization almost always occurs in the
midst of other major institutional and policy reforms (democratization, economic opening, end of conflict). There is
simply no way to hold constant the multiple policy, economic, and socio-cultural changes taking place at the same
time that could generate the same causal outcome.
An alternative approach has been to leverage large cross-national datasets to search for patterns in the data. Do
countries with greater amounts of authority invested to subunits demonstrate better economic performance, public
service delivery, lower inequality, and better governance? Numerous studies have taken this approach, resulting in a
wide range of diverse but often contradictory findings. Although most of the scholars behind these studies
demonstrate great empirical savvy, their approach is ultimately hampered because decentralization is not
11
exogenously assigned across countries. States choose to decentralize for a variety of reasons: some hope to distance
themselves from an authoritarian past (e.g. Indonesia); others hope to avoid civil conflict between regionally
concentrated ethnic groups (e.g. Kosovo, the Czech Republic, and Russia (Hale 2004)); some face pressure from
international financial institutions (Eaton 2004); some are accommodating electoral outcomes or the career
aspirations of local officials (Grindle 2004); and still others expect economic benefits. If these decisions are
correlated with the outcome variables, the underlying motivation may generate the causal outcome; decentralization
may be just one of many policies symptomatic of the desire to achieve that goal.
A final strand of the literature has sought to test particular implications of decentralization using randomized
controlled trials (RCTs) in which treatment is randomly assigned to a set of locations within a country, allowing the
researcher to observe the effects of decentralization in the treatment group and compare the outcomes to a control
group of similar units. This technique simultaneously resolves the problem of the missing counterfactual in the case-
study literature and the unobserved heterogeneity in the cross-national literature, as the experiment takes place
within one country and scholars know that the assignment of the treatment is orthogonal to any underlying
economic conditions or cultural factors within that one country. This work is just in its infancy, but it has begun to
yield findings that question the logic of decentralization. Olken (2007), for instance, has used RCTs in Indonesia to
demonstrate that participation in village councils is not associated with reductions in corruption. Humpreys et al.
(2006) use an RCT to study how participatory processes may be influenced and coopted by local leaders.
While RCTs such as these certainly represent a positive development in terms of their ability to isolate causal
effects, on the question of decentralization they are often constrained by artificiality and political feasibility.
“Accountability meetings” and comment cards designed to elicit community participation are often new innovations
in the locations being researched. They did not preexist the experiment and will not continue afterward. Findings
from studies like these therefore pose a challenge to government officials who are deciding to alter institutions with
long histories in a given locality and impose a new set of institutional rules that citizens will perceive as permanent.
It takes time for citizens to become accustomed to institutional processes, to learn how they work and how they can
12
best make use of them (Knight 1992). Moreover, the shadow of the future matters as well. The effort and time a
citizen invests in using a new institution may be strongly related to how long he or she expects it to operate in his or
her locality. Because of this, limited information can be drawn from mechanisms of decentralization that are only
conceived and tested within the experimental setting. Another limitation of RCTs is that they are constrained to
small settings, usually at the village level, by budget and political parameters. It is hard to imagine the political
feasibility of an RCT trying to abolish a democratic institution at the district level, an experiment that could
potentially affect millions of people.
Ideally, then, researchers need experiments put forward by governments themselves that seek to test the impact
of real institutions currently existing in the country or institutions that will be employed if the experiment proves
successful. Our study follows in this vein. In 2008, Vietnamese authorities sought to remove a local institution that
had been enshrined in the 1992 Constitution and that had been empowered by a series of decentralization reforms
thereafter. Because the removal was internally controversial and potentially unconstitutional, Vietnamese authorities
chose to pilot the program in a limited sample, providing a unique opportunity to observe changes in treatment and
control areas over time. We explore the motivation and selection processes for the recentralization pilot below.
2. DPCs and Vietnam’s Government Hierarchy
Vietnam’s government architecture has both horizontal and vertical dimensions. Horizontally, the system is
separated into executive, legislative, and judiciary branches. Vertically, the system consists of the central, provincial,
district, and commune levels (Figure 1 reproduced from Fforde 2003).7 The horizontal division is then replicated at
each subnational level, so that branches of the executive (People’s Committee), legislature (People’s Council), and
judiciary (People’s Court/Procuracy) exist in every subnational unit in the country (Fforde 2003). Certainly, Vietnam
is a single-party regime, so all government institutions are subordinate to the CPV at each level. In a combination of
its French and Marxist-Leninist legacies, Vietnam follows a parliamentary system, which means that citizens vote to
7 Vietnam has 63 provinces and cities, 696 districts, and more than 11,000 communes.
13
elect their representatives in the legislative branch (National Assembly (NA) and People’s Councils (PCs)), who in
turn elect the leadership of the executive branch and appoint the heads of the judiciary branch. Citizens vote to
directly elect each of these legislative bodies at national, provincial, district, and commune elections.
[Figure 1 about Here]
District People’s Councils
Districts, the focus of this paper, are intermediate administrative units, lower than provinces in the government
hierarchy and higher than communes.8 In terms of function, DPCs perform three major tasks: appointing district
personnel, making district policies, and overseeing district authorities.
Under the first task, DPCs elect the executive branch of the district authority, which is the District People’s
Committee (often abbreviated as DPCOM to distinguish from the elected councils). DPCs maintain the authority to
elect or dismiss the chairperson and all members of the DPCOM. Members of DPCs have the ability to formally
question the Chairperson of the DPCOM, as well as the heads of the procuracy, courts, and other district offices
during DPC sessions. Under the second task, DPCs approve annual socio-economic development plans, determine
the district budget, and make district policies in most public policy areas, including infrastructure, agricultural
extension, education, and healthcare. DPCs make decisions by passing resolutions, which are conducted through
majority-rule votes. Under the last task, DPCs oversee all of the government offices of communes within their
borders. This oversight task includes reviewing periodic reports, making queries, reviewing legal documents, making
oversight visits, and conducting votes of confidence.
In terms of organization, DPCs have between 25 and 35 members, depending on the size of the district’s
population.9 Each includes one chairperson, one vice chairperson, and several standing members, all of whom work
8 The average district population is roughly 120,000 people. 9 This is stipulated by the 2003 Law on the Election of People’s Councils. See also Fforde (2003).
14
for the DPC on a full-time basis as part of the standing committee. Other members work part-time for the DPC
(i.e. participate in DPC meetings) and have separate full-time jobs. DPCs have very limited authority to raise
revenue on their own; funding and resources for DPC operations come mainly from provincial government
budgets.
Each DPC maintains a walk-in office, which is open daily to consider, receive, and respond to constituent
requests. DPCs are expected to hold regular public meetings with constituents and report to them about the
activities of the DPC and the District People’s Committee. Because of these functions, opponents of DPC removal
often present an idealized version of DPCs as bastions of democracy (Nguyen Anh 2010).
Limits on DPC Authority
It is important not to exaggerate the importance of DPCs, which operate in a highly constrained political
environment. The true amount of downward accountability to voters is highly disputed. Vietnam remains a single-
party regime, and candidates for public office are vetted by the CPV. While seats are contested by multiple
candidates and turnout is high10 because voting is mandatory, it is not clear how much information Vietnamese
citizens actually possess about the candidates or the district election process. In the 2011 UNDP-PAPI survey, only
5.8% of citizens could correctly answer all three basic questions on a civics test of which institutions were subject to
elections and the length of officials’ terms. 14.8% missed all three questions (UNDP-PAPI 2011). Rather than
providing vertical accountability (O’Donnell 1994), low-quality elections and limited voter information allow DPCs
to be captured by local elites who can nominate favored candidates for positions, manipulate candidate vetting in
their favor, and use their informational advantage to make sure their choices are elected (Malesky and Schuler 2011).
Because these same local elites are also represented on the DPCOM, the DPC has a very hard time fulfilling its
oversight role of the local executive (Vu 2012, p19; Van Arkadie et al. 2010, p155). As Van Arkadie et al (2010)
10 The UNDP-PAPI (2012) found that 68% participated in the 2012 election, with 10% answering no, and 21% refusing to answer.
15
colorfully put it in a review of Vietnam’s decentralization efforts, “Local government is seldom transparent; so that
decentralization has sometimes seemed to have resulted in a kind of bureaucratic patrimonial localism (p185).”
Prior to the pilot, DPCs were considered to be paper tigers by most analysts of local governance (Kerkvliet
2004). As in China, DPC officials are generally party members and therefore must be accountable to party superiors
in their district and province, which limits their decision-making authority (Whiting 2004). By convention, the
district Party Secretary usually serves as Chair or Vice-Chair of the DPC as well, allowing the local party to influence
DPC decision-making. In addition, full DPCs only meet twice a year and are represented by small standing
committees when out of session. Finally, the DPC is only one of three assemblies that operate at the local level, so
their initiatives must consider the framework imposed by Provincial PCs and anticipate the implementation of
Commune PCs. Together, these limitations bias against finding a significant effect of the removal treatment.
Removal of DPCs
The idea of abolishing DPCs was proposed from the top down. In August 2007, the Central Committee of the
CPV debated and passed Resolution 17-NQ/TW, directing the government to take stronger action regarding public
and local government reform. The resolution pointed out the problems of the current public administrative system
in Vietnam, and hinted that it was facilitating abuses, waste, and hold-up problems created by local leaders:
“Our public administration has many limitations and weaknesses… The functions and responsibilities of
various bodies within the public administration system are vague, overlapping and missing; the state
hierarchy is burdensome and inappropriate. The qualifications of the cadre and officials do not meet the
requirements; red tape and waste are pervasive. Institutions and regulations for public finance management
have many problems” (Central Committee of CPV 2007, p1).
One of the main solutions laid out in Resolution 17 was to abolish DPCs and simplify current district
governments into provincial government administrative agencies for handling district tasks (p. 8-9). However, this
solution faced considerable objection by the central government, VNA, local authorities, and mass media.
16
Opponents of this solution pointed out that DPCs are a key democratic institution for promoting the interests of
local populations. Pham Minh Tuyen, Chairman of the National Assembly’s Committee for Delegate Activities,
asked: “Who would examine and keep checks on the administration at the same level? Wouldn’t increasing
members of the Provincial People’s Council and increasing meeting times also add extra costs to the budget?”
Objections were also registered in the highest echelons of the political hierarchy, including by the Vice Chairman of
the National Assembly, Nguyen Duc Kien (Nguyen Anh 2010).
On the other side of the debate, supporters of the removal emphasized the inefficiency and ineffectiveness of
DPCs, claiming that the time, money, human resources, compromises, and impasses involved in DPC deliberations
were considerable. Pham Phuong Thao, Chairwoman of the Ho Chi Minh City People’s Council, estimated that the
removal of each DPC in Ho Chi Minh City would save up to $85,000 each year (Pham Thao 2008). Furthermore,
Vietnam had four such representative bodies, raising the question of whether the cost of maintaining DPCs was
justified by the benefits (Nguyen Thao 2010; Van Tat Thu 2010). Removal advocates pointed out that DPC
functions could easily be handled by “upper and lower bodies” (Nguyen Thao 2010).
When resolution could not be reached in the debate, a consensus quickly emerged that the impact of DPCs was
essentially an empirical question that should be addressed by experimentation.
3. Experimentation with DPC Removal
In December 2008, the National Assembly passed Resolution 26, allowing for the piloting of DPC removal.
Given its paramount importance, the government created a National Steering Committee headed by the Prime
Minister to coordinate this institutional experiment. Under the direction of the National Steering Committee, the
Ministry of Home Affairs (MOHA) and various government agencies actively prepared for the launch of the policy
experiment (GSRV 2009).
17
Selection of Treatment
MOHA was given the task of designing the pilot in order to “provide an objective and scientific evaluation of
DPC removal (GSRV 2009, p1).” One of the key issues in the design was the selection of the treatment group.
Researchers from MOHA conducted a series of workshops across the country to receive input from policymakers,
social scientists, and the public. They then came up with a set of selection criteria, which they presented and on
which they received feedback from line ministries and committees of the VNA. In January 2009, the government
submitted a proposal to the VNA, which laid out four criteria for the selection of the treatment group:
1. The sample size of the treatment should be sufficient for scientific evaluation of impact.11
2. The sampling should be stratified by region and subregion of the country.
3. The sampling should be stratified by city versus rural, lowland versus highland, midland versus
internationally bordered land.
4. The sampling should be stratified by socio-economic and public administration performance.
Upon reviewing this proposal, the Standing Committee of the VNA passed Resolution 724, listing ten provinces
(99 districts) in the treatment group, which had been selected according the four criteria above. The remaining 53
provinces (498 districts) would serve as the control group. Figure 2 demonstrates how the selection was stratified by
subregion and national-level city.
[Figure 2 about Here]
While the MOHA researchers were careful, the experiment is certainly not an RCT. Consequently, it is
important to assess whether the treatment and control groups are balanced on observable characteristics. Such
information would provide tentative evidence that the selection criteria were exogenous to the outcomes and
therefore that the intervention can be treated as a quasi-experiment (Dunning 2008).12 Table 1 provides a balance
11 The statistical power calculated by the Ministry of Home Affairs (MOHA) indicated that the treatment sample size should be around 16% of the total localities in the country (GSRV 2009). 12 A more stringent test would consider whether the process approximates “as if” randomness and therefore can be considered a “natural experiment” (Dunning 2008).

18
table of 46 economic, natural, demographic, governance, infrastructural, and legal indicators, measured prior to the
intervention. The first two columns show the simple means of the two groups in these indicators. Since national-
level cities13 were oversampled to test whether the experiment was applicable in urban settings, they comprise 30%
of the treatment group and only 4% of the control group. Consequently, the treatment provinces appear to perform
better in several areas. When excluding national-level cities, however, the differences between the two groups
virtually disappear.
[Table 1 about Here]
In addition to cities, MOHA also stratified their selection by region, so to ensure that each of the country’s
seven regions was represented (excluding the Central Highlands for security reasons). This makes it necessary to
perform a true balance test within each region, as if analyzing an RCT with a stratification strategy. To this end, we
regress these 46 indicators on the treatment dummy and control for two key criteria used for stratification (national-
level city and region-fixed effect). Column ‘P-treatment’ in Table 1 reports the p-values of treatment in these 46
regressions and shows that the treatment is not significantly correlated with 45 of these characteristics. In other
words, the balance between the treatment and control groups seems to be as good as in stratified randomization, at
least in all observable dimensions.
Selection based on unobservables is a possibility, as MOHA may have selected leaders that were considered
more pliant or more likely to implement successfully. Because of the approach, we can never know for certain, but
we do test to see whether the treatment provinces differ on leadership questions used in the Vietnamese Provincial
Competitiveness Index (PCI), an annual survey of 10,000 Vietnamese firms (Malesky 2009). These questions are
included in the governance panel of Table 1. We find no evidence that the 2008 respondents thought their
provincial leaders were better at working within the law, more creative and clever, or more likely to risk punishment
than leaders of control provinces.
13 They are metropolises with the status of provinces: Treatment: (Hai Phong Da Nang, and Ho Chi Minh City); Control (Ha Noi and Can Tho).

19
Implementing the Pilot Intervention
Following Resolution 26 of the VNA, the Government and Ministries issued a series of documents guiding the
DPC abolishment experiment. The 2004-2009 DPC term ended on April 25, 2009, and DPC elections were not
held in experimental locations after this date. The existing personnel of DPCs had their responsibilities transferred
to executive People’s Committees in the same districts or provinces. The three existing functions of DPCs were
transferred to different government bodies. The selection and dismissal of DPC personnel was assigned upward to
Provincial People’s Committees, which were also charged with appointing the new body. Policy-making and budget-
approval functions were also transferred to the Provincial People’s Committees. Finally, general oversight was
transferred to the Provincial People’s Councils. This transfer of power clearly implies that the nesting of districts
within provinces will impact our ability to draw correct inferences, and that districts cannot be considered as
independently drawn.
The abolition of the DPC system could have critical implications for public services and programs as well as for
general wellbeing within each district. As we discuss in Section 1, the theoretical literature does not provide a clear
guide as to whether this abolition would lead to improvement or deterioration of public services and governance at
the district and commune levels.
4. Our Empirical Design
To analyze whether DPC abolishment improved public service delivery, we take advantage of a unique panel
dataset that allows for a difference-in-difference (diff-in-diff) analysis on key outcome variables considered
important by local and national leaders.
Data Source
To ensure reliable estimates of local performance over time, we use commune data from the three most recent
Vietnam Household Living Standard Surveys (VHLSS) in 2006, 2008, and 2010. These surveys were conducted by
20
the General Statistics Office of Vietnam (GSO) with technical support from the World Bank. The 2006 and 2008
VHLSSs use the 1999 Population and Housing Census as a sampling frame, while the 2010 VHLSS uses the 2009
Population and Housing Census as a sampling frame.
The VHLSS has two components. The first is a stratified welfare survey of around 9,000 households. In
addition, research teams are instructed to collect “hard data” from commune leaders and are provided a checklist to
help gauge whether basic services are being met, such as whether or not the commune has a post office or an
agricultural extension center. Information on commune characteristics was collected from 2,280, 2,219, and 2,199
randomly selected rural communes in the 2006, 2008, and 2010 surveys, respectively. Commune data includes
information on commune demography as well as on general economic conditions and aid programs, non-farm
employment, agriculture production, local infrastructure and transportation, education, health and health facilities,
and social problems in the communes. Importantly, the commune dataset only includes rural communes, omitting
the ward, the equivalent bureaucratic unit within cities. All analysis, therefore, only studies the impact of
recentralization on rural localities using the hard data collected from communes.14
Estimation methods
To examine the effect of the removal of People’s Councils, we employ a difference-in-differences estimator and
commune data from the 2008 and 2010 VHLSSs using the following specification:
,ititittittit XDTDTY εδθγβα +++++=
where Yit is the outcome of rural commune i at time t. Tt is a dummy time variable that equals 1 for 2010 and 0
for 2008, the baseline year before the treatment commenced in 2009; the 2010 year is the follow-up year after
14 More technically, Vietnam divides communes into three categories: 1) rural communes (xa); 2) rural district capitals (thi tran); and 3) urban wards (phuong). Category 3 is not covered by the VHLSS rural data. Urban, however is a slippery concept and some peri-urban areas certainly sneak back into the sample in two ways. First, all five national-level cities include both wards and rural communes, which are more urbanized and densely populated than the average huyen. Secondly, thi tran can be highly developed and populated in some areas. Dropping peri-urban areas from the analysis does not alter our results.
21
treatment implementation. Dit is the treatment variable that equals 1 for communes that had their DPCs abolished
and 0 otherwise. We interact Tt and Dit to produce the coefficient θ, which is the Average Treatment Effect (ATE)
of the treatment on commune outcomes over time. Xit is a vector of control variables that are employed to capture
minor imbalances in commune characteristics resulting from the fact that the VHLSS commune sampling strategy
was not perfectly aligned with the DPC experiment.
The nested nature of the data poses a unique challenge. Communes can certainly not be treated as independent
as they are clustered within districts, which control important financial and administrative decisions. The standard
approach in such a situation is to cluster standard errors at the treatment level (the district), which will limit biases
caused by the correlation of errors within a unit. The nature of the selection process, however, poses an additional
conundrum. The selection of all districts within ten provinces (with only limited exceptions) implies an additional
level of clustering that must be taken into account, especially as the district responsibilities had by that time been
transferred upward to the provincial councils. To deal with this problem, we adopt the multiway clustering
technique of Cameron et al. (2011), which allows us to address the correlation of errors among communes at both
the district and provincial levels simultaneously.15
Choosing the appropriate dependent variable for the analysis is also not trivial. As Treisman (2007, Chapter 11)
notes, the analyst’s choice of variable for gauging public service delivery has critical implications for whether
decentralization is deemed successful. Kramon and Posner (2012) lodge a similar complaint about the cherry-
picking of dependent variables in analyses of redistributive politics. To avoid this temptation, we employ as many
outcome variables as we can find in the VHLSS that meet two criteria: 1) They are in areas under the authority of
DPCs according to the 2003 Law on the Organization of People’s Councils and People’s Committees
(infrastructure, communication, public health, education, agricultural extension services); and 2) They are factors
15 Implemented using STATA’s ivreg2 procedure. In an even more conservative approach, we also re-run the core analyses only at the province level, as this is where selection occurred. This approach is risky because of the limited degrees of freedom provided by 58 provinces. Despite the limited precision of the estimates, however, we find similar results for all aggregate indices. Please see Online Appendix F for provincial-level results on aggregate indices.

22
that could possibly be altered by local leadership within the one-year time frame under investigation. For instance,
measures of household wealth and productivity are available, but it is hard to imagine that district policies could
radically alter the career choices and income streams of respondents within one year. We identify thirty outcome
variables that fit these criteria, employing the exact same specification for all of them.16
As noted above, provincial selection was stratified, so treatments are representative of every region (except the
Central Highlands) and national-level city by design.17 As suggested by Bruhn and Mackenzie (2009), we include
dummy variables for regions and cities in order to ensure that these design choices do not lead to over-estimation of
treatment effects. Other control variables include commune location and population density. It should be noted that
control variables should not be affected by the treatment variable, i.e., the removal of the People’s Councils in our
case (Heckman et al. 1999; Angrist and Pischke 2008). Thus we limit control variables to more exogenous variables
where minimal non-balance has been detected at the commune level. Our results are robust to eliminating these
controls.
Table 2 presents the regressions of commune outcomes on time, treatment, and interaction between time and
the treatment variable, as well as other control variables for the first seven of the selected outcome variables.18 We
provide mean values of the dependent variable in 2008 in order to estimate the amount of room available for
improvement. The highlighted row (time*treatment) depicts the ATE for our analysis. In this set of outcome
variables, we find that the ATE was positive and statistically significant. For instance, all-year roads have grown
8.7% faster in the treatment than in the control group; public transportation has grown 10.2% faster. Of course, not
16 A listing of the exact wording used on the data collection instrument for each indicator is included in Appendix C2. 17 We dropped observations from the Central Highland regions, since the government did not conduct the experiment of the People’s Council removal in this region. A dummy is needed for national-level city, as these predominantly urban metropolises also include rural districts (huyen) that are included in the VHLSS survey but have access to services that are different from rural districts in rural provinces. 18 Please see Online Appendix C1 for descriptive statistics for all independent and dependent variables used in the analysis. Online Appendix D provides the full set of thirty regression results.
23
all outcome variables were significant, but as Figure 3 shows, the experiment revealed a disproportionately high
number of positive effects.
[Table 2 about Here]
In Figure 3, we present the ATE along with a 90% confidence interval. Intervals that do not cross the dashed
line are significantly different from zero. ATE results are organized by type of public service. Here, we see that the
effect of District People’s Council removal is statistically significant for 11 out of 30 outcomes (over one third!),
nine of which are in a positive direction. Such a large number of significant findings would not be predicted by
frequentist statistics, an inference to which we return below.
[Figure 3 about Here]
A few additional patterns emerge from careful inspection. The treatment appears to have been particularly
successful at improving transportation infrastructure (road, public transport, and socio-economic projects),
communication infrastructure (television broadcasting and post offices), and health care (assistance with fees and
public health projects). Under the current law, DPCs have the authority to shape local policies and decisions in
these sectors. The effects we find here suggest that removing such authority actually improves these public services.
Most other outcome variables, particularly educational measures and agricultural extension, did not show significant
improvement. On two outcomes, the treatment had a deleterious effect. Treatment provinces were less likely to
have business credits and veterinary visits.
To probe these aggregate patterns more directly, we construct six additive indices for: 1) transportation
infrastructure; 2) agricultural support services; 3) public health services; 4) education services; 5) communication
infrastructure; and 6) support for household business development. The variables can be identified directly under
the respective headings, which are capitalized in Figure 3. The indexing strategy is as conservative as possible,
simply a sum of all the dichotomous measures. In a few cases, the variable under investigation is continuous (e.g.
the share of households receiving credit). In these cases, we re-scale the variable to range between 0 and 1 and add it
to the index. We then re-run the diff-in-diff analysis on the six additive indices. The results can be seen in Panel 1 of

24
Table 3. The results confirm H2. Removing DPCs definitely generated positive improvements for districts in areas
that were of strategic importance to central leaders (infrastructure and public health). These results are quite
substantial and statistically significant. In areas where citizens may have preferred more assistance, the treatment
appears to have been less effective (agriculture, education, and household business development). While individual
indicators prove significant in each one, these are undermined by lack of improvement in other areas.
<Table 3 About Here>
5. Robustness Tests
At first blush, the findings appear compelling and confirm that recentralization can improve the efficiency of
public service delivery (H1), especially in arenas that are of explicit importance to the central government (H2).
Nevertheless, the nature of selection and the implementation of the rollout pose a number of threats to validity. In
this section we tackle these threats one by one: 1) The Parallel Paths Assumption; 2) Spurious Correlation; 3) Motivated
Interference by Central Officials; and 4) Hawthorne Effects.
The Parallel Paths Assumption
The diff-in-diff estimator identifies the impact of the treatment under the assumption that the unobserved
difference between the treatment and control groups is time-constant between survey rounds. In other words, we
should not observe differential trending between treatment and control groups in the same direction as in the
experiment in prior periods. We test this assumption by running diff-in-diff regressions using commune data from
the 2006 and 2008 VHLSSs. The two surveys were conducted before the intervention in 2009, and therefore we
should expect that the effect of the interaction between the time and treatment variables should not be statistically
significant. The lower panel of Table 3 depicts the results of this analysis for the six aggregate indices,19 which
confirm the assumptions of the model. Only two out of 30 outcome variables are significant and positive in the pre-
treatment period. In only one case is the ATE for an index statistically significant, but it is in the wrong direction.
19 Full results for all thirty dependent variables are available in Online Appendix D.
25
Infrastructure was actually worse for treatment provinces before the removal of DPCs. For instance, road quality
improved at a slower rate in treatment than control provinces between 2006 and 2008, so that treatment provinces
were starting from a slight deficit at the time of the intervention. A few individual variables also demonstrate this
pattern, but these deficits should only make it more difficult to identify effects of the treatment. Far more
dangerous would be positive trending continuing into the experimental period, which would lead to bias in the
treatment effect coefficient. We observe no such cases, however, indicating that pre-experiment trending in the
treatment provinces did not contribute to the results observed in 2010.20
Randomization Inference Test
Another empirical concern is that the effects of the treatment are simply the result of a lucky draw from the
universe of possible outcome variables. In other words, a critic might conjecture that there is nothing special about
the treatment at all. If we simply repeat the analysis post-hoc and randomly assign a “treatment” across the
observed differences, 11 significant outcomes would be well within the range of possible outcomes.
To this end, we conduct a randomization inference test, where we perform 1000 Monte Carlo Simulations,
randomly assigning an artificial treatment and then regressing outcome variables on our treatment with the exact
same specification used above. Figure 4 presents the results of this analysis. Here, we show the number of total
significant and significantly positive outcomes observed in the DPC experiment (long-dashed line), the pre-
treatment 2006-2008 analysis (short-dashed line), and each Monte Carlo simulation. Notice that while the pre-
treatment trends fall well within the range of significant outcomes that could be obtained by pure chance, the DPC
experimental results were not reached in a single one of the 1000 simulations.21
[Figure 4 about here]
20 Online Appendix E tests the parallel paths assumption using only provincial-level aggregates as well. 21 See Online Appendix G for further elaboration of this test.
26
The DPC experiment’s positive effect on public service delivery cannot be brushed aside as pure coincidence. It
seems quite clear that abolishing the elected council improved the efficiency-important set of public services,
supporting H2.
Motivated Interference by Central Officials
Skeptics might argue that central officials wanted the experiment to be successful and, despite pretending to be
careful about selection, actually manipulated the results by providing greater resources to the treatment group. This
bias would explain the positive results but destroy our ability to draw theoretical inferences regarding the impact of
recentralization. To test for such interference, we collect data on direct and indirect central transfers to each
province between 2006 and 2012. If transfers diverged significantly between treatment and control groups over this
period, this would provide strong evidence of elite manipulation of the experiment.
The results of this analysis are presented in Figure 5. Panel 1 presents the trend in total transfers per capita over
time, where treatment provinces are depicted with straight lines and control provinces with dashed lines. Panels 2
and 3 divide overall transfers into non-targeted (or equalizing) transfers (to make up for local budget deficits) and
targeted transfers for central government programs in infrastructure, poverty alleviation, and environment. Finally,
Panel 4 depicts the share of provincial own-source revenue that the location is allowed to retain. Eleven wealthy
provinces must share between 75% and 10% of own-source revenue with the central government, providing an
implicit transfer that is embedded in the target amount. In all four cases, we can see clearly that control provinces
received a greater share of resources per capita over the entire period under investigation, beginning in 2006 before
the experiment and continuing afterward. While all four charts show increases in transfers after the experiment,
there is no evidence at all suggesting that special treatment was given to treatment locations. A t-test provided in the
legend provides additional confirmation, showing that treatment provinces did not receive statistically significant

27
increases in any form of transfers between 2008 and 2010. We also investigate a tranche of funds available to the
Vietnamese Government for special projects to see if they were employed in a biased manner.22
Vietnam also engages in indirect transfers to subnational governments through state-owned banks and centrally
managed state-owned conglomerates (Pincus et al. 2012). State-owned banks do not release their lending portfolios,
but it is commonly estimated that 70% of their loans go to SOEs (Malesky and Taussig 2009). Because we cannot
access state-owned bank balance sheets, we rely on firm-level data from the GSO Enterprise Census over the
research period. Using the annual census, we create measures of aggregate liabilities held by centrally managed
SOEs in the province as a proxy for state bank lending in Panel 5. We also track ‘owner’ equity, which gives us a
sense of the share of capital introduced to the SOE through the national budget in Panel 6.23 We standardize both
figures by nominal, provincial GDP. Treatment provinces do have larger average allocations of state lending and
slightly higher owner equity over the research time period. There is no evidence, however, of disproportionate
increases in these figures. In fact, liabilities in the control group actually grew at a faster rate after 2008.
<Figure 5 about Here>
Hawthorne Effects
A related concern is known as the Hawthorne effect, whereby a treatment group experiences gains not because
of the experiment, but because they received special treatment and observation (French 1950). In the Vietnamese
case, this may have come in the form of a special unit from the Ministry of Home Affairs (MOHA) observing
progress. Fortunately, a limited budget prevented MOHA from evaluating all ten treatment provinces. Rather, they
chose to evaluate and survey citizens from five treatment and five control provinces, allowing us to disentangle the
effect of having central officials in suits roaming the province from the actual effects of DPC removal.24
22 Results are available in Online Appendix K. 23 In addition, we collect data on Central SOE investments, assets, and new construction outlays. These are presented in Online Appendix L. Results are very similar to these measures. 24 The MOHA evaluation teams visited five treatment provinces (Lao Cai, Nam Dinh, Quang Tri, Da Nang, HCMC) and five control provinces (Yen Bai, Thai Binh, Quang Binh, Can Tho, Ha Noi). MOHA was careful to match these control locations on most descriptive characteristics. Each of the evaluation groups includes three

28
To test for Hawthorne effects, we replicate the analysis in Section 4 but with a slight twist – we impose a triple
interaction of time, treatment, and whether the province received a MOHA delegation to survey citizens (survey).
These results can be observed in Table 4. Panel 1 reports the regression coefficients. The first thing to notice is the
interaction term (time*treatment), as this term represents the treatment effect without the contamination of MOHA
visitors. Even though only five treatment provinces were surveyed, making statistical significance more difficult to
achieve, the ATE remains sizable and positive for transportation, health, and communication. Moreover, it is still
strongly significant for health and communication, indicating that MOHA visitors did not influence these results.
[Table 4 about Here]
Two further differences are critical for assessing whether Hawthorne effects inhibit the experiment. First and
most important is the set of ten treatment provinces. If the provinces that received MOHA delegations within that
treatment group significantly out-perform the non-treatment provinces, this would be evidence of bias. We can
conclude that this is not the case. The coefficient on the triple interaction (time*treatment*survey), which is the effect
of the survey in treated provinces, is not significant for all six indices. This indicates that the visit did not have any
special effect on the final ATEs observed in Section 4. A secondary test involves comparing the control group that
was surveyed to the control provinces that were not surveyed. If surveyed provinces outperform other control
locations, this would be a cause for concern, as it would suggest that the visiting delegation generated additional
effort from local leaders. Once again, we can rest assured that this is not the case.
Certainly, with such a small number of province-level units, statistical significance may not be particularly
compelling. Consequently, we calculate the predicted effects for each of the cells generated by the experimental
conditions in Panel 2 for the six aggregate indices. Probing further into the three indices where the DPC experiment
appeared to be most effective (transportation, health, communication), we find that the score of the treatment
provinces and two national-level cities, and provinces are matched by region, including one province each from the Northern Mountains, Red River Delta, and North Central Coast.
29
group that did not receive a MOHA delegation is actually higher than that of the group that was visited. In other
words, provinces that received a MOHA delegation did marginally worse, not better.
In sum, after repeated robustness tests, it is clear that the removal of DPCs had a significant impact on the
delivery of public services that were most important to central officials. This is a surprising result that offers a useful
corrective to the extant decentralization literature.
6. Testing the Causal Mechanism- Unblocking Political Capture
Three general mechanisms may explain the above results. First, DPC abolition may have reduced citizen
influence over policies, allowing the center to drive through its favorite initiatives. A second basket of mechanisms
can be grouped under the heading of bureaucratic restructuring possibly leading to efficiency improvements. DPC
removal eliminated a key veto point in the implementation of central policies, but maintained other assemblies to
capture citizen views. In addition, oversight of DPCOMs was shifted to provincial authorities, substituting upward
accountability for horizontal accountability to the DPC. Third, DPC removal reduced capture of the decision-
making process by local elites, who had exploited the extra veto point to hold up central programs in exchange for a
share of the rents and demanded bribes from citizens trying to comply with regulatory procedures. The capture
story combines elements of the first two mechanisms, as it requires imperfectly implemented local elections in the
control group and bureaucratic restructuring in the treatment group that shifts accountability upward and unblocks
decision-making.
Unfortunately, the research design was not fine-grained enough to reveal for certain which mechanism
generated the underlying findings. In an ideal experimental setting, one could disentangle these mechanisms, but in
this project, the fact that only one treatment occurred means we can only speculate. One way to advance the
discussion, however, is to test the observable implications of the above mechanisms. Specifically, the diff-in-diff
analysis generated a number of downstream puzzles: 1) Why did DPC removal expedite progress on central
priorities without a discernible negative effect on policies favored by citizens? 2) Why was rapid progress made on
30
projects with relatively long gestation periods (i.e. all-year roads, post offices)? 3) Why was the achievement of
control provinces worse on nearly all services than that of the pilot group, despite transfers to control provinces?
Where did the money not spent on public services go?
Removal of vertical accountability to citizens cannot answer the first question. Control provinces should have
had better performance on services favored by citizens; instead, we observe non-effects of the treatment on the
aggregate indices and sporadic positive performance on individual indicators. Bureaucratic restructuring can answer
the first two questions, but it provides only a partial answer to the third. Provincial oversight may reduce waste, but
it does not answer the question of why the horizontal accountability of executives to DPCs in the control group was
unsuccessful. In addition, we were unable to find evidence for two potential tracers of a pure bureaucratic
restructuring story. The pilot did not appear to effect the distribution of service delivery among districts or the
turnover of local leaders, as might have been expected from increased provincial authority over district policies.25
One causal mechanism, however, provides an answer for all three puzzles – the elite capture mechanism. DPC
removal did not impact progress on citizens’ service preferences because the DPCs in both treatment and control
were not acting on behalf of voters in the first place. Policy was being directed to an elite group of local decision-
makers. Rapid progress could be made on long-term projects, because capture was holding up implementation of
central-level projects that were “shovel ready” (e.g. Chinh Trung 2011; Tri Tin 2013). They had already been
decided upon at the highest levels and just needed local authorities to approve and pass the appropriate
implementing documents. The conflict between local elites and central policymakers can be intense, dampening
project implementation (Tuan Ngoc 2009) and public scrutiny of local projects (Nguoi Dua Tin 2012). A post-pilot
report from the Da Nang People’s Committee (2012), for instance, credits reductions in decision delays and
administrative expenses for improved service delivery. Finally, transfers were higher to control provinces without
25 See Online Appendices I and J for regressions of public service inequality and leadership turnover on the treatment.

31
corresponding improvement on other public services because of corruption. Money was leaking out of the projects
into the hands of district officials (Le Anh 2012).
The answer to the third puzzle provides an additional observable implication to study. If DPC removal
unblocked elite capture of the policy-making apparatus, we should observe lower corruption in treatment provinces.
There is both qualitative and quantitative support for this theory. As the VNA debate about DPCs was taking place,
a joint team of foreign and Vietnamese experts showed that decentralization in Vietnam had been unsuccessful in
terms of its stated goals (p. 18) and led to the uneven allocation of public services, particularly regarding
infrastructure (p. 102) and healthcare (p. 144) (Van Arkadie et al. 2010). The report concluded that the main reason
for the disappointing results was corruption, claiming that decentralization produced, “unaccountable and corrupt
local institutions that respond inadequately to public needs” (183).
To study increased corruption quantitatively, we shift our attention to an alternative dataset. The UNDP-PAPI
Survey (13,642 total respondents, 9,452 in rural districts) was specifically designed to measure quality of governance
at the local level (UNDP 2011).26 One battery of PAPI asks respondents to reflect on corruption in their locality.
The questions look at multiple forms of petty bribery, but three questions in particular give us insight into the state
capture mechanism: 1) Leaders’ diversion of state funds for personal use; 2) The use of kickbacks on government
construction contracts; and 3) The necessity of bribery for obtaining government positions. The full wording for
these questions is available in Table 5, where we study the difference between control and treatment groups in
relation to their leaders’ behavior.
Because PAPI only surveyed the full set of provinces in 2011, we cannot perform a diff-in-diff analysis; rather,
we simply look at the differences in the average effect between the control and treatment groups. As with VHLSS,
we maintain regional and national-level city effects with a few exogenous controls for respondent-level covariates
that could plausibly be correlated with outcomes (the sex, age, and ethnicity of each respondent, whether the
respondent holds a government job, and individual wealth). To remain consistent with VHLSS analysis, we: 1) Drop
26 See http://www.papi.vn/about-papi for a detailed description of the PAPI methodology.
32
all observations from the Central Highlands, which did not participate in the experiment; 2) Analyze only rural
districts; 3) Employ regional and national-city dummy variables; and 4) Use robust standard errors, clustered at both
the province and district levels. All results are robust to removing all control variables.27
In Table 5, we present the results of the capture analysis. Responses are re-coded to create a dichotomous
variable that combines “Agree” and “Somewhat Agree” into a single value of “Agree.” This facilitates interpretation
and the use of a linear probability model.28 The treatment is significantly associated with lower corruption in all
three categories. In treated provinces, officials are 10% less likely to divert public funds, 8% less likely to expect
kickbacks on corruption procurement, and 13% less likely to pay a bribe to obtain a government job. The results are
a strong confirmation that recentralization, under the specific setting of a single-party authoritarian regime, can
reduce local capture caused by imperfect elections.
[Table 5 about Here]
Because the PAPI is a single-shot survey of citizen perspectives, the above results cannot be subjected to the
rigor of a diff-in-diff design. We address this limitation with a literal ‘nearest neighbor’ matching strategy, where we
identify the two nearest districts across the border in non-treated provinces. We trim the control group to these
proximate communes, providing greater balance on district characteristics. We report the results in Models 3, 6, and
9, finding that the results are actually strengthened by the more demanding approach.
Conclusion
Despite a fruitful decades-long theoretical debate, the literature on decentralization has stagnated in recent years
as scholars have encountered a range of empirical problems rendering causal identification difficult, if not
impossible. The Vietnamese pilot project to remove DPCs in ninety-nine districts nicely resolves these problems for
27 As an initial step, we first test whether the two datasets are compatible by regressing a series of variables from the PAPI that capture the same public service delivery questions used in the VHLSS. The treatment is strongly associated with these variables, indicating that the public service findings are consistent across two completely independent datasets. Results are available in Appendix H. 28 We make the transformation for presentation and consistency, but all results are robust to using OLS or an ORPOBIT on the three-point scale.

33
the following reasons: 1) It has a well-defined control group, allowing within-country comparison; 2) The timing of
the experiment’s introduction was exogenous to outcomes; and 3) The intervention involved a real-world institution
that had existed as part of the polity since 1992. In short, it provides the ideal research design for studying the
impact of subnational political and financial empowerment. Moreover, the experiment provides the first controlled
analysis of recentralization, an institutional change that will likely become more common as the pendulum swings
back from the misplaced euphoria of the mid-nineties. Our analysis reveals that the removal of Vietnamese DPCs
significantly improved a wide range of public services that were favored by central authorities (roads, healthcare, and
communications). Services favored by local citizens (education, agriculture, small business support), however, did
not benefit from decentralization. Further analysis reveals that the most likely mechanism for the improved
performance was that the pilot unblocked local capture of district policy-making, thereby releasing halted projects
and reducing corruption. More generally, the capture result shows how imperfectly implemented local elections can
ultimately undermine quality of governance and service delivery.
As in all projects, there are important limitations to generalizing from the Vietnamese experience. Selection of
the treatment was not randomized, so unobserved targeting remains a possibility. The pilot took place in a single-
party authoritarian setting that has traditionally struggled with local implementation of central initiatives. Thus, we
are cautious about generalizing the findings to settings with truly democratic elections at the central or local level.
Moreover, there are questions of the breadth of our conclusions. The pilot is still ongoing, and long-term effects
may be different from the medium-term results we identify. Finally, there is potential for fallacy of composition –
what may work in the pilot may not be true for all districts, especially as future recentralization forces the central
government to make difficult decisions about the allocation of resources for public goods.
These limitations aside, however, this paper provides a positive advance in our understanding of recentralization
in settings with imperfect local elections.

34
References
Angrist, Joshua D. and Jorn-Steffen Pischke. 2008. Mostly Harmless Econometrics: An Empiricist's Companion. Princeton:
Princeton University Press.
Bardhan, Pranab, and Dilip Mookherjee. 2006 "Decentralisation and Accountability in Infrastructure Delivery in
Developing Countries*." The Economic Journal 116.508: 101-127.
____. 2008. Decentralization and Local Governance in Developing Countries: A Comparative Perspective. Cambridge, MA: MIT
Press.
Besley, Tim and Stephen Coate. 2003. “Centralized Versus Decentralized Provision of Local Public Goods: A
Political Economy Approach.” Journal of Public Economics 87.12: 2611-37.
Bolton, Patrick and Joseph Farrell. 1990. “Decentralization, Duplication, Delay.” Journal of Political Economy 98 (4):
803-826.
Bruhn, Miriam and David McKenzie. 2009. “In Pursuit of Balance: Randomization in Practice in Development
Field Experiments.” American Economic Journal: Applied Economics 1 (4): 200-232.
Cai, Hongbin and Daniel Treisman. 2004. “State Corroding Federalism.” Journal of Public Economics 88.3: 819-43.
Cameron, A. Colin, Jonah Gelbach, and Douglas Miller. 2011. “Robust Inference with Multi-way Clustering.”
Journal of Business and Economic Statistics 29 (2): 238-249.
Campos, Jose Edgardo and Joel S. Hellman. 2005. “Governance Gone Local: Does Decentralization Improve
Accountability?” In East Asia Decentralizes: Making Local Government Work in Asia, edited by Roland White
and Paul Smoke, 237-52. Washington, DC: World Bank.
Central Committee of the Communist Party of Vietnam (CPV). 2007 “Resolution of the Fifth Plenum, Tenth
Congress, on Strengthening public administration reform and improving management effectiveness and
efficiency of the state machinery.” August 1, 2007
http://dangcongsan.vn/cpv/Modules/News/NewsDetail.aspx?co_id=30668&cn_id=20930

35
____ 2000. “2001-2010 National Strategy for Socio-Economic Development.” 2000.
<http://dangcongsan.vn/cpv/Modules/News/NewsDetail.aspx?co_id=30623&cn_id=26736>
Cheema, G. Shabbir and Dennis Rondinelli, eds. 1983. Decentralization and Development: Policy Implementation in
Developing Countries. Beverly Hills, CA: Sage Publications.
Chinh Trung, 2011. “Chủ tịch thành phố phê bình 15 cơ quan “quên” báo cáo.” [City Chairman criticizes 15 local
authorities for “forgetting” to report]. An Ninh Thu Do. September 21. Accessed on July 3, 2013.
http://www.anninhthudo.vn/Nha-Dat/Chu-tich-thanh-pho-phe-binh-15-co-quan-quen-bao-
cao/415518.antd.
Cox, Gary W. and Matthew D McCubbins. 1992. “Divided Control of Fiscal Policy.” In The Politics of Divided
Government, edited by G. Cox and S. Kernell, 112-36. Boulder, CO: Westview.
Da Binh. 2012. “Xây dựng nông thôn mới Khó khăn khi thực hiện tiêu chí số 6.” Binh Duong Online, Accessed on
June 7, 2012.
http://www.baobinhduong.org.vn/newsdetails/1D3FE1899C9/Kho_khan_khi_thuc_hien_tieu_chi_so_6.a
spx.
Da Nang People’s Committee. 2012. Report on the Implementation of the Experiment of Abolishing District and
Commune People’s Councils in Da Nang City.
Dickovick, J. Tyler. 2011. Decentralization and Recentralization in the Developing World. University Park: Pennsylvania
State University Press.
Dunning, Thad. 2008. "Improving Causal Inference Strengths and Limitations of Natural Experiments." Political
Research Quarterly 61.2: 282-293.
Eaton, Kent. 2004. Politics beyond the Capital: the Design of Subnational Institutions in South America. Stanford, CA:
Stanford University Press.
Falleti, Tulia G. 2010. Decentralization and subnational politics in Latin America. Cambridge University Press.

36
Fforde, Adam A. 2003. “Decentralization in Vietnam—Working Effectively at Provincial and Local Government
Level –A Comparative Analysis of Long An and Quang Ngai Provinces. Australian Agency for International
Development.” Accessed Jan. 4, 2013.
http://www.ausaid.gov.au/Publications/Documents/decentralisation_vietnam.pdf.
Florini, Ann M., Hairong Lai, and Yeling Tan. 2012. China Experiments: From Local Innovations to National
Reform. Brookings Institution Press.
French, John R. P. 1950. “Field Experiments: Changing Group Productivity.” In Experiments in Social Process: A
Symposium on Social Psychology, edited by James G. Miller, 82-97. New York: McGraw-Hill.
General Statistical Office (GSO, 2006-2011) -Enterprise Census 2006 to 2011 Datasets <
<http://www.gso.gov.vn/default_en.aspx?tabid=479&idmid=5>
General Statistical Office (GSO, 2006, 2008, 20010). “Vietnam Living Standard Survey Datasets”
< http://www.gso.gov.vn/default_en.aspx?tabid=483&idmid=5>
Government of the Socialist Republic of Vietnam (GSRV). 2009. “Report on the Draft of the solution of the
Standing Committee of the National Assembly on the list of districts, communes and wards experimented
with the abolishment of people’s councils.” January 2, 2009.
Green, Amanda. 2005. “Managing Human Resources in a Decentralized Context.” In East Asia Decentralizes: Making
Local Government Work in Asia, edited by Roland White and Paul Smoke, 129-155. Washington DC: World
Bank.
Grindle, Merilee S. 2007. Going Local: Decentralization, Democratization, and the Promise of Good Governance. Princeton, NJ:
Princeton University Press.
Grindle, Merilee S. 2004. Despite the Odds: The Contentious Politics of Education Reform. Princeton, NJ: Princeton
University Press.
Grossman, Guy and Delia Baldassarri. 2012. The Impact of Elections on Cooperation: Evidence from a Lab-in-
the-Field Experiment in Uganda. American Journal of Political Science. 56(4):964-985.

37
Hale, Henry. 2004. “Divided We Stand: Institutional Sources of Ethnofederal State Survival and Collapse.” World
Politics 56 (January): 165-93.
Hamman, John R., Roberto A. Weber and Jonathan Woon. 2011. "An Experimental Investigation of Electoral
Delegation and the Provision of Public Goods." American Journal of Political Science 55(4): 738-752.
Heckman, James, Brad Lalonde, and James Smith. 1999. “The Economics and Econometrics of Active Labor
Market Programs.” In Handbook of Labor Economics, Volume 3, edited by A. Ashenfelter and D. Card.
Amsterdam: Elsevier Science: 1865-2907.
Humphreys, Macartan, William A. Masters, and Martin E. Sandbu. 2006. “The Role of Leaders in Democratic
Deliberations: Results from a Field Experiment in São Tomé and Príncipe.” World Politics 58 (July): 583-
622.
Huther, Jeff and Anwar Shah. 1998 “Applying a Simple Measure of Good Governance to the Debate on Fiscal
Decentralization.” Washington DC: World Bank.
Inman, Ruben and David Rubinfeld. 1997. “Rethinking Federalism.” Journal of Economic Perspectives 11.4 43-64.
Kerkvliet, Benedict J. 2004. “Surveying Local Government and Authority in Contemporary Vietnam.” In Beyond
Hanoi: Local Government in Vietnam, edited by Benedict J. Tria Kerkvliet and David G. Marr, 1-27. Singapore
and Copenhagen: ISEAS Publications and NIAS Press.
Knight, Jack. 1992. Institutions and Social Conflict. New York: Cambridge University Press.
Kramon, Eric and Daniel Posner. 2012. “Who Benefits from Distributive Politics? How the Outcome One Studies
Affects the Answer One Gets.” MIT Unpublished Manuscript.
Kroll, Stephan, Todd L. Cherry, and Jason F. Shogren. 2007. "Voting, Punishment, and Public Goods." Economic
Inquiry 45: 557-70.
Le Anh 2012. “Tạm đình chỉ sinh hoạt Đảng Phó Chủ tịch HĐND xã AnTrung” [Party membership suspension
for Vice-Chair of An Trung Commune People Council]. Bao Gia Lai. Accessed on July 3, 2013.

38
http://baogialai.com.vn/channel/8301/201207/Tam-dinh-chi-sinh-hoat-dang-Pho-Chu-tich-HdNd-xa-
anTrung-2172021/.
Litvack, Jennie, Junaid Ahmad, and Richard Bird. 1998. Rethinking Decentralization in Developing Counctries.
Washington, D.C: World Bank.
Malesky, Edmund. 2009. “The Vietnam Provincial Competitiveness Index: Measuring Economic Governance for
Private Sector Development.” 2009 Final Report, Vietnam Competitiveness Initiative Policy Paper 13.
Hanoi: US AID’s Vietnam Competitiveness Initiative and Vietnam Chamber of Commerce and Industry.
Data and Codebooks Available at <www.pcivietnam.org>.
____and Markus. Taussig. 2009 “Where Is Credit Due? Legal Institutions, Connections, and the Efficiency of Bank
Lending in Vietnam.” Journal of Law, Economics, and Organization 225 (2), 535-578.
____Paul Schuler. 2011. "The Single‐Party Dictator's Dilemma: Information in Elections without Opposition."
Legislative Studies Quarterly 36.4: 491-530.
Mansuri, Ghazala and Vijayendra Rao. 2013. “Localizing Development: Does Participation Work?” World Bank:
Washington, DC.
Martinez-Bravo, Monica, Gerard Padro-i-Miquel, Nancy Qian, and Yang Yao. 2010. “Accountability and Growth:
The Costs of Village Democracy in China.” Yale University and NBER Working Paper.
Ministry of Finance. 2006-2012. State Budget of Vietnam. Ministry of Finance 2006 to 2012 – State Budget
<http://mof.gov.vn/portal/page/portal/mof_en/State_Budget> Accessed Feb. 19, 2013.
National Assembly of the Socialist Republic of Vietnam. 2003. “Law on the Organization of People’s Councils and
People’s Committees.”
____. 2008 “Resolution #26 on the experiment of abolishing the people councils in districts and wards.” December
2008.
____. 2009 “Resolution #274 on the list of districts, communes and wards experimented with the abolishment of
people’s councils.” January 16, 2009.

39
Nguoi Dua Tin 2012. “Dự án nội bộ, anh em báo chí không nên vào” [It’s an internal project. The media should
not pay attention]. Nguoi Dua Tin. December 27. Accessed on July 3, 2013. http://www.nguoiduatin.vn/du-
an-noi-bo-anh-em-bao-chi-khong-nen-vao-a12981.html.
Nguyen, Anh Van. 2010. “Chưa vội bỏ hội đồng nhân dân trong cả nước” [No rush to remove the People’s
Councils of the country]. VietNamNet. September 18. Accessed on June 6, 2013.
http://vnn.vietnamnet.vn/chinhtri/201009/Chua-voi-bo-hoi-dong-nhan-dan-trong-ca-nuoc-936324/.
Nguyen Thao. 2010. “Phải hỏi ý kiến dân khi bỏ hội đồng nhân dân” [Asking citizens to remove the People’s
Council]. VnEconomy. September 11. Accessed on June 6, 2012.
http://vneconomy.vn/2010091104313041P0C9920/phai-hoi-y-kien-dan-khi-bo-hoi-dong-nhan-dan.htm.
Oates, Wallace E. 1972. Fiscal Federalism. New York: Harcourt Brace Jovanovich.
O'Donell, Guillermo A. 1994. "Delegative democracy." Journal of democracy 5.1: 55-69.
Olken, Benjamin A. 2007. “Monitoring Corruption: Evidence from a Field Experiment in Indonesia.” Journal of
Political Economy 115 (2): 200-250.
Pepinsky, Thomas B. and Maria M. Wihardja. 2011. “Decentralization and Economic Performance in Indonesia.”
Journal of East Asian Studies 11 (3): 337-371.
Pham Phuong Thao. 2008. “Quốc hội thảo luận Đề án thí điểm không tổ chức HĐND quận, huyện, phường và
nhân dân trực tiếp bầu Chủ tịch UBND xã: Chủ trương đúng và thực sự cần thiết.” [Parliament discusses
pilot scheme, as to whether directly elected people’s counciles are necessary.] Bao Dien Thu. July 11.
Accessed on Jan. 3, 2013. http://baodientu.chinhphu.vn/Utilities/PrintView.aspx?ID=6482.
Pincus, J., V. T. T. Anh,, P. D. Nghia, B. Wilkinson, and N. X. Thanh. 2012. Structural reform for growth, equity and
national sovereignty. Ho Chi Minh City: Fulbright Economics Teaching Program Discussion Papers.
http://www. fetp. edu. vn/en/policy-papers/discussion-papers/.
Prud’homme, Remy. 1995. “The Dangers of Decentralization.” The World Bank Research Observer 10 (2): 201-20.
40
Reinikka, Ritva and Jakob Svensson. 2004. “Local Capture: Evidence from a Central Government Transfer
Program in Uganda.” Quarterly Journal of Economics. 119 (May): 679-705.
Rodden, Jonathan and Susan Rose-Ackerman. 1997. “Does Federalism Preserve Markets?” Virginia Law Review 83:
1521-72.
Rodden, Jonathan. 2006. Hamilton’s Paradox. New York: Cambridge University Press.
Tiebout, Charles. 1956. “A Pure Theory of Local Expenditure.” Journal of Political Econonmy 64: 416-24.
Treisman, Daniel. 2007. The Architecture of Government: Rethinking Political Decentralization. New York: Cambridge
University Press.
Tsai, Lily. 2007. "Solidarity Groups, Informal Accountability, and Local Public Goods Provision in Rural China.”
American Political Science Review 101 (2): 355-372.
Tsebelis, George. 2002. Veto Players: How Political Institutions Work. New York and Princeton: Russel Sage
Foundation and Princeton University Press.
Tuan Ngoc. 2009. “Kỷ luật chủ tịch thị trấn thuê côn đồ đánh cấp dưới” [Penalizing District Chairman for hiring
gangsters to hit subondinates]. Dan Tri. August 5. Accessed on July 3, 2013. http://dantri.com.vn/phap-
luat/ky-luat-chu-tich-thi-tran-thue-con-do-danh-cap-duoi-341881.htm.
Tri Tin 2013. “Chậm xử lý 'thôn 4 chợ tiền tỷ', lãnh đạo huyện đối mặt kỷ luật” [District leaders are disciplined if
slow in constructing 4 markets, each is worth billions of dongs]. Vnexpress. July 1. http://vnexpress.net/tin-
tuc/xa-hoi/cham-xu-ly-thon-4-cho-tien-ty-lanh-dao-huyen-doi-mat-ky-luat-2841197.html.
United Nations Development Program with Cecodes, the Vietnam Fatherland Font, and the Commission on
People’s Petitions for the Standing Committee of the National Assembly. 2011. “The Viet Nam Provincial
Governance and Public Administration Performance Index (PAPI) 2011: Measuring Citizens’ Experiences.”
CECODES, FR, CPP, and UNDP (2011). The Viet Nam Governance and Public Administration. Ha Noi,
Viet Nam: UNDP.. Data Available at <(http://www.papi.vn/node/93)>.
41
Van Tat Thu. 2010. “Rationale and practical implementation of the organization's council districts, wards.” Tap Chi
Cong San [Communist Review]. 10.3 November 30. Accessed on January 4, 2013.
<http://www.tapchicongsan.org.vn/Home/Nghiencuu-Traodoi/2010/3615/Co-so-ly-luan-va-thuc-tien-
thuc-hien-khong-to-chuc.aspx>.
Van Arkadie, Brian, Jonathan D. London, Pham Thi Lan Huong, Tran Thi Hanh, Khuat Thi Hai Oanh, Do Nam
Thang, and Dang Kim Khoi. 2010. “Joint Country Analysis: Development Challenges in a Middle-income
Viet Nam.” Hanoi: United Nations.
Volden, Craig. 2005. “Intergovernmental Political Competition in American Federalism.” American Journal of Political
Science 49.2: 327-42.
Vu Thanh Tu Anh. 2012. “Decentralization of Economic Management in Vietnam from Institutional Perspectives.”
Fulbright Economics Teaching Program Policy Discussion Paper. HCMC, Vietnam, December 31.
Walker, J. M., Roy Gardner, Andrew Herr and Elinor Ostrom 2000. "Collective Choice in the Commons:
Experimental Results on Proposed Allocation Rules and Votes." The Economic Journal 110(460): 212-234.
Weingast, Barry. 1995. “The economic role of political institutions: market-preserving federalism and economic
growth. Journal of Law, Economic and Organization 11 (1): 31.
White, Roland, and Paul Smoke. 2005. “East Asia Decentralizes.” In East Asia Decentralizes: Making Local Government
Work in Asia, edited by Roland White and Paul Smoke, 1-24. Washington DC: World Bank.
Whiting, Susan. 2004. “The Cadre Evaluation System at the Grassroots: The Paradox of Party Rule.” In Holding
China Together, edited by Barry Naughton and Dali Yang, 101-119. New York: Cambridge University Press.
Wibbels Eric. 2005. Federalism and the Market: Intergovernmental Conflict and Economic Reform in the Developing World. New
York: Cambridge University Press.
----. 2006. “Madison in Baghdad? Decentralization and Federalism in Comparative Politics.” Annual Review of Political
Science 9: 165-88.

42
Wilke, H. A. M., Rutte, C. G., Wit, A. P., Messick, D. M., & Samuelson, C. D. 1986. “Leadership in social dilemmas:
Efficiency and equity.” In H. A. M. Wilke, D. M. Messick, & C. G. Rutte (Eds.), Experimental social dilemmas
Frankfurt: Peter Lang: 55-76.
World Bank. 1994. Making Services Work for Poor People. World Development Report. Washington, DC: World Bank.
Xuan Long. 2012. “Hà Nội phê bình 18 quận, huyện” [Hanoi criticizes 18 districts]. Tuoi Tre. March 2. Accessed on
July 3, 2013. http://m.tuoitre.vn/chuyen-trang/Dia-oc/Nha-dat/104116,Ha-Noi-phe-binh-18-quan-
huyen.ttm.
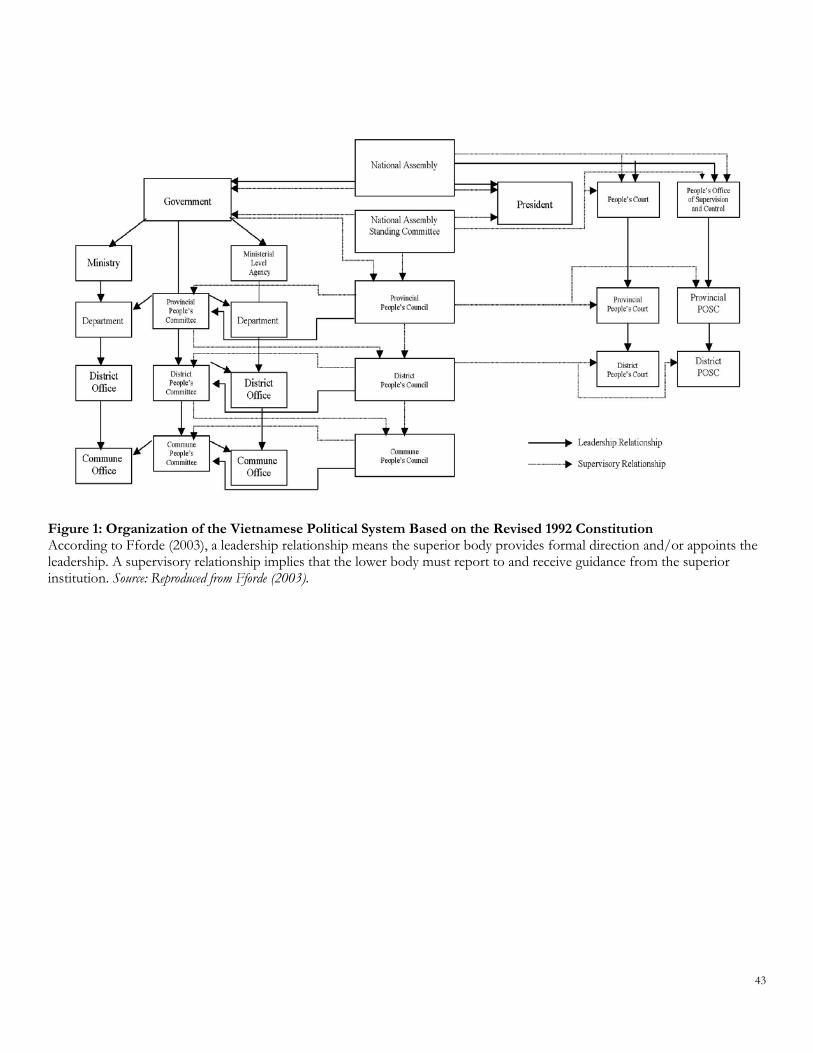
43
Figure 1: Organization of the Vietnamese Political System Based on the Revised 1992 Constitution According to Fforde (2003), a leadership relationship means the superior body provides formal direction and/or appoints the leadership. A supervisory relationship implies that the lower body must report to and receive guidance from the superior institution. Source: Reproduced from Fforde (2003).
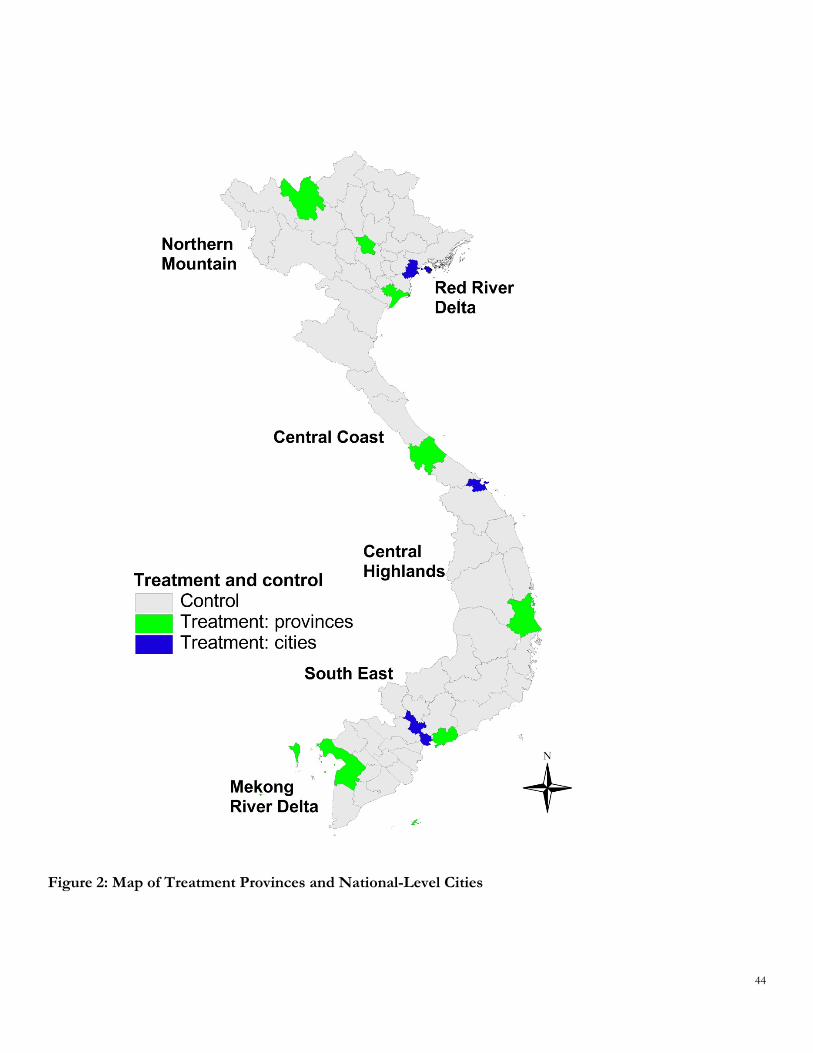
44
Figure 2: Map of Treatment Provinces and National-Level Cities

45
Figure 3: Difference in Difference Analysis of Key Outcome Variables. This figure shows the Average Treatment Effect (ATE) of district removal. The results are derived from the fully specified difference-in-difference regression models in Table 2 and Online Appendix D, with each variable listed on the y-index used as the dependent variable in a separate regression. Dependent variables are organized into six groups: 1) Infrastructure Index (measuring quality of transportation infrastructure); 2) Agricultural (Agr.) Services Index (measuring access to agricultural extension programs and credit); 3) Health Services Index (measuring quality of public health services); 4) Education Index (measuring access to and quality of public education); 5) Communications Index (measuring post office and telecommunication infrastructure); and 6) HH Biz Dev’t Index (measuring household business development services, such as credit access and markets).
INFRASTRUCTURE INDEXAll Year Road (Prob)
Public Transport (Prob)Socio-Development Project (Prob)
Tap Water (Prob)Village w/Road (Prob)
AGR. SERVICES INDEXSupported Crop (HH Share)
Agr. Extension Support (HH Share)Agr. Tax Exemption (HH Share)
Veterinarian (Prob)Extension Staff Visits (100s)
Supported Crops (Prob)Extension Center (Prob)
Irrigation Plants Managed(Prob)HEALTH SERVICES INDEXHealthcare Fee (HH Share)
Public Health Project (Prob)EDUCATION INDEX
Education/Culture Project (Prob) Supported Tuition Fee (HH Share)
Secondary School (Prob)Kindergarten (Prob)
Primary School (Prob)COMMUNICATIONS INDEX
Local Broadcast (Prob)Post Office (Village, Prob)
Post Office (Commune, Prob) HH BIZ DEV'T INDEX
Credit Support (HH Share)Biz Tax Exemption (HH Share)
Intercommune Market (Prob)Non-Farm Business (Prob)
Daily Market (Prob)Periodic Market (Prob)
Wholesale Market (Prob)
-.2 -.15 -.1 -.05 0 .05 .1 .15 .2
Avg. Treatment Effect ('08-'10)
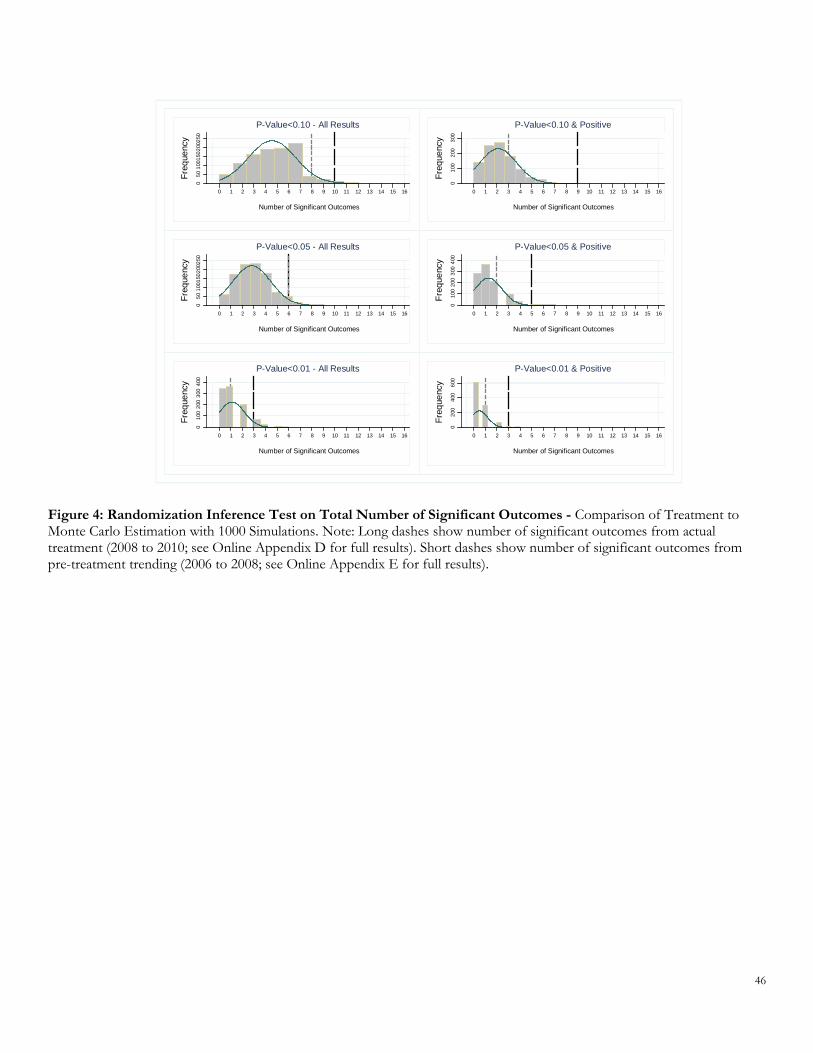
46
Figure 4: Randomization Inference Test on Total Number of Significant Outcomes - Comparison of Treatment to Monte Carlo Estimation with 1000 Simulations. Note: Long dashes show number of significant outcomes from actual treatment (2008 to 2010; see Online Appendix D for full results). Short dashes show number of significant outcomes from pre-treatment trending (2006 to 2008; see Online Appendix E for full results).
050
1001
5020
0250
Freq
uenc
y0 1 2 3 4 5 6 7 8 9 10 11 12 13 14 15 16
Number of Significant Outcomes
P-Value<0.10 - All Results
010
020
030
0
Freq
uenc
y
0 1 2 3 4 5 6 7 8 9 10 11 12 13 14 15 16
Number of Significant Outcomes
P-Value<0.10 & Positive
050
1001
5020
0250
Freq
uenc
y
0 1 2 3 4 5 6 7 8 9 10 11 12 13 14 15 16
Number of Significant Outcomes
P-Value<0.05 - All Results
010
020
030
040
0
Freq
uenc
y
0 1 2 3 4 5 6 7 8 9 10 11 12 13 14 15 16
Number of Significant Outcomes
P-Value<0.05 & Positive
010
020
030
040
0
Freq
uenc
y
0 1 2 3 4 5 6 7 8 9 10 11 12 13 14 15 16
Number of Significant Outcomes
P-Value<0.01 - All Results
020
040
060
0
Freq
uenc
y0 1 2 3 4 5 6 7 8 9 10 11 12 13 14 15 16
Number of Significant Outcomes
P-Value<0.01 & Positive

47
Figure 5: Test of Motivated Interference in Experimental Performance– Comparison of per capita transfers and state investment from the central government to control and treatment groups between 2006 and 2012. The treatment group is represented by solid lines and the control group by dashed lines. 90% are also presented for each year for both treatment (light gray) and control dark gray. T-tests are of the growth in all four variables between 2008 and 2010. Each panel studies a different type of transfer: Panel 1: total transfers (per capita) in millions of VND; Panels 2: equalizing transfers to make up for budget deficits; Panel 3 target transfers for socio-economic development programs (infrastructure, agriculture, environment, and poverty alleviation); Panel 4: Share of own-source revenue that can be retained by the province; Panel 5: Liabilities held by Central State Owned Enterprises (CSOEs) located in the province over provincial GDP; Panel 6: Central state equity held by CSOEs in province over provincial GDP. Source: MOF (2006 to 2012) Source: GSO (2006-2011).
.51
1.5
22.
53
Mill
. VN
D p
er c
apita
2007 2008 2009 2010 2011 2012
T-test of Growth in Control v. Treatment ('08-'10): p= 0.841. Total Transfers to Province
0.5
11.
52
Mill
. VN
D p
er c
apita
2007 2008 2009 2010 2011 2012
T-test of Growth in Control v. Treatment ('08-'10): p= 0.732. Equalizing Transfers
.2.4
.6.8
1
Mill
. VN
D p
er c
apita
2007 2008 2009 2010 2011 2012
T-test of Growth in Control v. Treatment ('08-'10): p= 0.463. Target Transfers
6070
8090
100
Rev
enue
Ret
aine
d(%
)2007 2008 2009 2010 2011 2012
T-test of Growth in Control v. Treatment ('08-'10): p= 0.674. Revenue Sharing
010
2030
40
Sha
re o
f Pro
vinc
ial G
DP
(%)
2006 2007 2008 2009 2010 2011
T-test of Growth in Control v. Treatment ('08-'10): p=0.785. Central SOE Liabilities
-20
020
40
Sha
re o
f Pro
vinc
ial G
DP
(%)
2006 2007 2008 2009 2010 2011
T-test of Growth in Control v. Treatment ('08-'10): p=0.786. State Equity in Central SOEs

48
Table 1: Balance between Ten Treatment Provinces and the Rest of the Country Based on 2008, Pre-Treatment Data
Variable Control Treatment T-Statistic P-Value T-Statistic P-Value Β Treatment P-Treatment Β City P-City R-SquaredEconomicGDP per capita (Millions of VND, Constant) 9248.1 22929.7 -2.351 0.022 -1.176 0.245 3,127.834 0.282 38,686.747** 0.009 0.543Number of Non-State Enterprises 1649.8 5987.6 -2.114 0.039 -0.222 0.825 285.590 0.450 14,307.624** 0.021 0.484Number of Local State Owned Enterprises 25.1 43.8 -1.642 0.106 0.550 0.585 -3.790 0.622 80.359** 0.013 0.490Number of Foreign Invested Enterprises 57.81 189.70 -1.571 0.121 0.339 0.736 0.742 0.496 410.110* 0.025 0.465FDI/Local Revenue (%) 9.02 20.79 -2.023 0.047 -2.022 0.048 0.102 0.103 -0.086 0.888 0.387Manufacturing Output/GDP 31.45 43.29 -2.498 0.015 -2.252 0.028 5.851 0.194 6.029 0.240 0.304Service Output/GDP 33.09 36.23 -1.073 0.287 0.376 0.708 -309.257 0.756 2,129.168* 0.035 0.383Agricultural Output/GDP 35.46 20.49 3.076 0.003 1.792 0.079 -3.835 0.835 -22.365*** 1.000 0.583Employees of Private Business 45932.91 149830.90 -2.137 0.037 -0.145 0.885 5,036.913 0.461 329,347.252** 0.020 0.497Average Income of Employee 932628.72 3561772.90 -2.003 0.050 -0.146 0.885 30,264.375 0.492 8974311.691** 0.022 0.487Average Salary of Employee 916954.94 3504676.40 -2.007 0.049 -0.144 0.886 34,775.141 0.490 8814777.942** 0.022 0.488Structural EndowmentsSurface Area of Province (KM Squared) 5638.5 3230.8 1.936 0.057 1.248 0.217 -1,188.808 0.895 -945.072 0.836 0.599Annual Temperature (Celsius) 24.40 25.60 -1.202 0.234 -1.039 0.303 0.805 0.089 0.357 0.311 0.540Annual Rainfall 153.13 150.70 0.181 0.857 -0.148 0.883 -4.449 0.658 7.104 0.324 0.346Distance from Ha Noi or HCMC 253.0 282.1 -0.380 0.706 -0.236 0.814 42.748 0.131 -36.075 0.846 0.701Province resulted from division of another province (%) 75.47 60.00 1.003 0.320 0.287 0.775 -0.084 0.699 -0.292 0.858 0.120Province has international border (%) 39.62 50.00 -0.603 0.548 -0.790 0.433 0.173 0.195 -0.351* 0.958 0.164DemographicPopulation (1000s) 1304.109 1709.3 1.792 0.609 1.248 0.550 -309.257 0.756 2,129.168* 0.035 0.383Population Density (Per Square Kilometer) 387.7 819.4 -2.510 0.015 -0.777 0.441 62.837 0.321 906.960** 0.013 0.680Share of Minorities in Population 2.06 1.40 1.450 0.152 0.967 0.338 0.033 0.413 -0.178* 0.962 0.697Secondary School Graduates/Population (%) 84.10 87.74 -1.272 0.208 -0.443 0.659 -0.629 0.658 6.881*** 0.000 0.330Quality of GovernanceProvincial Competitiveness Index (PCI - 100 pts) 58.48 62.55 -1.948 0.056 -1.177 0.244 2.884 0.135 1.493 0.303 0.333Unweighted PCI 53.12 56.00 -1.692 0.096 -1.078 0.286 2.279 0.139 0.379 0.436 0.331Entry Costs (Subindex 1 - PCI) 8.28 8.45 -0.751 0.455 -0.431 0.668 0.118 0.257 -0.169 0.706 0.236Land Access/Security (Subindex 2 - PCI) 6.44 6.30 0.434 0.666 -0.446 0.658 0.291 0.134 -1.396*** 1.000 0.463Transparency (Subindex 3 - PCI) 5.84 6.30 -1.325 0.190 -0.803 0.425 0.337 0.243 0.526* 0.046 0.108Time Costs (Subindex 4 - PCI) 6.45 6.98 -1.443 0.154 -0.935 0.354 0.162 0.323 0.218 0.357 0.316Informal Charges (Subindex 5 - PCI) 6.14 6.05 0.269 0.789 -0.159 0.874 0.147 0.313 -0.867** 0.994 0.567Bias toward SOEs (Subindex 6 - PCI) 5.14 5.57 -1.143 0.258 -1.714 0.092 0.744*** 0.002 -0.656* 0.956 0.295Leadership Proactivity (Subindex 7 - PCI) 4.96 5.28 -0.542 0.590 -0.412 0.682 0.642 0.215 -0.934 0.854 0.279Business Support (Subindex 8 - PCI) 5.04 5.59 -1.475 0.145 0.419 0.677 -0.126 0.699 2.395*** 0.000 0.599Labor Quality (Subindex 9 - PCI) 4.69 5.49 -3.196 0.002 -1.605 0.114 0.415* 0.025 0.854** 0.009 0.381Legal Institutions (Subindex 10 - PCI) 5.29 5.56 -1.053 0.296 -1.560 0.124 0.291 0.143 -0.249 0.773 0.181"Leaders good at working within law" (PCI %) 72.26 73.06 -0.258 0.798 0.066 0.948 0.016 0.345 -0.039 0.833 0.221"Leaders are creative and clever" (PCI %) 43.59 47.26 -1.043 0.301 -0.457 0.650 0.043 0.197 -0.025 0.661 0.261"Leaders willing to risk punishment" (PCI %) 23.20 23.79 -0.224 0.823 -0.253 0.801 0.026 0.259 -0.072 0.923 0.237Infrastructure Index (from PCI)Infrastructure Index (from PCI) 54.96 61.36 -2.498 0.015 -1.503 0.138 1.832 0.230 6.076*** 0.001 0.520Asphalted Roads (%) 0.51 0.64 -1.670 0.100 -0.720 0.475 0.025 0.339 0.027 0.403 0.460Telephones per Capita 0.26 0.33 -0.634 0.529 0.609 0.545 -0.096 0.787 0.739** 0.022 0.390Number of Industrial Zones (IZ) 2.17 3.60 -1.062 0.292 0.053 0.958 -0.310 0.675 3.358*** 0.001 0.465Percentage of IZ Land Occupied 31.97 43.48 -1.106 0.273 -0.487 0.628 -8.220 0.836 24.740** 0.009 0.439Price of Energy (VND/KW) 761.51 869.48 -1.811 0.075 -1.033 0.306 60.021 0.239 161.207** 0.007 0.182Share of Businesses with E-Mail Addresses (%) 27.41 37.20 -2.829 0.006 -1.101 0.276 0.015 0.228 0.189*** 0.000 0.621Use of CourtsTotal Number of Cases Filed 113.943 613.4 -2.54 0.01 -0.42 0.68 182.065 0.181 1,228.601** 0.024 0.487Percentage of Cases Filed by Private Plaintiffs 72.1 80.3 -0.91 0.37 -0.65 0.52 0.024 0.383 0.022 0.377 0.089Share of Cases Resolved 69.7 76.4 -1.59 0.12 -1.73 0.09 0.089* 0.038 -0.003 0.524 0.065
N=63 N=58 N=63; Region=7; Robust Standard Errors
Means (All)N=63
Difference in Means Difference in Means Regression of Variable on Treatment (All) (No National Cities) (Controlling for National Level City & Regional FE)

49
Table 2: Difference-in-Difference Estimation between 2008 and 2010 using VHLSS Commune Data
Model (1) (2) (3) (4) (5) (6) (7)
Dependent VariableAll-Year Road in
Commune
Commune Has Public
Transport
Socio-Dev't/ Infra. Project
Tap Water is Main Source
Village has Paved Road
Share of Households with Supported Crop
Share of Households Receiving
Agricultural Extension
Time (2008 to 2010) -0.007 -0.065*** 0.047** 0.246*** 0.002 0.005 0.010***(0.012) (0.018) (0.021) (0.033) (0.011) (0.009) (0.003)
Treatment -0.104** -0.089* -0.022 0.011 -0.065 0.002 -0.007(0.051) (0.051) (0.024) (0.027) (0.041) (0.017) (0.005)
Time*Treatment 0.086** 0.102* 0.087 -0.080 0.029 0.051** 0.021*(0.037) (0.053) (0.059) (0.077) (0.027) (0.025) (0.012)
Surface Area of Commune (ln) 0.015 0.102*** -0.001 0.050** 0.004 -0.027*** -0.014***(0.022) (0.018) (0.022) (0.022) (0.022) (0.009) (0.005)
0.098*** 0.116*** -0.069*** 0.112*** 0.056*** -0.056*** -0.021***(0.016) (0.022) (0.018) (0.022) (0.016) (0.010) (0.004)
National Level City -0.031 0.020 0.083** 0.059 -0.005 -0.010 0.006(0.032) (0.039) (0.042) (0.045) (0.038) (0.012) (0.010)
Regional FE YES YES YES YES YES YES YESConstant 0.352*** -0.068 0.795*** -0.665*** 0.625*** 0.394*** 0.165***
(0.124) (0.155) (0.152) (0.162) (0.125) (0.072) (0.030)Observations 4126 4126 4126 4126 4126 4126 4109Mean of dependent variable 2008 0.799 0.751 0.555 0.084 0.875 0.076 0.028Number of Province 58 58 58 58 58 58 58R-squared 0.140 0.146 0.054 0.183 0.138 0.271 0.042RMSE 0.369 0.410 0.480 0.365 0.305 0.153 0.093
Commune Population (ln)
Regressions employ OLS with standard errors clustered at district level and provincial level (*** p<0.01, ** p<0.05, * p<0.1). Regional fixed effects employed for seven major regions, but five provinces of Central Highlands are dropped, as no pilot occurred there. Table reports only the first seven outcome variables in dataset. Full results are reported in Appendix D.

50
Table 3: Difference-in-Difference Estimation using VHLSS Commune Data on Aggregate Indices
Model (1) (2) (3) (4) (5) (6)
Dependent Variable Transportation index
Agricultural Services index
Health Service index
Education index Communication index
Household business
development index
Time (2008 to 2010) 0.224*** 0.042 -0.014 0.075*** -0.046** -0.011(0.055) (0.044) (0.016) (0.023) (0.022) (0.038)
Treatment -0.269*** 0.074 -0.013 0.057 -0.197*** -0.034(0.081) (0.106) (0.017) (0.070) (0.066) (0.158)
Time*Treatment 0.225** -0.003 0.123*** 0.091 0.152** 0.007(0.109) (0.106) (0.030) (0.073) (0.061) (0.114)
Surface Area of Commune (ln) 0.170*** 0.102** -0.078*** 0.231*** 0.032 0.368***(0.058) (0.048) (0.021) (0.044) (0.042) (0.065)
Commune Population (ln) 0.313*** 0.061 -0.130*** 0.200*** 0.089** 0.454***(0.050) (0.045) (0.019) (0.040) (0.042) (0.063)
National Level City 0.126 -0.001 0.030* 0.236*** -0.022 0.189(0.085) (0.066) (0.017) (0.082) (0.042) (0.134)
Regional FE YES YES YES YES YES YESConstant 1.039*** 2.281*** 1.019*** -0.017 1.705*** -1.253***
(0.363) (0.337) (0.146) (0.308) (0.316) (0.486)Observations 4126 4126 4126 4126 4126 4126Mean of dependent variable 2008 3.063 2.513 0.237 1.559 2.000 1.850Number of provinces 58 58 58 58 58 58R-squared 0.099 0.124 0.139 0.039 0.131 0.116RMSE 1.004 0.888 0.385 0.851 0.663 1.019
Model (1) (2) (3) (4) (5) (6)
Dependent Variable Transportation index
Agricultural Services index
Health Service index
Education index Communication index
Household business
development index
Time (2006 to 2008) -0.000 0.083*** -0.007 0.022 0.025 0.032(0.022) (0.030) (0.019) (0.023) (0.028) (0.040)
Treatment -0.158 -0.041 0.021 -0.002 -0.146* -0.033(0.104) (0.135) (0.029) (0.086) (0.078) (0.146)
Time*Treatment -0.114*** 0.080 -0.033 0.033 -0.051 -0.024(0.012) (0.103) (0.032) (0.032) (0.061) (0.052)
Surface Area of Commune (ln) 0.108** 0.121** -0.089*** 0.234*** -0.024 0.408***(0.053) (0.060) (0.019) (0.041) (0.043) (0.076)
Commune Population (ln) 0.198*** 0.109** -0.132*** 0.202*** 0.041 0.501***(0.052) (0.054) (0.017) (0.036) (0.041) (0.077)
National Level City 0.095 0.101 0.035 0.187* -0.006 0.148*(0.174) (0.099) (0.029) (0.110) (0.052) (0.087)
Regional FE YES YES YES YES YES YESConstant 1.866*** 1.964*** 1.058*** 0.022 2.050*** -1.565***
(0.359) (0.409) (0.127) (0.260) (0.312) (0.572)Observations 4,220 4,220 4,220 4,220 4,220 4,220Mean of dependent variable (2006) 3.072 2.420 0.248 1.526 1.987 1.840Number of Provinces 58 58 58 58 58 58R-squared 0.049 0.116 0.139 0.035 0.129 0.123RMSE 0.976 0.918 0.393 0.845 0.682 1.042
Panel 2: Between 2006 and 2008
Panel 1: Between 2008 and 2010
Regressions employ OLS with standard errors clustered at the district level and the provincial level (*** p<0.01, ** p<0.05, * p<0.1). Regional fixed-effects are employed for seven major regions, but five provinces of the Central Highlands are dropped, as no pilot occurred there. Dependent variables are additive indexes created by summing up the groups of variables in Figure 3. Continuous variables are re-scaled between 0 and 1, and then added in with dichotomous variables.

- 51 -
Table 4: Test of Hawthorne Effect - Using Visits from Ministry of Home Affairs to Conduct Evaluation
(1) (2) (3) (4) (5) (6)
VARIABLESTransportation index Agricultural Services
indexHealth Service index Education index Communication index Household business
development indexTime (β1) 0.210*** 0.043 -0.012 0.070*** -0.067*** -0.009
(0.056) (0.050) (0.018) (0.024) (0.025) (0.041)Treatment (β2) -0.118 0.194* 0.001 -0.019 -0.163** 0.205
(0.128) (0.112) (0.032) (0.107) (0.076) (0.242)MOHA Survey (β3) -0.224* 0.019 0.001 0.014 0.000 0.509***
(0.123) (0.119) (0.025) (0.084) (0.103) (0.175)Treatment*Survey (β4) -0.181 -0.260 -0.031 0.153 -0.056 -0.770**
(0.292) (0.256) (0.047) (0.169) (0.186) (0.323)Time*Treatment (β5) Clean ATE 0.110 -0.088 0.125*** 0.145 0.184*** -0.056
(0.155) (0.093) (0.048) (0.093) (0.025) (0.148)Time*Survey (β6) Hawthorne Test II 0.119 -0.003 -0.018 0.038 0.163*** -0.017
(0.143) (0.064) (0.031) (0.046) (0.042) (0.074)Time*Treatment*Survey (β7) Hawthorne Test I 0.135 0.175 0.006 -0.136 -0.188 0.165
(0.345) (0.227) (0.070) (0.148) (0.152) (0.225)Intercept (β0) 1.095*** 2.281*** 1.020*** -0.025 1.701*** -1.366***
(0.356) (0.341) (0.145) (0.303) (0.316) (0.451)Controls YES YES YES YES YES YESCity Dummy YES YES YES YES YES YESRegional FE YES YES YES YES YES YESObservations 4,126 4,126 4,126 4,126 4,126 4,126Number of provinces 58 58 58 58 58 58Mean of dependent variable (2008) 3.063 3.063 3.063 3.063 3.063 3.063R-squared 0.104 0.125 0.140 0.040 0.133 0.130rmse 1.002 0.887 0.385 0.851 0.662 1.011
Transportation index Agricultural Services index
Health Service index Education index Communication index Household business development index
Control | Survey Control | Survey Control | Survey Control | Survey Control | Survey Control | SurveyControl 3.13 | 2.91 2.49 | 2.51 .24 | .24 1.55 | 1.57 2.03 | 2.03 1.79 | 2.30Treatment 3.02 | 2.61 2.68 | 2.44 .24 | .21 1.53 ̀ | 1.70 1.86 | 1.81 2.00 | 1.74Control 3.35 | 3.24 2.53 | 2.55 .22 | .21 1.62 | 1.68 1.96 | 2.12 1.78 | 2.27Treatment 3.34 | 3.19 2.64 | 2.57 .35 | .31 1.75 | 1.82 1.98 | 1.90 1.93 | 1.82
Regressions employ OLS with standard errors clustered at district level and provincial level (*** p<0.01, ** p<0.05, * p<0.1). Triple interaction of treatment, time, and visits by MOHA survey team. Regional fixed effects employed for seven major regions, but five provinces of Central Highlands are dropped, as no pilot occurred there.
2010
Panel 1: Regression Coefficients (Mutiway-Clustered Standard Errors)
Panel 2: Predicted Effects (By Time, Treatment, and Survey)
2008
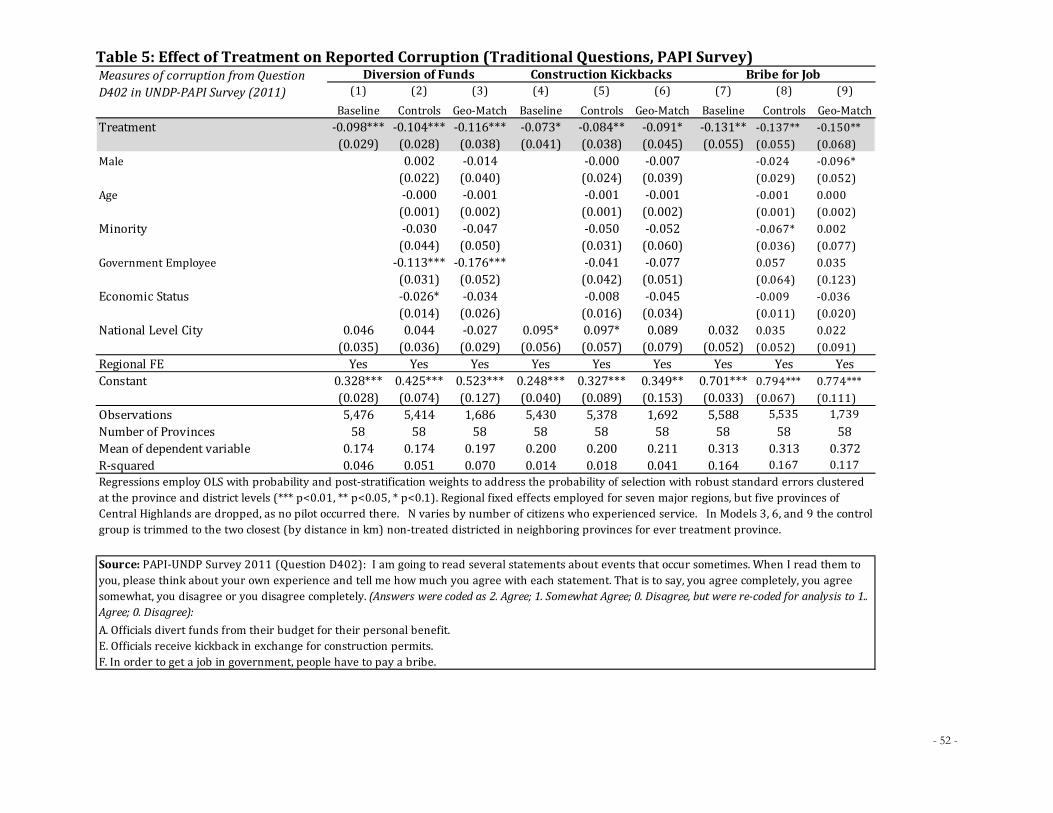
- 52 -
Table 5: Effect of Treatment on Reported Corruption (Traditional Questions, PAPI Survey)
(1) (2) (3) (4) (5) (6) (7) (8) (9)Baseline Controls Geo-Match Baseline Controls Geo-Match Baseline Controls Geo-Match
Treatment -0.098*** -0.104*** -0.116*** -0.073* -0.084** -0.091* -0.131** -0.137** -0.150**(0.029) (0.028) (0.038) (0.041) (0.038) (0.045) (0.055) (0.055) (0.068)
Male 0.002 -0.014 -0.000 -0.007 -0.024 -0.096*(0.022) (0.040) (0.024) (0.039) (0.029) (0.052)
Age -0.000 -0.001 -0.001 -0.001 -0.001 0.000(0.001) (0.002) (0.001) (0.002) (0.001) (0.002)
Minority -0.030 -0.047 -0.050 -0.052 -0.067* 0.002(0.044) (0.050) (0.031) (0.060) (0.036) (0.077)
Government Employee -0.113*** -0.176*** -0.041 -0.077 0.057 0.035(0.031) (0.052) (0.042) (0.051) (0.064) (0.123)
Economic Status -0.026* -0.034 -0.008 -0.045 -0.009 -0.036(0.014) (0.026) (0.016) (0.034) (0.011) (0.020)
National Level City 0.046 0.044 -0.027 0.095* 0.097* 0.089 0.032 0.035 0.022(0.035) (0.036) (0.029) (0.056) (0.057) (0.079) (0.052) (0.052) (0.091)
Regional FE Yes Yes Yes Yes Yes Yes Yes Yes YesConstant 0.328*** 0.425*** 0.523*** 0.248*** 0.327*** 0.349** 0.701*** 0.794*** 0.774***
(0.028) (0.074) (0.127) (0.040) (0.089) (0.153) (0.033) (0.067) (0.111)Observations 5,476 5,414 1,686 5,430 5,378 1,692 5,588 5,535 1,739Number of Provinces 58 58 58 58 58 58 58 58 58Mean of dependent variable 0.174 0.174 0.197 0.200 0.200 0.211 0.313 0.313 0.372R-squared 0.046 0.051 0.070 0.014 0.018 0.041 0.164 0.167 0.117
A. Officials divert funds from their budget for their personal benefit.E. Officials receive kickback in exchange for construction permits.F. In order to get a job in government, people have to pay a bribe.
Source: PAPI-UNDP Survey 2011 (Question D402): I am going to read several statements about events that occur sometimes. When I read them to you, please think about your own experience and tell me how much you agree with each statement. That is to say, you agree completely, you agree somewhat, you disagree or you disagree completely. (Answers were coded as 2. Agree; 1. Somewhat Agree; 0. Disagree, but were re-coded for analysis to 1.. Agree; 0. Disagree):
Measures of corruption from Question D402 in UNDP-PAPI Survey (2011)
Diversion of Funds Construction Kickbacks Bribe for Job
Regressions employ OLS with probability and post-stratification weights to address the probability of selection with robust standard errors clustered at the province and district levels (*** p<0.01, ** p<0.05, * p<0.1). Regional fixed effects employed for seven major regions, but five provinces of Central Highlands are dropped, as no pilot occurred there. N varies by number of citizens who experienced service. In Models 3, 6, and 9 the control group is trimmed to the two closest (by distance in km) non-treated districted in neighboring provinces for ever treatment province.

a
The Impact of Recentralization on Public Services: A Diff-in-Diff Analysis of the Abolition of Elected Councils in Vietnam
(ONLINE APPENDIX – NOT INTENDED FOR PUBLICATION, BUT MADE AVAILABLE TO REVIEWERS) Appendix Analysis Pages Appendix A Vietnam Results for MyWorld Survey
(Results cited in Footnote 6 ) b
Appendix B The Importance of Infrastructure, Health, and Education Services in Citizens' Evaluation of Governance Quality (Results cited in Footnote 6)
c
Appendix C1 Descriptive Statistics of Variables Used in Main Regression (2008-2010) (Results cited in Footnote 18)
d
Appendix C2 Full Description of All Independent Variables Used in Main Regression (Cited in Footnote 16)
e & f
Appendix D Difference-in-Difference Estimation between 2008 and 2010 using VHLSS Commune Data (Full Regression Results for Table 2 and Figure 3).
g & h
Appendix E Testing the Parallel Paths Assumption: Using Pre-Treatment VHLSS 2006-2008 (Full regression results for all dependent variables, cited in Footnote 20).
i & j
Appendix F Province-Level Difference-in-Difference Estimation using VHLSS Data (Results cited in Footnote 15).
k
Appendix G Further Elaboration of Randomization Inference Test (Footnote 21) l Appendix H Access to Basic Public Services (Robustness Using UNDP-PAPI 2011)
(Results cited in Footnote 27). m
Appendix I Equality of Service Delivery by District within Province (Aggregate Indices) (Results cited in Footnote 25)
n
Appendix J Changes in Local Leadership after Pilot (Results cited in Footnote 25) o Appendix K Difference-in-Mean MOHA Special Funds to Province (Results cited in
Footnote 22) p
Appendix L Difference-in-Mean State Investment in Province (Results cited in Footnote 23)
q
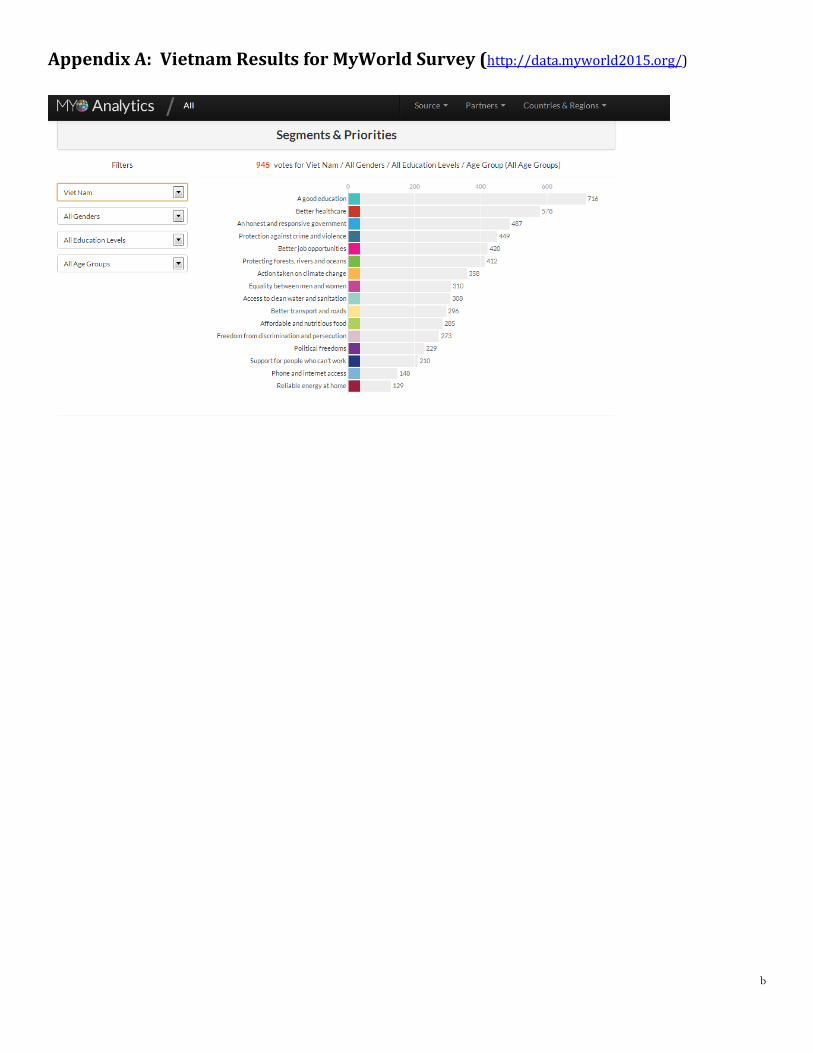
b
Appendix A: Vietnam Results for MyWorld Survey (http://data.myworld2015.org/)

c
Appendix B: The Importance of Infrastructure, Health, and Education Services in Citizens' Evaluation of Governance Quality
Dependent Variable= Satisfaction with local governance quality (0 -100)
Infrastructure only
Education only Health only All services With control
variables (1) (2) (3) (4) (5)
Infrastructure 2.374***
2.309*** 2.380*** (0.849)
(0.819) (0.894)
Health services
5.823***
5.624*** 5.477***
(1.232)
(1.215) (1.217)
Education services
6.861*** 5.564** 5.834**
(2.226) (2.220) (2.214)
Male
0.888
(0.956)
Age
0.007
(0.026)
Minority
1.277
(1.495)
Government Employee
-0.016
(0.022)
Economic Status
0.005
(0.007)
National-Level City
0.018
(0.214)
Regional FE Yes Yes Yes Yes Yes Constant 76.532*** 70.889*** 69.460*** 57.774*** 55.379*** (1.895) (2.214) (3.769) (4.318) (5.360) Observations 12,729 12,729 12,729 12,729 12,723 Number of Provinces 63 63 63 63 63 R-squared 0.010 0.018 0.011 0.025 0.026 Regressions employ OLS with probability and post-stratification weights to address the probability of selection with robust standard errors clustered at the province and district levels (*** p<0.01, ** p<0.05, * p<0.1)
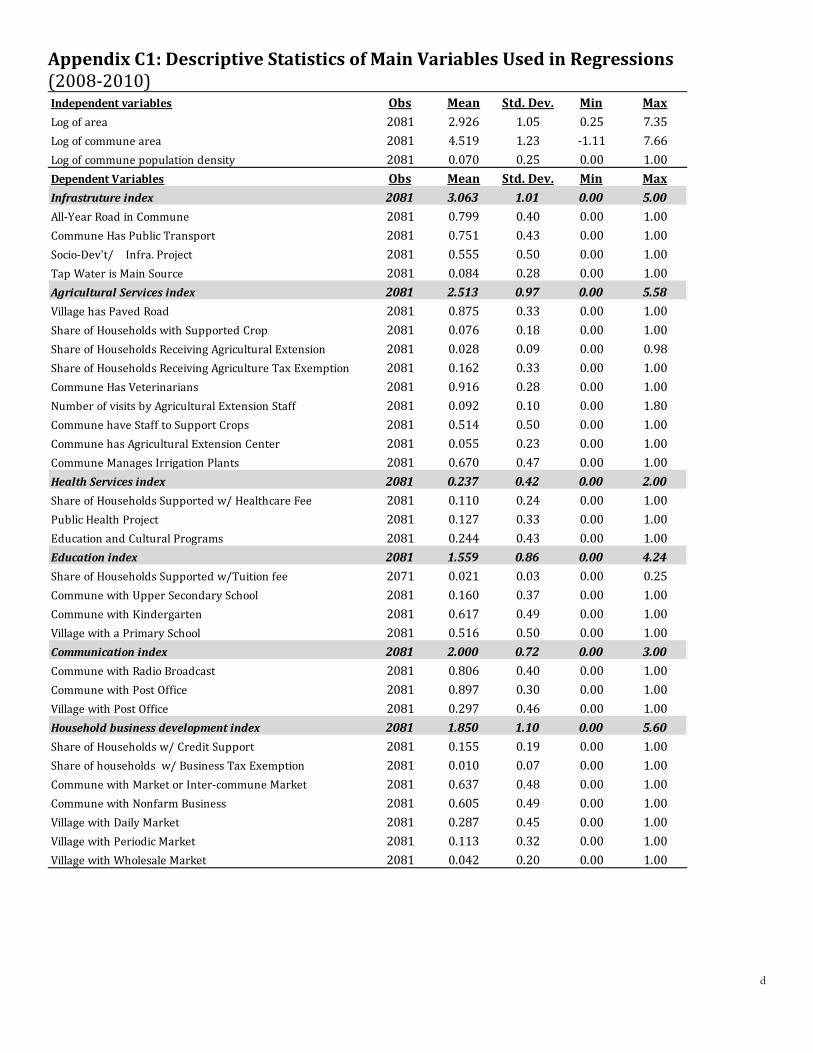
d
Appendix C1: Descriptive Statistics of Main Variables Used in Regressions (2008-2010)
Independent variables Obs Mean Std. Dev. Min MaxLog of area 2081 2.926 1.05 0.25 7.35Log of commune area 2081 4.519 1.23 -1.11 7.66Log of commune population density 2081 0.070 0.25 0.00 1.00Dependent Variables Obs Mean Std. Dev. Min MaxInfrastruture index 2081 3.063 1.01 0.00 5.00All-Year Road in Commune 2081 0.799 0.40 0.00 1.00Commune Has Public Transport 2081 0.751 0.43 0.00 1.00Socio-Dev't/ Infra. Project 2081 0.555 0.50 0.00 1.00Tap Water is Main Source 2081 0.084 0.28 0.00 1.00Agricultural Services index 2081 2.513 0.97 0.00 5.58Village has Paved Road 2081 0.875 0.33 0.00 1.00Share of Households with Supported Crop 2081 0.076 0.18 0.00 1.00Share of Households Receiving Agricultural Extension 2081 0.028 0.09 0.00 0.98Share of Households Receiving Agriculture Tax Exemption 2081 0.162 0.33 0.00 1.00Commune Has Veterinarians 2081 0.916 0.28 0.00 1.00Number of visits by Agricultural Extension Staff 2081 0.092 0.10 0.00 1.80Commune have Staff to Support Crops 2081 0.514 0.50 0.00 1.00Commune has Agricultural Extension Center 2081 0.055 0.23 0.00 1.00Commune Manages Irrigation Plants 2081 0.670 0.47 0.00 1.00Health Services index 2081 0.237 0.42 0.00 2.00Share of Households Supported w/ Healthcare Fee 2081 0.110 0.24 0.00 1.00Public Health Project 2081 0.127 0.33 0.00 1.00Education and Cultural Programs 2081 0.244 0.43 0.00 1.00Education index 2081 1.559 0.86 0.00 4.24Share of Households Supported w/Tuition fee 2071 0.021 0.03 0.00 0.25Commune with Upper Secondary School 2081 0.160 0.37 0.00 1.00Commune with Kindergarten 2081 0.617 0.49 0.00 1.00Village with a Primary School 2081 0.516 0.50 0.00 1.00Communication index 2081 2.000 0.72 0.00 3.00Commune with Radio Broadcast 2081 0.806 0.40 0.00 1.00Commune with Post Office 2081 0.897 0.30 0.00 1.00Village with Post Office 2081 0.297 0.46 0.00 1.00Household business development index 2081 1.850 1.10 0.00 5.60Share of Households w/ Credit Support 2081 0.155 0.19 0.00 1.00Share of households w/ Business Tax Exemption 2081 0.010 0.07 0.00 1.00Commune with Market or Inter-commune Market 2081 0.637 0.48 0.00 1.00Commune with Nonfarm Business 2081 0.605 0.49 0.00 1.00Village with Daily Market 2081 0.287 0.45 0.00 1.00Village with Periodic Market 2081 0.113 0.32 0.00 1.00Village with Wholesale Market 2081 0.042 0.20 0.00 1.00

e
Appendix C2: Full Description of All Independent Variables Used in Main Regression Individual Indicators Code Question All-Year Road in Commune This variable =1 if Q1=1 and
Q2=12 of section 5 Q1. Is there a road passable by car to the People Committee Office of this commune? Q2. Usually how many months of the year is this road passable by car?
Commune Has Public Transport Q11, section 5 Q11. Is there a passenger bus line, train or water transport that passes through the village? Socio-Dev't/ Infra. Project Q5, section 2, answer code =
3 Q5. Is there the following project in the commune: Job creation 1 Hunger elimination and poverty reduction 2 Socio economic and infrastructure 3 Investment on culture and education 4 Health and public health 5 Environment/clean water 6 Others (specify___________) 7
Tap Water is Main Source Q23, section 5
Answer code = 1, 2 and 3.
Q 23. What is the main source of drinking /cooking water for most people in this commune during the [.season.]? Indoor private piped water 1 Outdoor private piped water 2 Public piped water 3 Well water 4 Well with protection walls 5 Well without protection walls 6 Stream water with protection 7 Stream water without protection 8 Rainwater 9 Bottled water 10 Water brought by pedicab 11 Tank water 12 river lake pond………… 13 other (specify_________________) 14
Village has Paved Road Q7, section 5.
Answer=1 or 2. 7. What is the material surface of the road? Cement/asphalt...... 1 Tar on gravel........................ 2 Gravel............................................ 3 Dirt/earth.................................. 4 Other (specify_).................................... 5
Share of Households with Supported Crop
Q7d, section 2 D7d. In 2007, through the HEPR program and other social support programs, how many households/people received Relief Fund for natural disasters and pre-harvest shortage?
Share of Households Receiving Agricultural Extension
Q7e, section 2 D7e. In 2007, through the HEPR program and other social support programs, how many households/people received Agricultural Extension training?
Share of Households Receiving Agriculture Tax Exemption
Q7g, section 2 Q7g. Exemption from land-use tax in agriculture (excluding the Households which exempted according to State's policy)
Commune Has Veterinarians Q35, section 4 35. Does this commune have an animal health worker (veterinarian)? Number of visits by Agricultural Extension Staff
Q33, section 4 33. How many times have staffs of agriculture extension center visited/ contacted the farmers of this commune in the last 12 months.
Commune have Staff to Support Crops
Q34, section 4 34. Does this commune have a plant protection official?
Commune has Agricultural Extension Center
Q26, section 4 26. Is there any agriculture extension center in this commune?
Commune Manages Irrigation Plants Q21, section 5 21. Does this commune have any small irrigation system which managed by commune level or lower levels?
Share of Households Supported w/ Healthcare Fee
Q7c, section 2 D7c. In 2007, through the HEPR program and other social support programs, how many households/people received Exemption or reduction in hospital fees?

f
Public Health Project Q5, section 2, answer code = 5
Q5. Is there the following project in the commune: Job creation 1 Hunger elimination and poverty reduction 2 Socio economic and infrastructure 3 Investment on culture and education 4 Health and public health 5 Environment/clean water 6 Others (specify___________) 7
Education and Cultural Programs Q5, section 2, answer code = 4
Q5. Is there the following project in the commune: Job creation 1 Hunger elimination and poverty reduction 2 Socio economic and infrastructure 3 Investment on culture and education 4 Health and public health 5 Environment/clean water 6 Others (specify___________) 7
Share of Households Supported w/Tuition fee
Q7c, section 2 D7c. In 2007, through the HEPR program and other social support programs, how many households/people received Exemption or reduction in tuition fees?
Commune with Upper Secondary School
Q3, section 6 Q1. Does this commune have an Upper Secondary School?
Commune with Kindergarten Q26, section 6 Q26. Is there a kindergarten in this commune? Village with a Primary School Q6, section 6 Q9. Is a Primary School located in village? Commune with Radio Broadcast Q20, section 5 20. Does this commune have any commune radio station? Commune with Post Office Q18, section 5 Q18. Does this commune have any commune cultural post office? Village with Post Office Q24, section 5,
Answer code=5
24. Is [....] located within this village? 1. Daily market 2. Periodic market 3. Wholesale market 4. Commune's people committee office 5. Post office 6. Bank/bank branch
Share of Households w/ Credit Support
Q7a, section 2 D7a. In 2007, through the HEPR program and other social support programs, how many households/people received credit/loans?
Share of households w/ Business Tax Exemption
Q7f, section 2 D7e. In 2007, through the HEPR program and other social support programs, how many households/people received business tax exemption?
Commune with Market or Inter-commune Market
Q22, section 5 Q 22. Does this commune have any commune market/inter--commune market?
Commune with Nonfarm Business Q1, section 3 Q1. Is there any enterprise/firm/factory located in the area that the people from the commune can go there for work and come back home within the day
Village with Daily Market Q24, section 5,
Answer code=1
24. Is [....] located within this village? 1. Daily market 2. Periodic market 3. Wholesale market 4. Commune's people committee office 5. Post office 6. Bank/bank branch
Village with Periodic Market Q24, section 5,
Answer code=2
24. Is [....] located within this village? 1. Daily market 2. Periodic market 3. Wholesale market 4. Commune's people committee office 5. Post office 6. Bank/bank branch
Village with Wholesale Market Q24, section 5,
Answer code=3
24. Is [....] located within this village? 1. Daily market 2. Periodic market 3. Wholesale market 4. Commune's people committee office 5. Post office 6. Bank/bank branch
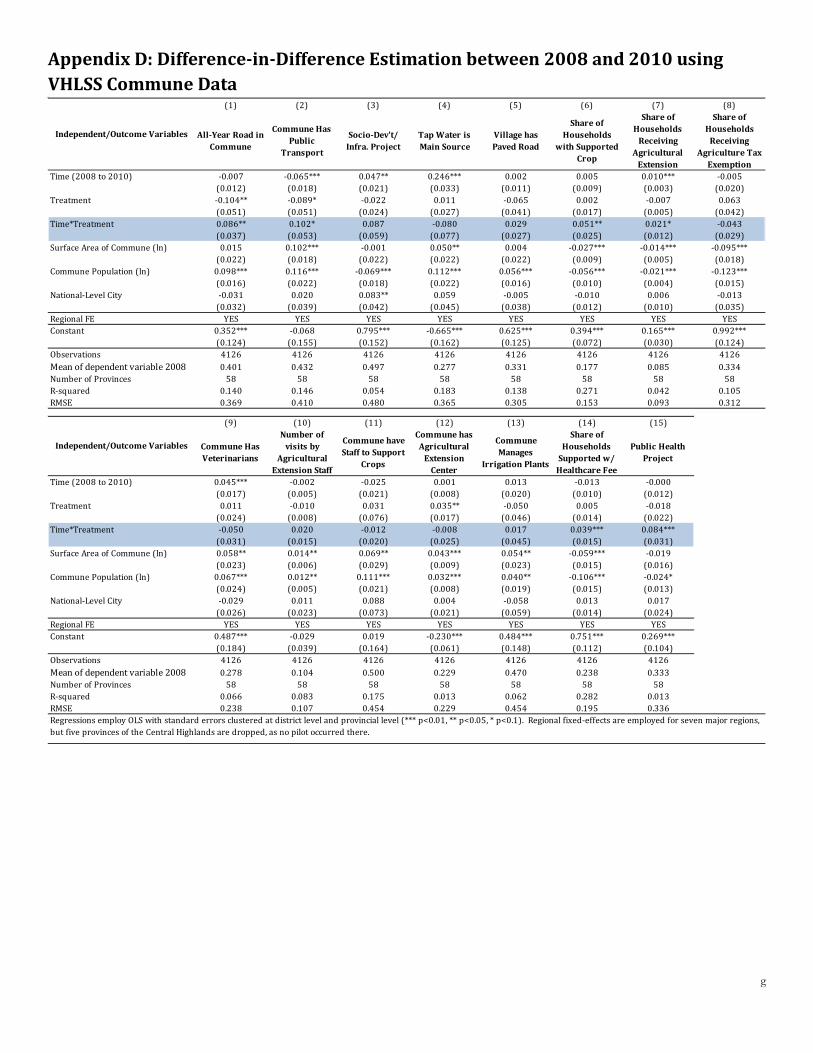
g
Appendix D: Difference-in-Difference Estimation between 2008 and 2010 using VHLSS Commune Data
(1) (2) (3) (4) (5) (6) (7) (8)
All-Year Road in Commune
Commune Has Public
Transport
Socio-Dev't/ Infra. Project
Tap Water is Main Source
Village has Paved Road
Share of Households
with Supported Crop
Share of Households
Receiving Agricultural
Extension
Share of Households
Receiving Agriculture Tax
ExemptionTime (2008 to 2010) -0.007 -0.065*** 0.047** 0.246*** 0.002 0.005 0.010*** -0.005
(0.012) (0.018) (0.021) (0.033) (0.011) (0.009) (0.003) (0.020)Treatment -0.104** -0.089* -0.022 0.011 -0.065 0.002 -0.007 0.063
(0.051) (0.051) (0.024) (0.027) (0.041) (0.017) (0.005) (0.042)Time*Treatment 0.086** 0.102* 0.087 -0.080 0.029 0.051** 0.021* -0.043
(0.037) (0.053) (0.059) (0.077) (0.027) (0.025) (0.012) (0.029)Surface Area of Commune (ln) 0.015 0.102*** -0.001 0.050** 0.004 -0.027*** -0.014*** -0.095***
(0.022) (0.018) (0.022) (0.022) (0.022) (0.009) (0.005) (0.018)Commune Population (ln) 0.098*** 0.116*** -0.069*** 0.112*** 0.056*** -0.056*** -0.021*** -0.123***
(0.016) (0.022) (0.018) (0.022) (0.016) (0.010) (0.004) (0.015)National-Level City -0.031 0.020 0.083** 0.059 -0.005 -0.010 0.006 -0.013
(0.032) (0.039) (0.042) (0.045) (0.038) (0.012) (0.010) (0.035)Regional FE YES YES YES YES YES YES YES YESConstant 0.352*** -0.068 0.795*** -0.665*** 0.625*** 0.394*** 0.165*** 0.992***
(0.124) (0.155) (0.152) (0.162) (0.125) (0.072) (0.030) (0.124)Observations 4126 4126 4126 4126 4126 4126 4126 4126Mean of dependent variable 2008 0.401 0.432 0.497 0.277 0.331 0.177 0.085 0.334Number of Provinces 58 58 58 58 58 58 58 58R-squared 0.140 0.146 0.054 0.183 0.138 0.271 0.042 0.105RMSE 0.369 0.410 0.480 0.365 0.305 0.153 0.093 0.312
(9) (10) (11) (12) (13) (14) (15)
Commune Has Veterinarians
Number of visits by
Agricultural Extension Staff
Commune have Staff to Support
Crops
Commune has Agricultural
Extension Center
Commune Manages
Irrigation Plants
Share of Households
Supported w/ Healthcare Fee
Public Health Project
Time (2008 to 2010) 0.045*** -0.002 -0.025 0.001 0.013 -0.013 -0.000(0.017) (0.005) (0.021) (0.008) (0.020) (0.010) (0.012)
Treatment 0.011 -0.010 0.031 0.035** -0.050 0.005 -0.018(0.024) (0.008) (0.076) (0.017) (0.046) (0.014) (0.022)
Time*Treatment -0.050 0.020 -0.012 -0.008 0.017 0.039*** 0.084***(0.031) (0.015) (0.020) (0.025) (0.045) (0.015) (0.031)
Surface Area of Commune (ln) 0.058** 0.014** 0.069** 0.043*** 0.054** -0.059*** -0.019(0.023) (0.006) (0.029) (0.009) (0.023) (0.015) (0.016)
Commune Population (ln) 0.067*** 0.012** 0.111*** 0.032*** 0.040** -0.106*** -0.024*(0.024) (0.005) (0.021) (0.008) (0.019) (0.015) (0.013)
National-Level City -0.029 0.011 0.088 0.004 -0.058 0.013 0.017(0.026) (0.023) (0.073) (0.021) (0.059) (0.014) (0.024)
Regional FE YES YES YES YES YES YES YESConstant 0.487*** -0.029 0.019 -0.230*** 0.484*** 0.751*** 0.269***
(0.184) (0.039) (0.164) (0.061) (0.148) (0.112) (0.104)Observations 4126 4126 4126 4126 4126 4126 4126Mean of dependent variable 2008 0.278 0.104 0.500 0.229 0.470 0.238 0.333Number of Provinces 58 58 58 58 58 58 58R-squared 0.066 0.083 0.175 0.013 0.062 0.282 0.013RMSE 0.238 0.107 0.454 0.229 0.454 0.195 0.336
Independent/Outcome Variables
Independent/Outcome Variables
Regressions employ OLS with standard errors clustered at district level and provincial level (*** p<0.01, ** p<0.05, * p<0.1). Regional fixed-effects are employed for seven major regions, but five provinces of the Central Highlands are dropped, as no pilot occurred there.
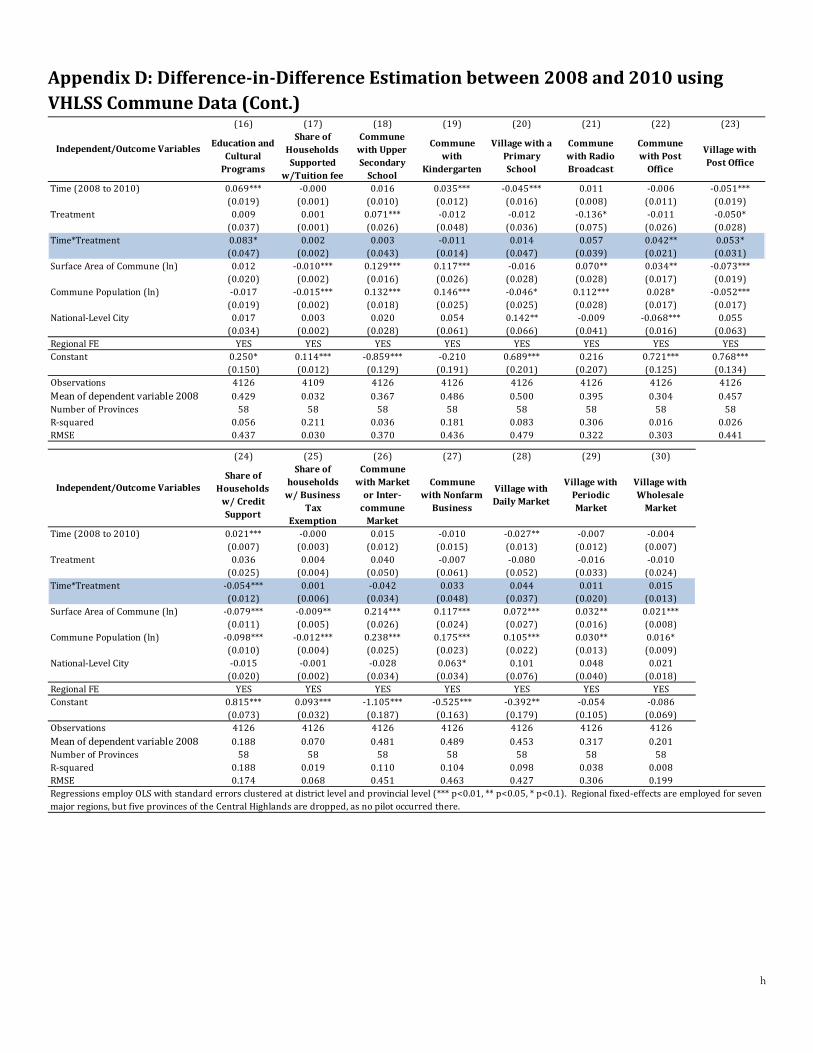
h
Appendix D: Difference-in-Difference Estimation between 2008 and 2010 using VHLSS Commune Data (Cont.)
(16) (17) (18) (19) (20) (21) (22) (23)
Education and Cultural
Programs
Share of Households Supported
w/Tuition fee
Commune with Upper Secondary
School
Commune with
Kindergarten
Village with a Primary School
Commune with Radio Broadcast
Commune with Post
Office
Village with Post Office
Time (2008 to 2010) 0.069*** -0.000 0.016 0.035*** -0.045*** 0.011 -0.006 -0.051***(0.019) (0.001) (0.010) (0.012) (0.016) (0.008) (0.011) (0.019)
Treatment 0.009 0.001 0.071*** -0.012 -0.012 -0.136* -0.011 -0.050*(0.037) (0.001) (0.026) (0.048) (0.036) (0.075) (0.026) (0.028)
Time*Treatment 0.083* 0.002 0.003 -0.011 0.014 0.057 0.042** 0.053*(0.047) (0.002) (0.043) (0.014) (0.047) (0.039) (0.021) (0.031)
Surface Area of Commune (ln) 0.012 -0.010*** 0.129*** 0.117*** -0.016 0.070** 0.034** -0.073***(0.020) (0.002) (0.016) (0.026) (0.028) (0.028) (0.017) (0.019)
Commune Population (ln) -0.017 -0.015*** 0.132*** 0.146*** -0.046* 0.112*** 0.028* -0.052***(0.019) (0.002) (0.018) (0.025) (0.025) (0.028) (0.017) (0.017)
National-Level City 0.017 0.003 0.020 0.054 0.142** -0.009 -0.068*** 0.055(0.034) (0.002) (0.028) (0.061) (0.066) (0.041) (0.016) (0.063)
Regional FE YES YES YES YES YES YES YES YESConstant 0.250* 0.114*** -0.859*** -0.210 0.689*** 0.216 0.721*** 0.768***
(0.150) (0.012) (0.129) (0.191) (0.201) (0.207) (0.125) (0.134)Observations 4126 4109 4126 4126 4126 4126 4126 4126Mean of dependent variable 2008 0.429 0.032 0.367 0.486 0.500 0.395 0.304 0.457Number of Provinces 58 58 58 58 58 58 58 58R-squared 0.056 0.211 0.036 0.181 0.083 0.306 0.016 0.026RMSE 0.437 0.030 0.370 0.436 0.479 0.322 0.303 0.441
(24) (25) (26) (27) (28) (29) (30)
Share of Households
w/ Credit Support
Share of households
w/ Business Tax
Exemption
Commune with Market
or Inter-commune
Market
Commune with Nonfarm
Business
Village with Daily Market
Village with Periodic Market
Village with Wholesale
Market
Time (2008 to 2010) 0.021*** -0.000 0.015 -0.010 -0.027** -0.007 -0.004(0.007) (0.003) (0.012) (0.015) (0.013) (0.012) (0.007)
Treatment 0.036 0.004 0.040 -0.007 -0.080 -0.016 -0.010(0.025) (0.004) (0.050) (0.061) (0.052) (0.033) (0.024)
Time*Treatment -0.054*** 0.001 -0.042 0.033 0.044 0.011 0.015(0.012) (0.006) (0.034) (0.048) (0.037) (0.020) (0.013)
Surface Area of Commune (ln) -0.079*** -0.009** 0.214*** 0.117*** 0.072*** 0.032** 0.021***(0.011) (0.005) (0.026) (0.024) (0.027) (0.016) (0.008)
Commune Population (ln) -0.098*** -0.012*** 0.238*** 0.175*** 0.105*** 0.030** 0.016*(0.010) (0.004) (0.025) (0.023) (0.022) (0.013) (0.009)
National-Level City -0.015 -0.001 -0.028 0.063* 0.101 0.048 0.021(0.020) (0.002) (0.034) (0.034) (0.076) (0.040) (0.018)
Regional FE YES YES YES YES YES YES YESConstant 0.815*** 0.093*** -1.105*** -0.525*** -0.392** -0.054 -0.086
(0.073) (0.032) (0.187) (0.163) (0.179) (0.105) (0.069)Observations 4126 4126 4126 4126 4126 4126 4126Mean of dependent variable 2008 0.188 0.070 0.481 0.489 0.453 0.317 0.201Number of Provinces 58 58 58 58 58 58 58R-squared 0.188 0.019 0.110 0.104 0.098 0.038 0.008RMSE 0.174 0.068 0.451 0.463 0.427 0.306 0.199
Independent/Outcome Variables
Independent/Outcome Variables
Regressions employ OLS with standard errors clustered at district level and provincial level (*** p<0.01, ** p<0.05, * p<0.1). Regional fixed-effects are employed for seven major regions, but five provinces of the Central Highlands are dropped, as no pilot occurred there.
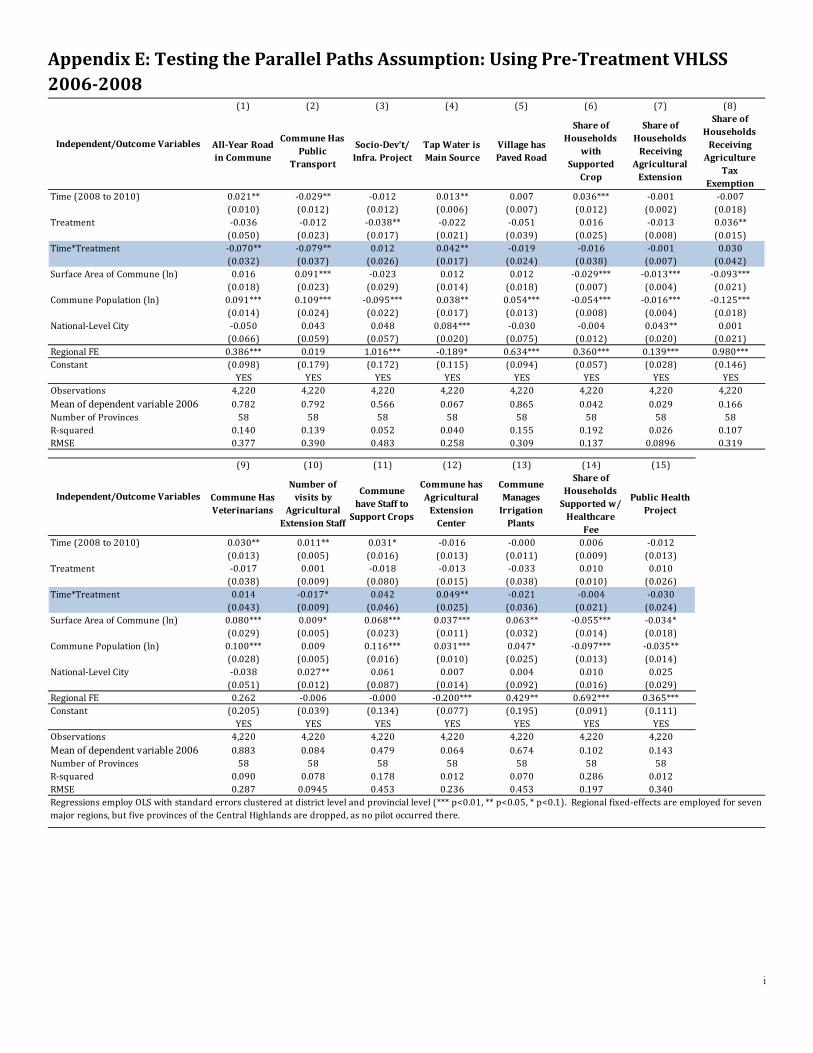
i
Appendix E: Testing the Parallel Paths Assumption: Using Pre-Treatment VHLSS 2006-2008
(1) (2) (3) (4) (5) (6) (7) (8)
All-Year Road in Commune
Commune Has Public
Transport
Socio-Dev't/ Infra. Project
Tap Water is Main Source
Village has Paved Road
Share of Households
with Supported
Crop
Share of Households
Receiving Agricultural
Extension
Share of Households
Receiving Agriculture
Tax Exemption
Time (2008 to 2010) 0.021** -0.029** -0.012 0.013** 0.007 0.036*** -0.001 -0.007(0.010) (0.012) (0.012) (0.006) (0.007) (0.012) (0.002) (0.018)
Treatment -0.036 -0.012 -0.038** -0.022 -0.051 0.016 -0.013 0.036**(0.050) (0.023) (0.017) (0.021) (0.039) (0.025) (0.008) (0.015)
Time*Treatment -0.070** -0.079** 0.012 0.042** -0.019 -0.016 -0.001 0.030(0.032) (0.037) (0.026) (0.017) (0.024) (0.038) (0.007) (0.042)
Surface Area of Commune (ln) 0.016 0.091*** -0.023 0.012 0.012 -0.029*** -0.013*** -0.093***(0.018) (0.023) (0.029) (0.014) (0.018) (0.007) (0.004) (0.021)
Commune Population (ln) 0.091*** 0.109*** -0.095*** 0.038** 0.054*** -0.054*** -0.016*** -0.125***(0.014) (0.024) (0.022) (0.017) (0.013) (0.008) (0.004) (0.018)
National-Level City -0.050 0.043 0.048 0.084*** -0.030 -0.004 0.043** 0.001(0.066) (0.059) (0.057) (0.020) (0.075) (0.012) (0.020) (0.021)
Regional FE 0.386*** 0.019 1.016*** -0.189* 0.634*** 0.360*** 0.139*** 0.980***Constant (0.098) (0.179) (0.172) (0.115) (0.094) (0.057) (0.028) (0.146)
YES YES YES YES YES YES YES YESObservations 4,220 4,220 4,220 4,220 4,220 4,220 4,220 4,220Mean of dependent variable 2006 0.782 0.792 0.566 0.067 0.865 0.042 0.029 0.166Number of Provinces 58 58 58 58 58 58 58 58R-squared 0.140 0.139 0.052 0.040 0.155 0.192 0.026 0.107RMSE 0.377 0.390 0.483 0.258 0.309 0.137 0.0896 0.319
(9) (10) (11) (12) (13) (14) (15)
Commune Has Veterinarians
Number of visits by
Agricultural Extension Staff
Commune have Staff to
Support Crops
Commune has Agricultural
Extension Center
Commune Manages
Irrigation Plants
Share of Households
Supported w/ Healthcare
Fee
Public Health Project
Time (2008 to 2010) 0.030** 0.011** 0.031* -0.016 -0.000 0.006 -0.012(0.013) (0.005) (0.016) (0.013) (0.011) (0.009) (0.013)
Treatment -0.017 0.001 -0.018 -0.013 -0.033 0.010 0.010(0.038) (0.009) (0.080) (0.015) (0.038) (0.010) (0.026)
Time*Treatment 0.014 -0.017* 0.042 0.049** -0.021 -0.004 -0.030(0.043) (0.009) (0.046) (0.025) (0.036) (0.021) (0.024)
Surface Area of Commune (ln) 0.080*** 0.009* 0.068*** 0.037*** 0.063** -0.055*** -0.034*(0.029) (0.005) (0.023) (0.011) (0.032) (0.014) (0.018)
Commune Population (ln) 0.100*** 0.009 0.116*** 0.031*** 0.047* -0.097*** -0.035**(0.028) (0.005) (0.016) (0.010) (0.025) (0.013) (0.014)
National-Level City -0.038 0.027** 0.061 0.007 0.004 0.010 0.025(0.051) (0.012) (0.087) (0.014) (0.092) (0.016) (0.029)
Regional FE 0.262 -0.006 -0.000 -0.200*** 0.429** 0.692*** 0.365***Constant (0.205) (0.039) (0.134) (0.077) (0.195) (0.091) (0.111)
YES YES YES YES YES YES YESObservations 4,220 4,220 4,220 4,220 4,220 4,220 4,220Mean of dependent variable 2006 0.883 0.084 0.479 0.064 0.674 0.102 0.143Number of Provinces 58 58 58 58 58 58 58R-squared 0.090 0.078 0.178 0.012 0.070 0.286 0.012RMSE 0.287 0.0945 0.453 0.236 0.453 0.197 0.340
Independent/Outcome Variables
Independent/Outcome Variables
Regressions employ OLS with standard errors clustered at district level and provincial level (*** p<0.01, ** p<0.05, * p<0.1). Regional fixed-effects are employed for seven major regions, but five provinces of the Central Highlands are dropped, as no pilot occurred there.

j
Appendix E: Testing the Parallel Paths Assumption: Using Pre-Treatment VHLSS 2006-2008 (Cont.)
(16) (17) (18) (19) (20) (21) (22) (23)
Education and Cultural
Programs
Share of Households Supported
w/Tuition fee
Commune with Upper Secondary
School
Commune with
Kindergarten
Village with a Primary School
Commune with Radio Broadcast
Commune with Post
Office
Village with Post Office
Time (2008 to 2010) -0.004 -0.000 -0.004 0.032** -0.001 0.000 0.031*** -0.006(0.014) (0.001) (0.006) (0.013) (0.017) (0.012) (0.010) (0.023)
Treatment 0.012 0.001 0.040** 0.028 -0.084 -0.136* 0.015 -0.025(0.013) (0.003) (0.019) (0.054) (0.060) (0.073) (0.031) (0.037)
Time*Treatment -0.003 0.001 0.021 -0.062* 0.075*** -0.015 -0.020 -0.015(0.010) (0.002) (0.028) (0.034) (0.029) (0.026) (0.013) (0.043)
Surface Area of Commune (ln) 0.002 -0.009*** 0.142*** 0.124*** -0.025 0.059* 0.013 -0.096***(0.020) (0.002) (0.017) (0.026) (0.023) (0.031) (0.020) (0.021)
Commune Population (ln) -0.029** -0.014*** 0.145*** 0.154*** -0.054*** 0.103*** 0.005 -0.067***(0.013) (0.001) (0.020) (0.024) (0.020) (0.030) (0.015) (0.022)
National-Level City -0.009 0.001 0.045 0.102 0.048 0.060 -0.052 -0.014(0.027) (0.002) (0.045) (0.105) (0.054) (0.062) (0.037) (0.047)
Regional FE 0.336*** 0.105*** -0.950*** -0.241 0.772*** 0.300 0.847*** 0.902***Constant (0.104) (0.011) (0.135) (0.184) (0.157) (0.222) (0.123) (0.163)
YES YES YES YES YES YES YES YESObservations 4,220 4,203 4,220 4,220 4,220 4,220 4,220 4,220Mean of dependent variable 2008 0.246 0.021 0.159 0.589 0.511 0.811 0.868 0.307Number of Provinces 58 58 58 58 58 58 58 58R-squared 0.048 0.196 0.040 0.212 0.071 0.321 0.015 0.022RMSE 0.420 0.0304 0.359 0.434 0.482 0.324 0.320 0.454
(24) (25) (26) (27) (28) (29) (30)
Share of Households
w/ Credit Support
Share of households
w/ Business Tax
Exemption
Commune with Market
or Inter-commune
Market
Commune with Nonfarm
Business
Village with Daily Market
Village with Periodic Market
Village with Wholesale
Market
Time (2008 to 2010) 0.017*** -0.004 -0.018** 0.046*** -0.018 0.001 0.007(0.004) (0.004) (0.008) (0.017) (0.016) (0.012) (0.009)
Treatment 0.022 0.013** -0.013 -0.051 -0.048 -0.008 0.051***(0.020) (0.006) (0.048) (0.047) (0.059) (0.027) (0.018)
Time*Treatment 0.005 -0.006 0.037 0.028 -0.031 0.002 -0.059***(0.010) (0.008) (0.028) (0.045) (0.030) (0.031) (0.023)
Surface Area of Commune (ln) -0.064*** -0.011* 0.249*** 0.121*** 0.081*** 0.014 0.018*(0.008) (0.006) (0.038) (0.034) (0.030) (0.016) (0.009)
Commune Population (ln) -0.076*** -0.014** 0.265*** 0.177*** 0.116*** 0.016 0.016**(0.009) (0.006) (0.034) (0.027) (0.027) (0.014) (0.008)
National-Level City 0.012 -0.002 0.017 0.100 0.061 -0.042* 0.003(0.011) (0.004) (0.025) (0.072) (0.051) (0.024) (0.023)
Regional FE 0.656*** 0.105** -1.288*** -0.576*** -0.452** 0.072 -0.084Constant (0.061) (0.046) (0.260) (0.208) (0.203) (0.102) (0.062)
YES YES YES YES YES YES YESObservations 4,220 4,220 4,220 4,220 4,220 4,220 4,220Mean of dependent variable 2008 0.138 0.015 0.644 0.554 0.309 0.110 0.042Number of Provinces 58 58 58 58 58 58 58R-squared 0.120 0.040 0.116 0.111 0.093 0.036 0.009RMSE 0.169 0.0821 0.451 0.466 0.436 0.310 0.200
Independent/Outcome Variables
Independent/Outcome Variables
Regressions employ OLS with standard errors clustered at district level and provincial level (*** p<0.01, ** p<0.05, * p<0.1). Regional fixed-effects are employed for seven major regions, but five provinces of the Central Highlands are dropped, as no pilot occurred there.

k
Appendix F: Province-Level Diff-in-Diff Estimation using VHLSS Data on Aggregate Indices
Model (1) (2) (3) (4) (5) (6)
Dependent Variable Transportation index
Agricultural Services index
Health Service index
Education index Communication index
Household business
development index
Time (2008 to 2010) 0.216*** 0.058 -0.028 0.079** -0.045* -0.004(0.064) (0.046) (0.020) (0.032) (0.024) (0.039)
Treatment -0.332*** 0.065 -0.005 0.154 -0.196** -0.032(0.111) (0.118) (0.035) (0.097) (0.084) (0.188)
Time*Treatment 0.377** 0.005 0.109** 0.014 0.136* 0.085(0.169) (0.137) (0.044) (0.095) (0.080) (0.178)
National-Level City 0.203* 0.131* -0.019 0.385** -0.026 0.202(0.111) (0.078) (0.037) (0.148) (0.057) (0.142)
Regional FE 3.165*** 2.782*** 0.156*** 1.489*** 2.250*** 1.923***Constant (0.075) (0.091) (0.024) (0.081) (0.046) (0.123)
YES YES YES YES YES YESObservations 116 116 116 116 116 116Mean of dependent variable 2008 3.066 2.435 0.255 1.588 1.962 1.823Number of provinces 58 58 58 58 58 58R-squared 0.415 0.467 0.584 0.368 0.611 0.430RMSE 0.387 0.363 0.128 0.237 0.219 0.372
Model (1) (2) (3) (4) (5) (6)
Dependent Variable Transportation index
Agricultural Services index
Health Service index
Education index Communication index
Household business
development index
Time (2006 to 2008) 0.016 0.085** -0.011 0.017 0.030 0.046(0.032) (0.041) (0.019) (0.035) (0.025) (0.040)
Treatment -0.158 -0.066 0.024 0.087 -0.221** -0.024(0.126) (0.160) (0.034) (0.099) (0.089) (0.163)
Time*Treatment -0.129* 0.120 -0.032 0.059 0.015 -0.077(0.072) (0.178) (0.044) (0.064) (0.096) (0.136)
National-Level City 0.075 0.087 -0.008 0.352** 0.007 0.290**(0.166) (0.126) (0.024) (0.140) (0.051) (0.135)
Regional FE YES YES YES YES YES YESConstant 3.214*** 2.809*** 0.154*** 1.521*** 2.224*** 1.963***
(0.055) (0.087) (0.022) (0.092) (0.046) (0.113)Observations 116 116 116 116 116 116Mean of dependent variable (2006) 3.075 2.389 0.261 1.574 1.948 1.817Number of Provinces 58 58 58 58 58 58R-squared 0.329 0.373 0.570 0.285 0.603 0.473RMSE 0.338 0.431 0.139 0.260 0.235 0.369
Panel 1: Between 2008 and 2010
Panel 2: Between 2006 and 2008
Regressions employ OLS on provincial averages of dependent variables with robust standard errors clustered at the province level (*** p<0.01, ** p<0.05, * p<0.1). Regional fixed-effects are employed for seven major regions, but five provinces of the Central Highlands are dropped, as no pilot occurred there. Dependent variables are additive indexes created by summing up the groups of variables in Figure 3. Continuous variables are re-scaled between 0 and 1, and then added in with dichotomous variables.
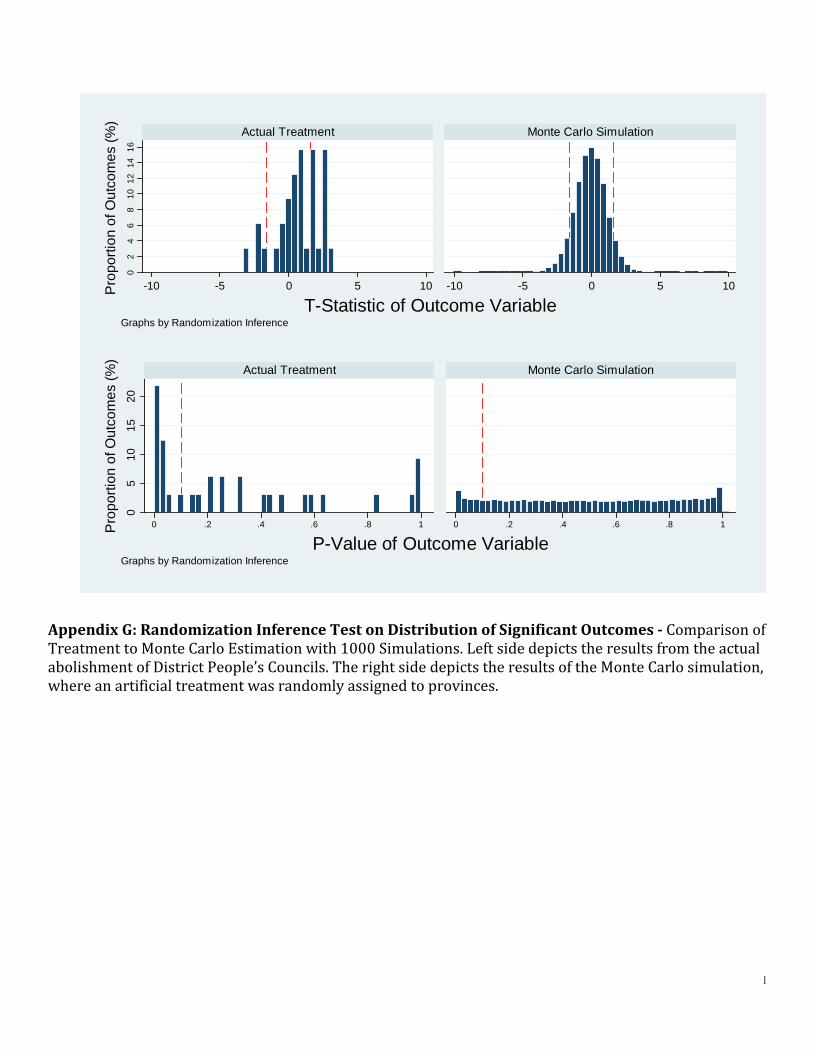
l
Appendix G: Randomization Inference Test on Distribution of Significant Outcomes - Comparison of Treatment to Monte Carlo Estimation with 1000 Simulations. Left side depicts the results from the actual abolishment of District People’s Councils. The right side depicts the results of the Monte Carlo simulation, where an artificial treatment was randomly assigned to provinces.
02
46
810
1214
16
-10 -5 0 5 10 -10 -5 0 5 10
Actual Treatment Monte Carlo Simulation
Pro
porti
on o
f Out
com
es (%
)
T-Statistic of Outcome VariableGraphs by Randomization Inference
05
1015
20
0 .2 .4 .6 .8 1 0 .2 .4 .6 .8 1
Actual Treatment Monte Carlo Simulation
Pro
porti
on o
f Out
com
es (%
)
P-Value of Outcome VariableGraphs by Randomization Inference
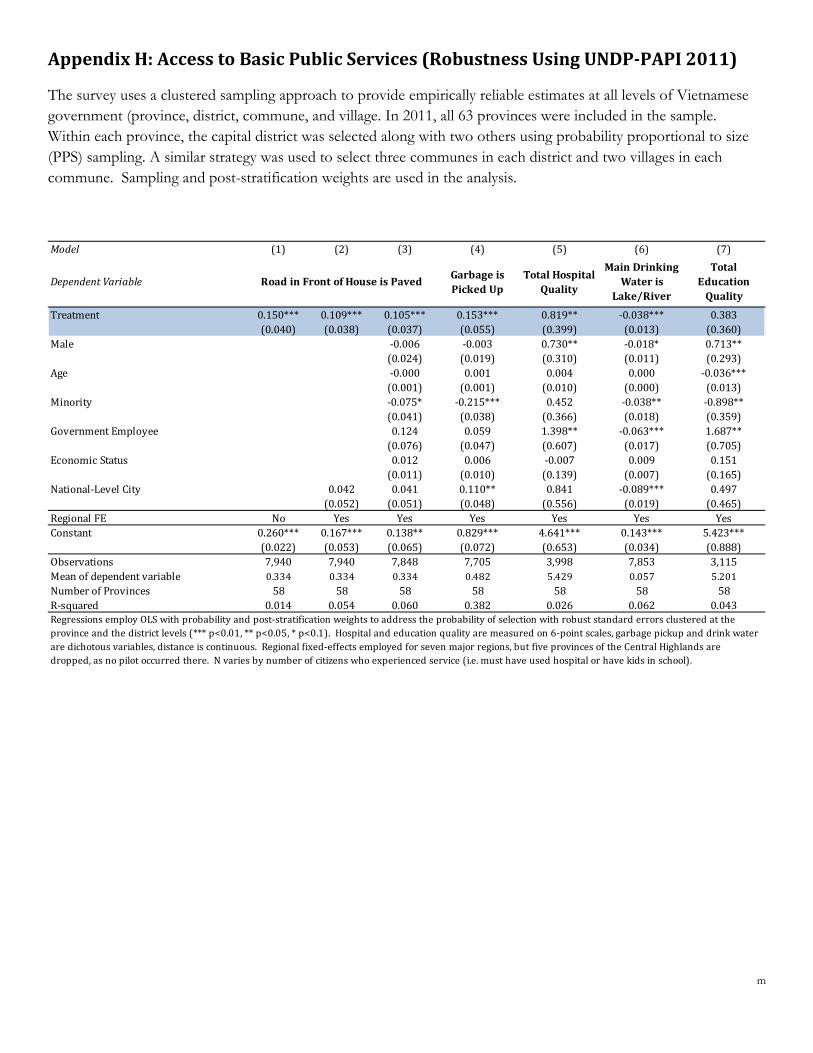
m
Appendix H: Access to Basic Public Services (Robustness Using UNDP-PAPI 2011)
The survey uses a clustered sampling approach to provide empirically reliable estimates at all levels of Vietnamese government (province, district, commune, and village. In 2011, all 63 provinces were included in the sample. Within each province, the capital district was selected along with two others using probability proportional to size (PPS) sampling. A similar strategy was used to select three communes in each district and two villages in each commune. Sampling and post-stratification weights are used in the analysis.
Model (1) (2) (3) (4) (5) (6) (7)
Dependent Variable Garbage is Picked Up
Total Hospital Quality
Main Drinking Water is
Lake/River
Total Education
Quality
Treatment 0.150*** 0.109*** 0.105*** 0.153*** 0.819** -0.038*** 0.383(0.040) (0.038) (0.037) (0.055) (0.399) (0.013) (0.360)
Male -0.006 -0.003 0.730** -0.018* 0.713**(0.024) (0.019) (0.310) (0.011) (0.293)
Age -0.000 0.001 0.004 0.000 -0.036***(0.001) (0.001) (0.010) (0.000) (0.013)
Minority -0.075* -0.215*** 0.452 -0.038** -0.898**(0.041) (0.038) (0.366) (0.018) (0.359)
Government Employee 0.124 0.059 1.398** -0.063*** 1.687**(0.076) (0.047) (0.607) (0.017) (0.705)
Economic Status 0.012 0.006 -0.007 0.009 0.151(0.011) (0.010) (0.139) (0.007) (0.165)
National-Level City 0.042 0.041 0.110** 0.841 -0.089*** 0.497(0.052) (0.051) (0.048) (0.556) (0.019) (0.465)
Regional FE No Yes Yes Yes Yes Yes YesConstant 0.260*** 0.167*** 0.138** 0.829*** 4.641*** 0.143*** 5.423***
(0.022) (0.053) (0.065) (0.072) (0.653) (0.034) (0.888)Observations 7,940 7,940 7,848 7,705 3,998 7,853 3,115Mean of dependent variable 0.334 0.334 0.334 0.482 5.429 0.057 5.201Number of Provinces 58 58 58 58 58 58 58R-squared 0.014 0.054 0.060 0.382 0.026 0.062 0.043
Road in Front of House is Paved
Regressions employ OLS with probability and post-stratification weights to address the probability of selection with robust standard errors clustered at the province and the district levels (*** p<0.01, ** p<0.05, * p<0.1). Hospital and education quality are measured on 6-point scales, garbage pickup and drink water are dichotous variables, distance is continuous. Regional fixed-effects employed for seven major regions, but five provinces of the Central Highlands are dropped, as no pilot occurred there. N varies by number of citizens who experienced service (i.e. must have used hospital or have kids in school).

n
Appendix I: Equality of Service Delivery by District within Province (Aggregate Indices)
Model (1) (2) (3) (4) (5) (6)
Dependent Variable Transportation index (Gini)
Agricultural Services index
(Gini)
Health Service index (Gini)
Education index (Gini)
Communication index (Gini)
Household business
development index (Gini)
Time (2008 to 2010) 0.003 -0.015 0.024 -0.003 -0.002 -0.013(0.007) (0.010) (0.027) (0.013) (0.009) (0.015)
Treatment 0.020 0.017 0.050 -0.013 0.020 -0.022(0.016) (0.019) (0.043) (0.017) (0.015) (0.022)
Time*Treatment -0.022 -0.016 -0.094 0.017 0.006 0.033(0.024) (0.024) (0.058) (0.024) (0.026) (0.032)
National-Level City 0.023 0.003 -0.130** 0.007 0.021 -0.019(0.017) (0.014) (0.056) (0.019) (0.018) (0.023)
Regional FE Yes Yes Yes Yes Yes YesConstant 0.362*** 0.448* 0.564 -0.006 0.097 0.242
(0.138) (0.249) (0.449) (0.222) (0.199) (0.273)Observations 114 114 114 114 114 114Mean of Dependent Variable (2008) 0.121 0.153 0.511 0.187 0.127 0.216Number of provinces 57 57 57 57 57 57R-squared 0.295 0.328 0.303 0.253 0.392 0.373
Between 2008 and 2010
Regressions employ OLS on provincial averages of dependent variables with robust standard errors clustered at the province level (*** p<0.01, ** p<0.05, * p<0.1). Regional fixed-effects are employed for seven major regions, but five provinces of the Central Highlands are dropped, as no pilot occurred there. Dependent variables are the Gini coefficients, measuring the inequality of public service delivery among districts within the 57 provinces.
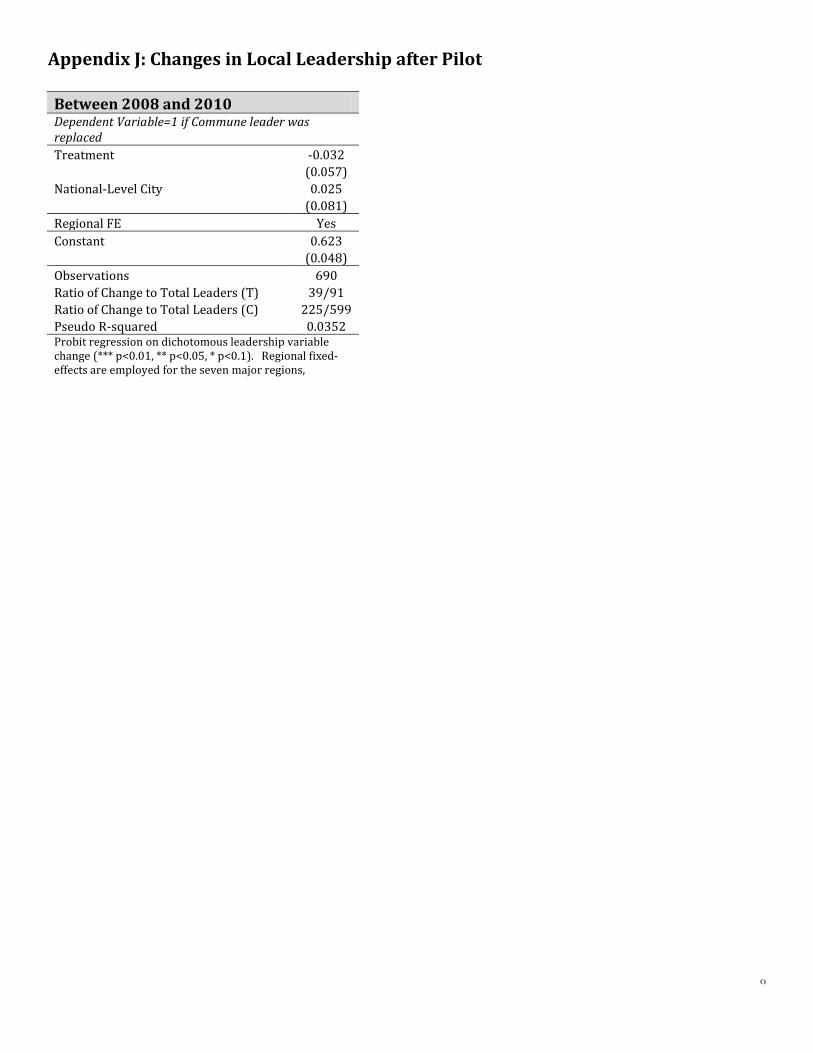
o
Appendix J: Changes in Local Leadership after Pilot Between 2008 and 2010 Dependent Variable=1 if Commune leader was replaced Treatment -0.032 (0.057) National-Level City 0.025 (0.081) Regional FE Yes Constant 0.623 (0.048) Observations 690 Ratio of Change to Total Leaders (T) 39/91 Ratio of Change to Total Leaders (C) 225/599 Pseudo R-squared 0.0352 Probit regression on dichotomous leadership variable change (*** p<0.01, ** p<0.05, * p<0.1). Regional fixed-effects are employed for the seven major regions,

p
Appendix K: Difference-in-Means in Special Projects in Province (during Pilot)
Control Treatment T-Statistic P-ValueLevel of MOHA Funding over Provincial GDP 2010 n=53 n=10Total funding for all programs 3.03% 2.08% 1.02 0.31Official development assistance 0.45% 0.46% 0.05 0.96Infrastructure for port econ zone 0.08% 0.15% 0.66 0.51Agricultural extension 0.03% 0.04% 0.41 0.69Infrastructure for tourism 0.09% 0.06% 0.91 0.37Local healthcare 0.06% 0.03% 1.74 0.09Province/district split 0.22% 0.05% 1.40 0.17Funding for minority people 0.02% 0.01% 0.88 0.38Cutural programs 0.05% 0.04% 0.13 0.90ODA matching fund 0.16% 0.10% 1.00 0.32Other programs 0.34% 0.27% 0.49 0.63Forest development 0.02% 0.02% 0.62 0.54Growth in MOHA Funding between 2008 and 2010 n=53 n=10Total funding for all programs 4.4% -10.7% 1.42 0.16Official development assistance 24.8% -15.4% 1.70 0.09Infrastructure for port econ zone -6.6% 5.5% 0.31 0.76Agricultural extension -36.5% -13.7% 1.35 0.18Infrastructure for tourism -4.7% -16.3% 1.72 0.09Local healthcare -55.8% -58.3% 0.33 0.74Province/district split 16.9% 27.8% 0.41 0.68Funding for minority people -90.2% -79.0% 0.61 0.54Cutural programs -24.0% -41.5% 0.65 0.52ODA matching fund 53.2% 15.8% 1.03 0.31Other programs -2.2% -14.3% 0.60 0.55Forest development -26.3% -35.5% 0.64 0.52
VariableMeans Difference in Means (All) (All)
Data is non-public data from the Ministry of Finance (2008-2010). We standardize both figures by nominal, provincial GDP.

q
Appendix L: Difference-in-Means State Investment in Province (during Pilot)
Control Treatment T-Statistic P-ValueLevel of Central SOE Transfer Indicators (2009 & 2010) n=100 n=20Capital/Provincial GDP 25.30% 28.71% -0.16 0.87Liabilities/Provincial GDP 17.30% 21.77% -0.29 0.77State Equity/Provincial GDP 8.00% 6.93% 0.17 0.87Investment/Provincial GDP 1.31% 1.31% -0.01 0.99Construction Outlays/Provincial GDP 4.16% 2.17% 0.34 0.73Assets under Management/Provincial GDP 2.06% 2.18% -0.17 0.87Growth in Central SOE Transfer Indicators (2008-2010) n=49 n=10Capital/Provincial GDP 23.3% 13.2% 0.28 0.78Liabilities/Provincial GDP 16.7% 9.3% 0.27 0.78State Equity/Provincial GDP 6.6% 3.8% 0.28 0.78Investment/Provincial GDP 0.3% -0.8% 2.34 0.02Construction Outlays/Provincial GDP 2.6% -0.4% 0.86 0.39Assets under Management/Provincial GDP 0.8% 0.6% 0.25 0.80
Means Difference in Means (All) (All)
Data is from the GSO Enterprise Census (2008-2010). Using the annual census, we create aggregate measures for centrally-managed SOEs in each province. We standardize both figures by nominal, provincial GDP.
Variable