munich personal repec archive di sektor primer sangat rentan karena tergantung fluktuasi harga...
TRANSCRIPT
MPRAMunich Personal RePEc Archive
Indonesia towards 2030 and beyond: ALong-Run International Trade Foresight
Kiki Verico
LPEM FEB UI
5 June 2017
Online at https://mpra.ub.uni-muenchen.de/79665/MPRA Paper No. 79665, posted 12 June 2017 04:46 UTC
1
Indonesia towards 2030 and beyond: A Long-Run International Trade Foresight Kiki Verico1
Abstract One of the most important variables in emerging economies like Indonesia is the stability of the exchange rate. Unstable exchange rates make it almost impossible for business ventures to plan their businesses. The higher the depreciation of the Rupiah, the higher the inflation rate, and this will decrease people's purchasing power. In the balance of payments, the stability of the exchange rate and capital account are strongly influenced by the current account balance. A study found that in Indonesia, in the long run (Johansen Procedure) Indonesia’s current account balance affects its real exchange rate, while in the short run (VECM) it affects the nominal exchange rate. The study also found that in the current account balance, the factor affecting the exchange rate is the trade balance. Indonesia's trade balance relies on a surplus of trade in goods, especially agricultural products, petroleum and gas. The price of products in the primary sector is very vulnerable because of the volatility of primary products as a result of the world’s oil and gas price. Indonesia's current account balance is highly dependent on manufacturing products’ trade. Another study found that in practice, manufacturing trade influences capital flows, rather than vice versa. Therefore, in order to maintain a positive long-term economic growth and stable exchange rate, Indonesia must increase its trade competitiveness, especially in the manufacturing sector. This paper will explore the challenges and opportunities of international trade in Indonesia towards 2030 and afterwards.
Abstrak Salah satu variabel paling penting dalam perekonomian emerging countries seperti Indonesia adalah kestabilan nilai tukar. Nilai tukar yang tidak stabil membuat hampir seluruh bisnis sulit merencanakan usaha dan pelemahan Rupiah yang besar akan meningkatkan inflasi yang menurunkan daya beli masyarakat. Di dalam neraca pembayaran, kestabilan nilai tukar dan neraca modal sangat dipengaruhi oleh neraca transaksi berjalan. Sebuah studi menemukan bahwa di Indonesia, dalam jangka panjang (Johansen Procedure), neraca transaksi berjalan mempengaruhi nilai tukar riil sementara dalam jangka pendek (VECM) neraca transaksi berjalan mempengaruhi nilai tukar nominal. Studi tersebut juga menemukan bahwa di dalam neraca transaksi berjalan yang mempengaruhi nilai tukar adalah neraca transaksi perdagangan. Neraca transaksi perdagangan Indonesia mengandalkan surplus dari perdagangan barang khususnya produk pertanian, minyak bumi dan gas. Harga produk di sektor primer sangat rentan karena tergantung fluktuasi harga minyak bumi sehingga pada dasarnya, neraca transaksi berjalan Indonesia sangat tergantung pada transaksi perdagangan produk manufaktur. Studi lain menemukan bahwa di dalam perdagangan manufaktur sektor riil lebih mempengaruhi arus modal ketimbang sebaliknya. Oleh karena itu untuk mempertahankan pertumbuhan ekonomi jangka panjang yang positif dan nilai tukar yang stabil maka Indonesia harus meningkatkan daya saing perdagangan khususnya di sektor manufaktur. Tulisan ini akan mengupas tentang tantangan dan peluang perdagangan internasional Indonesia menuju 2030 dan setelahnya.
1 The writer is a lecturer of FEB UI and Deputy Head of LPEM FEB UI. The author earned his bachelor degree in Economics from the Department of Economics (Ilmu Ekonomi & Studi Pembangunan) of Faculty of Economics of Universitas Indonesia in 1995 concentrating in Monetary Economics. The author later earned a Master degree in Regional Integration (IMRI) from the double degree program of the University of Malaya and Universidad Autonoma de Madrid in 2005 and Doctor of Philosophy in International Studies (International Economics) from Waseda University - Japan in 2013.
2
This paper consists of four main sections as shown below:
I. Opening: Indonesia Economic Review 2030
1.1. Evaluation of Indonesian Economic Estimates
1.2. New Calculation of Indonesian Economic Estimation
II. Challenges and Opportunities of International Trade in Indonesia 2030
2.1. Challenge of International Trade Indonesia
2.2. Indonesia International Trade Opportunity
III. Globalization and International Trade Strategy of Indonesia 2030
3.1. Development of Globalization and Records for Indonesia
3.2. Indonesia International Trade Strategy
IV. Conclusion: The Asia Miracle and Indonesia’s Hope
3
I. Introduction: An Overview of Indonesia Economy 2030
1.1. Reviews of Indonesia’s Previous 2030 Economic Estimation
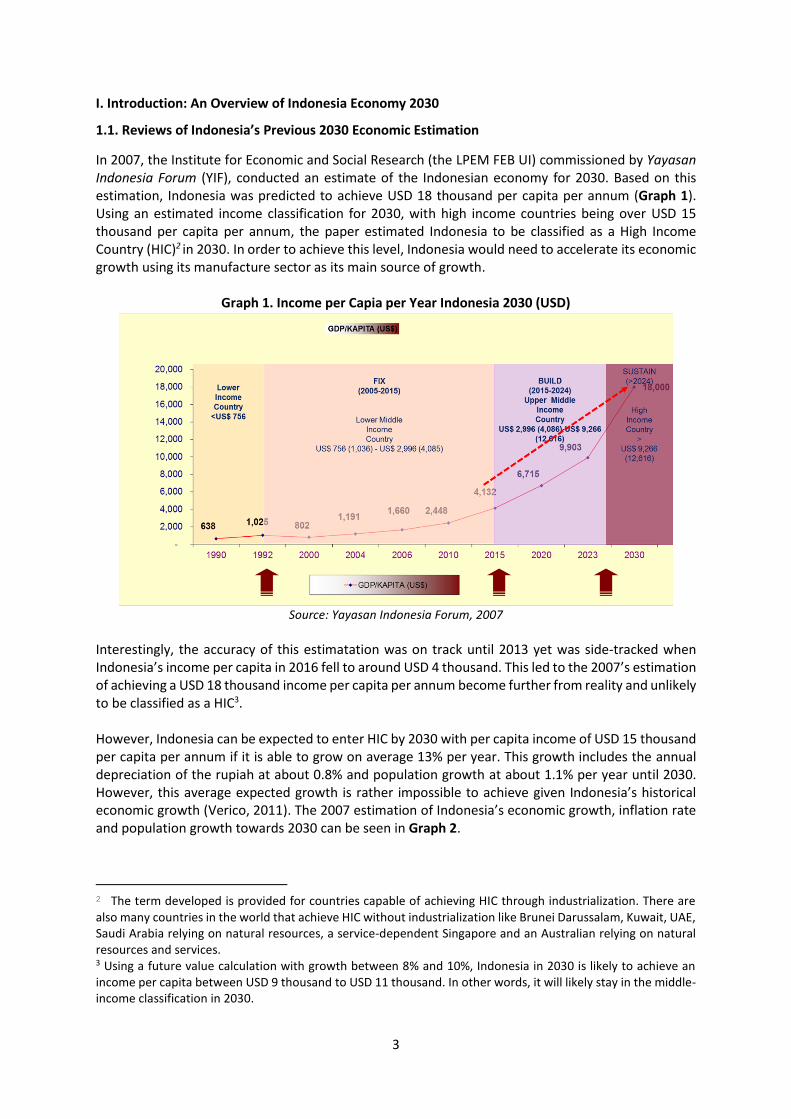
In 2007, the Institute for Economic and Social Research (the LPEM FEB UI) commissioned by Yayasan Indonesia Forum (YIF), conducted an estimate of the Indonesian economy for 2030. Based on this estimation, Indonesia was predicted to achieve USD 18 thousand per capita per annum (Graph 1). Using an estimated income classification for 2030, with high income countries being over USD 15 thousand per capita per annum, the paper estimated Indonesia to be classified as a High Income Country (HIC)2 in 2030. In order to achieve this level, Indonesia would need to accelerate its economic growth using its manufacture sector as its main source of growth.
Graph 1. Income per Capia per Year Indonesia 2030 (USD)
Source: Yayasan Indonesia Forum, 2007
Interestingly, the accuracy of this estimatation was on track until 2013 yet was side-tracked when Indonesia’s income per capita in 2016 fell to around USD 4 thousand. This led to the 2007’s estimation of achieving a USD 18 thousand income per capita per annum become further from reality and unlikely to be classified as a HIC3. However, Indonesia can be expected to enter HIC by 2030 with per capita income of USD 15 thousand per capita per annum if it is able to grow on average 13% per year. This growth includes the annual depreciation of the rupiah at about 0.8% and population growth at about 1.1% per year until 2030. However, this average expected growth is rather impossible to achieve given Indonesia’s historical economic growth (Verico, 2011). The 2007 estimation of Indonesia’s economic growth, inflation rate and population growth towards 2030 can be seen in Graph 2.
2 The term developed is provided for countries capable of achieving HIC through industrialization. There are also many countries in the world that achieve HIC without industrialization like Brunei Darussalam, Kuwait, UAE, Saudi Arabia relying on natural resources, a service-dependent Singapore and an Australian relying on natural resources and services. 3 Using a future value calculation with growth between 8% and 10%, Indonesia in 2030 is likely to achieve an income per capita between USD 9 thousand to USD 11 thousand. In other words, it will likely stay in the middle-income classification in 2030.
4
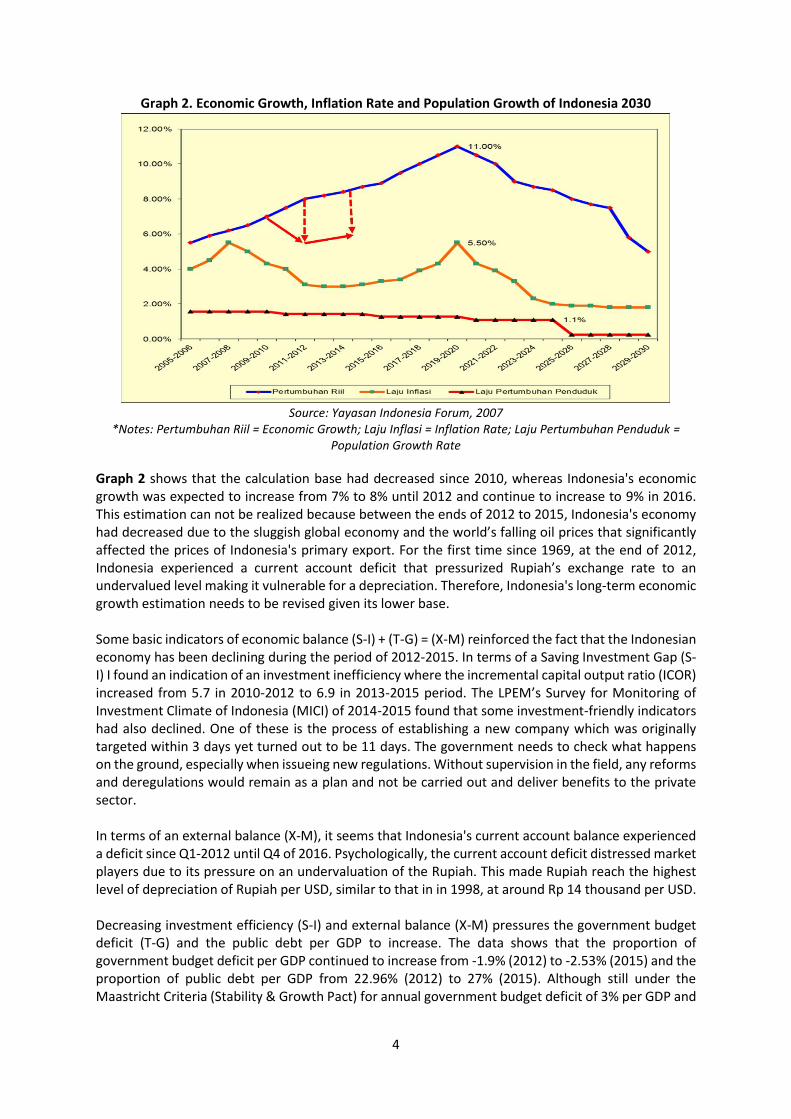
Graph 2. Economic Growth, Inflation Rate and Population Growth of Indonesia 2030
Source: Yayasan Indonesia Forum, 2007
*Notes: Pertumbuhan Riil = Economic Growth; Laju Inflasi = Inflation Rate; Laju Pertumbuhan Penduduk = Population Growth Rate
Graph 2 shows that the calculation base had decreased since 2010, whereas Indonesia's economic growth was expected to increase from 7% to 8% until 2012 and continue to increase to 9% in 2016. This estimation can not be realized because between the ends of 2012 to 2015, Indonesia's economy had decreased due to the sluggish global economy and the world’s falling oil prices that significantly affected the prices of Indonesia's primary export. For the first time since 1969, at the end of 2012, Indonesia experienced a current account deficit that pressurized Rupiah’s exchange rate to an undervalued level making it vulnerable for a depreciation. Therefore, Indonesia's long-term economic growth estimation needs to be revised given its lower base. Some basic indicators of economic balance (S-I) + (T-G) = (X-M) reinforced the fact that the Indonesian economy has been declining during the period of 2012-2015. In terms of a Saving Investment Gap (S-I) I found an indication of an investment inefficiency where the incremental capital output ratio (ICOR) increased from 5.7 in 2010-2012 to 6.9 in 2013-2015 period. The LPEM’s Survey for Monitoring of Investment Climate of Indonesia (MICI) of 2014-2015 found that some investment-friendly indicators had also declined. One of these is the process of establishing a new company which was originally targeted within 3 days yet turned out to be 11 days. The government needs to check what happens on the ground, especially when issueing new regulations. Without supervision in the field, any reforms and deregulations would remain as a plan and not be carried out and deliver benefits to the private sector. In terms of an external balance (X-M), it seems that Indonesia's current account balance experienced a deficit since Q1-2012 until Q4 of 2016. Psychologically, the current account deficit distressed market players due to its pressure on an undervaluation of the Rupiah. This made Rupiah reach the highest level of depreciation of Rupiah per USD, similar to that in in 1998, at around Rp 14 thousand per USD. Decreasing investment efficiency (S-I) and external balance (X-M) pressures the government budget deficit (T-G) and the public debt per GDP to increase. The data shows that the proportion of government budget deficit per GDP continued to increase from -1.9% (2012) to -2.53% (2015) and the proportion of public debt per GDP from 22.96% (2012) to 27% (2015). Although still under the Maastricht Criteria (Stability & Growth Pact) for annual government budget deficit of 3% per GDP and
5
public debt per GDP of 60%, yet the level is quite alarming therefore during this period Indonesia could not achieve an ‘investment grade’ from investment rating agencies such as S & P, Fitch and Moody's. In 2016, the Indonesian economy started to record some significant improvements. The current account deficit declined due to the world’s increasing oil price which influences Indonesia's export value particularly its primary products. Given Indonesia’s current fiscal discipline, the first time after its reform era, Indonesia obtained an ‘investment grade’ from the S & P on May 19, 2017. The Ministry of Finance managed to keep the budget away from the increasing deficit of annual budget and public debt per GDP. 1.2. New Indonesian 2030 Economic Estimation
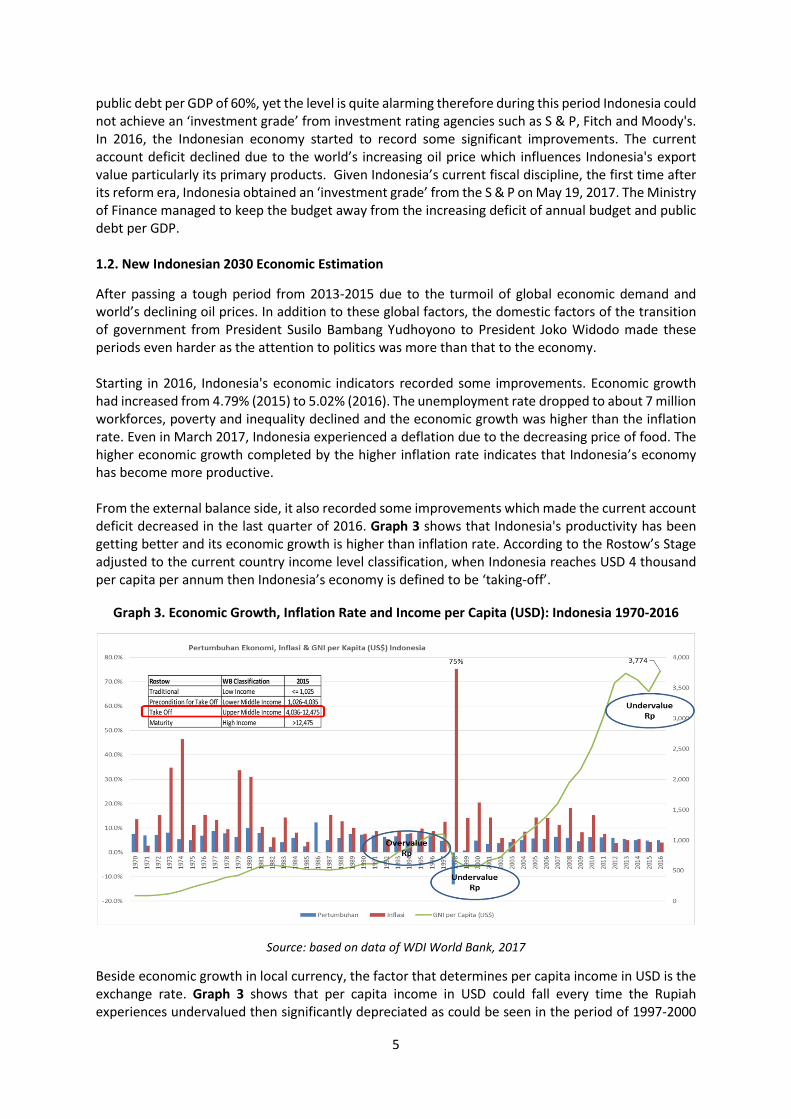
After passing a tough period from 2013-2015 due to the turmoil of global economic demand and world’s declining oil prices. In addition to these global factors, the domestic factors of the transition of government from President Susilo Bambang Yudhoyono to President Joko Widodo made these periods even harder as the attention to politics was more than that to the economy. Starting in 2016, Indonesia's economic indicators recorded some improvements. Economic growth had increased from 4.79% (2015) to 5.02% (2016). The unemployment rate dropped to about 7 million workforces, poverty and inequality declined and the economic growth was higher than the inflation rate. Even in March 2017, Indonesia experienced a deflation due to the decreasing price of food. The higher economic growth completed by the higher inflation rate indicates that Indonesia’s economy has become more productive. From the external balance side, it also recorded some improvements which made the current account deficit decreased in the last quarter of 2016. Graph 3 shows that Indonesia's productivity has been getting better and its economic growth is higher than inflation rate. According to the Rostow’s Stage adjusted to the current country income level classification, when Indonesia reaches USD 4 thousand per capita per annum then Indonesia’s economy is defined to be ‘taking-off’.
Graph 3. Economic Growth, Inflation Rate and Income per Capita (USD): Indonesia 1970-2016
Source: based on data of WDI World Bank, 2017
Beside economic growth in local currency, the factor that determines per capita income in USD is the exchange rate. Graph 3 shows that per capita income in USD could fall every time the Rupiah experiences undervalued then significantly depreciated as could be seen in the period of 1997-2000
6
and 2013-2015. Because of this, projection for per capita income in USD requires the estimation of local currency depreciation rate and population growth. According to LPEM (2017), the estimated depreciation of the Rupiah up to 2030 is around 0.8% per annum with population growth of approximately 1.1% per annum. If in 2030 Indonesia is expected to enter the category of high-income country with its corresponding criteria in 2030, then Indonesia needs to achieve atleast USD 15 thousand per capita per annum by 2030. Given this, then Indonesia requires an average economic growth of 13% until 2030. This estimation would be difficult or even almost impossible to achieve. The study then uses several scenarios of real economic growth in Rupiah between 7.9% and 9.9% and estimates Indonesia’s per capita income per annum in 2030 to be between USD 9 to 11.7 thousand instead of USD 18 thousand. I estimate that until 2030 Indonesia will still not reach the category of a high-income country. Indonesia however might be able to enter this category in 2036 (assuming its future corresponding scale) on the condition of being able to record an average real economic growth of around 8.9%. But there is one challenge that can hamper this, that is that Indonesia is expected to reach its peak in its productive age worker in year 2030 with 53.1% of total population and then decreasing by 2031. Indonesia will enter the so-called ‘late dividend’ from its demographic bonus starting in 2031 (Amaglobeli & Shi, 2016). Indonesia's dependency ratio is estimated to increase from 46.9% in 2030 to 47.3% in 2031. This means that if Indonesia wants to avoid the 'Middle Income Trap' and enter the high-income country level by 2036 then there should be a large effort which includes extending its productive age from 65 years old. The prolonged age of productivity requires two conditions: one, a supportive health sector that suports the productivity and longeivity of Indonesia’s human resources; and two, the productivity of the working age population increases along with the growth of capital and technology. This improvement requires Indonesia’s production and trade networks to be involved at least at the regional level. Three, encouraging Micro Small Medium Enterprises (SMEs) to generate foreign reserves and to be more competitive at the global level. Before describing the major factors in economic growth especially from the international trade side, the theory of economic growth from combination of Harrod Domar and Solow growth is presented below.
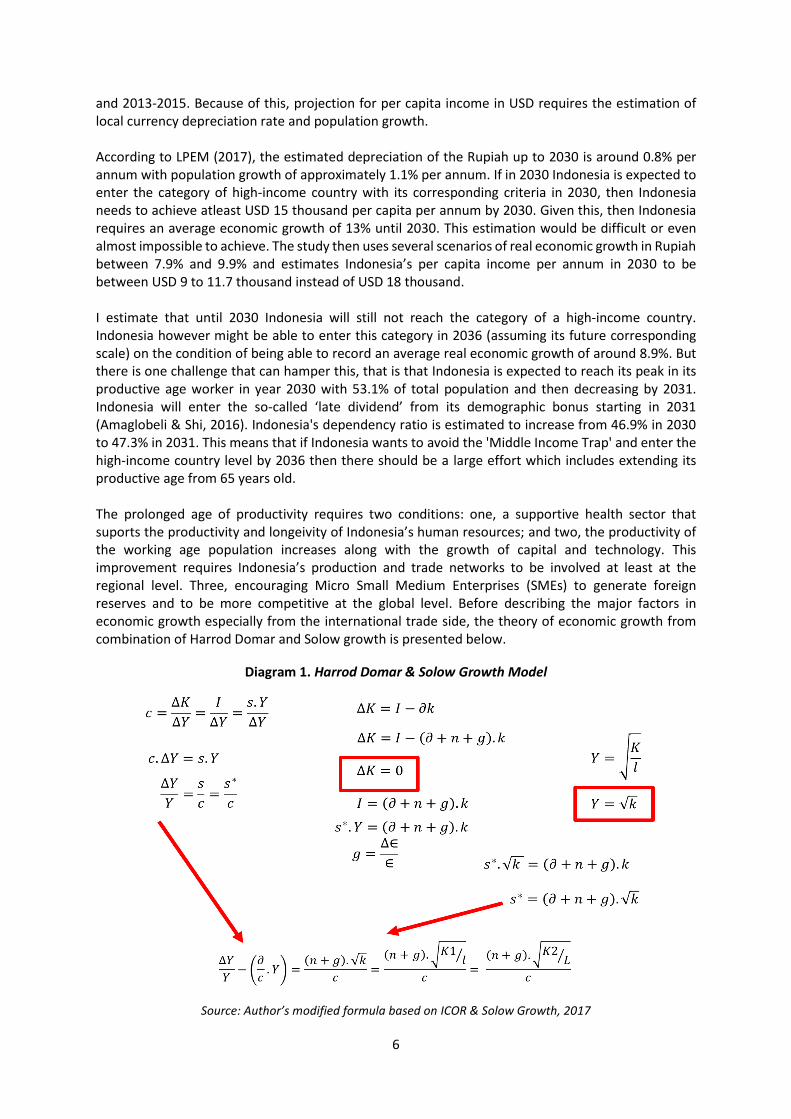
Diagram 1. Harrod Domar & Solow Growth Model
Source: Author’s modified formula based on ICOR & Solow Growth, 2017
7
The formula in Diagram 1 shows that the major factors in economic growth are population (n), human productivity (g), institutional reform (c) and natural sustainability (ɣ). The government estimates that the Indonesian population will experience a decline in the number of productive age by 2030, while institutional reform and natural sustainability are beyond the scope of this paper. This paper focuses on human productivity in terms of global competitiveness of trade. II. Challenges and Opprtunities Indonesia’s International Trade
2.1. Indonesia International Trade: Challenges
Basic trade theory is rooted in the comparative worker productivity both in absolute and comparative
advantage terms. Productivity uses marginal productivity of labor (MPL) as its approach. This paper
proposes two basic indicators of worker’s productivity: Revealed Comparative Advantage (RCA) and
Constant Market Share Analysis (CMSA) to estimate Indonesia’s global competitiveness4.
RCA shows the relative productivity of a country in a static pattern, while CMSA calculates this in a more dynamic pattern. The results of RCA and CMSA calculations using secondary data of 2000 and 2015 for RCA, 2000-2005 and 2005-2015 for CMSA, as shown in Diagram 2 and Diagram 3, is that in terms of international trade, Indonesia is still superior in its primary products such as agriculture, oil and gas and industrial products of food and beverage. While labor-intensive industries such as textiles, clothing and footwear which used to be Indonesia’s comparative advantage has begun to decline. Using OECD indicators for global value added networks, especially on backward linkage calculations, I 4 The combination of RCA and CMSA is useful to identify the competitive product and combination of RCA and
NX is useful to find the comparative advantage product (Salvatore, International Economics, 2004). The indexes
are described as follows:
Revealed Comparative Advantage (RCA):
txtx
txtx
Xw / Xiw
Xj/ XijijtxRCA
Variables: ijtxX = Value of Export of commodity i in country j at tx time; Xj tx = Total value of Export in
country j at tx time; Xiw tx = Value of Export of commodity i in the world (W) at tx time; Xw tx = Total value of Export in the World (W) at tx time; Constant Market Share Analysis (CMSA):
).().(. 0010001 ijwttiwjijwtijwtijwttiwjtiwjijwttiwjijwtijwt XmXXXmmXmXX
General Factor: ; Composition Factor: 0).( ijwttiwjtiwj Xmm ; Comparative Factor :
).( 001 ijwttiwjjnwtijwt XmXX ; Variables: Xijwt0 = Value of Export of commodity i in country j to world
at to time; Xijwt1 = Value of Export of commodity i in country j to world at t1 time; ∑miw∆t = changing in total world import; miw∆t = changing in world import on commodity i . The combination of RCA and CMSA will reveal the competitive product. The most competitive product is the
product with a high RCA and positive CMSA comparative index. The product is classified as ‘Great’ if it has RCA
more than 1 (one) and Sector Comparative Factor more than 0 (zero), ‘Challenging’ if it has RCA more than 1
(one) and Sector Comparative Factor less than 0 (zero), ‘Potential’ if it has RCA less than 1 (one) and Sector
Comparative Factor more than 0 (zero) and ‘None’ if it has RCA less than 1 (one) and Sector Comparative Factor
less than 0 (zero).
0. ijwttiwj Xm
8
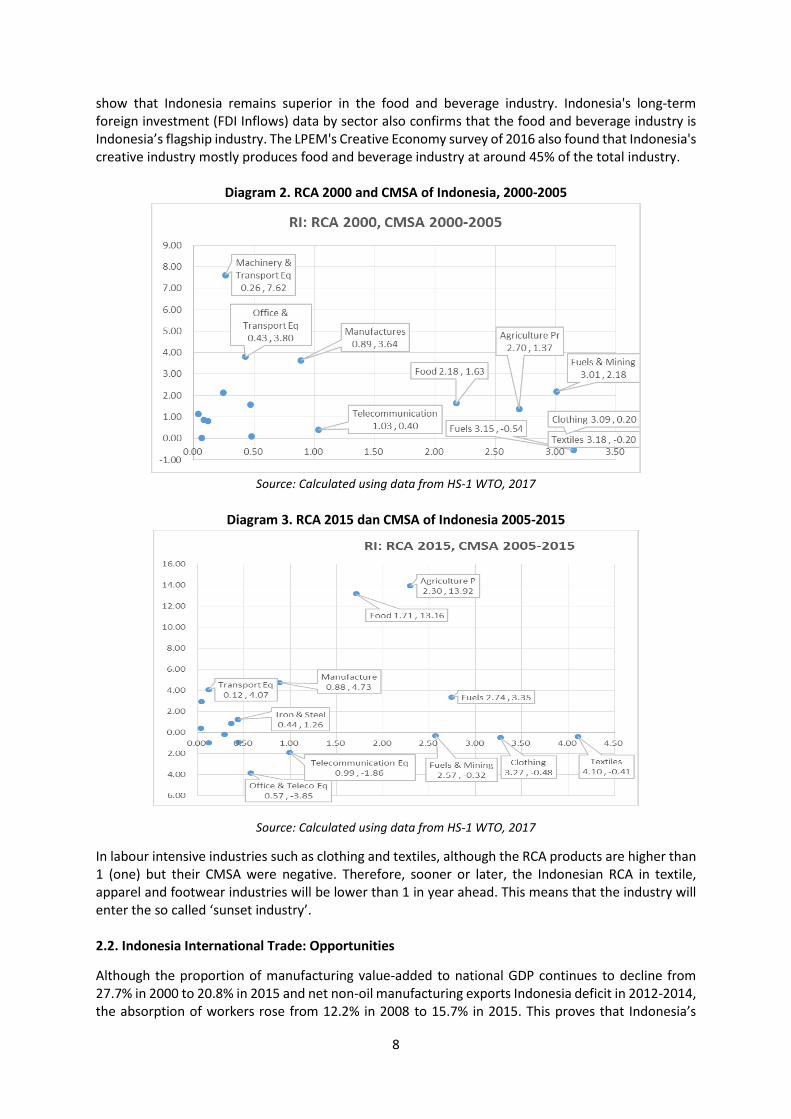
show that Indonesia remains superior in the food and beverage industry. Indonesia's long-term foreign investment (FDI Inflows) data by sector also confirms that the food and beverage industry is Indonesia’s flagship industry. The LPEM's Creative Economy survey of 2016 also found that Indonesia's creative industry mostly produces food and beverage industry at around 45% of the total industry.
Diagram 2. RCA 2000 and CMSA of Indonesia, 2000-2005
Source: Calculated using data from HS-1 WTO, 2017
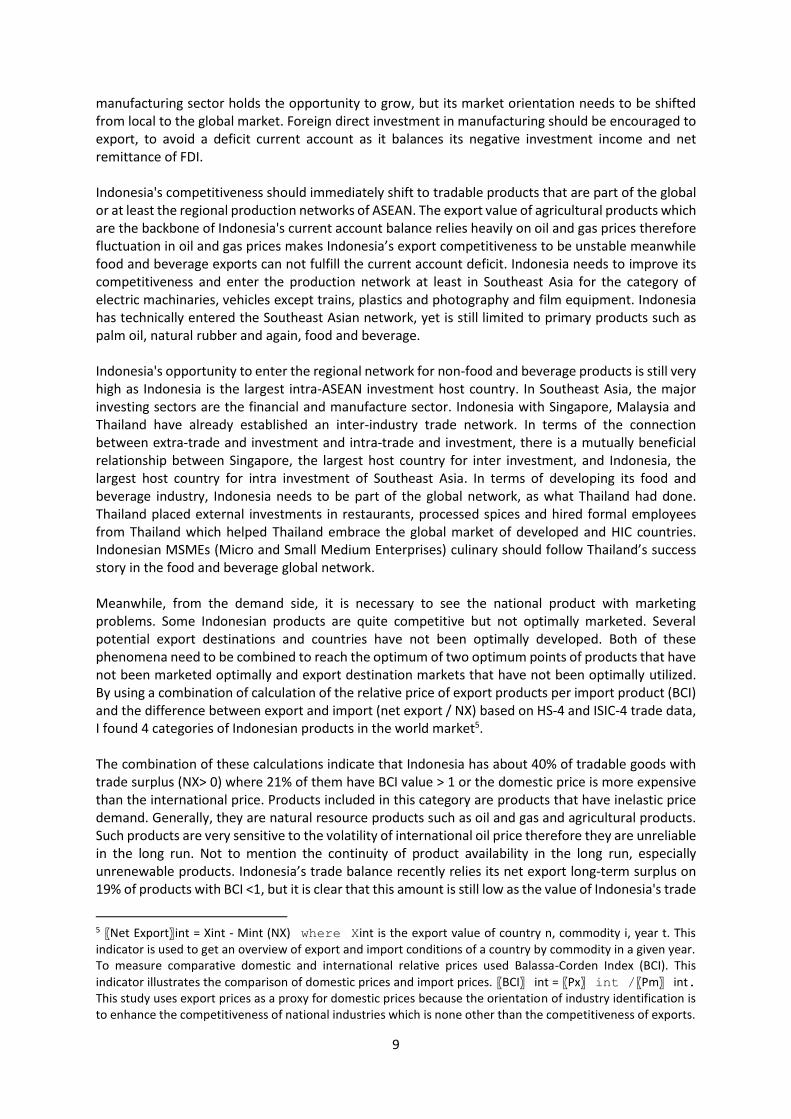
Diagram 3. RCA 2015 dan CMSA of Indonesia 2005-2015
Source: Calculated using data from HS-1 WTO, 2017
In labour intensive industries such as clothing and textiles, although the RCA products are higher than 1 (one) but their CMSA were negative. Therefore, sooner or later, the Indonesian RCA in textile, apparel and footwear industries will be lower than 1 in year ahead. This means that the industry will enter the so called ‘sunset industry’. 2.2. Indonesia International Trade: Opportunities
Although the proportion of manufacturing value-added to national GDP continues to decline from 27.7% in 2000 to 20.8% in 2015 and net non-oil manufacturing exports Indonesia deficit in 2012-2014, the absorption of workers rose from 12.2% in 2008 to 15.7% in 2015. This proves that Indonesia’s
9
manufacturing sector holds the opportunity to grow, but its market orientation needs to be shifted from local to the global market. Foreign direct investment in manufacturing should be encouraged to export, to avoid a deficit current account as it balances its negative investment income and net remittance of FDI. Indonesia's competitiveness should immediately shift to tradable products that are part of the global or at least the regional production networks of ASEAN. The export value of agricultural products which are the backbone of Indonesia's current account balance relies heavily on oil and gas prices therefore fluctuation in oil and gas prices makes Indonesia’s export competitiveness to be unstable meanwhile food and beverage exports can not fulfill the current account deficit. Indonesia needs to improve its competitiveness and enter the production network at least in Southeast Asia for the category of electric machinaries, vehicles except trains, plastics and photography and film equipment. Indonesia has technically entered the Southeast Asian network, yet is still limited to primary products such as palm oil, natural rubber and again, food and beverage. Indonesia's opportunity to enter the regional network for non-food and beverage products is still very high as Indonesia is the largest intra-ASEAN investment host country. In Southeast Asia, the major investing sectors are the financial and manufacture sector. Indonesia with Singapore, Malaysia and Thailand have already established an inter-industry trade network. In terms of the connection between extra-trade and investment and intra-trade and investment, there is a mutually beneficial relationship between Singapore, the largest host country for inter investment, and Indonesia, the largest host country for intra investment of Southeast Asia. In terms of developing its food and beverage industry, Indonesia needs to be part of the global network, as what Thailand had done. Thailand placed external investments in restaurants, processed spices and hired formal employees from Thailand which helped Thailand embrace the global market of developed and HIC countries. Indonesian MSMEs (Micro and Small Medium Enterprises) culinary should follow Thailand’s success story in the food and beverage global network. Meanwhile, from the demand side, it is necessary to see the national product with marketing problems. Some Indonesian products are quite competitive but not optimally marketed. Several potential export destinations and countries have not been optimally developed. Both of these phenomena need to be combined to reach the optimum of two optimum points of products that have not been marketed optimally and export destination markets that have not been optimally utilized. By using a combination of calculation of the relative price of export products per import product (BCI) and the difference between export and import (net export / NX) based on HS-4 and ISIC-4 trade data, I found 4 categories of Indonesian products in the world market5. The combination of these calculations indicate that Indonesia has about 40% of tradable goods with trade surplus (NX> 0) where 21% of them have BCI value > 1 or the domestic price is more expensive than the international price. Products included in this category are products that have inelastic price demand. Generally, they are natural resource products such as oil and gas and agricultural products. Such products are very sensitive to the volatility of international oil price therefore they are unreliable in the long run. Not to mention the continuity of product availability in the long run, especially unrenewable products. Indonesia’s trade balance recently relies its net export long-term surplus on 19% of products with BCI <1, but it is clear that this amount is still low as the value of Indonesia's trade
5 〖Net Export〗int = Xint - Mint (NX) where Xint is the export value of country n, commodity i, year t. This indicator is used to get an overview of export and import conditions of a country by commodity in a given year. To measure comparative domestic and international relative prices used Balassa-Corden Index (BCI). This
indicator illustrates the comparison of domestic prices and import prices. 〖BCI〗 int = 〖Px〗 int /〖Pm〗 int. This study uses export prices as a proxy for domestic prices because the orientation of industry identification is to enhance the competitiveness of national industries which is none other than the competitiveness of exports.
10
balance is susceptible to future deficits and this condition is very dangerous because the trade balance is the major source of Indonesia's current account surplus. Indonesia has 60% of export products with deficit condition (NX <0) where 35% have BCI> 1, because domestic price is higher than the international price. Products in this category have problems on the competitiveness side. While 25% of Indonesian products have marketing problems because BCI <1 or domestic prices are cheaper than international prices yet the value of net exports remains deficit. Products that fall into this category are suspected to have marketing issues. For this category of products, Indonesia needs to enhance its marketing coverage from traditional old trading partners to the potential markets such as Africa and Latin America. A simultaneous effort by the government is needed to help Indonesian exporters, both the large and medium-sized enterprises, to compete in the global market. Taiwan is an example of the success story of MSMEs role in the global market. Indonesia could imitate this primarily because the potential in collecting foreign currencies in the future will rely more on the global competitiveness of local SMEs. Other opportunities is prediected to come from China. In April 2017, the IMF report shows that China's economic growth will drop from 6.6% in 2017 to 6.2% by 2018. Verico (2017) shows that economic relationship between China and Indonesia is more to substitution rather than complementary in contrast to the economic relations between China and Malaysia, China and Thailand and China and Singapore. This means that if China’s economic growth is predicted to decline, then Indonesia’s trade balance and economic growth could be the opposite, and increase. Therefore Indonesia is expected to gain a positive spill-over effect from China’s slowing down economic growth. The spill-over could come from both the investment diversion from China’s FDI home countries to Indonesia and from China’s FDI investors who are interested to invest in Indonesia rather than investing in their domestic market.
11
III. Globalization and Indonesia’s International Trade Strategy
3.1. Globalization Progress and Notes for Indonesia
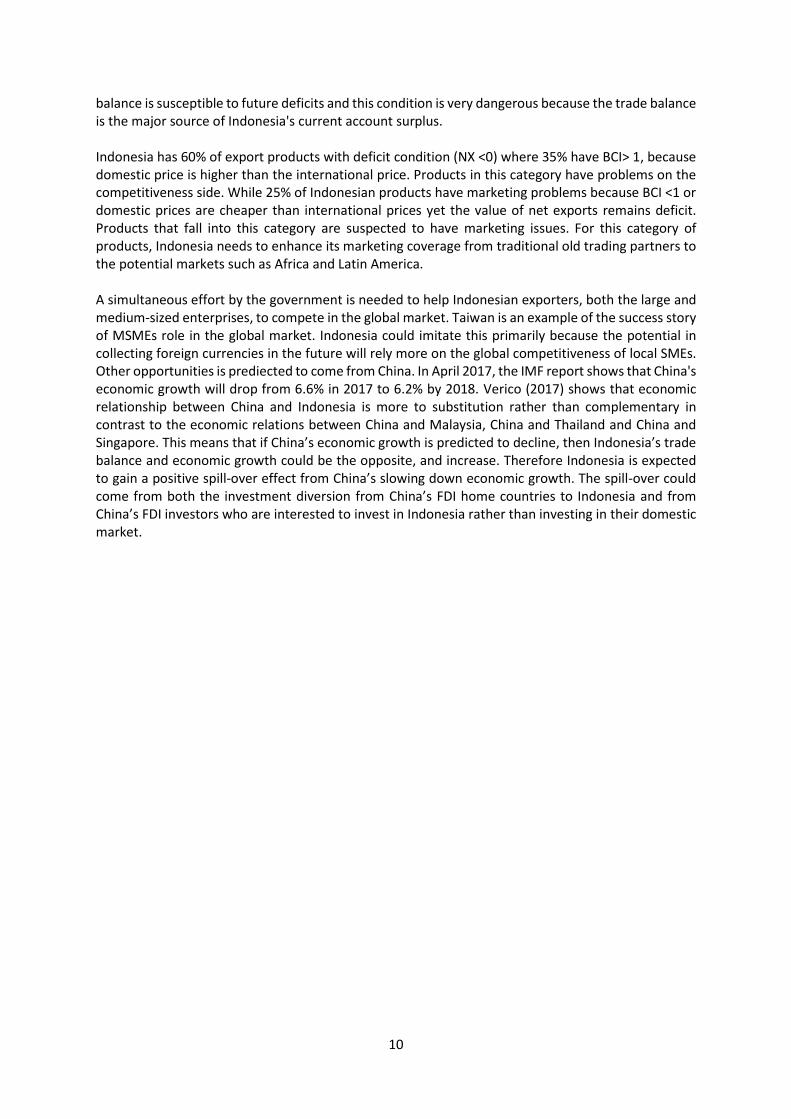
Diagram 4 shows that the international economic cooperation consists of various level of agreements,
where each of them has its own challenges and strategies.
Diagram 4. Indonesia’s Economic Cooperation Level (Author’s Studies)
Currently, globalization faces a big challenge both globally after USA prefers to use bilateral economic
negotiations6 and UK’s decision to exit from the EU (Brexit). These indicate the phenomenon in which
economic globalization must swing into an opposite direction from the so-called ‘mega regionalism’
of the Trans Pacific Partnership (TPP) which was touted to be a landmark of 21st century of
globalization and must lose its most influential member state: the USA, after the new elected
President Donald Trump came to power.
Globalization will practically become more bilateral7 as the most influential country in globalization,
the USA, prefers to use a bilateral approach rather than regional of NAFTA or mega regional of TPP.
Indonesia needs to adjust its economic relation strategies given this changing global situation.
Indonesia needs to be more active in bilateral trade while keeping both regional and regional-plus
negotiations on tracks.
6 https://www.brookings.edu/blog/future-development/2017/02/08/what-will-trumps-embrace-of-bilateralism-mean-for-americas-trade-partners/ 7 Interesting to see Vietnam's economic cooperation strategy in which when the United States enthusiastically develop TPP, Vietnam joined TPP and when the United States prefers bilateral, on May 31, 2017, Vietnamese Prime Minister Nguyen Xuan Phuc immediately held a bilateral meeting discussing trade with the President of the United States Donald Trump. https://www.nytimes.com/2017/05/31/world/asia/vietnam-nguyen-xuan-phuc-trump.html?_r=0
12
Diagram 4 above presents Indonesia's best strategy in regards to bilateral negotiations by taking into
account the income level of its partnering country. Using the Cost Benefit Analysis (CBA) method of
Regulatory Impact Assessment (RIA), I found that if Indonesia establishes bilateral economic
agreements with countries whose income per capita is higher than Indonesia, then the main target
would be to obtain long-term investments (FDI) from these countries. On the opposite, if its bilateral
partner countries have a lower income per capita than Indonesia, then Indonesia should seek benefit
from bilateral trade relations.
For Indonesia, another vital form of economic cooperation that should not be weakened is its regional-plus cooperation. Verico (2017) found that regional-plus cooperations such as ASEAN-Plus are the most effective cooperation for increasing both foreign trade and investment in Indonesia. There are two reasons behind this. First, because the regional economic cooperation has entered the stage of economic community. This cooperation is known as the ASEAN Economic Community (AEC) with the main objective to increase intra regional investment and value-added network. At this stage, ASEAN economic cooperation is expected to complete trade and investment cooperation. This is a big opportunity for Indonesia as the largest intra-investment recipient member state to attract intra-investment and join production network of ASEAN. Regional-plus cooperation is the most appropriate framework for ASEAN, given ASEAN’s soft and open regionalism principles. The stronger the regional-plus cooperation network, the greater the benefit for the member states, especially for members with large size economic measurements, both in terms of GDP and population, such as Indonesia. With this concept, Indonesia as the chair of mega regional cooperation of the Regional Comprehensive Economic Partnership (RCEP: ASEAN + China, Japan, South Korea, India, Australia and New Zealand) should play a more intensive role, therefore the RCEP as one of the largest mega economic cooperation in the world, could enhance mutual benefits for all the member states, including Indonesia. 3.2. Indonesia’s International Trade Strategy Towards 2030
One of the most important variables to keep Indonesia's income per capita achieve its target (in USD) by 2030 is the stability of its exchange rate. International trade is the key factor for exchange rate stability, at least, because of two reasons. One, the position of undervaluation of the exchange rate is influenced by the current account deficit. A study by Kurniawati and Verico (2017) found that for Indonesia, the current account has long-term relationship (Johansen Procedure) with the real exchange rate of Rupiah and affects it according to the Granger Causality. This means that to maintain long-term exchange rate stability, Indonesia needs to improve its trade competitiveness. Two, the competitiveness in international trade has an effect on the expectation of the capital flows in capital account. A study by Prabowosunu and Verico (2017) proved that the real sector performance (GDP) of the manufacturing sector affects the movement of equity derivative investments from the capital account rather than the opposite. This means that if the competitiveness of the real manufacturing sector increases and generates foreign exchange, then Indonesia's trade balance will increase. An increase in the trade surplus will increase the current account surplus. The current account surplus will stimulate the positive expectation on the capital account therefore it eventually stabilizes the Rupiah’s exchange rate. The stability of the Rupiah against the USD is very important in giving certainty for the business plans and in general for real sector performance. Both export and domestic-oriented firms need a stable exchange rate because not all machinery, production inputs and raw materials are domestically produced by Indonesia. Various inputs even for domestic market-oriented firms are imported from abroad and very sensitive to the Rupiah depreciation, as import can become very expensive while in contrast the revenue is in Rupiah because of its domestic market orientation. Therefore, at the end of the day Indonesia’s competitiveness in
13
global market does not only affect the ability to generate foreign exchange but keeps the stabilization of the domestic exchange rate. Both factors are important in aiming for the target of 2030’s per capita income in USD. In Southeast Asia, trade cooperation benefits can come from various sources. For Singapore and
Malaysia, the bilateral economic agreement was the most beneficial strategy, while Thailand obtained
more benefit from regional-plus cooperation, the Philippines gained more from AFTA and Indonesia’s
benefit does not come from trade agrement but domestic productivity (Verico, 2017). Worker
productivity is important for Indonesia to accelerate its trade benefit because of two reasons: One, in
generating public policy that fully supports the economy, Indonesia has to have both a good
governance, fiscal sustainability with managed fiscal deficit and clean government. Second, human
productivity with global competencies. Currently, the government’s policy has become better as
shown in Indonesia’s improved global rank in 2016-2017 compared to the global turmoil of 2013-2015.
Indonesia has improved its ease of doing business indicator from rank 109 (2015) to 91 (2017) and
recently earned investment grade from S & P with stable classification from Fitch. From 2016-2017, in
terms of productivity of human resources, Indonesia has achieved a slightly better rank in the Global
Competitiveness Index from rank 48 to 41 yet lowered rank in Human Development Index from 110
to 113.
In terms of human productivity in global trade competitiveness, there are at least two fundamental issues which must be done in order to achieve the target of 2030. One, Indonesia needs to to be very competitive in regional manufacturing products of electronic, machinery, transportation other than rail and chemical industry. Second, Indonesia must optimize the utilization of its MSMEs to boost its export-oriented markets8. The combination of regional value chain and support for MSMEs to export requires fundamental improvements of the quality of human resources, as joining the network and exceling in overseas markets are impossible without high competitiveness and productivity of human resources. The absorption and improvement of knowledge and expertise needs optimal utilizaton of the information and communication technology. This knowledge-based economy is the major platform for the future of Indonesia’s manufacturing trade competitiveness. The world has entered an era that is not limited to flows of goods, long-run investment, and derivative capital and people; but also flows of knowledge and ideas. Global manufacturing cooperation shifted from large firm-based with big organizational structures to small yet global start-up companies with more efficient and effective organizational structures. The decrease in communication, transportation and logistics cost enable countries to compete in a more dynamic situation quick responses and adjustment are required. They are the key success factors for the future successful development of Indonesia's global industry and trade competitiveness. In 2030, Indonesia is expected to be closer to the category of high-income industrial countries (developed HCI) and it will need quick yet appropriate adjustments in response to changes in its global competitivenness.
8A study by Revindo (2017) on MSMEs that are able to export: owners have worked or lived abroad, have received at least one central government support such as promotion, business management, finance or production, technical assistance support from non-government associations and state-owned enterprises and universities, face little export constraints (logistics, export procedures, business competition), provincial-level business coverage and produce national absolute advantage products.

14
IV. Conclusion: The Asia Miracle and Indonesia’s Hopes
Japan and Korea are the best examples of the so called ‘Asian Miracle’ because both countries can achieve high-level income through industrialization and become developed high-income countries wihtout being trapped in the Middle-Income Level. By incorporating the concept of Rostow’s classification (Traditional, Pre-Condition for Take Off, Take Off, Maturity & High Mass Consumption) and the concept of state income classification (LMIC, Upper Middle Income Country / LMIC, UMIC, High Income Country / HIC) based on World Bank standards9, it can be observed that through industrialization, Japan only took 17 years (1961-1978) to rise from traditional or Developing LIC to Developed HIC and escape from the Middle-Income Trap (MIT). This is shown in Graph 4 below.
Graph 4. Economic Growth, Inflation Rate and GNI per Capita per Year (USD) Japan
Source: calculations based on WDI-WB Dataset, 2017
Japan’s achievement in industrialization post-World War II shows very satisfactory results during the period of 1960-1969 and 1981-1991, where the average rate of economic growth was far above its inflation rates. In 1970 to 1980, Japan’s average inflation rate is above its economic growth and in 1991 onwards Japan is faced with deflation.10 Japan's rapid economic growth rate during 1960-1970
9 USD/capita/year: 1987-1989: USD 6.000; 1990: USD 7.620; 1991: USD 7.910;1992: USD 8.355; 1993: USD 8.625; 1994: USD 8.955; 1995: USD 9.385; 1996: USD 9.645; 1997: USD 9.655; 1998: USD 9.360; 1999-2000: USD 9.265;2001: USD 9.205;2002: USD 9.075;2003: USD 9.385; 2004: USD 10.065;2005: USD 10.725; 2006: USD 11.115; 2007: USD 11.455; 2008: USD 11.905; 2009: USD 12.195; 2010: USD 12.275; 2011: USD 12.475;2012: USD 12.615; 2013-2015: USD 12.475 10Theoretically, there is an endogenous relationship between economic growth and inflation rate. Real economic growth (changes in output or Q) generates inflation (expectations of price increases) while normal inflation rates provide positive expectations in the business world. When the economy grows but in the deflationary position it can be said that growth is not at the optimum point and will decrease in the next period (t + 1).
15
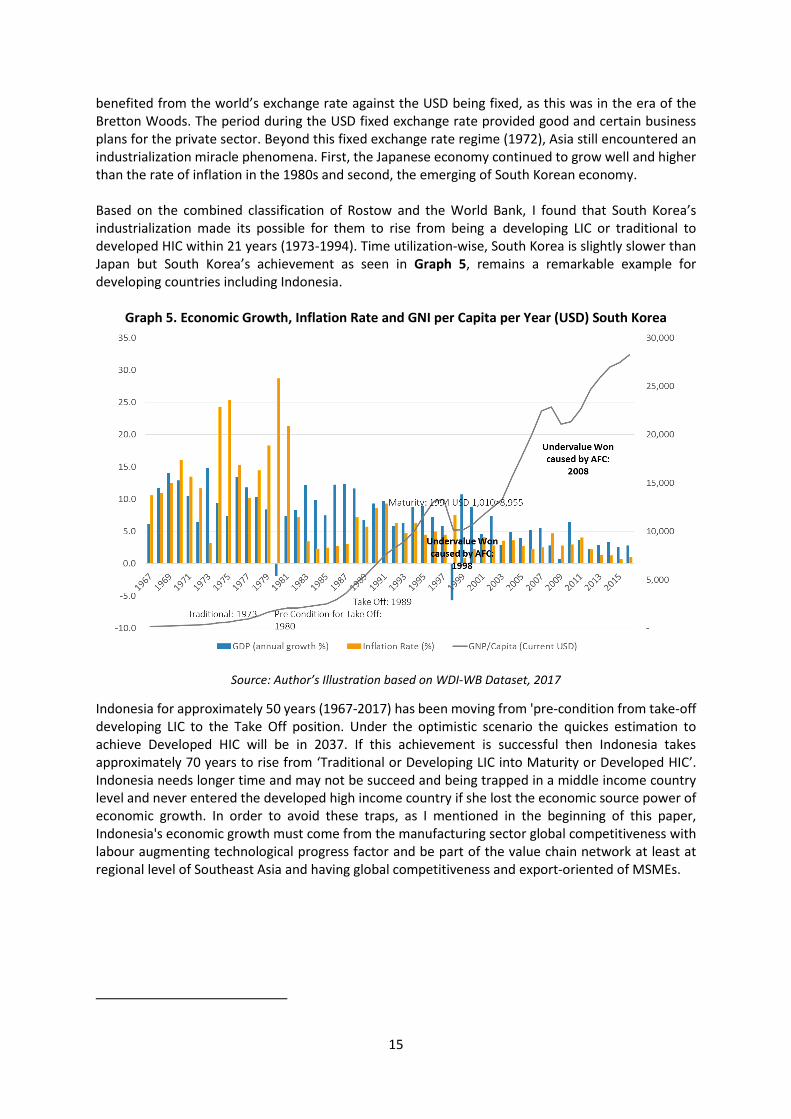
benefited from the world’s exchange rate against the USD being fixed, as this was in the era of the Bretton Woods. The period during the USD fixed exchange rate provided good and certain business plans for the private sector. Beyond this fixed exchange rate regime (1972), Asia still encountered an industrialization miracle phenomena. First, the Japanese economy continued to grow well and higher than the rate of inflation in the 1980s and second, the emerging of South Korean economy. Based on the combined classification of Rostow and the World Bank, I found that South Korea’s industrialization made its possible for them to rise from being a developing LIC or traditional to developed HIC within 21 years (1973-1994). Time utilization-wise, South Korea is slightly slower than Japan but South Korea’s achievement as seen in Graph 5, remains a remarkable example for developing countries including Indonesia.
Graph 5. Economic Growth, Inflation Rate and GNI per Capita per Year (USD) South Korea
Source: Author’s Illustration based on WDI-WB Dataset, 2017
Indonesia for approximately 50 years (1967-2017) has been moving from 'pre-condition from take-off developing LIC to the Take Off position. Under the optimistic scenario the quickes estimation to achieve Developed HIC will be in 2037. If this achievement is successful then Indonesia takes approximately 70 years to rise from ‘Traditional or Developing LIC into Maturity or Developed HIC’. Indonesia needs longer time and may not be succeed and being trapped in a middle income country level and never entered the developed high income country if she lost the economic source power of economic growth. In order to avoid these traps, as I mentioned in the beginning of this paper, Indonesia's economic growth must come from the manufacturing sector global competitiveness with labour augmenting technological progress factor and be part of the value chain network at least at regional level of Southeast Asia and having global competitiveness and export-oriented of MSMEs.
16
References
Amaglobeli, D., and Shi, W. (2016), How to Assess Fiscal Implications of Demographic Shifts: A Granular
Approach, IMF Intenational Monetay Fund (2017), Gaining Momentum?, World Economic Outlook – IMF Kurniawati, H. dan Verico, K. (2017), Hubungan Ekonomi Fundamental antara Nilai Tukar Riil dan Neraca
Transaksi Berjalan: Studi Kasus ASEAN4 Periode 1990 -2015, Unpublished Undergraduate Thesis Prabowosunu, A., and Verico, K. (2017), Indonesia’s Short-Term Capital Inflows in 2005-2015 Period: A
Blessing or A Curse, Unpublished Undergraduate Thesis Revindo, M. D. (2017). Internationalisation of Indonesian SMEs. Lincoln University, Christchurch, New
Zealand, Unpublished Doctoral Thesis Todaro, M.P., and Smith, S.C. (2010), Economic Development, 11th Edition, Addison – Wesley UNDP (2017), Human Development Reports, UNDP Verico, K., (2011), Achieving Indonesia’s Golden Moment of Economic Growth, the Jakarta Post, August 7th Verico, K., (2017). The Future of ASEAN Economic Integration. Palgrave Macmillan: London, pp. 1-269
(Monograph) Verico, K., (2017). Are the Benefits from ASEAN Integration Sustainable? Asian Economic Papers, MIT Press
Journals, Under Review World Bank (2017), Publication and WDI Dataset - WB World Economi Forum (2017), Global Competitiveness Report – WEF