munich personal repec archive - core · munich personal repec archive ... on micro factors such as...
TRANSCRIPT

MPRAMunich Personal RePEc Archive
The Immigrants Odds of Slipping intoPoverty during Business Cycles: DoubleJeopardy?
Jongsung Kim and Edinaldo Tebaldi
Bryant University
May 2009
Online at http://mpra.ub.uni-muenchen.de/15276/MPRA Paper No. 15276, posted 21. May 2009 13:21 UTC

THE IMMIGRANTS ODDS OF SLIPPING INTO
POVERTY DURING BUSINESS CYCLES: DOUBLE
JEOPARDY?*
Jongsung Kim
Department of Economics Bryant University
1150 Douglas Pike, Smithfield, RI 02917, USA [email protected]
and
Edinaldo Tebaldi
Department of Economics Bryant University
1150 Douglas Pike, Smithfield, RI 02917, USA [email protected]
Abstract
This paper makes an empirical contribution in unraveling the argument that immigration is either the sole or even the most important factor behind the U.S. poverty. While this argument is understandable, the blame is misplaced. Using data from the Current Population Survey, we show that between 1994 and 2008 the national poverty rate of immigrants fell three times faster than that of natives (5.4 compared to 1.8 percentage points). The poverty rate of recent immigrants (those in the United States for less than 10 years) fell even faster at almost six times faster than that of natives (10.7 compared to 1.8 percentage points). The empirical analysis of this paper shows that the odds of experiencing poverty for both natives and immigrants depend on micro factors such as individual characteristics and macro factors such as business cycle in the U.S. economy. Keywords: Poverty, Immigrants, and Business Cycle JEL code: J61 (Immigrant Workers), I30 (Welfare and Poverty) * We would like to thank the participants of the 2009 Eastern Economic Association Conference for the helpful comments on a preliminary version of this paper.
1
I. Introduction
The current U.S. poverty rate is much lower than the 16.9 percent observed in 1963 when
President Lyndon Johnson launched the War on Poverty with the Economic Opportunity Act
(EOA) of 1964, but the poverty rate has hovered around 10 percent since 1968. While a number
of explanations have been offered to explain why poverty rates have remained at this level,
research reports cite immigration as one of the primary causes of poverty persistency in the
United States.
Camarota (1999), at the Center for Immigration Studies, finds that the poverty rate for
persons living in immigrant households grew from 15.5 percent in 1979 to 18.8 percent in 1989,
and to 21.8 percent in 1997. Over the same period the poverty rate for persons in native
households stayed almost constant at roughly 12 percent. As a result, the gap between immigrant
and native poverty has almost tripled in 20 years and widened in every region of the country and
in almost all major metropolitan areas during the 1990s. Rector (2006) also paints a negative
portrait against immigration, arguing that “the U.S. has imported poverty through immigration
policy that permitted and encouraged the entry and residence of millions of low-skill immigrants
into the nation” (p. l).1 Some media coverage has also blamed immigrants as the main factor
contributing for the persistenc of U.S. poverty. For example, Robert J. Samuelson (2007), a
columnist at the Washington Post, wrote that “[t]he stubborn persistence of poverty, at least as
measured by the government, is increasingly a problem associated with immigration. As more
poor Hispanics enter the country, poverty goes up” (p. A21).
1 Due to ever-stronger persistency in intergenerational mobility, parents’ poverty may perpetuate into their children’s generation. Poverty is also closely related with crime, and has such public health implications as overweight, obesity, alcoholism and drug use. For example, family dissolution is closely related to poverty. When family dissolution occurs, so does the decline of home cooking, an underlying cause of obesity.
2
However, poverty is a multifaceted phenomenon that cannot be reduced to a single aspect
(such as immigration) as many factors determine the economic status of both immigrants and
natives. For instance, individual characteristics including experience in the U.S. labor market,
education, age, and race are certainly associated with a person’s poverty status. Also important
are institutional factors such as functioning labor markets, government policies, and economic
opportunities arising with business cycles. Finally, assimilation might also influence the
immigrants’ odds of slipping into poverty.
Therefore, an educated discussion on the relationship between immigration and poverty
requires considering this issue broadly and also assessing questions such as: is poverty
prevalence among diverse immigrant groups the same? what are the factors affecting immigrants’
poverty incidence? during the last business cycle, did the rising tide lift all the boats, including
immigrants? How were immigrants affected by the U.S. recession in the early 2000s? How did
immigrants’ assimilation influence their economic status during economic booms and recessions?
This paper contributes to the literature on the economic status of immigrants by i)
focusing on the neglected issue of differential poverty prevalence among diverse immigrant
groups, ii) drawing attention to the relationship between the assimilation of immigrants and their
odds of experiencing poverty, and iii) testing for the impacts of the occurrence of economic
booms and recessions on poverty incidence among immigrants and natives.
The rest of the paper is organized as follows: Section 2 discusses the patterns of U.S.
poverty. Section 3 briefly presents the empirical strategy used to analyze the factors determining
poverty. Section 4 reports the empirical results and discusses the findings, and Section 5
summarizes the paper’s findings.

3
II. Patterns of Poverty in the United States
This study uses data from the Current Population Survey (CPS) from 1994 to 2008 taken
from the Minnesota Population Center data archive.2 An individual poverty status is defined
based on the official poverty threshold used by the U.S. Census Bureau.3 While the poverty
definition used by the government has significant limitations, it is a consistent and frequently
updated indicator that can be used to measure and compare poverty over time in the United
States. In this paper, we use the term “immigrants” as synonymous with foreign-born individuals
(not born of U.S. parents).4
Table 1 shows that overall U.S. poverty rate has dropped from 12.6 percent in 1994 to
10.6 percent in 2008. In contrast to a small decline of white population poverty rate from 8.7
percent to 7.3 percent, the poverty rate of African American, Mexican and Other Hispanic
population declined by 7.6 percent (from 27.1 to 19.5 percent), 7.6 percent (from 26.3 to 18.7
percent) and 7.7 percent (from 23.3 to 15.6 percent), respectively.
Table 2 and Figures 2-5 show the poverty rates of two mutually exclusive groups: natives
(who were born in the United States) and immigrants (who were born outside the United States).
Table 2 shows that the poverty rate for natives has dropped 1.8 percentage points from 11.5
percent in 1994 to 9.7 percent in 2008. In contrast, during the same period the poverty rate for
2 Available at http://cps.ipums.org/cps 3 See the U.S. Census Bureau website (http://www.census.gov/hhes/www/poverty/povdef.html ) for a
detailed discussion regarding the “official” poverty line. 4 The U.S. Citizenship and Immigration Service (USCIS), formerly known as the U.S. Immigration and Naturalization Service, defines an immigrant as an alien admitted to the United States as a lawful permanent resident. The Immigration and Nationality Act (INA), however, broadly defines an immigrant as any alien in the United States, except one legally admitted under specific nonimmigrant categories. Therefore, an illegal alien who entered the United States without inspection, for example, would be defined as an immigrant under the INA but is not a permanent resident alien. Since the CPS does not ask respondents if they are illegal aliens, the data we use in this paper include both legal and illegal immigrants. Therefore, we use the term “immigrant” as synonymous with foreign-born individuals (not born of U.S. parents).

4
immigrants has dropped 5.4 percentage points from 20.4 percent to 15 percent. In 1994, the
poverty rate of immigrants was almost twice as high as that of the natives (20.4 percent vs. 11.5
percent). In 2007, the poverty rate gap between natives and immigrants was 40 percent (10
percent vs. 14 percent). While the poverty rate of Whites further declined slightly in 2008, that of
immigrants increased by 1 percentage points in 2008, leading the gap to be approximately 50
percent (9.7 percent vs. 15 percent). These data show that from 1994 to 2008 the poverty rates
fell faster for immigrants than for natives. This finding is consistent with that of Chapman and
Bernstein (2003) who also found a similar pattern from 1989 to 1999. Chapman and Bernstein
(2003) show that “over the 1994-2000 periods, immigrants’ rising income offset the negative
impact of their rising shares” (p. 10).
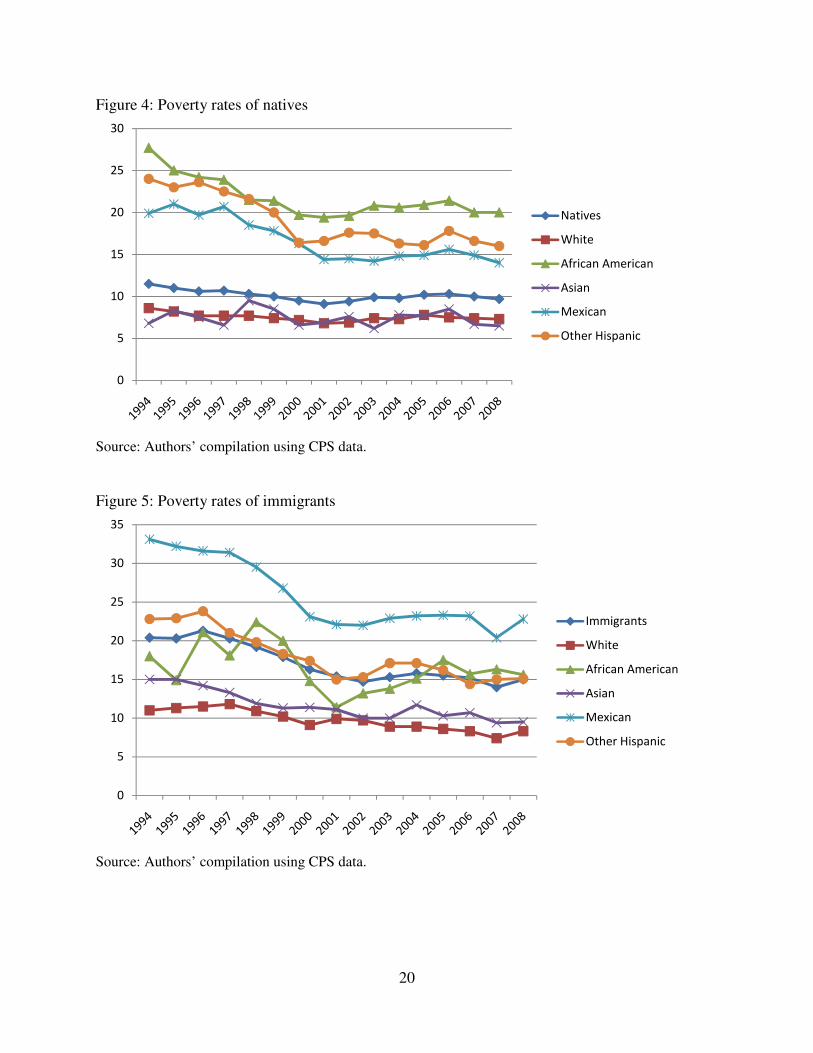
A closer examination of the poverty rate by five major racial/ethnic groups (White,
African American, Asian, Mexican, and other Hispanics) within natives and immigrants show a
consistent pattern of decrease from 1994 to 2008. For both natives and immigrants, the poverty
rate is lower for White and Asian and higher for African American, Mexican, and other
Hispanics. The observed decline in the poverty rate for natives between 1994 and 2008 (1.8
percentage points) is not much different from the 2 percentage points decline (from 12.6 percent
to 10.6 percent) for all people. In line with Danziger and Gottschalk (2004), this suggests that the
poverty rate of the native-born group in any year is not much affected by immigration and the
increased immigration over the period from 1994 to 2008 had little effect on the overall poverty
rate in the United States.
The economic progress from 1994 to 2008 for immigrants relative to the natives is also
mirrored in the ratio of family income (household income) of two groups. Table 4 shows that
from 1994 to 2008, the ratio of median income of immigrants to that of natives had risen from

5
81.9 percent ($30,420/$37,140) to 83 percent ($53,145/$64,000). The improvement for recent
immigrants (those in the United States for less than 10 years) was higher. While the recently
arrived immigrants earned 70.2 percent ($26,145/$37,240) of the median income of the natives
in 1994, the ratio had risen to 75 percent ($48,000/$64,000) in 2008.
Table 3 and Table 4 show that from 1994 to 2008, the economic status of both natives
and immigrants has improved. However, the change in the proportion of individuals in the “150
percent and above the low-income level” category for this period is 3 percentage points (79.5 vs.
82.5) for natives compared to 6.7 percentage points (65.2 vs. 71.9) for all immigrants, and 11.9
percentage points (44.6 vs. 56.5) for Mexican immigrants.
Researchers and opinion makers who blame the immigrants as the main culprit of the
persistent U.S. poverty may use the same information to support their cases. They may argue that
although the economic status of immigrants has improved over the business cycles, their poverty
rates are still higher than those of natives. As much as this argument holds true, the pattern of the
poverty confirms that the rising tide shifted all the boats, and some boats were shifted higher
than others. Moreover, excluding immigrants would have little effect on the overall poverty rate
in the United States.
Table 5 lists summary statistics of the sample. Some of the important findings are as
follows. The share of population with less than high school education is twice higher for
immigrants than for natives (36.3 percent vs. 18.1 percent). Immigrants are more concentrated in
metropolitan areas than natives (92.2 percent vs. 74.4 percent). Immigrants earn less than natives,
and are less likely to be homeowners than natives (53.5 percent vs. 74.9 percent). Mexican and
other Hispanic immigrants comprise more than half of the immigrant population. Immigrants are
6
geographically concentrated in the Pacific Division. This geographic concentration is due to the
fact that 23.6 percent of immigrants reside in the state of California.
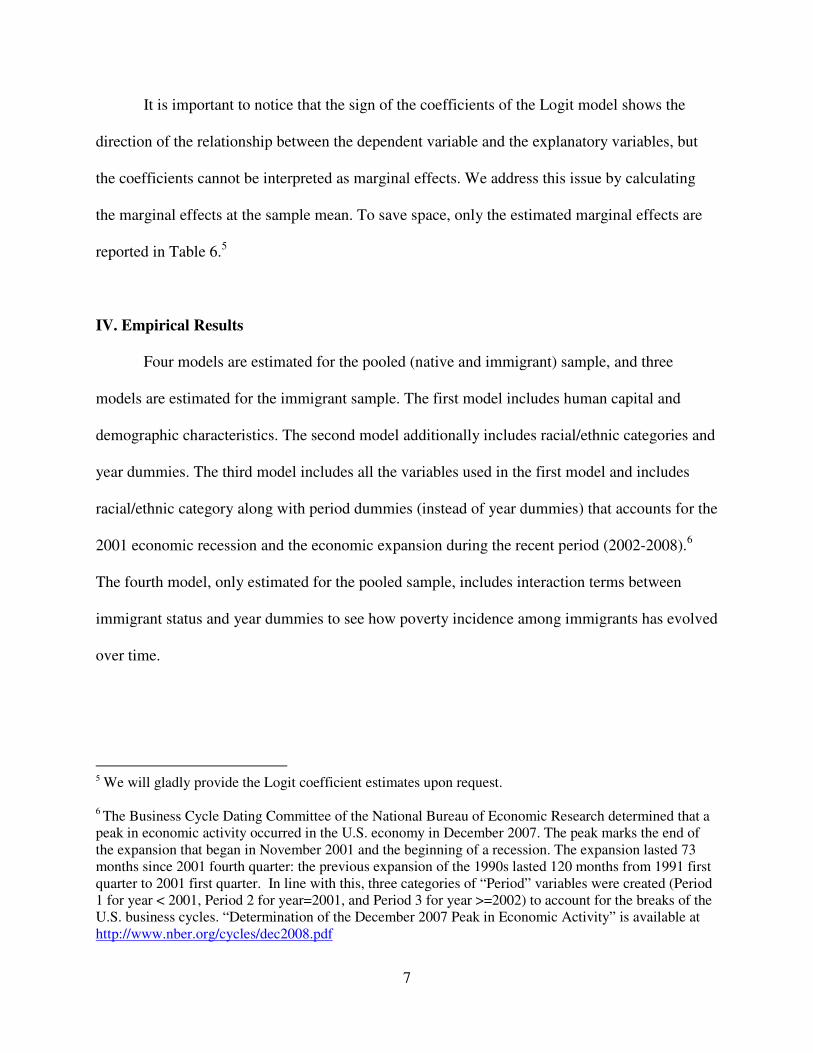
III. Methodology and Empirical Model
We perform regression analysis to investigate the impacts of individual characteristics
and the business cycle on the odds of both immigrants and natives in slipping into poverty. The
variable of interest is the poverty status of individuals living in the United States from 1994 to
2008. We also account for the dynamics of poverty among immigrants and natives during the
economic boom (1994-2000), the bust and initial recovery period (2000-2003), and recent period
(2003-2008).
Our empirical strategy consists of estimating a Logit model with controls for personal
characteristics including human capital and the racial/ethnic differences to test for the impacts of
assimilation and the occurrence of economic booms and recessions on poverty incidence among
immigrants and natives. The logistic regression model is specified as follows:
( )1
(1)1 exp
i
i i
Pxα β ε
= + − + +
where P is a dummy variable coded one if the individual i is poor and zero otherwise, xi pertains
to individual and household characteristics such as age, gender, educational attainment, location
of residence, homownership, and other immigrant-specific characteristics, and ε is the error term.
Year dummies are also included in the model. The regression analysis is conducted using micro
data from the Current Population Survey (CPS) from 1994 to 2008. Summary statistics of the
variables included in the regression are listed in Table 5.
7
It is important to notice that the sign of the coefficients of the Logit model shows the
direction of the relationship between the dependent variable and the explanatory variables, but
the coefficients cannot be interpreted as marginal effects. We address this issue by calculating
the marginal effects at the sample mean. To save space, only the estimated marginal effects are
reported in Table 6.5
IV. Empirical Results
Four models are estimated for the pooled (native and immigrant) sample, and three
models are estimated for the immigrant sample. The first model includes human capital and
demographic characteristics. The second model additionally includes racial/ethnic categories and
year dummies. The third model includes all the variables used in the first model and includes
racial/ethnic category along with period dummies (instead of year dummies) that accounts for the
2001 economic recession and the economic expansion during the recent period (2002-2008).6
The fourth model, only estimated for the pooled sample, includes interaction terms between
immigrant status and year dummies to see how poverty incidence among immigrants has evolved
over time.
5 We will gladly provide the Logit coefficient estimates upon request. 6 The Business Cycle Dating Committee of the National Bureau of Economic Research determined that a peak in economic activity occurred in the U.S. economy in December 2007. The peak marks the end of the expansion that began in November 2001 and the beginning of a recession. The expansion lasted 73 months since 2001 fourth quarter: the previous expansion of the 1990s lasted 120 months from 1991 first quarter to 2001 first quarter. In line with this, three categories of “Period” variables were created (Period 1 for year < 2001, Period 2 for year=2001, and Period 3 for year >=2002) to account for the breaks of the U.S. business cycles. “Determination of the December 2007 Peak in Economic Activity” is available at http://www.nber.org/cycles/dec2008.pdf
8
4.1 Standard Controls
The results on standard controls (gender, race, education, age, and place of residence)
conform to previous findings in the literature. We find that all coefficients on “Female” are
statistically significant at the 1 percent level. This implies that women are more likely to
experience poverty. The results also imply that that married individuals are about 7 percent less
likely to encounter poverty. A recent study (Hoynes et al., 2006) finds persistent differences in
poverty across groups with different marital status – “with the highest poverty rates for person in
single parent families and the lowest poverty rates for persons in married couple families” (p. 60).
We analyze the relationship between educational attainment and poverty incidence by
considering five educational categories and having “less than high school” as the baseline
category. All of the estimated coefficients of education category variables are negative and
statistically significant at 1 percent level. Table 6 shows that the marginal effects of higher levels
of education are smaller (and negative) than those for lower levels of education, indicating that
individuals with higher education are less likely to fall into poverty. This finding is consistent
with a large literature including studies by Hoover et al. (2008), Gittell and Tebaldi (2007) and
Partridge and Rickman (2005).
The negative parameter estimates on “Metropolitan” and “Homeowner” also conform to
expectation, implying that metropolitan residents and homeowners are less likely to experience
poverty. The parameter estimates of “South” variables are significantly positive in all cases,
suggesting that the legacy of lower economic status of the South still prevails and the individuals
in the South are more likely to experience the poverty in their lives.
The link between racial/ethnic status and poverty are investigated by considering five
racial/ethnic categories. The marginal effects reported in Table 6 show that non-whites are more
9
likely to experience poverty in comparison with the base category Whites. While this general
pattern between whites and nonwhite is true for both natives (columns 1 to 4) and immigrants
(columns 5 to 7), there is an interesting difference in the pattern within nonwhites. Columns 2
and 3 (pooled sample) of Table 6 suggest that “African American” and “Mexican” are about 5
percent more likely to experience poverty compared to Whites, while “Asian” and “other
Hispanics” are about 2 percent more likely to experience poverty than Whites. Columns 6 and 7
(immigrant sample) of Table 6 show that “Mexicans” are about 6 percent more likely to
experience poverty. Empirical studies using aggregate data at either state or metropolitan area
levels have also demonstrated a link between ethnic/racial origin and poverty and that Hispanics
are more likely to experience poverty in the United States (Gittell and Tebaldi, 2007; Partridge
and Rickman, 2005). In contrast, Asian immigrants are just under 1 percent more likely to
experience poverty than white immigrants. These results show that the racial/ethnic poverty gap
holds for both the general population (pooled sample) and also for immigrants, suggesting that
individual from Mexican origin are the most vulnerable group to poverty incidence.
In order to see the impact of employment type on the poverty incidence, the regression
includes a variable controlling for self employment. The ever-increasing health care cost may
contribute to the higher probability of the self employed in slipping into poverty. Adequate
health insurance usually comes with employment, and affordable medical insurances for the self-
employed are hard to find. In addition, the self-employed are exposed to higher financial risk as
they are less able to shield themselves from economic fluctuations with a limited access to
financing. As a result, the more vulnerable financial position of the self-employed explains the
higher probability of the self-employed in falling into poverty. The estimated marginal effects

10
(and coefficients) on “Self Employed” in Table 6 are all positive and significant, supporting this
argument.
4.2 Immigration and Poverty
Are immigrants more likely to fall into poverty? Descriptive statistics (Tables 1-5) show
that the percentage of immigrants experiencing poverty is much larger than that of the native
population. However, descriptive statistics can be misleading in answering this question because
it fails to distinguish individual characteristics. Regression analysis addresses this issue by
controlling for individual characteristics. It also allows for examining the odds of hypothetical
similarly endowed natives and immigrants to fall into poverty. Models 1 through 3 of Table 6
show that in contrast to some belief that immigrants are prone to fall into poverty and are a major
culprit in the U.S. poverty; an immigrant is only 2.4 percent, at the most, more likely to fall into
poverty compared to a similarly endowed native. When more detailed controls are used, such as
racial/ethnic status, “Period” information and “years since migration,” the parameter estimate
declined by more than half to be just about 1 percent. This suggests that controlling for
individual characteristics, nativity (or immigrant) does not matter that much in terms of
determining the odds of falling into poverty. This finding is consistent with Raphael and
Smolensky (2008). They find that as immigrants stay longer in the United States, their poverty
rate declines quickly with wage growth and selective out-migration.
Although surprising, our estimates suggest that the sizable differential in poverty
incidence across the immigrant and native populations is mostly due to differences in individual
characteristics such as educational attainment, race or ethnic group, gender and place of
residence. This is good news, signaling that if immigrants were given the opportunity to acquire

11
human capital and be part of the mainstream society, then poverty incidence among immigrants
would decrease and become similar to that of the general population.
Chapman and Bernstein (2003) also report that poverty rates declined faster for
immigrants than for natives from 1989 to 1999. They further find that over the 1994-2000 period,
the rising income of immigrants sufficiently counterbalance the negative impact of their rising
shares. Although recent immigrants, especially Hispanic immigrants, are poorer than their
predecessors, their proportion of the U.S. population is still not large enough to affect the overall
poverty noticeably. And even without immigration, the U.S. poverty would not have declined
any faster than it did (Hoynes et al., 2006).
A more complete analysis of how some characteristics influence poverty among
immigrants is conducted by estimating a set of regressions considering only immigrants. The
results are reported in models 5, 6 and 7 in Table 6. Naturalization to become a U.S. citizen is
one important measure of assimilation. The empirical results show that naturalized U.S. citizens
are about 2 percent less likely to encounter poverty compared to immigrants who are non-U.S.
citizens. This finding supports the view that when immigrants fully integrate into society they do
improve their economic and social status.
In 2008 CPS, 16 percent of the U.S. population were foreign-born, and about 44 percent
of them had naturalized to become U.S. citizens. In 2008, the poverty rate for naturalized citizens,
whose country of origin varies, were 8.9 percent while the poverty rate of non-naturalized
immigrants were much higher at 19.9 percent. This is a telling example that shows the extent of
heterogeneity within foreign-born population. What is also noteworthy is that the poverty rate of
the naturalized citizens – 8.9 percent – is even lower than the 9.8 percent poverty rate for U.S.-
born citizen (natives). The non-naturalized immigrants represent small fractions of the total

12
population and of the poor – 9 percent and 16.9 percent, respectively. Therefore, it is unlikely
that immigrants’ economic status have significantly affected the overall U.S. poverty.
We also consider “years since migration” as another proxy for immigrants’ assimilation.
The negative parameter estimates on “years since migration” in columns 5 through 7 in Table 6
suggest that as immigrants stay longer in the United States, their odds of slipping into poverty
falls. This result is consistent with the findings in Chiswick’s (1978) seminal work that the
positive relationship between years since migration and earnings is a good indicator for
immigrants’ assimilation into the U.S. labor market. The point estimates suggest that an
immigrant who lived in the United States for 10 years is about 1.5 percent less likely to
experience poverty compared to a similarly endowed immigrant who just arrived.7
The parameter estimates on “Age” and “Age squared” show mixed results for pooled
sample and immigrant sample. Figure 6 reports the results for the pooled sample and shows that
there is an inverted U-curve relationship between age and the likelihood of falling into poverty.
This implies that the likelihood of falling into poverty increases with age and reaches a peak
when a person is about 50 years old, then it decreases with age. However, the results from the
immigrant sample are quite different. Figure 7 shows that for the immigrant sample, the
likelihood of falling into poverty increases with age and skyrockets after 60 years. Although our
data provide no insights on how to explain these differences, one can speculate that this finding
indicates that immigrants are unable to create the conditions for a smooth retirement or may not
qualify for retirement benefits provided by the federal government, which ultimately leads the
elderly immigrant to fall into poverty.
7 Although this result is encouraging as it shows a pattern of declining poverty incidence as immigrants stay longer in the United States, this finding is unable to explain the persistency of poverty or the lack thereof. One of the drawbacks in using CPS data is that we were unable to see the persistency of poverty. The CPS does not provide any information about the persistency of poverty, since it only asks about respondents’ income in a given year and does not include information on income history.

13
Are the odds of immigrants and natives to fall into poverty during economic booms and
recessions the same? Columns 2, 4 and 6 of Table 6 include “Year” dummies (baseline year is
1994) for pooled and immigrant samples, respectively. With only a few exceptions, almost all of
the parameter estimates on these dummies are negative at the 1 percent level. This finding shows
that individuals’ poverty incidence has decreased over the last two decades. In addition, column
4 shows that the interaction terms between immigrant and year dummies are negative and
statistically significant from years 1999 to 2008. This indicates that since 1999 – and comparing
to the base-year (1994) – the likelihood of immigrants falling into poverty decreased faster than
that of the natives. Gittell and Tebaldi (2007) also find that poverty has decreased during the last
business cycle. It is worthwhile noticing that the economic downturn in 2001-2002 not only
affected poverty incidence among immigrants and natives (see the 2001-2002 marginal effects),
but also reduced the size of the marginal effects in the interactions terms for the years 2002 and
2003.8 This suggests that the economic downturn in the early 2000s slowed down the “catching-
up” process in terms of poverty rates between natives and immigrants. The estimates indicate
that the economic slowdown in the end of 2007/beginning of 2008 has again affected this
catching-up process. These results are consistent with Hines et al. (2001). Overall, our results
suggest that both natives and immigrants have benefited from economic expansions as shown by
a significant decline in the likelihood of experiencing poverty during the last business cycles.
Moreover, the results also imply that economic expansions create the conditions for an
accelerated reduction in poverty rates among immigrants.
8 Notice that the CPS data is collected in March, so the effects of the 2001-2002 economic slowdown are accounted for in the 2002-2003 data.
14
V. Final Remarks
The poverty rate among immigrants in the United States grew from 15.5 percent in 1979
to 20.4 percent in 1994 and then declined to 15 percent in 2008. The higher incidence of poverty
among immigrants has generated public concerns about the social and economic viability of
immigrants. While there are still reasons for a pessimistic view of immigrants, the empirical
findings of this paper show that the odds of experiencing poverty for both natives and
immigrants depend on micro factors such as individual characteristics and macro factors such as
business cycle in the U.S. economy. This paper makes an empirical contribution in unraveling
the argument that immigration is the sole or even the most important factor behind the U.S.
poverty landscape. While the argument is understandable, the blame is misplaced.
President Lyndon Johnson, emphasizing the importance of job creation as a weapon
against poverty, declared when he signed the Opportunity Act on August 20, 1964 that “Our
American answer to poverty is not to make the poor more secure in their poverty but to reach
down and to help them lift themselves out of the ruts of poverty and move with the large
majority along the high road of hope and prosperity”9. The idea that improving economy benefits
all members in that economy is most famously and laconically summarized in the President John
F. Kennedy’s remark “A rising tide lifts all boats”10. The finding of this paper is consistent with
this aphorism. The benefit of a strong economy in the form of poverty rate fall in the United
States from 1994 to 2008 applies to all racial/ethnic groups regardless of their U.S. nativity status.
9 Weapons against poverty: three prong attack. Lyndon Baines Johnson Library and Museum, available at
http://www.lbjlib.utexas.edu/johnson/lbjforkids/pov_weapons.shtm. 10 John T. Woolley and Gerhard Peters. The American Presidency Project [online]. Santa Barbara, CA: University of California (hosted), Gerhard Peters (database). Available from World Wide Web: http://www.presidency.ucsb.edu/ws/?pid=9455.

15
What is noteworthy and encouraging is that during this period, the rising tide lifted immigrants’
boat higher than that of the natives.
Although most individuals in the United States cannot escape the negative impact of
current economic downturn, immigrants, especially recent ones, are more vulnerable to this
economic adversity. Immigrants tend to be in weaker position in the labor market, have
inadequate or no medical insurance, and may have only limited access to financial resources.
Considering all of these issues, the role of policy to effectively address poverty would be even
more important as the U.S. economy continues to falter.
One policy implication of this result follows that conventional macroeconomic fiscal and
monetary policies to stimulate the economy are as good as the narrowly focused economic and
social policies targeted for specific racial/ethnic groups. Indeed, this seemingly “too simple”
implication is a boon to policy makers, since the focus on the whole economy automatically
takes care of its subsets as well. Unfortunately, the U.S. economy has slid into a recession that
will have significant adverse economic and social effects. How the lifted boats in the past
decade will fall down among different racial/ethnic groups by their U.S. nativity status would be
a future research agenda.

16
VI Reference
Borjas, George J. 1999, “The Economic Analysis of Immigration,” in Handbook of Labor
Economics. Orley Ashenfelter and David Card, eds. Amsterdam: Elsevier Science, pp. 1698-757.
Briggs, Vernon M. Jr. 2003, “Immigration and Poverty Reduction: Policy Making on a Squirrel
Wheel,” Journal of Economic Issues, 37, 325-31. Camarota, Steven A. 2007, “Immigrants in the United States, 2007: A Profile of America’s
Foreign-Born Population,” Center for Immigration Studies. Camarota, Steven A. 1999, “Importing Poverty: Immigration's Impact on the Size and Growth of
the Poor Population in the United States,” Center for Immigration Studies Center Paper #15. Chapman, Jeff and Jared Bernstein. 2003, “Immigration and Poverty: How are They Linked?,”
Monthly Labor Review (April 2003), 10-15. Chiswick, Barry. 1978, “The Effect of Americanization on the Earnings of Foreign Born Men,”
Journal of Political Economy, 86(5): 897-921. Danzier, Sheldon and Peter Gottschalk. 2004, “Diverging Fortunes: Trends in Poverty and
Inequality,” The American People: Census 2002. Population Reference Bureau Bulletin. Gittell, Ross and Edinaldo Tebaldi. 2007, “Did a Strong Economy in the 1990s Affect Poverty in
U.S. Metro Areas? Exploring Changes in Poverty in Metropolitan Areas Over the Last U.S. Business Cycle, 1992 – 2003,” Economic Development Quarterly, 21(4), 354-68.
Hines, James. Jr., Hilary Hoynes and Alan B. Krueger. 2001, “Another Look at Whether a Rising
Tide Lifts All Boats,” NBER Working Paper 8412. Hoover, G. A., Enders, W. and Freeman, D. G. 2008, “Non-white Poverty and Macroeconomy:
The Impact of Growth,” American Economic Review, 98(2), 398-402. Hoynes, Hilary W., Marianne E. Page and Ann Huff Stevens. 2006, “Poverty in America: Trends
and Explanation,” Journal of Economic Perspectives, 20(1): 47-68. King, Miriam, Steven Ruggles, Trent Alexander, Donna Leicach, and Matthew Sobek. 2004,
Integrated Public Use Microdata Series, Current Population Survey: Version 2.0. [Machine-readable database]. Minneapolis, MN: Minnesota Population Center [producer and distributor].
Partridge, M. D. and Rickman, D. S. 2005, “Why Some US Nonmetropolitan Counties Moved
out of Persistent High-Poverty Status in the 1990s,” Applied Economics Letters, 12(8), 473-78.

17
Phua, VoonChin, James McNally and Keyong-Suk Park. 2007, “Poverty Among Elderly Asian Americans in the Twenty-First Century,” Journal of Poverty 11(2), 73-92.
Raphael, Steven and Eugene Smolensky. 2008, “Immigration and Poverty in the United States,”
Institute for Research on Poverty Discussion Paper no. 1347-08. Rector, Robert. 2006, “Importing Poverty: Immigration and Poverty in the United States,”
Heritage Special Report SR-9. The Heritage Foundation. Available at http://www.heritage.org/research/immigration/upload/SR_9.pdf (Accessed in May 21, 2009).
Samuelson, Robert J. 2007, Importing Poverty, The Washington Post. (Sep 5, 2007, A21).

18
FIGURES
Figure 1: Foreign-born population in the United States, number and percent 1990 – 2007.
Source: Data were used from Camarota (2007: Figure 2 in page 4) and Pew Hispanic Center (2006: Table 2). Decennial Census for 1900 to 2000 were used. 2006 data were obtained from the comparison between 2000 Census (5% IPUMS) and 2006 American Community Survey (1% IPUMS). 2007 data were obtained from the Current Population Survey (CPS), which does not include those in group quarters. The 600,000 immigrants in group quarters were added to the 2007 CPS to make it comparable with the Census data.
0
2
4
6
8
10
12
14
16
0
5000000
10000000
15000000
20000000
25000000
30000000
35000000
40000000
1990 1910 1920 1930 1940 1950 1960 1970 1980 1990 2000 2006 2007
Number Percentage

19
Figure 2: Poverty rates of the U.S. population
Source: Authors’ compilation using CPS data.
Figure 3: Poverty rates of natives and immigrants
Source: Authors’ compilation using CPS data.
0
5
10
15
20
25
30
Total
White
African American
Asian
Mexican
Other Hispanic
0
5
10
15
20
25
Natives
Immigrants
20
Figure 4: Poverty rates of natives
Source: Authors’ compilation using CPS data.
Figure 5: Poverty rates of immigrants
Source: Authors’ compilation using CPS data.
0
5
10
15
20
25
30
Natives
White
African American
Asian
Mexican
Other Hispanic
0
5
10
15
20
25
30
35
Immigrants
White
African American
Asian
Mexican
Other Hispanic
21
Figure 6: Likelihood of Poverty Incidence and Age: Pooled Sample
Figure 7: Likelihood of Poverty Incidence and Age: Immigrants
Pro
ba
bili
tie
s a
nd
95
% C
I
Age20 40 60 80 100
.05
.06
.07
.08
Pro
ba
bili
tie
s a
nd
95
% C
I
Age20 40 60 80 100
.12
.14
.16
.18

22
TABLES
Table 1: Poverty rates of the U.S. population
1994 1995 1996 1997 1998 1999 2000 2001 2002 2003 2004 2005 2006 2007 2008
Total 12.6 12.2 12 12 11.5 11.1 10.5 10.1 10.2 10.7 10.7 11 11 10.6 10.6
White 8.7 8.3 7.9 7.9 7.9 7.6 7.3 6.9 7.1 7.4 7.4 7.8 7.6 7.4 7.3
African American 27.1 24.3 24 23.4 21.5 21.3 19.3 18.7 19 20.2 20.2 20.6 20.9 19.7 19.5
Asian 12.8 13.3 12.3 11.5 11.2 10.5 10 9.9 9.2 9 10.7 9.6 10.2 8.7 8.7
Mexican 26.3 26.7 25.9 26.2 24.1 22.3 19.8 18.5 18.6 18.9 19.4 19.4 19.6 17.9 18.7
Other Hispanic 23.3 23 23.7 21.7 20.7 19.1 16.9 15.8 16.4 17.3 16.7 16.2 16 15.8 15.6
Source: Authors’ compilation using CPS data.
Table 2: Poverty rates of the U.S. population by nativity and racial/ethnic groups
1994 1995 1996 1997 1998 1999 2000 2001 2002 2003 2004 2005 2006 2007 2008
Natives 11.5 11 10.6 10.7 10.3 10 9.5 9.1 9.4 9.9 9.8 10.2 10.3 10 9.7
White 8.6 8.2 7.7 7.7 7.7 7.4 7.2 6.8 6.9 7.4 7.3 7.8 7.5 7.4 7.3
African American 27.7 25 24.2 23.9 21.5 21.4 19.7 19.4 19.6 20.8 20.6 20.9 21.4 20 20
Asian 6.8 8.3 7.5 6.6 9.5 8.5 6.6 6.9 7.6 6.2 7.8 7.7 8.5 6.7 6.5
Mexican 19.9 21 19.7 20.7 18.5 17.8 16.3 14.4 14.5 14.2 14.8 14.9 15.6 14.9 14
Other Hispanic 24 23 23.6 22.5 21.6 20 16.4 16.6 17.6 17.5 16.3 16.1 17.8 16.6 16
Immigrants 20.4 20.3 21.3 20.3 19.2 17.9 16.3 15.4 14.7 15.3 15.8 15.5 15.2 14 15
White 11 11.3 11.5 11.8 10.9 10.2 9.1 9.9 9.7 8.9 8.9 8.6 8.3 7.4 8.3
African American 18 14.9 21.1 18.1 22.4 20 14.8 11.4 13.2 13.8 15.1 17.5 15.7 16.3 15.6
Asian 15 15 14.2 13.3 11.9 11.3 11.4 11.1 10 10 11.7 10.3 10.7 9.4 9.5
Mexican 33.1 32.2 31.6 31.4 29.5 26.8 23.1 22.1 22 22.9 23.2 23.3 23.2 20.4 22.8
Other Hispanic 22.8 22.9 23.8 21 19.8 18.3 17.4 15 15.3 17.1 17.1 16.2 14.4 15 15.1
Source: Authors’ compilation using CPS data.
23
Table 3: Detailed Poverty Incidence 1994 1995 1996 1997 1998 1999 2000 2001 2002 2003 2004 2005 2006 2007 2008
Natives
Below poverty 11.5 11.0 10.6 10.7 10.3 10.0 9.5 9.1 9.4 9.9 9.8 10.2 10.3 9.9 9.7
100-124 percent of the low-income level 4.4 4.2 4.2 4.3 4.1 3.7 3.8 3.9 3.6 3.7 3.8 3.8 3.7 3.7 3.7
125-149 percent of the low-income level 4.6 4.7 4.6 4.4 4.3 4.0 4.3 4.1 4.0 4.2 4.1 3.8 4.0 3.9 4.1
150 percent and above the low-income level 79.5 80.2 80.6 80.6 81.4 82.3 82.4 82.9 82.9 82.2 82.3 82.2 82.0 82.6 82.5
All Immigrants
Below poverty 20.4 20.3 21.2 20.3 19.2 17.9 16.3 15.4 14.7 15.3 15.8 15.5 15.5 14.0 15.0
100-124 percent of the low-income level 7.3 7.1 7.0 7.1 7.2 6.6 7.0 6.7 6.0 6.1 6.5 6.0 5.7 6.2 6.8
125-149 percent of the low-income level 7.1 6.6 7.3 7.4 6.2 6.8 7.0 6.5 6.5 6.8 6.9 6.1 6.7 6.4 6.3
150 percent and above the low-income level 65.2 66.1 64.5 65.2 67.4 68.8 69.7 71.4 72.8 71.8 70.7 72.5 72.5 73.4 71.9
Mexican immigrants
Below poverty 33.1 32.2 31.6 31.4 29.5 26.8 23.1 22.1 22.0 22.9 23.2 23.3 23.2 20.4 22.8
100-124 percent of the low-income level 12.9 11.8 10.8 10.2 11.3 10.3 9.5 10.3 8.9 9.5 10.0 9.2 9.2 9.9 11.8
125-149 percent of the low-income level 9.4 8.4 10.4 10.8 9.6 10.2 9.9 9.5 9.9 10.1 11.1 9.2 10.2 10.2 9.6
150 percent and above the low-income level 44.6 47.6 47.2 47.6 49.6 52.7 57.6 58.1 59.2 57.6 55.7 58.3 57.4 59.5 56.5
Source: Authors’ compilation using CPS data.

24
Table 4: Median Income 1994 1995 1996 1997 1998 1999 2000 2001 2002 2003 2004 2005 2006 2007 2008
Natives 37140 39189 40341 42120 44102 46616 48300 50115 53635 53714 55159 56517 58715 61004 64000
White 39750 41552 43093 45050 47071 50000 51374 53708 58148 58208 60000 61193 63900 66600 69987
African American 23845 26193 27393 29000 30900 30882 35000 35607 35065 34200 35674 36000 37200 39626 41107
Asian 54333 56035 56120 60070 60609 63660 67300 66683 67449 67020 73836 72800 77200 84000 85003
Mexican 30800 32000 31712 32762 36363 37216 40673 43175 44222 45000 45000 45700 47000 50100 52000
Other Hispanic 28665 29460 30350 32652 32480 36000 39000 40756 41886 43783 45000 46169 46675 49517 54275
Immigrants 30420 32141 32020 33987 36079 37000 40000 43240 45000 45001 45000 47240 49390 51000 53145
White 37947 38999 40600 43000 45302 48000 51000 52748 55882 57011 59996 60090 64126 66002 70002
African American 30400 37000 33000 33600 31900 35285 38189 42000 43200 45761 42936 43005 48001 50100 55000
Asian 43300 43920 45530 50000 51045 50802 56572 62100 60010 59530 61000 64499 66436 73500 75000
Mexican 23800 24500 24000 26030 26600 29060 32700 35100 35480 35000 34224 36000 36580 40000 39000
Other Hispanic 27000 28110 29460 30344 35000 36000 35666 40767 41000 40000 40461 42033 45316 48000 49476
Recent immigrants 26145 27525 27987 29000 31200 33000 35183 40070 41080 40000 40000 42000 43901 46730 48000
White 32437 32936 36112 40532 41200 41215 49469 52004 51872 50002 52400 56300 65000 62800 65000
African American 25949 31480 27361 31000 24064 26000 30000 36000 39050 42544 35518 35000 43366 44678 48540
Asian 33903 34403 36540 39740 48000 42000 43947 52847 52785 52006 51006 55553 60000 61640 68002
Mexican 21724 23000 21200 24002 24000 28600 31965 34240 34650 32480 33000 33000 34000 36121 35015
Other Hispanic 24000 24625 25341 26000 30003 32000 34100 40560 39438 39000 38000 38500 42800 46000 46000
Source: Authors’ compilation using CPS data.

25
Table 5: Sample Statistics Variable Natives Immigrants
Total Non-Poverty Poverty Total Non-Poverty Poverty
Age 43.77 44.05 41.3 41.8 42.3 38.9
Male 0.473 0.484 0.37 0.485 0.496 0.426
Married 0.547 0.583 0.23 0.593 0.621 0.447
Less than High School 0.181 0.159 0.385 0.363 0.321 0.576
High School 0.319 0.316 0.342 0.245 0.251 0.218
Some College 0.195 0.198 0.162 0.121 0.127 0.088
Associate Degree 0.079 0.083 0.043 0.050 0.055 0.028
College Degree 0.154 0.164 0.052 0.141 0.156 0.065
Graduate Degree 0.073 0.08 0.016 0.08 0.091 0.026
Metropolitan 0.744 0.75 0.685 0.922 0.925 0.911
Household Income 64,767 70,480 13,869 58,519 66,974 15,960
Home Owner 0.749 0.783 0.442 0.535 0.585 0.282
Southern residence 0.313 0.306 0.373 0.264 0.262 0.273
African American 0.109 0.095 0.23 0.059 0.059 0.057
Asian 0.013 0.013 0.009 0.199 0.212 0.132
Mexican 0.047 0.043 0.075 0.307 0.276 0.459
Other Hispanics 0.032 0.029 0.059 0.198 0.195 0.211
Years Since Migration 18.5 19.3 14.5
Sample year (1994 -1998) 0.278 0.275 0.298 0.248 0.237 0.303
Sample year (1999 - 2003) 0.323 0.324 0.307 0.322 0.326 0.306
Sample year (2004 - 2008) 0.399 0.400 0.395 0.430 0.437 0.391
New England Division 0.093 0.096 0.075 0.069 0.073 0.051
Middle Atlantic Division 0.113 0.114 0.111 0.162 0.164 0.155
East North Central Division 0.139 0.140 0.126 0.078 0.082 0.060
West North Central Division 0.110 0.111 0.097 0.039 0.039 0.039
South Atlantic Division 0.169 0.168 0.180 0.165 0.170 0.140
East South Central Division 0.056 0.053 0.077 0.012 0.012 0.012
West South Central Division 0.088 0.085 0.117 0.087 0.080 0.121
Mountain Division 0.114 0.114 0.111 0.096 0.093 0.111
Pacific Division 0.118 0.119 0.106 0.292 0.288 0.311
Number of observation 1,625,173 1,461,151 164,022 277,863 231,809 46,054
Source: Authors’ compilation using CPS data.

26
Table 6: Marginal Effects after Logit Regression (continues) Variable Pooled (Natives + Immigrants): (1) - (4) Immigrants: (5) - (7)
(1) (2) (3) (4) (5) (6) (7) Age 0.00186 0.00148 0.00148 0.0015 -0.000328 -0.000493 -0.000533
[38.56]*** [31.02]*** [30.89]*** [31.29]*** [-1.73] [-2.60]** [-2.81]**
Age Squared -0.00186 -0.00142 -0.00141 -0.00143 0.000612 0.00106 0.0011
[-36.94]*** [-28.35]*** [-28.21]*** [-28.59]*** [3.11]** [5.37]*** [5.59]***
Female 0.0288 0.0279 0.0279 0.0278 0.0476 0.0484 0.0487
[84.73]*** [82.84]*** [82.95]*** [82.74]*** [38.98]*** [39.87]*** [40.06]***
Immigrant 0.0237 0.0107 0.0106 0.0221 [44.69]*** [18.73]*** [18.70]*** [10.86]*** Married -0.0715 -0.0682 -0.0682 -0.0682 -0.0582 -0.0609 -0.0607
[-164.50]*** [-157.96]*** [-157.83]*** [-157.86]*** [-42.49]*** [-44.27]*** [-44.14]***
High School -0.0403 -0.0363 -0.0363 -0.0362 -0.0626 -0.0529 -0.0531
[-114.79]*** [-102.27]*** [-102.41]*** [-102.18]*** [-51.73]*** [-41.53]*** [-41.71]***
Some College -0.0511 -0.0473 -0.0473 -0.0473 -0.0769 -0.0663 -0.0664
[-157.31]*** [-141.81]*** [-141.93]*** [-141.89]*** [-58.39]*** [-45.79]*** [-45.82]***
Associate Degree -0.0558 -0.0525 -0.0526 -0.0525 -0.0854 -0.0755 -0.0757
[-163.94]*** [-147.32]*** [-147.49]*** [-147.48]*** [-52.06]*** [-40.97]*** [-41.02]***
College Degree -0.0717 -0.0669 -0.067 -0.0669 -0.106 -0.0922 -0.0925
[-228.49]*** [-204.44]*** [-204.71]*** [-204.16]*** [-88.77]*** [-66.83]*** [-67.02]***
Graduate Degree -0.0693 -0.0657 -0.0658 -0.0657 -0.112 -0.1 -0.1
[-223.18]*** [-199.41]*** [-199.61]*** [-199.21]*** [-88.48]*** [-66.60]*** [-66.75]***
Metropolitan -0.0285 -0.0351 -0.0352 -0.0352 -0.0291 -0.0266 -0.0268
[-61.56]*** [-72.19]*** [-72.33]*** [-72.28]*** [-11.53]*** [-10.62]*** [-10.67]***
Home Owner -0.106 -0.0976 -0.0978 -0.0976 -0.122 -0.118 -0.119
[-191.86]*** [-180.48]*** [-180.64]*** [-180.31]*** [-86.54]*** [-83.32]*** [-83.49]***
Southern 0.0172 0.0108 0.0109 0.011 0.00929 0.00816 0.008
[45.42]*** [28.88]*** [28.96]*** [29.25]*** [6.59]*** [5.77]*** [5.66]***
Self Employed 0.0215 0.0251 0.0253 0.0252 0.0219 0.0259 0.0262
[24.03]*** [27.42]*** [27.55]*** [27.49]*** [6.90]*** [8.04]*** [8.11]***
African American 0.0475 0.0474 0.0473 0.0196 0.019
[66.74]*** [66.67]*** [66.60]*** [5.86]*** [5.70]***
Asian 0.0168 0.0166 0.017 0.0074 0.00701
[15.02]*** [14.89]*** [15.16]*** [3.17]** [3.01]**
Mexican 0.0437 0.0434 0.044 0.0596 0.0584
[52.06]*** [51.84]*** [52.30]*** [25.53]*** [25.14]***
Other Hispanics 0.0263 0.0262 0.0261 0.0285 0.0281
[30.50]*** [30.41]*** [30.24]*** [12.81]*** [12.64]***
Year_1995 -0.00297 -0.00344 -0.00245 [-3.40]*** [-3.57]*** [-0.73] Year_1996 -0.00443 -0.00588 0.00203 [-4.97]*** [-6.02]*** [0.57] Year_1997 -0.00435 -0.00486 -0.0038 [-4.90]*** [-4.93]*** [-1.12] Yea_1998 -0.00594 -0.00618 -0.00822 [-6.77]*** [-6.33]*** [-2.46]* Year_1999 -0.00864 -0.00803 -0.0195 [-10.12]*** [-8.38]*** [-6.23]*** Year_2000 -0.013 -0.0112 -0.0346 [-16.07]*** [-12.10]*** [-12.31]*** Year_2001 -0.0157 -0.0135 -0.0405 [-19.76]*** [-14.76]*** [-14.99]*** Year_2002 -0.0137 -0.0112 -0.0387 [-18.77]*** [-13.36]*** [-15.13]*** Year_2003 -0.01 -0.0076 -0.0333 [-13.17]*** [-8.75]*** [-12.59]***

27
Table 6: Marginal Effects after Logit Regression (continuation) Variable Pooled (Natives + Immigrants): (1) - (4) Immigrants: (5) - (7)
(1) (2) (3) (4) (5) (6) (7)
Year_2004 -0.00914 -0.0073 -0.028 [-11.85]*** [-8.33]*** [-10.29]*** Year_2005 -0.00649 -0.00351 -0.0295 [-8.17]*** [-3.85]*** [-10.89]*** Year_2006 -0.00729 -0.00395 -0.0324 [-9.27]*** [-4.35]*** [-12.21]*** Year_2007 -0.0102 -0.00655 -0.0384 [-13.28]*** [-7.36]*** [-15.00]*** Year_2008 -0.00993 -0.00784 -0.03 [-12.92]*** [-8.92]*** [-11.16]*** Period (Year=2001) -0.0109 -0.0325
[-15.93]*** [-14.50]***
Period (Year=2002) -0.00444 -0.0265
[-12.97]*** [-20.56]***
Years Since Migration -0.00134 -0.00149 -0.00149
[-20.52]*** [-22.45]*** [-22.39]***
US Citizen -0.0208 -0.012 -0.0124
[-14.01]*** [-7.92]*** [-8.15]***
Year_1995*Immigrant 0.00195 [0.82] Year_1996*Immigrant 0.00704 [2.70]** Year_1997*Immigrant 0.00146 [0.60] Year_1998*Immigrant -0.000117 [-0.05] Year_1999*Immigrant -0.0046 [-2.02]* Year_2000*Immigrant -0.0109 [-5.28]*** Year_2001*Immigrant -0.0128 [-6.30]*** Year_2002*Immigrant -0.0146 [-8.10]*** Year_2003*Immigrant -0.0134 [-7.40]*** Year_2004*Immigrant -0.0106 [-5.61]*** Year_2005*Immigrant -0.0153 [-8.71]*** Year_2006*Immigrant -0.0167 [-9.76]*** Year_2007*Immigrant -0.0183 [-10.85]*** Year_2008*Immigrant -0.0118 [-6.34]*** Observations 1,903,036 1,903,036 1,903,036 1,903,036 293,821 293,821 293,821
Marginal effects; t statistics in brackets * significant at 5%; ** significant at 1 percent; *** significant at 0.1 percent
Base categories: Period= year <= 2001; year= 1994; gender=male; Educational attainment =Less than High School; place of residence = Non-metropolitan residence; house ownership = Non-homeowner; geographic location = Non-south residence; Race/ethnicity =White; marital status= Not married; citizenship =Non-US citizen.