munich personal repec archive - core 3 5 $ munich personal repec archive evolution of national -...
TRANSCRIPT
MPRAMunich Personal RePEc Archive
Evolution of national - internationaltrade in the period before the economicand financial crisis for selected economies
Lucia Paliu-Popa and Ana-Gabriela Babucea
Constantin Brancusi University of Targu Jiu
4. March 2013
Online at http://mpra.ub.uni-muenchen.de/56106/MPRA Paper No. 56106, posted 21. May 2014 13:24 UTC
Vol. 7(39), pp. 4155-4178, 21 October, 2013
DOI 10.5897/AJBM12.923
ISSN 1993-8233 © 2013 Academic Journals
http://www.academicjournals.org/AJBM
African Journal of Business Management
Full Length Research Paper
Evolution of national-international trade in the period before the economic and financial crisis for selected
economies
Lucia Paliu – Popa* and Ana - Gabriela Babucea
Department of Finance and Accounting, Faculty of Economics and Business Administration, Constantin Brancusi University of Targu Jiu, Victoria Street, no. 24, Targu Jiu, Gorj, Romania.
Accepted 4 March, 2013
The world economy has evolved in recent years amid some obvious inequalities and disparities nationally manifested on different levels, including the participation in international trade. This study took into account the two ways of approach, namely: evaluation and analysis of existing differences between the countries participating in global trade, on the one hand and development of a hierarchy among them, on the other hand, in terms of export, import and trade balance. Therefore, the analysis methodology specific to regional series was used, namely the territorial statistical indicators and multicriteria ranking. We also considered the changes made to the country with the best performance in the period 2002 to 2008, time for which official figures were used at the time of the study. The data used in the study have been taken from on-line databases available on the website of the Romanian National Statistics Institute: http://www.insse.ro/ and they refer to 41 countries for which information was available, data processed in order to be harmonized by authors, taking into account both the emerging countries (China, Romania, Greece, Bulgaria, Slovakia, Slovenia, Nigeria, Brazil etc.) and the economically developed countries (USA, Germany, Japan, United Kingdom etc.). Key words: Import, export, trade balance, evolution, ranking.
INTRODUCTION Given the increasing globalization of world economy and the internationalization of commercial transactions, we may note that the regional subregional and bilateral agreements on free trade are amplified along with the creation of customs union. We can not help noting that the trend of regionalization of the world economy, extre-mely strong, is accompanied by another trend, not less outstanding and dramatic, that of increasing globalization of international companies (Burciu et al., 2010). In this context, the tension between the two growing trends highlights the tension of decision-making processes:
centralized or decentralized. In special literature the relationships between rising
trade, economic growth, globalization and international disparities is very well reflected. Krugman (1979), Dixit and Norman (1980) and Helpman (1981) have given complete explanations of trade in the "new international economics". Romer (1987) and Lucas (1988) made the same thing in development economics, the "new growth theory". Also, is generally accepted that the free trade increase national economic performance and (Fischer, 2003; Pugel and Lindert, 2000). The globalization has
*Corresponding author. E-mail:- [email protected]

4156 Afr. J. Bus. Manage. been associated with a significant increase in trade across the world. Moreover, in many studies the semni-fication of the interaction between trade and regional disparities has become particularly important, but in general, there seems there is not a realy relationship between trade and regional disparities (Rodríguez-Pose, 2006). We may say that the regionalization of interna-tional trade and globalization are not exclusive processes, as they complement and blend each other, but are complementary in achieving the overall, common objective to liberalize world trade. The latent tensions between regionalization and globalization, between centralization and decentralization, between the govern-ment and companies are strongly and progressively reflected in the efforts to harmonize trade policies and to liberalize international trade, which are taking place in the World Trade Organization (WTO) and the General Agreement on Tariffs and Trade (GATT). Referring to our country (Paliu-Popa, 2009), we consider it appropriate to mention that Romania's trade policy (Sută et al., 2000) can not ignore the international situation, plus solid evidence of our country's real economy, affecting the Romanian foreign trade (Blănaru, 2009).
Given the role and importance of foreign trade in the global economy, we will analyze below the evolution of international trade, by groups of countries and regions during 2002 to 2008, overall and per capita, and then we will analyze the foreign trade of each country, considering the share of exports and imports from different countries in the world trade. We will not exclude trade balance from the analysis, both overall and per capita, because it is an important means of knowing the level of development of national economy, plus the efficiency and performance of such country's participation in international economic exchanges. Thus, the analysis made will allow us to achieve rankings and draw conclusions regarding the place and role of trade of each state in the development of international trade. EVOLUTIVE TRENDS OF INTERNATIONAL TRADE IN THE PERIOD BEFORE THE ECONOMIC AND FINANCIAL CRISIS
The participation of all states in international economic exchange becomes an objective necessity in the contem-porary period. We consider that the main arguments that advocate such guideline are closely related to: unpre-cedented increase in complexity of the global economy, increased dynamism of technical progress, the high degree of diversification of economic processes, increa-sed interdependence of national economies, significant benefits that can be earned on the international division of labor and/or specialization in production, globalization of economic activities, proliferation of doctrines and policies that promote the establishment of the new international political and economic order etc.
A country's foreign trade problems (imports, exports,
intra-Community commercial transactions) can be discussed only in close connection with its trade balance. If we refer to the foreign trade, as part of trade balance and to the values that export and import achieve in a certain period, usually one year, then we can say that the trade balance of a country can be: - Active or redundant if exports exceed imports; - Passive or weak, if imports exceed the exports; - In equilibrium and balanced, if imports and exports are equal. If the trade balance has the effect of increasing the growth of the economy, we can say that its economic deficit leads to the need to use external credits that can be justified only insofar as they can be reimbursed as a result of increased production achieved by using them (Cerchez, 2007).
Referring to the trade surplus we can appreciate that it is an element of accumulation, which may lead, under a cost-effective export, to increase in the foreign reserves and therefore to the possibility of paying future imports. The absolute level of total FOB
1 export (million USD), in
the period under review, 2002 to 2008, for all countries involved in international trade, has generally seen upward trends, Germany and the Republic of China were particularly emphasized (Table 1).
If we focus attention on Germany, placed in 2002 on the 2nd place in the world in terms of exports, with a level of 612,857.00, dollars, we can see that in the next six years it had a linear trend with an annual absolute average increase of 141,837.33 million dollars, that is an annual average relative increase by 60.19%, thus reaching in 2008 the absolute level of exports of 1,463,881 million dollars, 2.39 times greater than in 2002, thus holding the first place in the world.
We can not help noticing the really spectacular progress made by the Republic of China, which, holding the 4th place in 2002, with an export level of only 325,591.00 million dollars, representing 53% of the German exports and 47% of U.S. exports, which held the first place, came in 2008 to increase its export level by 4.39 times, holding the second position, with only 35,221.00 million dollars less than Germany, registering in the 6-year period an average annual increase of 183,844.83 million dollars. Under these conditions, although the U.S. was the major global exporter in 2002, in terms of the volume of value, while maintaining an upward trend, was surpassed by Germany in 2003 and then by the Republic of China in 2007, thus holding the third position in 2008, with a level of exports of 1,301,110 million dollars, that is 91.07% of China's exports and only 88.88% of German exports.
When referring to the 3rd place in the world in 2002,
1 FOB (Free on Board) is the price at the border of the exporting country, which
includes the value of the property, all transport costs to the point of embarkation, and all fees incurred for the property to be loaded on board.

Popa and Babucea 4157 Table 1. Dynamics of FOB exports, CIF imports and foreign trade balance during 2002-2008 for selected countries in international trade (million dollars)
No. COUNTRY 2002 2003 2004 2005 2006 2007 2008
FOB CIF Balance FOB CIF Balance FOB CIF Balance FOB CIF Balance FOB CIF Balance FOB CIF Balance FOB CIF Balance
1. Austria 70891 72881 -1990 87567 88265 -698 109004 108866 138 117740 119965 -2225 130361 130937 -576 156650 156133 517 173950 172840 1110
2. Belgium 215880 199393 16487 255516 234795 20721 306818 285596 21222 335868 318768 17100 366938 351908 15030 432287 413565 18722 477331 470828 6503
3. Bulgaria 5749 7987 -2238 7540 10887 -3347 9931 14467 -4536 11740 18163 -6423 15101 23270 -8169 18575 30086 -11511 22587 37369 -14782
4. Czech Republici 38488 40736 -2248 48715 51245 -2530 67198 68435 -1237 77988 76343 1645 95165 93453 1712 122760 118467 4293 145921 141593 4328
5. Denmark 56230 49288 6942 65280 56227 9053 75568 66845 8723 83569 74265 9304 91705 85102 6603 102863 98860 4003 115785 111326 4459
6. Finland 44671 33642 11029 52513 41600 10913 60916 50677 10239 65240 58474 6766 77287 69447 7840 90091 81756 8335 96879 92125 4754
7. Franceii 312436 311240 1196 365720 370699 -4979 417158 440422 -23264 444222 485594 -41372 482768 535663 -52895 550461 623108 -72647 605284 705665 -100381
8. Germany 612857 492112 120745 751824 604729 147095 911859 718269 193590 977970 780514 197456 1122112 922376 199736 1323818 1055997 267821 1463881 1198965 264916
9. Greece 10315 31164 -20849 13195 44375 -31180 14996 51559 -36563 15511 49817 -34306 20180 59121 -38941 23472 75100 -51628 25231 77831 -52600
10. Ireland 87498 51508 35990 92431 53315 39116 104204 61413 42791 109605 69177 40428 104639 83889 20750 122624 85626 36998 126150 82670 43480
11. Italy 254219 246613 7606 299468 297405 2063 353544 355269 -1725 372962 384837 -11875 416199 440828 -24629 499924 509922 -9998 548955 558543 -9588
12. Luxembourg 8585 11554 -2969 9950 13679 -3729 12181 16829 -4648 12699 17565 -4866 14172 19434 -5262 16021 22168 -6147 17857 25044 -7187
13. Netherlands 222406 193784 28622 258915 233091 25824 317936 283734 34202 349844 310600 39244 399635 358510 41125 476806 421084 55722 541445 488960 52485
14. Poland 41032 55141 -14109 53699 68153 -14454 74831 89094 -14263 89214 100759 -11545 110941 127260 -16319 138756 162437 -23681 168705 204926 -36221
15. Portugal 25536 38326 -12790 30714 40843 -10129 33023 49225 -16202 32137 53407 -21270 42890 65605 -22715 50241 76369 -26128 57057 89736 -32679
16. United Kingdom 276315 335458 -59143 304268 380821 -76553 341621 451715 -110094 371406 483064 -111658 428357 547508 -119151 434790 622125 -187335 458760 631526 -172766
17. Romania 13876 17862 -3986 17618 24003 -6385 23485 32664 -9179 27730 40463 -12733 32336 51106 -18770 40471 70414 -29943 49674 84286 -34612
18. Slovakia 14478 17460 -2982 21966 23760 -1794 27605 30469 -2864 31997 36168 -4171 41939 46256 -4317 57766 62102 -4336 70982 74034 -3052
19. Slovenia 10357 10933 -576 12767 13854 -1087 15879 17571 -1692 17896 19626 -1730 20985 23014 -2029 26553 29481 -2928 29233 33937 -4704
20. Spain 123563 163575 -40012 156024 208553 -52529 182156 257672 -75516 191021 287610 -96589 213350 326046 -112696 246752 382651 -135899 277695 417049 -139354
21. Sweden 81298 66717 14581 102405 84222 18183 123306 100792 22514 130205 111324 18881 147236 126610 20626 166834 148977 17857 183093 165124 17969
22. Hungary 34512 37787 -3275 42532 47602 -5070 54893 59636 -4743 62179 65783 -3604 74217 77206 -2989 93379 94373 -994 107466 106380 1086
23. Switzerland 83922 79129 4793 97165 92014 5151 114138 106645 7493 126099 119784 6315 141679 132030 9649 164809 153181 11628 192111 173657 18454
24. Norway 59575 34889 24686 67103 39284 27819 81709 48062 33647 101917 54786 47131 120550 63349 57201 137975 79778 58197 165251 87896 77355
25. Russian Federation 106705 46161 60544 126048 52449 73599 181663 75569 106094 241473 98708 142765 301244 137807 163437 351930 199754 152176 467666 267021 200645
26. Turkey 34561 49663 -15102 46576 65637 -19061 61683 96368 -34685 71928 98998 -27070 81912 133584 -51672 107136 169792 -62656 132003 201823 -69820
27. China, People’s Republic ofiii 325591 295171 30420 437899 413062 24837 593439 560683 32756 761953 659953 102000 969380 791605 177775 1217815 956284 261531 1428660 1131620 297040
28. China, RAS Hong Cong 200092 207644 -7552 223762 231896 -8134 259260 271074 -11814 289337 299533 -10196 316816 334681 -17865 344629 367864 -23235 362675 388505 -25830
29. Republic of Korea 162470 152126 10344 193817 178827 14990 253845 224463 29382 284419 261238 23181 325465 309383 16082 371554 356648 14906 422007 435275 -13268
30. India 49232 56495 -7263 57086 71239 -14153 71798 94070 -22272 99374 138855 -39481 120862 175243 -54381 145513 215718 -70205 177603 293377 -115774
31. Japan 416730 337209 79521 471999 383085 88914 565743 454592 111151 594986 514988 79998 649948 579609 70339 709668 619845 89823 786434 762575 23859
32. Singapore 125177 116441 8736 144183 127935 16248 198633 173582 25051 229652 200050 29602 271809 238711 33098 299270 263155 36115 338201 319781 18420
33. South Africa 28713 28261 452 35032 39649 -4617 43707 46266 -2559 51640 62325 -10685 58197 - 581972 69787 88450 -18663 84488 - 84488

4158 Afr. J. Bus. Manage. Table 1. Contd.
34. Nigeria 15107 7547 7560 19887 10853 9034 31148 14164 16984 42277 15200 27077 45403 22222 23181 65133 37576 27557 - - 0
35. Argentina 25709 8990 16719 29566 13834 15732 34550 22445 12105 40351 28689 11662 46569 34158 12411 55779 44707 11072 70588 57413 13175
36. Brazil 60362 49603 10759 73084 50706 22378 96475 66433 30042 118308 77633 40675 137807 95851 41956 160649 126564 34085 197942 182408 15534
37. Canada5 252408 221961 30447 272696 239083 33613 304456 273084 31372 359421 323361 36060 389513 348958 40555 416431 379792 36639 452170 407169 45001
38. United States of America 693860 1202430 -508570 724771 1303050 -578279 818520 1525680 -707160 907158 1732350 -825192 1038270 1919430 -881160 1162980 2017330 -854350 1301110 2165980 -864870
39. Mexico, U.S.5 160682 168679 -7997 165396 170490 -5094 189083 197347 -8264 213891 221414 -7523 250441 256130 -5689 272055 283264 -11209 291827 310561 -18734
40. Australia 65036 72693 -7657 71548 89090 -17542 86420 109383 -22963 105833 125283 -19450 123316 139279 -15963 141122 165364 -24242 187362 200563 -13201
41. New Zealand 14380 15047 -667 16505 18565 -2060 20344 23195 -2851 21729 26234 -4505 22434 26430 -3996 26946 30885 -3939 30591 34385 -3794
Source: Statistical Yearbook 2009, National Institute of Statistics and Processed Data
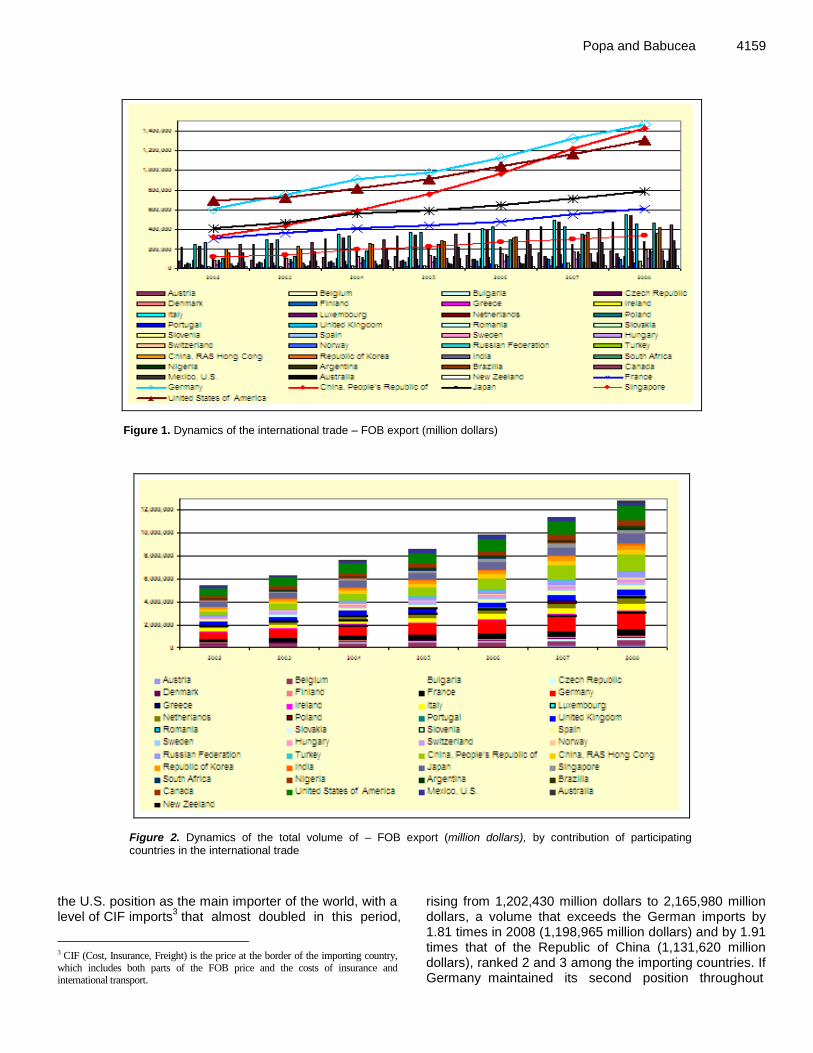
namely Japan, surpassed by the Republic of China since 2004, it holds in 2008 only the 4th position in the world with a level of exports of 514,676.00 million dollars lower than that of the U.S., which ranks 2nd (Figure 1).
With similar dynamics, France and Singapore maintain places 5 and 6 in the world throughout the period analyzed, while the gap between them and the holders of the first three positions is widening every year. In fact, for a total export in 2008 of 12,852.610 million dollars compared to only 5,441.504 million dollars in 2002, that is 2.36 higher, the share incumbent on the first three exporting countries, Germany, Republic of China and the U.S. was of over 28%; the other 38 countries covered the difference in percent (Table 2). For an overview of the dynamics evolution of FOB exports in the period 2002 to 2008, by groups of countries, we used the graphical representation in Figure 1, and for its dynamics by contribution of the participating countries in the international trade, the graphical representation in Figure 2.
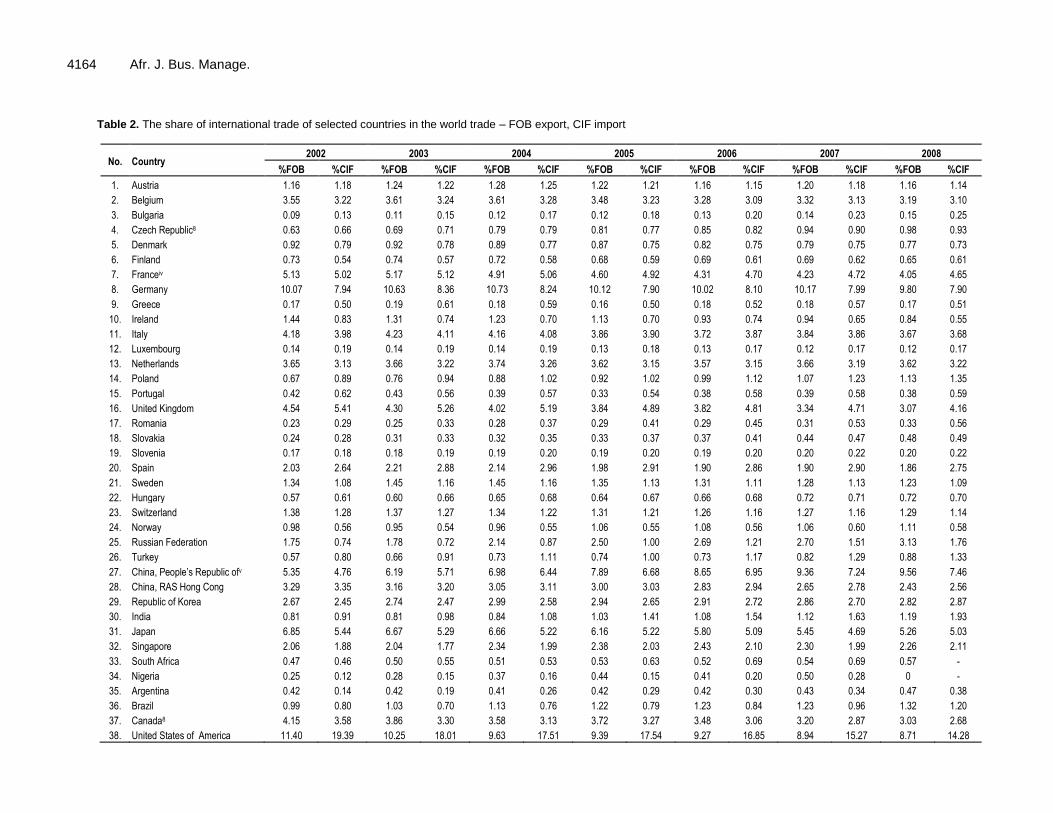
If we analyze the share in total exports, we can easily see that while the U.S. decreased significantly from 11.40% in 2002 to 8.71% in 2008 and Germany from 10.07% to 9.80%, the
Republic of China registered a significant increase from 5.35% of total exports in 2002 to 9.56% in 2008 (Table 2).
We can not continue our approach of analysis of the evolutionary trend of international trade, in the period preceding the financial and economic crisis, without specifying that Romania, with an absolute level of exports of only 13.876 million dollars in 2002, registering an upward trend specific to all the countries in the period under review, also recorded in 2008 an increase of approx 3.5 times compared to 2002, significant increase for its trade, but the level of only 49 676 million dollars places it well below the share of 0.5% of the total world exports. Using the data from Table 2, in Figure 3 we presented the share that the exports of the countries under study had during 2002-2008 in the international trade.
However, in order to better capture the role and place of the foreign trade of each country in their global development, we believe that the export level in relation to the number of inhabitants of a country, FOB/capita is a more relevant indicator, if we consider that the countries have different sizes and economic forces (Table 3).
From this perspective, the first position throughout the period 2002 to 2008 was held by
Singapore with a FOB export level of 37,035.00 USD/capita in 2002, compared to only 2,384.00 USD/capita, a value recorded by the U.S. or of 7,429.00 USD/capita in Germany, amounting in 2008 to 70,459.00 USD/capita, compared to 4,273.00 USD/capita in the U.S. and 17,809.00 USD/capita in Germany. Although the Republic of China made exports that placed it on the second place in the world, in the year 2008, with a very large population, the same had only 1,078.00 USD/capita in that year. Even if the increase in absolute size was impressive, we can see that in relative size it was only 4.29 times greater. Romania, with a level of exports per capita of 2,310.00 USD/capita in 2008 compared to 637 USD/capita in 2002, registered a growth by 3.6 times (Figure 4).
We can not help noticing that significant levels of FOB exports/capita were registered in 2008 by China RAS Hong Cong (51,811.00 USD/capita) Belgium (44,610.00 USD/capita) Luxembourg (35,714.00 USD/capita) and Norway (34,427.00 USD/capita), while Brazil stands in the opposite side with 1,015.00 USD/capita or India with only 155 USD/capita.
Imports, the second element describing interna-tional trade reveals for the period 2002 to 2008
Popa and Babucea 4159
Figure 1. Dynamics of the international trade – FOB export (million dollars)
Figure 2. Dynamics of the total volume of – FOB export (million dollars), by contribution of participating countries in the international trade
the U.S. position as the main importer of the world, with a level of CIF imports
3 that almost doubled in this period,
3 CIF (Cost, Insurance, Freight) is the price at the border of the importing country,
which includes both parts of the FOB price and the costs of insurance and international transport.
rising from 1,202,430 million dollars to 2,165,980 million dollars, a volume that exceeds the German imports by 1.81 times in 2008 (1,198,965 million dollars) and by 1.91 times that of the Republic of China (1,131,620 million dollars), ranked 2 and 3 among the importing countries. If Germany maintained its second position throughout

4160 Afr. J. Bus. Manage.
Figure 3. The share of international trade of some countries in the world trade – FOB export (%)
Figure 4. FOB export dynamics, (USD), per capita
the period, and even we can say that it maintained its position compared to the U.S., we can not say the same thing about Singapore, which in 2003 surpassed France and Japan, almost catching up with Germany, by 2008 (Table 1, Figures 5 and 6).
As for the contribution of countries participating in international imports, U.S., Germany and the Republic of China are clearly detached; in 2002 they had together 32.09% of the total global imports, and in 2008 they had 29.64%, while total imports increased by approx. 2.4

Popa and Babucea 4161
Figure 5. Dynamics of the international trade – FOB import (million dollars)
Figure 6. Dynamics of the total volume of – CIF import (million dollars), by contribution of participating countries in the international trade
times during this period of time.
Referring to Romania, we note that its imports have registered an upward trend, making in 2008 imports amounting to 84,286.00 million dollars, with about 4.72

4162 Afr. J. Bus. Manage.
Figure 7. The share of international trade of some countries in the world trade – FOB import (%)
times more than in 2002, when its imports stood at 17,862.00 million dollars, a significant increase, but the level recorded in the year 2008 is 0.56% of the total global imports, while in 2002 it was only 0.29%.
As with exports, the U.S. stands out with 14.28% in total imports in 2008, almost double compared to Germany or the Republic of China, but we must consider that the U.S. has been on a downward trend if we take into account that in 2002 it had 19.39% of total imports.
If Germany maintained its share in total imports, we can not say the same thing about the Republic of China that stands out with an upward trend, rising steadily from 4.76% in 2002 to 7.46% in 2008 (Table 2 and Figure 7).
If we relate the value of annual imports to the number of inhabitants, we see that in general, throughout the period, following similar trends, just like the exports, the following countries had the highest level of annual imports/capita in 2008: Singapore (66,621.00 USD/ capita), China RAS Hong Cong (55,501.00 USD/capita), Luxembourg (50,088.00 USD/capita), Belgium (44,003.00 USD/capita) and the Netherlands (29,815.00 USD/capita), basically except Norway which is surpassed by the Netherlands, the top of importing countries, taking into account the number of inhabitants, includes the same countries as in the export/capita (Table 3 and Figure 8). Romania registered the same upward trend; the import growth per capita was about 4.78 times in 2008 (3,919.00 USD/capita) compared to 2002 (820 USD/capita).
Although following the analysis made we captured the evolutionary trends of exports and imports made by the
economies of some countries, from different territorial and development regions, in absolute and relative sizes, overall and per capita, during 2002-2008, we consider that another indicator would better describe the degree of economic development and integration of a country's economy in the world economy in terms of international trade, and it refers to the trade balance, or even more relevant, the propensity to export of that country, which takes into account both the FOB exports and CIF imports. In this context, using the data from Table 1 on the trade balance we carried out the graphical representation in Figure 9, that points out some particular aspects of the U.S.
Although the level of exports and imports situated the U.S. at the forefront during the period under study, as we noted from previous conclusions, since 2002, every year, the U.S. balance was poor, which made that in the period 2002-2006, the cumulative negative difference between the amount of import and the amount of export be more than 500,000 million dollars, reaching in 2006 to over 880,000 million dollars and oscillating in the coming years around 860,000 million dollars, such phenomenon was also registered in the trade balance/capita, which depreciated from – 1,747.00 USD/capita in 2002, to – 2,840.00 USD/capita in 2008, after which in 2006 it reached the level of – 2,946.00 USD/capita (Table 3 and Figure 9). The United Kingdom experienced the same negative phenomenon of deficit balance accumulation in the trade balance in the period 2002 to 2006, with an of a positive balance, ahead of Japan in 2005, the Russian

Popa and Babucea 4163
Figure 8. Dynamics of the international trade – CIF import (USD), per capita
Figure 9. Dynamics of trade balance (million dollars)
increase between 2006 to 2008, even though not to such a worrying extent as the U.S.
Not the same can be said about the Republic of China that, since 2004, is distinguished by an increasing trend
4164 Afr. J. Bus. Manage.
Table 2. The share of international trade of selected countries in the world trade – FOB export, CIF import
No. Country 2002 2003 2004 2005 2006 2007 2008
%FOB %CIF %FOB %CIF %FOB %CIF %FOB %CIF %FOB %CIF %FOB %CIF %FOB %CIF
1. Austria 1.16 1.18 1.24 1.22 1.28 1.25 1.22 1.21 1.16 1.15 1.20 1.18 1.16 1.14
2. Belgium 3.55 3.22 3.61 3.24 3.61 3.28 3.48 3.23 3.28 3.09 3.32 3.13 3.19 3.10
3. Bulgaria 0.09 0.13 0.11 0.15 0.12 0.17 0.12 0.18 0.13 0.20 0.14 0.23 0.15 0.25
4. Czech Republic8 0.63 0.66 0.69 0.71 0.79 0.79 0.81 0.77 0.85 0.82 0.94 0.90 0.98 0.93
5. Denmark 0.92 0.79 0.92 0.78 0.89 0.77 0.87 0.75 0.82 0.75 0.79 0.75 0.77 0.73
6. Finland 0.73 0.54 0.74 0.57 0.72 0.58 0.68 0.59 0.69 0.61 0.69 0.62 0.65 0.61
7. Franceiv 5.13 5.02 5.17 5.12 4.91 5.06 4.60 4.92 4.31 4.70 4.23 4.72 4.05 4.65
8. Germany 10.07 7.94 10.63 8.36 10.73 8.24 10.12 7.90 10.02 8.10 10.17 7.99 9.80 7.90
9. Greece 0.17 0.50 0.19 0.61 0.18 0.59 0.16 0.50 0.18 0.52 0.18 0.57 0.17 0.51
10. Ireland 1.44 0.83 1.31 0.74 1.23 0.70 1.13 0.70 0.93 0.74 0.94 0.65 0.84 0.55
11. Italy 4.18 3.98 4.23 4.11 4.16 4.08 3.86 3.90 3.72 3.87 3.84 3.86 3.67 3.68
12. Luxembourg 0.14 0.19 0.14 0.19 0.14 0.19 0.13 0.18 0.13 0.17 0.12 0.17 0.12 0.17
13. Netherlands 3.65 3.13 3.66 3.22 3.74 3.26 3.62 3.15 3.57 3.15 3.66 3.19 3.62 3.22
14. Poland 0.67 0.89 0.76 0.94 0.88 1.02 0.92 1.02 0.99 1.12 1.07 1.23 1.13 1.35
15. Portugal 0.42 0.62 0.43 0.56 0.39 0.57 0.33 0.54 0.38 0.58 0.39 0.58 0.38 0.59
16. United Kingdom 4.54 5.41 4.30 5.26 4.02 5.19 3.84 4.89 3.82 4.81 3.34 4.71 3.07 4.16
17. Romania 0.23 0.29 0.25 0.33 0.28 0.37 0.29 0.41 0.29 0.45 0.31 0.53 0.33 0.56
18. Slovakia 0.24 0.28 0.31 0.33 0.32 0.35 0.33 0.37 0.37 0.41 0.44 0.47 0.48 0.49
19. Slovenia 0.17 0.18 0.18 0.19 0.19 0.20 0.19 0.20 0.19 0.20 0.20 0.22 0.20 0.22
20. Spain 2.03 2.64 2.21 2.88 2.14 2.96 1.98 2.91 1.90 2.86 1.90 2.90 1.86 2.75
21. Sweden 1.34 1.08 1.45 1.16 1.45 1.16 1.35 1.13 1.31 1.11 1.28 1.13 1.23 1.09
22. Hungary 0.57 0.61 0.60 0.66 0.65 0.68 0.64 0.67 0.66 0.68 0.72 0.71 0.72 0.70
23. Switzerland 1.38 1.28 1.37 1.27 1.34 1.22 1.31 1.21 1.26 1.16 1.27 1.16 1.29 1.14
24. Norway 0.98 0.56 0.95 0.54 0.96 0.55 1.06 0.55 1.08 0.56 1.06 0.60 1.11 0.58
25. Russian Federation 1.75 0.74 1.78 0.72 2.14 0.87 2.50 1.00 2.69 1.21 2.70 1.51 3.13 1.76
26. Turkey 0.57 0.80 0.66 0.91 0.73 1.11 0.74 1.00 0.73 1.17 0.82 1.29 0.88 1.33
27. China, People’s Republic ofv 5.35 4.76 6.19 5.71 6.98 6.44 7.89 6.68 8.65 6.95 9.36 7.24 9.56 7.46
28. China, RAS Hong Cong 3.29 3.35 3.16 3.20 3.05 3.11 3.00 3.03 2.83 2.94 2.65 2.78 2.43 2.56
29. Republic of Korea 2.67 2.45 2.74 2.47 2.99 2.58 2.94 2.65 2.91 2.72 2.86 2.70 2.82 2.87
30. India 0.81 0.91 0.81 0.98 0.84 1.08 1.03 1.41 1.08 1.54 1.12 1.63 1.19 1.93
31. Japan 6.85 5.44 6.67 5.29 6.66 5.22 6.16 5.22 5.80 5.09 5.45 4.69 5.26 5.03
32. Singapore 2.06 1.88 2.04 1.77 2.34 1.99 2.38 2.03 2.43 2.10 2.30 1.99 2.26 2.11
33. South Africa 0.47 0.46 0.50 0.55 0.51 0.53 0.53 0.63 0.52 0.69 0.54 0.69 0.57 -
34. Nigeria 0.25 0.12 0.28 0.15 0.37 0.16 0.44 0.15 0.41 0.20 0.50 0.28 0 -
35. Argentina 0.42 0.14 0.42 0.19 0.41 0.26 0.42 0.29 0.42 0.30 0.43 0.34 0.47 0.38
36. Brazil 0.99 0.80 1.03 0.70 1.13 0.76 1.22 0.79 1.23 0.84 1.23 0.96 1.32 1.20
37. Canada8 4.15 3.58 3.86 3.30 3.58 3.13 3.72 3.27 3.48 3.06 3.20 2.87 3.03 2.68
38. United States of America 11.40 19.39 10.25 18.01 9.63 17.51 9.39 17.54 9.27 16.85 8.94 15.27 8.71 14.28

Popa and Babucea 4165
Table 2. Contd.
39. Mexico, U.S.8 2.64 2.72 2.34 2.36 2.22 2.27 2.21 2.24 2.24 2.25 2.09 2.14 1.95 2.05
40. Australia 1.07 1.17 1.01 1.23 1.02 1.26 1.10 1.27 1.10 1.22 1.08 1.25 1.25 1.32
41. New Zealand 0.24 0.24 0.23 0.26 0.24 0.27 0.22 0.27 0.20 0.23 0.21 0.23 0.20 0.23
42. Other countries 10.59 9.10 10.58 9.06 10.04 8.22 11.07 8.65 11.97 8.83 12.32 9.94 14.00 11.74
Table 3. International trade: FOB Export, CIF Import and trade Balance, per capita
No. Country 2002 2003 2004 2005 2006 2007 2008
FOB CIF Balance FOB CIF Balance FOB CIF Balance FOB CIF Balance FOB CIF Balance FOB CIF Balance FOB CIF Balance
1. Austria 8,741 8,987 -246 10,789 10,875 -86 13,309 13,293 16 14,376 14,648 -272 15,706 15,776 -70 18,873 18,811 62 20,708 20,576 132
2. Belgium 20,959 19,359 1,600 24,764 22,756 2,008 29,445 27,408 2,037 32,233 30,592 1,641 34,946 33,515 1,431 40,782 39,016 1,766 44,610 44,003 607
3. Bulgaria 721 1,002 -281 955 1,379 -424 1,285 1,872 -587 1,519 2,350 -831 1,961 3,022 -1,061 2,412 3,907 -1,495 2,972 4,917 -1,945
4. Czech Republicvi 3,773 3,994 -221 4,759 5,006 -247 6,575 6,696 -121 7,631 7,470 161 9,239 9,073 166 11,918 11,502 416 14,031 13,615 416
5. Denmark 10,510 9,213 1,297 12,170 10,482 1,688 13,917 12,310 1,607 15,390 13,677 1,713 16,982 15,760 1,222 18,702 17,975 727 21,052 20,241 811
6. Finland 8,591 6,470 2,121 10,085 7,989 2,096 11,603 9,653 1,950 12,427 11,138 1,289 14,582 13,103 1,479 16,998 15,426 1,572 18,279 17,382 897
7. Francevii 5,254 5,234 20 5,907 5,988 -81 6,693 7,066 -373 7,127 7,791 -664 7,675 8,516 -841 8,655 9,797 -1,142 9,487 11,061 -1,574
8. Germany 7,429 5,966 1,463 9,116 7,332 1,784 11,027 8,686 2,341 11,827 9,439 2,388 13,618 11,194 2,424 16,085 12,831 3,254 17,809 14,586 3,223
9. Greece 940 2,841 -1,901 1,202 4,043 -2,841 1,349 4,637 -3,288 1,395 4,480 -3,085 1,818 5,326 -3,508 2,096 6,705 -4,609 2,253 6,949 -4,696
10. Ireland 22,321 13,140 9,181 23,365 13,477 9,888 25,109 14,798 10,311 26,411 16,669 9,742 24.,14 19,974 4,940 27,869 19,460 8,409 28,033 18,371 9,662
11. Italy 4,423 4,290 133 5,215 5,179 36 6,086 6,116 -30 6,420 6,625 -205 7,054 7,472 -418 8,430 8,599 -169 9,165 9,325 -160
12. Luxembourg 19,511 26,259 -6,748 21,965 30,196 -8,231 25,917 35,806 -9,889 27,019 37,372 -10,353 28,344 38,868 -10,524 32,042 44,336 -12,294 35,714 50,088 -14,374
13. Netherlands 13,780 12,006 1,774 16,033 14,434 1,599 19,505 17,407 2,098 21,463 19,055 2,408 24,368 21,860 2,508 29,074 25,676 3,398 33,015 29,815 3,200
14. Poland 1,062 1,428 -366 1,392 1,766 -374 1,942 2,312 -370 2,315 2,615 -300 2,912 3,340 -428 3,642 4,263 -621 4,428 5,379 -951
15. Portugal 2,541 3,814 -1,273 3,052 4,059 -1,007 3,145 4,688 -1,543 3,061 5,086 -2,025 4,046 6,189 -2,143 4,695 7,137 -2,442 5,383 8,466 -3,083
16. United Kingdom 4,678 5,679 -1,001 5,135 6,427 -1,292 5,725 7,570 -1,845 6,224 8,096 -1,872 7,080 9,050 -1,970 7,128 10,199 -3,071 7,484 10,302 -2,818
17. Romania 637 820 -183 811 1,105 -294 1,084 1,507 -423 1,282 1,871 -589 1,498 2,368 -870 1,879 3,269 -1390 2,310 3,919 -1609
18. Slovakia 2,691 3,245 -554 4,066 4,398 -332 5,112 5,642 -530 5,925 6,698 -773 7,766 8,566 -800 10,697 11,500 -803 13,145 13,710 -565
19. Slovenia 5,205 5,494 -289 6,435 6,983 -548 8,060 8,919 -859 9,084 9,962 -878 10,493 11,507 -1,014 13,277 14,741 -1,464 14,617 16,969 -2,352
20. Spain 3,015 3,992 -977 3,800 5,079 -1,279 4,230 5,984 -1,754 4,436 6,679 -2,243 4,689 7,166 -2,477 5,447 8,447 -3,000 5,972 8,969 -2,997
21. Sweden 9,155 7,513 1,642 11,537 9,489 2,048 13,640 11,150 2,490 14,403 12,315 2,088 16,180 13,913 2,267 18,333 16,371 1,962 19,901 17,948 1,953
22. Hungary 3,397 3,719 -322 4,306 4,819 -513 5,345 5,905 -560 6,156 6,513 -357 7,348 7,644 -296 9,245 9,344 -99 10,747 10,638 109
23. Switzerland 11,512 10,854 658 13,553 12,835 718 15,743 14,710 1,033 17,393 16,522 871 18,891 17,604 1,287 21,975 20,424 1,551 25,278 22,850 2,428
24. Norway 13,122 7,685 5,437 14,803 8,666 6,137 17,686 10,403 7,283 22,060 11,858 10,202 25,649 13,479 12,170 29,356 16,974 12,382 34,427 18,312 16,115
25. Russian Federation 741 320 421 880 366 514 1,269 528 741 1,686 689 997 2,117 968 1149 2,484 1,410 1074 3,296 1,882 1414
26 Turkey 496 713 -217 653 920 -267 843 1,317 -474 983 1,353 -370 1,111 1,813 -702 1,448 2,294 -846 1,765 2,698 -933
27. China, People’s Republic ofviii 251 228 23 336 317 19 451 426 25 579 502 77 739 604 135 924 726 198 1,078 854 224
28. China, RAS Hong Cong 29,512 30,626 -1,114 31,744 32,898 -1,154 36,827 38,505 -1,678 41,099 42,547 -1,448 45,259 47,812 -2,553 49,946 53,314 -3,368 51,811 55,501 -3,690
29. Republic of Korea 3,410 3,193 217 4,063 3,749 314 5,308 4,694 614 5,948 5,463 485 6,711 6,379 332 7,661 7,354 307 8,683 8,956 -273

4166 Afr. J. Bus. Manage. Table 3. Contd.
30. India 48 55 -7 54 67 -13 65 85 -20 90 126 -36 108 156 -48 129 191 -62 155 255 -100
31. Japan 3,269 2,645 624 3,697 3,001 696 4,417 3,549 868 4,645 4,021 624 5,086 4,535 551 5,557 4,854 703 6,158 5,972 186
32. Singapore 37,035 34,450 2,585 33,901 30,081 3,820 45,874 40,088 5,786 53,037 46,201 6,836 60,402 53,047 7,355 65,059 57,208 7,851 70,459 66,621 3,838
33. South Africa 632 622 10 778 881 -103 922 975 -53 1,089 1,314 -225 1,230 - 1,230 1,457 1,847 -390 1,749 - 1,749
34. Nigeria 125 62 63 160 88 72 237 108 129 321 116 205 338 165 173 451 260 191 - - -
35. Argentina 677 237 440 769 360 409 892 579 313 1,041 740 301 1,194 876 318 1,416 1,135 281 1,778 1,446 332
36. Brazil 346 284 62 410 284 126 518 356 162 635 416 219 738 513 225 849 669 180 1,015 935 80
37. Canada11 8,036 7,067 62 8,654 7,588 126 9,435 8,462 162 11,138 10,020 219 11,948 10,704 225 12,657 11,544 180 13,579 12,227 80
38. United States of America 2,384 4,131 -1,747 2,465 4,431 -1,966 2,745 5,116 -2,371 3,042 5,809 -2,767 3,471 6,417 -2,946 3,848 6,675 -2,827 4,273 7,113 -2,840
39. Mexico, U.S.11 1,557 1,634 -77 1,599 1,648 -49 1,767 1,844 -77 1,998 2,069 -71 2,312 2,365 -53 2,555 2,660 -105 2,710 2,884 -174
40. Australia 3,300 3,688 -388 3,626 4,515 -889 4,287 5,426 -1,139 5,250 6,214 -964 5,986 6,761 -775 6,720 7,874 -1,154 8,796 9,416 -620
41. New Zeeland 3,735 3,908 -173 4,259 4,791 -532 5,048 5,756 -708 5,392 6,510 -1,118 5,472 6,446 -974 6,416 7,354 -938 7,114 7,997 -883
Source: Statistical Yearbook 2009, National Institute of Statistics
Federation in 2007 and Germany in 2008. For the Republic of China trade balance surplus was an element of accumulation, which led, under a profitable export, to increase in the foreign reserves and therefore to the possibility of paying future imports.
Japan, after being distinguished by a steady positive balance on almost the entire period, its level, although positive, was very much diminished in 2008.
We cannot help noticing that there are countries for which foreign trade almost does not matter in comparison with other countries, for example India, which, although with a very small trade defi-cit in 2008 of only 100 million dollars, had exports of only 155 million dollars and imports of 255 million dollars.
We believe that finding the balance between export and import should be a constant concern of any national economy, each country aiming, in the fullest possible extent, to cover imports by a relatively equal level of exports.
Thus, the coverage rate of imports by exports,
determined as the ratio between the level of exports (expressed in FOB prices) and imports (expressed in CIF prices), indicates the balance position of a country's international trade. From this point of view, in 2008 we can notice the following countries in balance: Austria with a coverage rate of imports of 100.64, Belgium with 101.38 and Hungary with 101.02%, as a strong trade surplus was registered by Norway, 188.01%, the Russian Federation, 175.4% or Ireland 152.59%, and the largest trade deficit, of 32.42% is registered by Greece, followed by Romania with 58.94%, U.S. with a coverage deficit of 60.07%, Bulgaria, 60.44% and India with 60.54%. NATIONAL DISPARITIES REGARDING INTERNATIONAL TRADE Given the issues highlighted by the analysis of foreign trade development trends of the 41 partici-pating countries for which data were publicly available at the time of the study, trends that
revealed positive performance or, conversely, negative performance for some of them in terms of export, import and trade balance, with obvious differences, a hierarchy was intended to be achieved, on the one hand, between the countries under study, and on the other hand, to identify the changes that took place in this hierarchy in 2008 compared to 2002. THE METHOD AND DATABASE
In order to develop territorial hierarchies, the usual multicriteria methods have been used, involving the combination of a set of relevant statistical indicators, allowing a more complete characterization of each territorial unit. For a description of export, in addition to its annual level, its share in total exports (% FOB - Total) has been also used, plus the level of per capita exports (FOB/capita), as, for characterizing national imports, in addition to its level and its share in total world imports, the level of imports per capita for each country has been considered, and for the trade balance, its balance per capita has been used.
The multicriteria methods used are based on
aggregation of the indicators considered in a single synthetic indicator, previously providing their normalization, especially since the indicators are usually heterogeneous, being expressed in different measurement units (Baron and Biji (coord.), (2004)).
The method mostly used in this perspective is the actual rank method which takes into account the relative distances between the individual values of indicators.
The hierarchical process involves building a matrix X(mxn) of statistical indicators included in the analysis, noted I1, I2, ..., Im , corresponding to territorial units marked with U1, U2, ....,Un, matrix defined as follows:
(1) where: xij – the level of indicator j for the territorial unit i.
In this context, we mention that there are at least two variants of the method for setting the hierarchy, namely for building the rank matrix: ranking method and actual rank method.
In the case of rank method, the rank matrix involves assigning each individual value xij a partial rank rij, according to the order relation established: from rank 1 for the best performing unit, up to rank n, for the territorial unit which registers the lowest quality level. The method is easy to apply, but through the double leveling of variable size of differences between units, determined by their replacement with an arithmetic progression whose ratio is 1, the quality of information is impaired, and the different distances between successive units are systematically replaced with difference 1 between the successive ranks.
If we use the actual rank method, the actual partial ranks are first established for each territorial unit i and for each indicator j, depending on the situation, as follows: a. If the indicator reflects a situation more performing as its values are higher, the actual partial rank is calculated by the formula:
1minmax
min
n
xx
xxnr
jj
jij
ij
(2) where: xij = the level of indicator j for the territorial unit i;
= the level of indicator j for the territorial unit with minimum performance;
= the level of indicator j for the territorial unit with maximum performance; n = total number of territorial units analyzed; m = number of indicators included in the analysis; b. If the indicator reflects a situation more performing as its values are lower, the actual partial rank is calculated by the formula:
1minmax
max
n
xx
xxnr
jj
ijj
ij
(3)
Based on the actual partial ranks the actual average ranks are determined for each territorial unit i, as the arithmetic mean, as follows:
Popa and Babucea 4167
m
r
r
m
j
ij
i
1
(4) Thus, the actual final rank of each territorial unit shall be determined from the territorial unit with the lowest average rank, which indicates the maximum performance, namely 1st place, to the territorial unit with the highest average rank, which indicates the minimum performance, respectively the last place, n. RESULTS The comparative analysis of the graphical represen-tations of absolute indicators of disparities between the best performing level and the levels of the other countries relative to 2002 and 2008 from the Figures 10 to 12, and their calculated values in Table 4, confirm what could be found intuitively in the first part of the study.
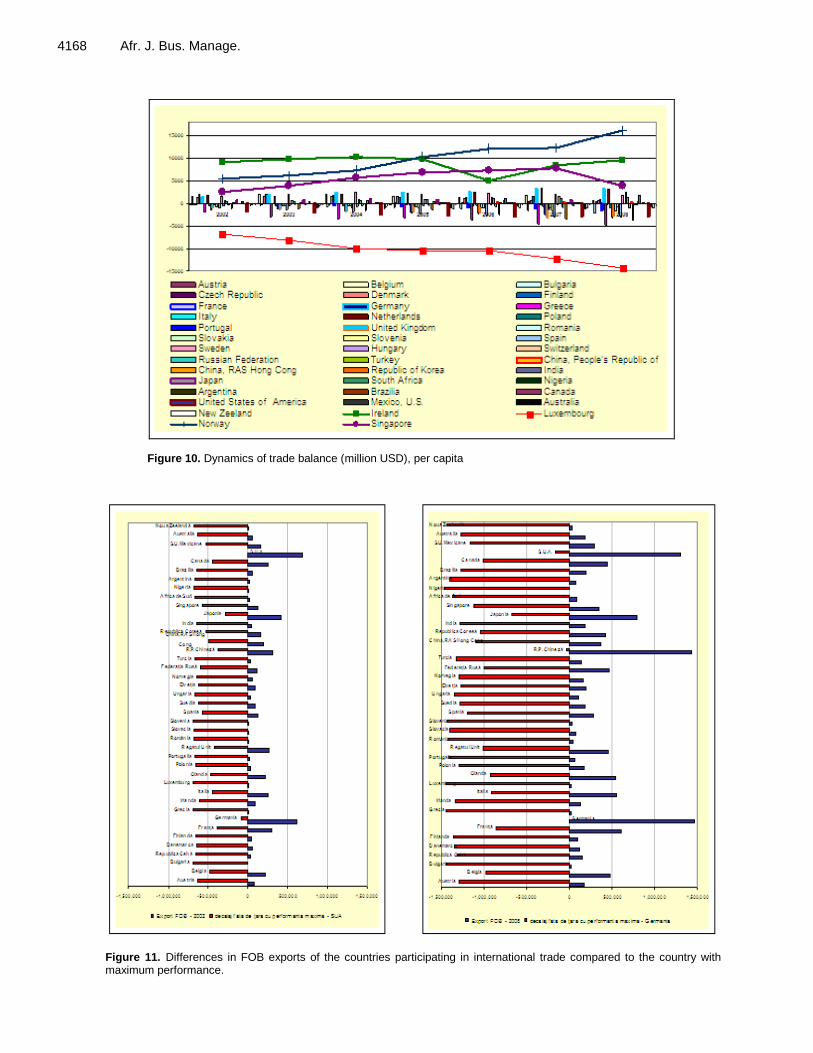
Thus, in 2002 the best performing country in terms of absolute volume of FOB exports was the U.S., with remarkable differences between the same and the other states. It may be noted that more than 60% of the analyzed countries registered in 2002 less than 1% of the value volume of exports made by U.S.; this category also included Romania, even in a slacker position, with a level of FOB export of only 0.2% of the U.S. exports. Moreover, remarkable levels were registered only by Germany, 88% compared to the U.S. exports, Japan, 60%, the Republic of China 47%, France 45% or United Kingdom 40% (Table 4).
In 2008, the best performing country in terms of FOB exports is Germany which, given that the U.S. experien-ced a relative increase compared to 2002 by almost 90%, it managed to outrun it; the FOB export of the U.S. represented in 2008, 89 % of the German exports. Almost a similar performance was experienced by the Republic of China whose export compared to that of Germany was of 98%. Japan, France and the United Kingdom, while remaining in the first echelon, are losing ground in terms of the relative distance compared to the best performing exporting country. Due to the increase in FOB exports for all the countries, we can say that the countries with insignificant export, less than 1% compared to Germany, fell to approx. 41%.
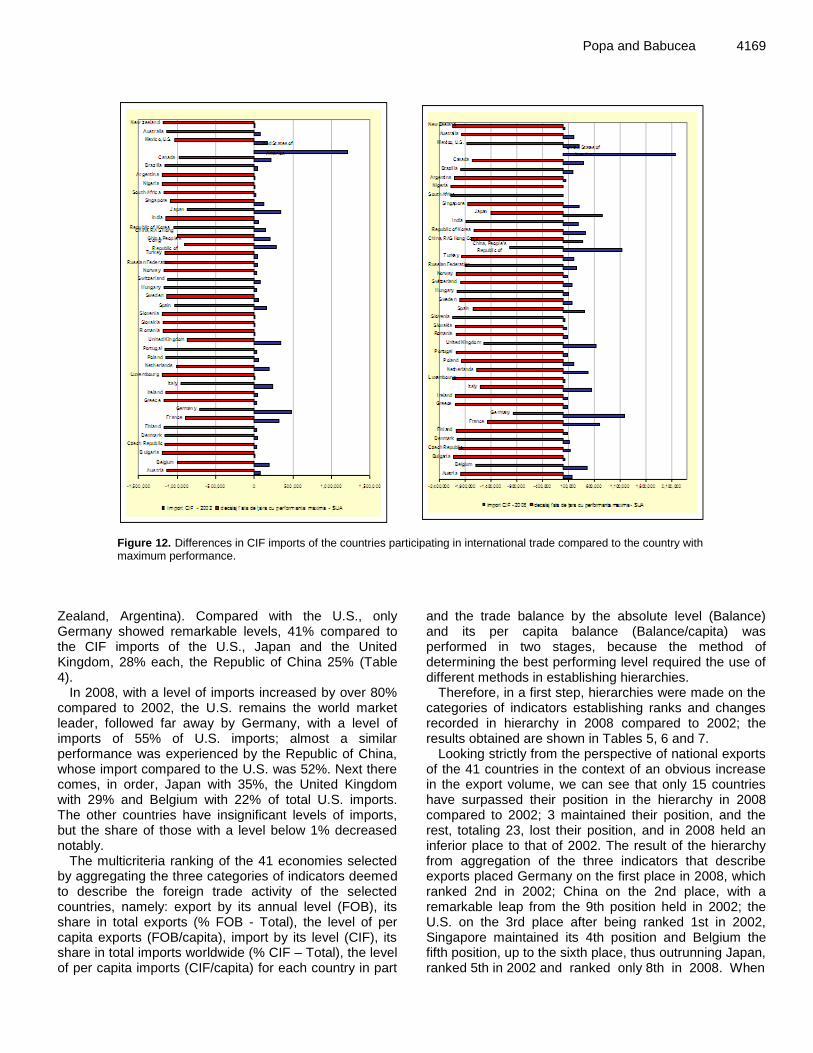
If we perform the analysis in terms of the absolute volume of CIF imports, we can note again that the best performing country was the U.S., with major differences between it and the other countries participating in the study. We can notice that in 2002, more than 65% of the analyzed countries imported less than 1% of the value volume of the U.S. imports. Again, the above-mentioned category also included Romania, even in a slacker position, with a level of CIF imports of only 0.1% of the U.S. imports, actually, just like other seven countries (Bulgaria, Slovakia, Slovenia, Luxembourg, Nigeria, New
4168 Afr. J. Bus. Manage.
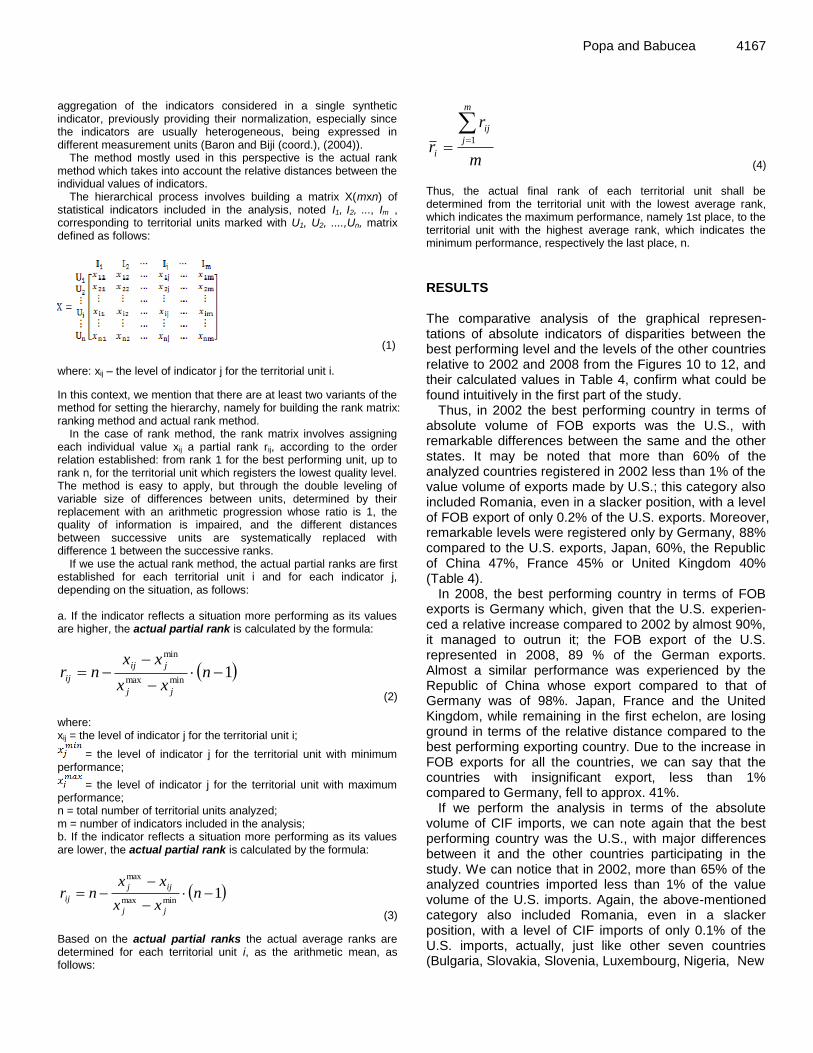
Figure 10. Dynamics of trade balance (million USD), per capita
Figure 11. Differences in FOB exports of the countries participating in international trade compared to the country with maximum performance.
Popa and Babucea 4169
Figure 12. Differences in CIF imports of the countries participating in international trade compared to the country with maximum performance.
Zealand, Argentina). Compared with the U.S., only Germany showed remarkable levels, 41% compared to the CIF imports of the U.S., Japan and the United Kingdom, 28% each, the Republic of China 25% (Table 4).
In 2008, with a level of imports increased by over 80% compared to 2002, the U.S. remains the world market leader, followed far away by Germany, with a level of imports of 55% of U.S. imports; almost a similar performance was experienced by the Republic of China, whose import compared to the U.S. was 52%. Next there comes, in order, Japan with 35%, the United Kingdom with 29% and Belgium with 22% of total U.S. imports. The other countries have insignificant levels of imports, but the share of those with a level below 1% decreased notably.
The multicriteria ranking of the 41 economies selected by aggregating the three categories of indicators deemed to describe the foreign trade activity of the selected countries, namely: export by its annual level (FOB), its share in total exports (% FOB - Total), the level of per capita exports (FOB/capita), import by its level (CIF), its share in total imports worldwide (% CIF – Total), the level of per capita imports (CIF/capita) for each country in part
and the trade balance by the absolute level (Balance) and its per capita balance (Balance/capita) was performed in two stages, because the method of determining the best performing level required the use of different methods in establishing hierarchies.
Therefore, in a first step, hierarchies were made on the categories of indicators establishing ranks and changes recorded in hierarchy in 2008 compared to 2002; the results obtained are shown in Tables 5, 6 and 7.
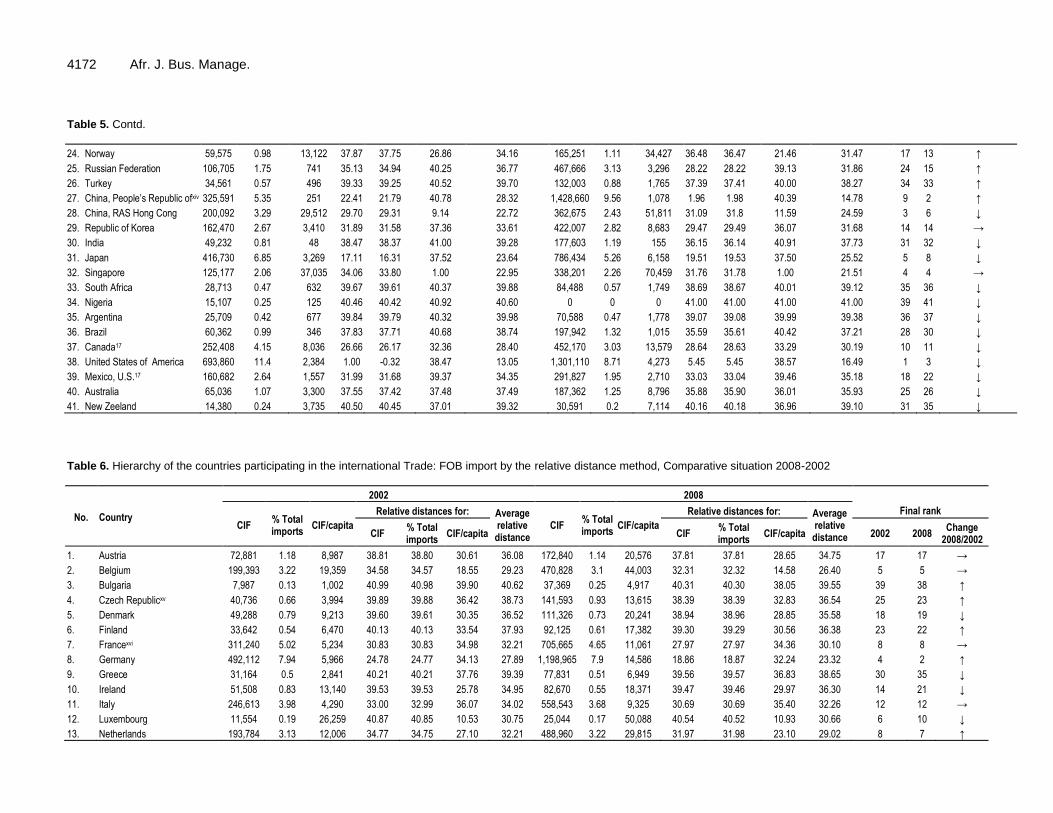
Looking strictly from the perspective of national exports of the 41 countries in the context of an obvious increase in the export volume, we can see that only 15 countries have surpassed their position in the hierarchy in 2008 compared to 2002; 3 maintained their position, and the rest, totaling 23, lost their position, and in 2008 held an inferior place to that of 2002. The result of the hierarchy from aggregation of the three indicators that describe exports placed Germany on the first place in 2008, which ranked 2nd in 2002; China on the 2nd place, with a remarkable leap from the 9th position held in 2002; the U.S. on the 3rd place after being ranked 1st in 2002, Singapore maintained its 4th position and Belgium the fifth position, up to the sixth place, thus outrunning Japan, ranked 5th in 2002 and ranked only 8th in 2008. When
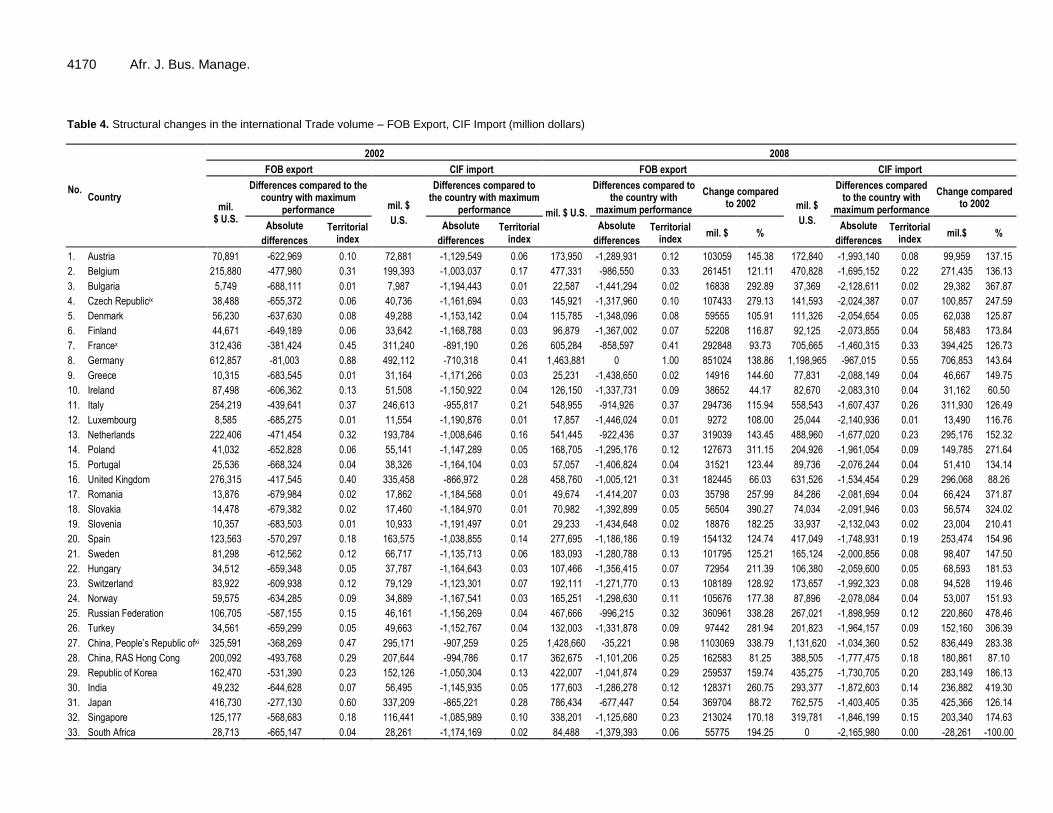
4170 Afr. J. Bus. Manage. Table 4. Structural changes in the international Trade volume – FOB Export, CIF Import (million dollars)
No.
Country
2002 2008
FOB export CIF import FOB export CIF import
mil. $ U.S.
Differences compared to the country with maximum
performance mil. $
U.S.
Differences compared to the country with maximum
performance mil. $ U.S.
Differences compared to the country with
maximum performance
Change compared to 2002 mil. $
U.S.
Differences compared to the country with
maximum performance
Change compared to 2002
Absolute
differences
Territorial index
Absolute
differences
Territorial index
Absolute
differences
Territorial index
mil. $ % Absolute
differences
Territorial index
mil.$ %
1. Austria 70,891 -622,969 0.10 72,881 -1,129,549 0.06 173,950 -1,289,931 0.12 103059 145.38 172,840 -1,993,140 0.08 99,959 137.15
2. Belgium 215,880 -477,980 0.31 199,393 -1,003,037 0.17 477,331 -986,550 0.33 261451 121.11 470,828 -1,695,152 0.22 271,435 136.13
3. Bulgaria 5,749 -688,111 0.01 7,987 -1,194,443 0.01 22,587 -1,441,294 0.02 16838 292.89 37,369 -2,128,611 0.02 29,382 367.87
4. Czech Republicix 38,488 -655,372 0.06 40,736 -1,161,694 0.03 145,921 -1,317,960 0.10 107433 279.13 141,593 -2,024,387 0.07 100,857 247.59
5. Denmark 56,230 -637,630 0.08 49,288 -1,153,142 0.04 115,785 -1,348,096 0.08 59555 105.91 111,326 -2,054,654 0.05 62,038 125.87
6. Finland 44,671 -649,189 0.06 33,642 -1,168,788 0.03 96,879 -1,367,002 0.07 52208 116.87 92,125 -2,073,855 0.04 58,483 173.84
7. Francex 312,436 -381,424 0.45 311,240 -891,190 0.26 605,284 -858,597 0.41 292848 93.73 705,665 -1,460,315 0.33 394,425 126.73
8. Germany 612,857 -81,003 0.88 492,112 -710,318 0.41 1,463,881 0 1.00 851024 138.86 1,198,965 -967,015 0.55 706,853 143.64
9. Greece 10,315 -683,545 0.01 31,164 -1,171,266 0.03 25,231 -1,438,650 0.02 14916 144.60 77,831 -2,088,149 0.04 46,667 149.75
10. Ireland 87,498 -606,362 0.13 51,508 -1,150,922 0.04 126,150 -1,337,731 0.09 38652 44.17 82,670 -2,083,310 0.04 31,162 60.50
11. Italy 254,219 -439,641 0.37 246,613 -955,817 0.21 548,955 -914,926 0.37 294736 115.94 558,543 -1,607,437 0.26 311,930 126.49
12. Luxembourg 8,585 -685,275 0.01 11,554 -1,190,876 0.01 17,857 -1,446,024 0.01 9272 108.00 25,044 -2,140,936 0.01 13,490 116.76
13. Netherlands 222,406 -471,454 0.32 193,784 -1,008,646 0.16 541,445 -922,436 0.37 319039 143.45 488,960 -1,677,020 0.23 295,176 152.32
14. Poland 41,032 -652,828 0.06 55,141 -1,147,289 0.05 168,705 -1,295,176 0.12 127673 311.15 204,926 -1,961,054 0.09 149,785 271.64
15. Portugal 25,536 -668,324 0.04 38,326 -1,164,104 0.03 57,057 -1,406,824 0.04 31521 123.44 89,736 -2,076,244 0.04 51,410 134.14
16. United Kingdom 276,315 -417,545 0.40 335,458 -866,972 0.28 458,760 -1,005,121 0.31 182445 66.03 631,526 -1,534,454 0.29 296,068 88.26
17. Romania 13,876 -679,984 0.02 17,862 -1,184,568 0.01 49,674 -1,414,207 0.03 35798 257.99 84,286 -2,081,694 0.04 66,424 371.87
18. Slovakia 14,478 -679,382 0.02 17,460 -1,184,970 0.01 70,982 -1,392,899 0.05 56504 390.27 74,034 -2,091,946 0.03 56,574 324.02
19. Slovenia 10,357 -683,503 0.01 10,933 -1,191,497 0.01 29,233 -1,434,648 0.02 18876 182.25 33,937 -2,132,043 0.02 23,004 210.41
20. Spain 123,563 -570,297 0.18 163,575 -1,038,855 0.14 277,695 -1,186,186 0.19 154132 124.74 417,049 -1,748,931 0.19 253,474 154.96
21. Sweden 81,298 -612,562 0.12 66,717 -1,135,713 0.06 183,093 -1,280,788 0.13 101795 125.21 165,124 -2,000,856 0.08 98,407 147.50
22. Hungary 34,512 -659,348 0.05 37,787 -1,164,643 0.03 107,466 -1,356,415 0.07 72954 211.39 106,380 -2,059,600 0.05 68,593 181.53
23. Switzerland 83,922 -609,938 0.12 79,129 -1,123,301 0.07 192,111 -1,271,770 0.13 108189 128.92 173,657 -1,992,323 0.08 94,528 119.46
24. Norway 59,575 -634,285 0.09 34,889 -1,167,541 0.03 165,251 -1,298,630 0.11 105676 177.38 87,896 -2,078,084 0.04 53,007 151.93
25. Russian Federation 106,705 -587,155 0.15 46,161 -1,156,269 0.04 467,666 -996,215 0.32 360961 338.28 267,021 -1,898,959 0.12 220,860 478.46
26. Turkey 34,561 -659,299 0.05 49,663 -1,152,767 0.04 132,003 -1,331,878 0.09 97442 281.94 201,823 -1,964,157 0.09 152,160 306.39
27. China, People’s Republic ofxi 325,591 -368,269 0.47 295,171 -907,259 0.25 1,428,660 -35,221 0.98 1103069 338.79 1,131,620 -1,034,360 0.52 836,449 283.38
28. China, RAS Hong Cong 200,092 -493,768 0.29 207,644 -994,786 0.17 362,675 -1,101,206 0.25 162583 81.25 388,505 -1,777,475 0.18 180,861 87.10
29. Republic of Korea 162,470 -531,390 0.23 152,126 -1,050,304 0.13 422,007 -1,041,874 0.29 259537 159.74 435,275 -1,730,705 0.20 283,149 186.13
30. India 49,232 -644,628 0.07 56,495 -1,145,935 0.05 177,603 -1,286,278 0.12 128371 260.75 293,377 -1,872,603 0.14 236,882 419.30
31. Japan 416,730 -277,130 0.60 337,209 -865,221 0.28 786,434 -677,447 0.54 369704 88.72 762,575 -1,403,405 0.35 425,366 126.14
32. Singapore 125,177 -568,683 0.18 116,441 -1,085,989 0.10 338,201 -1,125,680 0.23 213024 170.18 319,781 -1,846,199 0.15 203,340 174.63
33. South Africa 28,713 -665,147 0.04 28,261 -1,174,169 0.02 84,488 -1,379,393 0.06 55775 194.25 0 -2,165,980 0.00 -28,261 -100.00

Popa and Babucea 4171 Table 4. Contd.
34. Nigeria 15,107 -678,753 0.02 7,547 -1,194,883 0.01 0 -1,463,881 0.00 -15107 -100.00 0 -2,165,980 0.00 -7,547 -100.00
35. Argentina 25,709 -668,151 0.04 8,990 -1,193,440 0.01 70,588 -1,393,293 0.05 44879 174.57 57,413 -2,108,567 0.03 48,423 538.63
36. Brazil 60,362 -633,498 0.09 49,603 -1,152,827 0.04 197,942 -1,265,939 0.14 137580 227.92 182,408 -1,983,572 0.08 132,805 267.74
37. Canada14 252,408 -441,452 0.36 221,961 -980,469 0.18 452.,70 -1,011,711 0.31 199762 79.14 407,169 -1,758,811 0.19 185,208 83.44
38. United States of America 693,860 0 1.00 1,202,430 0 1.00 1,301,110 -162,771 0.89 607250 87.52 2,165,980 0 1.00 963,550 80.13
39. Mexico, U.S.14 160,682 -533,178 0.23 168,679 -1,033,751 0.14 291,827 -1,172,054 0.20 131145 81.62 310,561 -1,855,419 0.14 141,882 84.11
40. Australia 65,036 -628,824 0.09 72,693 -1,129,737 0.06 187,362 -1,276,519 0.13 122326 188.09 200,563 -1,965,417 0.09 127,870 175.90
41. New Zeeland 14,380 -679,480 0.02 15,047 -1,187,383 0.01 30,591 -1,433,290 0.02 16211 112.73 34,385 -2,131,595 0.02 19,338 128.52
Table 5. Hierarchy of selected countries participating in the international Trade: FOB export by the relative distance method, Comparative situation
No. Country
2002 2008
Final rank
FOB % Total exports
FOB/capita
Relative distances for: Average relative
distance FOB
%
Total exports
FOB/capita
Relative distances for: Average relative
distance FOB % Total exports
FOB/capita FOB % Total exports
FOB/capita 2002 2008 Change
2008/2002
1. Austria 70,891 1.16 8,741 37.21 37.09 31.60 35.30 173,950 1.16 20,708 36.25 41.00 29.24 35.50 21 22 ↓
2. Belgium 215,880 3.55 20,959 28.79 28.36 18.39 25.18 477,331 3.19 44,610 27.96 27.98 15.67 23.87 6 5 ↑
3. Bulgaria 5,749 0.09 721 41.00 41.00 40.27 40.76 22,587 0.15 2,972 40.38 40.39 39.31 40.03 40 39 ↑
4. Czech Republicxii 38,488 0.63 3,773 39.10 39.03 36.97 38.37 145,921 0.98 14,031 37.01 37.00 33.03 35.68 26 24 ↑
5. Denmark 56,230 0.92 10,510 38.07 37.97 29.69 35.24 115,785 0.77 21,052 37.84 37.86 29.05 34.91 20 21 ↓
6. Finland 44,671 0.73 8,591 38.74 38.66 31.76 36.39 96,879 0.65 18,279 38.35 38.35 30.62 35.77 23 25 ↓
7. Francexiii 312,436 5.13 5,254 23.17 22.59 35.37 27.04 605,284 4.05 9,487 24.46 24.47 35.61 28.18 7 9 ↓
8. Germany 612,857 10.07 7,429 5.71 4.54 33.02 14.42 1,463,881 9.8 17,809 1.00 1.00 30.89 10.96 2 1 ↑
9. Greece 10,315 0.17 940 40.73 40.71 40.04 40.49 25,231 0.17 2,253 40.31 40.31 39.72 40.11 38 40 ↑
10. Ireland 87,498 1.44 22,321 36.25 36.07 16.91 29.74 126,150 0.84 28,033 37.55 37.57 25.09 33.40 13 17 ↓
11. Italy 254,219 4.18 4,423 26.56 26.06 36.27 29.63 548,955 3.67 9,165 26.00 26.02 35.80 29.27 12 10 ↑
12. Luxembourg 8,585 0.14 19,511 40.84 40.82 19.95 33.87 17,857 0.12 35,714 40.51 40.51 20.72 33.92 16 19 ↓
13. Netherlands 222,406 3.65 13,780 28.41 28.00 26.15 27.52 541,445 3.62 33,015 26.21 26.22 22.26 24.90 8 7 ↑
14. Poland 41,032 0.67 1,062 38.95 38.88 39.90 39.24 168,705 1.13 4,428 36.39 36.39 38.49 37.09 30 28 ↑
15. Portugal 25,536 0.42 2,541 39.85 39.79 38.30 39.32 57,057 0.38 5,383 39.44 39.45 37.94 38.94 32 34 ↓
16. United Kingdom 276,315 4.54 4,678 25.27 24.74 35.99 28.67 458,760 3.07 7,484 28.46 28.47 36.75 31.23 11 12 ↓
17. Romania 13,876 0.23 637 40.53 40.49 40.36 40.46 49,674 0.33 2,310 39.64 39.65 39.69 39.66 37 38 ↓
18. Slovakia 14,478 0.24 2,691 40.49 40.45 38.14 39.70 70,982 0.48 13,145 39.06 39.04 33.54 37.21 33 29 ↑
19. Slovenia 10,357 0.17 5,205 40.73 40.71 35.42 38.95 29,233 0.2 14,617 40.20 40.18 32.70 37.70 29 31 ↓
20. Spain 123,563 2.03 3,015 34.15 33.91 37.79 35.29 277,695 1.86 5,972 33.41 33.41 37.61 34.81 22 20 ↑
21. Sweden 81,298 1.34 9,155 36.61 36.43 31.15 34.73 183,093 1.23 19,901 36.00 35.98 29.70 33.89 19 18 ↑
22. Hungary 34,512 0.57 3,397 39.33 39.25 37.38 38.65 107,466 0.72 10,747 38.06 38.06 34.90 37.01 27 27 →
23. Switzerland 83,922 1.38 11,512 36.46 36.29 28.60 33.78 192,111 1.29 25,278 35.75 35.73 26.65 32.71 15 16 ↓
4172 Afr. J. Bus. Manage. Table 5. Contd.
24. Norway 59,575 0.98 13,122 37.87 37.75 26.86 34.16 165,251 1.11 34,427 36.48 36.47 21.46 31.47 17 13 ↑
25. Russian Federation 106,705 1.75 741 35.13 34.94 40.25 36.77 467,666 3.13 3,296 28.22 28.22 39.13 31.86 24 15 ↑
26. Turkey 34,561 0.57 496 39.33 39.25 40.52 39.70 132,003 0.88 1,765 37.39 37.41 40.00 38.27 34 33 ↑
27. China, People’s Republic ofxiv 325,591 5.35 251 22.41 21.79 40.78 28.32 1,428,660 9.56 1,078 1.96 1.98 40.39 14.78 9 2 ↑
28. China, RAS Hong Cong 200,092 3.29 29,512 29.70 29.31 9.14 22.72 362,675 2.43 51,811 31.09 31.8 11.59 24.59 3 6 ↓
29. Republic of Korea 162,470 2.67 3,410 31.89 31.58 37.36 33.61 422,007 2.82 8,683 29.47 29.49 36.07 31.68 14 14 →
30. India 49,232 0.81 48 38.47 38.37 41.00 39.28 177,603 1.19 155 36.15 36.14 40.91 37.73 31 32 ↓
31. Japan 416,730 6.85 3,269 17.11 16.31 37.52 23.64 786,434 5.26 6,158 19.51 19.53 37.50 25.52 5 8 ↓
32. Singapore 125,177 2.06 37,035 34.06 33.80 1.00 22.95 338,201 2.26 70,459 31.76 31.78 1.00 21.51 4 4 →
33. South Africa 28,713 0.47 632 39.67 39.61 40.37 39.88 84,488 0.57 1,749 38.69 38.67 40.01 39.12 35 36 ↓
34. Nigeria 15,107 0.25 125 40.46 40.42 40.92 40.60 0 0 0 41.00 41.00 41.00 41.00 39 41 ↓
35. Argentina 25,709 0.42 677 39.84 39.79 40.32 39.98 70,588 0.47 1,778 39.07 39.08 39.99 39.38 36 37 ↓
36. Brazil 60,362 0.99 346 37.83 37.71 40.68 38.74 197,942 1.32 1,015 35.59 35.61 40.42 37.21 28 30 ↓
37. Canada17 252,408 4.15 8,036 26.66 26.17 32.36 28.40 452,170 3.03 13,579 28.64 28.63 33.29 30.19 10 11 ↓
38. United States of America 693,860 11.4 2,384 1.00 -0.32 38.47 13.05 1,301,110 8.71 4,273 5.45 5.45 38.57 16.49 1 3 ↓
39. Mexico, U.S.17 160,682 2.64 1,557 31.99 31.68 39.37 34.35 291,827 1.95 2,710 33.03 33.04 39.46 35.18 18 22 ↓
40. Australia 65,036 1.07 3,300 37.55 37.42 37.48 37.49 187,362 1.25 8,796 35.88 35.90 36.01 35.93 25 26 ↓
41. New Zeeland 14,380 0.24 3,735 40.50 40.45 37.01 39.32 30,591 0.2 7,114 40.16 40.18 36.96 39.10 31 35 ↓
Table 6. Hierarchy of the countries participating in the international Trade: FOB import by the relative distance method, Comparative situation 2008-2002
No. Country
2002 2008
Final rank
CIF % Total imports
CIF/capita
Relative distances for: Average relative distance
CIF % Total imports
CIF/capita
Relative distances for: Average relative distance CIF
% Total imports
CIF/capita CIF % Total imports
CIF/capita 2002 2008 Change
2008/2002
1. Austria 72,881 1.18 8,987 38.81 38.80 30.61 36.08 172,840 1.14 20,576 37.81 37.81 28.65 34.75 17 17 →
2. Belgium 199,393 3.22 19,359 34.58 34.57 18.55 29.23 470,828 3.1 44,003 32.31 32.32 14.58 26.40 5 5 →
3. Bulgaria 7,987 0.13 1,002 40.99 40.98 39.90 40.62 37,369 0.25 4,917 40.31 40.30 38.05 39.55 39 38 ↑
4. Czech Republicxv 40,736 0.66 3,994 39.89 39.88 36.42 38.73 141,593 0.93 13,615 38.39 38.39 32.83 36.54 25 23 ↑
5. Denmark 49,288 0.79 9,213 39.60 39.61 30.35 36.52 111,326 0.73 20,241 38.94 38.96 28.85 35.58 18 19 ↓
6. Finland 33,642 0.54 6,470 40.13 40.13 33.54 37.93 92,125 0.61 17,382 39.30 39.29 30.56 36.38 23 22 ↑
7. Francexvi 311,240 5.02 5,234 30.83 30.83 34.98 32.21 705,665 4.65 11,061 27.97 27.97 34.36 30.10 8 8 →
8. Germany 492,112 7.94 5,966 24.78 24.77 34.13 27.89 1,198,965 7.9 14,586 18.86 18.87 32.24 23.32 4 2 ↑
9. Greece 31,164 0.5 2,841 40.21 40.21 37.76 39.39 77,831 0.51 6,949 39.56 39.57 36.83 38.65 30 35 ↓
10. Ireland 51,508 0.83 13,140 39.53 39.53 25.78 34.95 82,670 0.55 18,371 39.47 39.46 29.97 36.30 14 21 ↓
11. Italy 246,613 3.98 4,290 33.00 32.99 36.07 34.02 558,543 3.68 9,325 30.69 30.69 35.40 32.26 12 12 →
12. Luxembourg 11,554 0.19 26,259 40.87 40.85 10.53 30.75 25,044 0.17 50,088 40.54 40.52 10.93 30.66 6 10 ↓
13. Netherlands 193,784 3.13 12,006 34.77 34.75 27.10 32.21 488,960 3.22 29,815 31.97 31.98 23.10 29.02 8 7 ↑

Popa and Babucea 4173 Table 6. Contd.
14. Poland 55,141 0.89 1,428 39.41 39.40 39.40 39.40 204,926 1.35 5,379 37.22 37.22 37.77 37.40 31 30 ↑
15. Portugal 38,326 0.62 3,814 39.97 39.96 36.63 38.85 89,736 0.59 8,466 39.34 39.35 35.92 38.20 27 33 ↓
16. United Kingdom 335,458 5.41 5,679 30.02 30.02 34.46 31.50 631,526 4.16 10,302 29.34 29.35 34.81 31.17 7 11 ↓
17. Romania 17,862 0.29 820 40.65 40.65 40.11 40.47 84,286 0.56 3,919 39.44 39.43 38.65 39.17 38 37 ↑
18. Slovakia 17,460 0.28 3,245 40.67 40.67 37.29 39.54 74,034 0.49 13,710 39.63 39.63 32.77 37.34 32 27 ↑
19. Slovenia 10,933 0.18 5,494 40.89 40.88 34.67 38.81 33,937 0.22 16,969 40.37 40.38 30.81 37.19 26 26 →
20. Spain 163,575 2.64 3,992 35.78 35.77 36.42 35.99 417,049 2.75 8,969 33.30 33.30 35.61 34.07 16 15 ↑
21. Sweden 66,717 1.08 7,513 39.02 39.01 32.33 36.78 165,124 1.09 17,948 37.95 37.95 30.22 35.37 20 18 ↑
22. Hungary 37,787 0.61 3,719 39.99 39.98 36.74 38.90 106,380 0.7 10,638 39.04 39.04 34.61 37.56 28 31 ↓
23. Switzerland 79,129 1.28 10,854 38.60 38.59 28.44 35.21 173,657 1.14 22,850 37.79 37.81 27.28 34.29 15 16 ↓
24. Norway 34,889 0.56 7,685 40.08 40.09 32.13 37.43 87,896 0.58 18,312 39.38 39.38 30.01 36.25 22 20 ↑
25. Russian Federation 46,161 0.74 320 39.71 39.71 40.69 40.04 267,021 1.76 1,882 36.07 36.07 39.87 37.34 36 27 ↑
26. Turkey 49,663 0.8 713 39.59 39.59 40.23 39.80 201,823 1.33 2,698 37.27 37.27 39.38 37.98 33 32 ↑
27. China, People’s Republic ofxvii 295,171 4.76 228 31.37 31.37 40.80 34.51 1,131,620 7.46 854 20.10 20.10 40.49 26.90 13 6 ↑
28. China, RAS Hong Cong 207,644 3.35 30,626 34.30 34.30 5.45 24.68 388,505 2.56 55,501 33.83 33.83 7.68 25.11 2 4 ↓
29. Republic of Korea 152,126 2.45 3,193 36.16 36.16 37.35 36.56 435,275 2.87 8,956 32.96 32.96 35.62 33.85 19 14 ↑
30. India 56,495 0.91 55 39.36 39.36 41.00 39.91 293,377 1.93 255 35.58 35.59 40.85 37.34 34 28 ↑
31. Japan 337,209 5.44 2,645 29.96 29.96 37.99 32.64 762,575 5.03 5,972 26.92 26.91 37.41 30.41 10 9 ↑
32. Singapore 116,441 1.88 34,450 37.35 37.35 1.00 25.23 319,781 2.11 66,621 35.09 35.09 1.00 23.73 3 3 →
33. South Africa 28,261 0.46 622 40.31 40.29 40.34 40.31 0 0 0 41.00 41.00 41.00 41.00 37 40 ↓
34. Nigeria 7,547 0.12 62 41.00 41.00 40.99 41.00 0 0 0 41.00 41.00 41.00 41.00 41 41 →
35. Argentina 8,990 0.14 237 40.95 40.96 40.79 40.90 57,413 0.38 1,446 39.94 39.94 40.13 40.00 40 39 ↑
36. Brazil 49,603 0.8 284 39.59 39.59 40.73 39.97 182,408 1.2 935 37.63 37.64 40.44 38.57 35 34 ↑
37. Canada20 221,961 3.58 7,067 33.82 33.82 32.85 33.50 407,169 2.68 12,227 33.48 33.49 33.66 33.54 11 13 ↓
38. United States of America 1,202,430 19.39 4,131 1.00 1.00 36.26 12.75 2,165,980 14.28 7,113 1.00 1.00 36.73 12.91 1 1 →
39. Mexico, U.S.20 168,679 2.72 1,634 35.61 35.60 39.16 36.79 310,561 2.05 2,884 35.26 35.26 39.27 36.60 21 24 ↓
40. Australia 72,693 1.17 3,688 38.82 38.82 36.77 38.14 200,563 1.32 9,416 37.30 37.30 35.35 36.65 24 25 ↓
41. New Zeeland 15,047 0.24 3,908 40.75 40.75 36.52 39.34 34,385 0.23 7,997 40.36 40.36 36.20 38.97 29 36 ↓
referring to Nigeria, Bulgaria, Greece and Romania, we see that they hold the last places in the hierarchy (Table 5).
Aggregating the three indicators that describe imports we can see that their evolution has also produced changes in the hierarchy. Thus, 19 countries have surpassed the position held in 2002, eight countries have maintained the same
position, and the rest were reduced to a lower rank. From this perspective, the U.S. holds the first position in both 2002 and 2008, Germany reaches the 2nd position in 2008, while in 2002 it was ranked 4th, Singapore remains on the same third position, China falls from the second position to the 4th position in 2008 and Belgium maintains its 5th position (Table 6).
Analyzing the results of multicriteria ranking by the two indicators of trade balance, it appears that 17 countries increased their trade balance and went up on higher positions than those held in 2002; four countries maintained the same position, and the remaining 20 deepened the gap between exports and imports, being reduced to lower ranks (Table 7).

4174 Afr. J. Bus. Manage. Table 7. Hierarchy of the countries participating in the international Trade: Trade balance by the rank method, Comparative situation 2008-2002
No. Country
2002 2008 Final rank
Balance Balance /capita Ranks for:
Score 2008/2002
Balance Balance /capita
Ranks for: Score
Balance Balance /capita Balance Balance /capita 2002 2008 Change 08/02
1. Austria -1,990 -246 24.0 28.0 52.0 1,110 132 19 17.0 36.0 23.5 19.0 ↑
2. Belgium 16,487 1,600 10.0 7.0 17.0 6,503 607 15 12.0 27.0 8.5 14.,0 ↓
3. Bulgaria -2,238 -281 25.0 29.0 54.0 -14,782 -1,945 29 33.0 62.0 27.0 30.0 ↓
4. Czech Republicxviii
-2,248 -221 26.0 27.0 53.0 4,328 416 18 13.0 31.0 25.5 17.0 ↑
5. Denmark 6,942 1,297 18.0 9.0 27.0 4,459 811 17 11.0 28.0 14.0 15.0 ↓
6. Finland 11,029 2,121 12.0 4.0 16.0 4,754 897 16 10.0 26.0 6.5 12.0 ↓
7. Francexix
1,196 20 20.0 20.0 40.0 -100,381 -1,574 37 31.0 68.0 20.0 35.0 ↓
8. Germany 120,745 1,463 1.0 8.0 9.0 264,916 3,223 2 4.0 6.0 2.0 1.5 ↑
9. Greece -20,849 -1,901 38.0 40.0 78.0 -52,600 -4,696 35.0 40.0 75.0 40.0 38.5 ↑
10. Ireland 35,990 9,181 4.0 1.0 5.0 43,480 9,662 8.0 2.0 10.0 1.0 3.0 ↓
11. Italy 7,606 133 16.0 15.0 31.0 -9,588 -160 26.0 23.0 49.0 18.0 23.0 ↓
12. Luxembourg -2,969 -6,748 27.0 41.0 68.0 -7,187 -14,374 25.0 41.0 66.0 34.5 34.0 →
13. Netherlands 28,622 1,774 7.0 5.0 12.0 52,485 3,200 6.0 5.0 11.0 4.0 4.0 →
14. Poland
-14,109 -366 36.0 32.0 68.0 -36,221 -951 34.0 30.0 64.0 34.5 31.0 ↑
15. Portugal -12,790 -1,273 35.0 38.0 73.0 -32,679 -3,083 32.0 38.0 70.0 37.0 36.5 ↑
16. United Kingdom -59,143 -1,001 40.0 36.0 76.0 -172,766 -2,818 40.0 35.0 75.0 39.0 38.5 ↑
17. Romania
-3,986 -183 30.0 25.0 55.0 -34,612 -1,609 33.0 32.0 65.0 28.0 32.5 ↓
18. Slovakia
-2,982 -554 28.0 34.0 62.0 -3,052 -565 22.0 26.0 48.0 31.0 22.0 ↑
19. Slovenia
-576 -289 22.0 30.0 52.0 -4,704 -2,352 24.0 34.0 58.0 23.5 28.0 ↓
20. Spain -40,012 -977 39.0 35.0 74.0 -139,354 -2,997 39.0 37.0 76.0 38.0 40.0 ↓
21. Sweden 14,581 1,642 11.0 6.0 17.0 17,969 1,953 12.0 7.0 19.0 8.5 10.0 ↓
22. Hungary
-3,275 -322 29.0 31.0 60.0 1,086 109 20.0 18.0 38.0 30.0 20.0 ↑
23. Switzerland 4,793 658 19.0 10.0 29.0 18,454 2,428 10.0 6.0 16.0 16.0 8.5 ↑
24. Norway 24,686 5,437 8.0 2.0 10.0 77,355 16,115 5.0 1.0 6.0 3.0 1.5 ↑
25. Russian Federation 60,544 421 3.0 13.0 16.0 200,645 1414 3.0 9.0 12.0 6.5 5.5 ↑
26. Turkey -15,102 -217 37.0 26.0 63.0 -69,820 -933 36.0 29.0 65.0 32.0 32.0 →
27. China, People’s Republic of
xx 30,420 23 6.0 19.0 25.0 297,040 224 1.0 15.0 16.0 13.0 8.5
↑
28. China, RAS Hong Cong -7,552 -1,114
32.0 37.0 69.0 -25,830 -3,690 31.0 39.0 70.0 36.0 36.5
↓
29. Republic of Korea 10,344 217 14.0 14.0 28.0 -13,268 -273 28.0 25.0 53.0 15.0 25.0 ↓
30. India -7,263 -7 31.0 22.0 53.0 -115,774 -100 38.0 22.0 60.0 25.5 29.0 ↓
31. Japan 79,521 624 2.0 11.0 13.0 23,859 186 9.0 16.0 25.0 5.0 11.0 ↓

Popa and Babucea 4175 Table 7. Contd.
32. Singapore 8,736 2,585 15.0 3.0 18.0 18,420 3,838 11.0 3.0 14.0 10.0 7.0 ↑
33. South Africa 452 10 21.0 21.0 42.0 84,488 1,749
4.0 8.0 12.0 21.0 5.5 ↑
34. Nigeria 7,560 63 17.0 16.0 33.0 0 0 21.0 21.0 42.0 19.0 21.0 ↓
35. Argentina 16,719 440 9.0 12.0 21.0 13,175 332 14.0 14.0 28.0 11.0 16.0 ↓
36. Brazil 10,759 62 13.0 17.5 30.5 15,534 80 13.0 19.5 32.5 17.0 18.0 ↓
37. Canada23
30,447 62 5.0 17.5 22.5 45,001 80 7.0 19.5 26.5 12.0 13.0 ↑
38. United States of America -508,570
-1,747 41.0 39.0 80.0 -864,870 -2,840 41.0 36.0 77.0 41.0 41.0
→
39. Mexico, U.S.23
-7,997 -77 34.0 23.0 57.0 -18,734 -174 30.0 24.0 54.0 29.0 26.5 ↓
40. Australia -7,657 -388 33.0 33.0 66.0 -13,201 -620 27.0 27.0 54.0 33.0 26.5 ↑
41. New Zeeland -667 -173 23.0 24.0 47.0 -3,794 -883 23.0 28.0 51.0 22.0 24.5 ↓
We can not overlook the fact that the U.S. holds the last place in this hierarchy in both 2002 and 2008; Spain, the United Kingdom and Greece also had slacker positions, which means that all these countries made imports uncorrelated with exports that led to major trade balance deficits and thus to resort to bank loans in order to cover external debts, unprofitable loans, unless they lead to increased production following their use. Based on the hierarchies obtained for the three cate-gories of indicators, the average ranks were calculated in the second stage, based on such ranks the hierarchy was established for the entire foreign trade activity and the changes in rank in 2008 compared to 2002, as shown in Table 8.
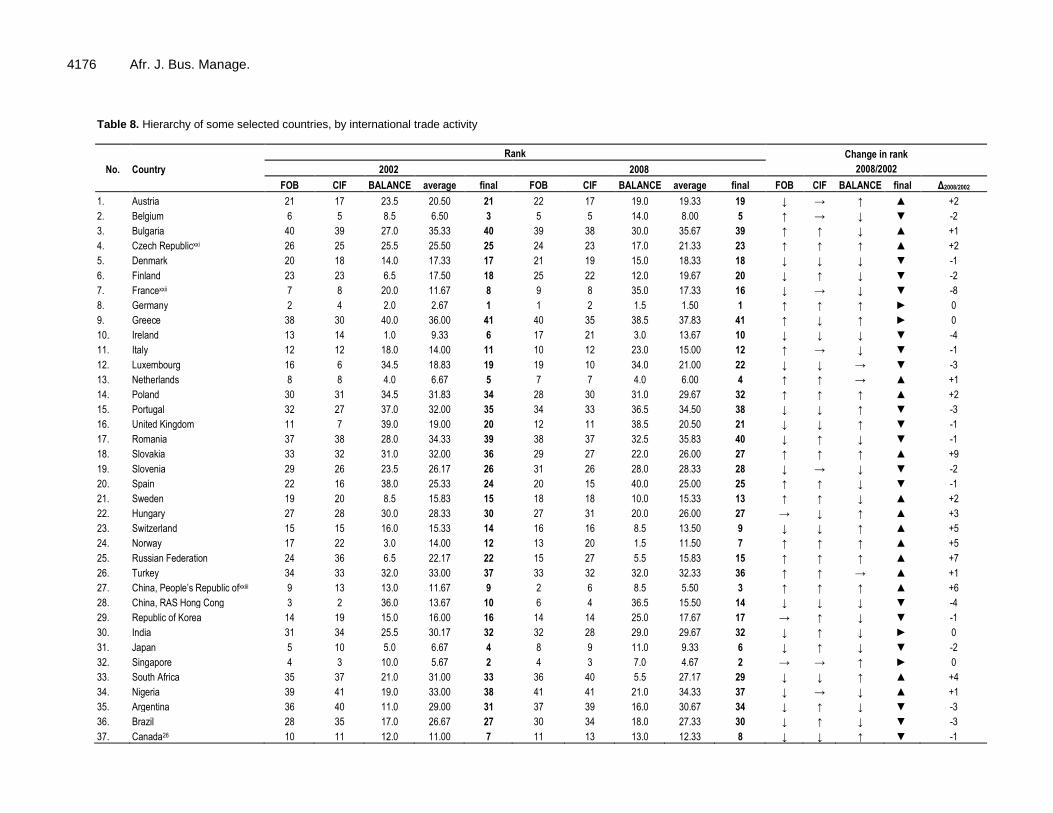
Thus, the analysis above relating to external trade reveals that Germany is on the first place, both in 2002 and 2008, given that it optimized its situation for all the three categories of indicators used in the analysis and relating to exports, imports and trade balance, overall and per capita; Singapore retains its second place due to improving the position held in the hierarchy regarding the trade balance and maintaining its
position on the export and import. We can not help noticing that the Republic of
China had one of the most spectacular evolutions, climbing 6 positions from the 9th place in 2002 to the 3rd place in 2008, and the Netherlands which improved its position on export and import and maintained its position on the trade balance, climbed from the 5th position in 2002 to the4th place in 2008. Although Belgium was placed the 3rd in 2002, due to weaker trade balance, it ranks 5th in 2008. We should also note the positive evolution of Slovakia that climbed 9 steps in the hierarchy, from position 36 in 2002 to position 27 in 2008, and the Russian Federation that climbed 7 positions in the same period, from position 22 to 15.
At the same time we realize that there are coun-tries that have significantly impaired their position, such as: France from the 8th position in 2002 to position 16 in 2008, or New Zealand that fell 6 positions, from number 29 in 2002 to the 35th place in 2008. Referring to our country, we can see that in 2008 it is ranked 40, holding the penultimate position in the rankings, compared to
the 39th place held in 2002. Conclusion The study conducted on the evaluation and analy-sis of existing differences between the countries participating in international trade in terms of export, import and trade balance revealed that there are strong differences between them, which are maintained when the indicators' analysis was conducted taking into account the number of inhabitants; this situation has sometimes led to change of hierarchies between the countries under research.
Since the dynamic analysis of the evolution of these indicators did not lead to results allowing us to perform classifications regarding the entire foreign trade activity, in addition to the analysis specific to territorial series, the multicriteria rank-ing was used, which gave us the opportunity to appreciate that Germany ranks first in the world, based on the international trade activity conducted in the period under study, followed by Singapore,
4176 Afr. J. Bus. Manage.
Table 8. Hierarchy of some selected countries, by international trade activity
No. Country
Rank Change in rank
2008/2002 2002 2008
FOB CIF BALANCE average final FOB CIF BALANCE average final FOB CIF BALANCE final Δ2008/2002
1. Austria 21 17 23.5 20.50 21 22 17 19.0 19.33 19 ↓ → ↑ ▲ +2
2. Belgium 6 5 8.5 6.50 3 5 5 14.0 8.00 5 ↑ → ↓ ▼ -2
3. Bulgaria 40 39 27.0 35.33 40 39 38 30.0 35.67 39 ↑ ↑ ↓ ▲ +1
4. Czech Republicxxi 26 25 25.5 25.50 25 24 23 17.0 21.33 23 ↑ ↑ ↑ ▲ +2
5. Denmark 20 18 14.0 17.33 17 21 19 15.0 18.33 18 ↓ ↓ ↓ ▼ -1
6. Finland 23 23 6.5 17.50 18 25 22 12.0 19.67 20 ↓ ↑ ↓ ▼ -2
7. Francexxii 7 8 20.0 11.67 8 9 8 35.0 17.33 16 ↓ → ↓ ▼ -8
8. Germany 2 4 2.0 2.67 1 1 2 1.5 1.50 1 ↑ ↑ ↑ ► 0
9. Greece 38 30 40.0 36.00 41 40 35 38.5 37.83 41 ↑ ↓ ↑ ► 0
10. Ireland 13 14 1.0 9.33 6 17 21 3.0 13.67 10 ↓ ↓ ↓ ▼ -4
11. Italy 12 12 18.0 14.00 11 10 12 23.0 15.00 12 ↑ → ↓ ▼ -1
12. Luxembourg 16 6 34.5 18.83 19 19 10 34.0 21.00 22 ↓ ↓ → ▼ -3
13. Netherlands 8 8 4.0 6.67 5 7 7 4.0 6.00 4 ↑ ↑ → ▲ +1
14. Poland 30 31 34.5 31.83 34 28 30 31.0 29.67 32 ↑ ↑ ↑ ▲ +2
15. Portugal 32 27 37.0 32.00 35 34 33 36.5 34.50 38 ↓ ↓ ↑ ▼ -3
16. United Kingdom 11 7 39.0 19.00 20 12 11 38.5 20.50 21 ↓ ↓ ↑ ▼ -1
17. Romania 37 38 28.0 34.33 39 38 37 32.5 35.83 40 ↓ ↑ ↓ ▼ -1
18. Slovakia 33 32 31.0 32.00 36 29 27 22.0 26.00 27 ↑ ↑ ↑ ▲ +9
19. Slovenia 29 26 23.5 26.17 26 31 26 28.0 28.33 28 ↓ → ↓ ▼ -2
20. Spain 22 16 38.0 25.33 24 20 15 40.0 25.00 25 ↑ ↑ ↓ ▼ -1
21. Sweden 19 20 8.5 15.83 15 18 18 10.0 15.33 13 ↑ ↑ ↓ ▲ +2
22. Hungary 27 28 30.0 28.33 30 27 31 20.0 26.00 27 → ↓ ↑ ▲ +3
23. Switzerland 15 15 16.0 15.33 14 16 16 8.5 13.50 9 ↓ ↓ ↑ ▲ +5
24. Norway 17 22 3.0 14.00 12 13 20 1.5 11.50 7 ↑ ↑ ↑ ▲ +5
25. Russian Federation 24 36 6.5 22.17 22 15 27 5.5 15.83 15 ↑ ↑ ↑ ▲ +7
26. Turkey 34 33 32.0 33.00 37 33 32 32.0 32.33 36 ↑ ↑ → ▲ +1
27. China, People’s Republic ofxxiii 9 13 13.0 11.67 9 2 6 8.5 5.50 3 ↑ ↑ ↑ ▲ +6
28. China, RAS Hong Cong 3 2 36.0 13.67 10 6 4 36.5 15.50 14 ↓ ↓ ↓ ▼ -4
29. Republic of Korea 14 19 15.0 16.00 16 14 14 25.0 17.67 17 → ↑ ↓ ▼ -1
30. India 31 34 25.5 30.17 32 32 28 29.0 29.67 32 ↓ ↑ ↓ ► 0
31. Japan 5 10 5.0 6.67 4 8 9 11.0 9.33 6 ↓ ↑ ↓ ▼ -2
32. Singapore 4 3 10.0 5.67 2 4 3 7.0 4.67 2 → → ↑ ► 0
33. South Africa 35 37 21.0 31.00 33 36 40 5.5 27.17 29 ↓ ↓ ↑ ▲ +4
34. Nigeria 39 41 19.0 33.00 38 41 41 21.0 34.33 37 ↓ → ↓ ▲ +1
35. Argentina 36 40 11.0 29.00 31 37 39 16.0 30.67 34 ↓ ↑ ↓ ▼ -3
36. Brazil 28 35 17.0 26.67 27 30 34 18.0 27.33 30 ↓ ↑ ↓ ▼ -3
37. Canada26 10 11 12.0 11.00 7 11 13 13.0 12.33 8 ↓ ↓ ↑ ▼ -1
Popa and Babucea 4177
Table 8. Contd.
38. United States of America 1 1 41.0 14.33 13 3 1 41.0 15.00 12 ↓ → → ▲ +1
39. Mexico, U.S.26 18 21 29.0 22.67 23 22 24 26.5 24.17 24 ↓ ↓ ↓ ▼ -1
40. Australia 25 24 33.0 27.33 28 26 25 26.5 25.83 26 ↓ ↓ ↑ ▲ +2
41. New Zeeland 31 29 22.0 27.33 29 35 36 24.5 31.83 35 ↓ ↓ ↓ ▼ -6
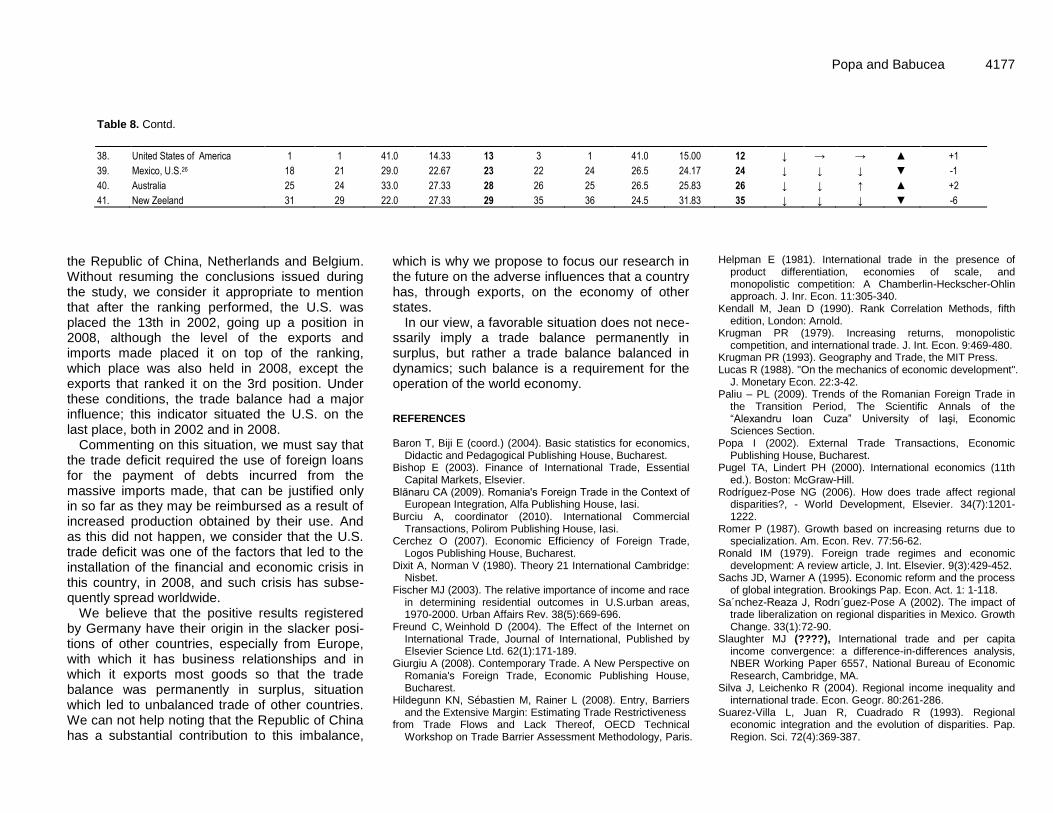
the Republic of China, Netherlands and Belgium. Without resuming the conclusions issued during the study, we consider it appropriate to mention that after the ranking performed, the U.S. was placed the 13th in 2002, going up a position in 2008, although the level of the exports and imports made placed it on top of the ranking, which place was also held in 2008, except the exports that ranked it on the 3rd position. Under these conditions, the trade balance had a major influence; this indicator situated the U.S. on the last place, both in 2002 and in 2008.
Commenting on this situation, we must say that the trade deficit required the use of foreign loans for the payment of debts incurred from the massive imports made, that can be justified only in so far as they may be reimbursed as a result of increased production obtained by their use. And as this did not happen, we consider that the U.S. trade deficit was one of the factors that led to the installation of the financial and economic crisis in this country, in 2008, and such crisis has subse-quently spread worldwide.
We believe that the positive results registered by Germany have their origin in the slacker posi-tions of other countries, especially from Europe, with which it has business relationships and in which it exports most goods so that the trade balance was permanently in surplus, situation which led to unbalanced trade of other countries. We can not help noting that the Republic of China has a substantial contribution to this imbalance,
which is why we propose to focus our research in the future on the adverse influences that a country has, through exports, on the economy of other states.
In our view, a favorable situation does not nece-ssarily imply a trade balance permanently in surplus, but rather a trade balance balanced in dynamics; such balance is a requirement for the operation of the world economy.
REFERENCES Baron T, Biji E (coord.) (2004). Basic statistics for economics,
Didactic and Pedagogical Publishing House, Bucharest. Bishop E (2003). Finance of International Trade, Essential
Capital Markets, Elsevier. Blănaru CA (2009). Romania's Foreign Trade in the Context of
European Integration, Alfa Publishing House, Iasi. Burciu A, coordinator (2010). International Commercial
Transactions, Polirom Publishing House, Iasi. Cerchez O (2007). Economic Efficiency of Foreign Trade,
Logos Publishing House, Bucharest. Dixit A, Norman V (1980). Theory 21 International Cambridge:
Nisbet. Fischer MJ (2003). The relative importance of income and race
in determining residential outcomes in U.S.urban areas, 1970-2000. Urban Affairs Rev. 38(5):669-696.
Freund C, Weinhold D (2004). The Effect of the Internet on International Trade, Journal of International, Published by Elsevier Science Ltd. 62(1):171-189.
Giurgiu A (2008). Contemporary Trade. A New Perspective on Romania's Foreign Trade, Economic Publishing House, Bucharest.
Hildegunn KN, Sébastien M, Rainer L (2008). Entry, Barriers and the Extensive Margin: Estimating Trade Restrictiveness
from Trade Flows and Lack Thereof, OECD Technical Workshop on Trade Barrier Assessment Methodology, Paris.
Helpman E (1981). International trade in the presence of product differentiation, economies of scale, and monopolistic competition: A Chamberlin-Heckscher-Ohlin approach. J. Inr. Econ. 11:305-340.
Kendall M, Jean D (1990). Rank Correlation Methods, fifth edition, London: Arnold.
Krugman PR (1979). Increasing returns, monopolistic competition, and international trade. J. Int. Econ. 9:469-480.
Krugman PR (1993). Geography and Trade, the MIT Press. Lucas R (1988). "On the mechanics of economic development".
J. Monetary Econ. 22:3-42. Paliu – PL (2009). Trends of the Romanian Foreign Trade in
the Transition Period, The Scientific Annals of the “Alexandru Ioan Cuza” University of Iaşi, Economic Sciences Section.
Popa I (2002). External Trade Transactions, Economic Publishing House, Bucharest.
Pugel TA, Lindert PH (2000). International economics (11th ed.). Boston: McGraw-Hill.
Rodríguez-Pose NG (2006). How does trade affect regional disparities?, - World Development, Elsevier. 34(7):1201-1222.
Romer P (1987). Growth based on increasing returns due to specialization. Am. Econ. Rev. 77:56-62.
Ronald IM (1979). Foreign trade regimes and economic development: A review article, J. Int. Elsevier. 9(3):429-452.
Sachs JD, Warner A (1995). Economic reform and the process of global integration. Brookings Pap. Econ. Act. 1: 1-118.
Sa´nchez-Reaza J, Rodrı´guez-Pose A (2002). The impact of trade liberalization on regional disparities in Mexico. Growth Change. 33(1):72-90.
Slaughter MJ (????), International trade and per capita income convergence: a difference-in-differences analysis, NBER Working Paper 6557, National Bureau of Economic Research, Cambridge, MA.
Silva J, Leichenko R (2004). Regional income inequality and international trade. Econ. Geogr. 80:261-286.
Suarez-Villa L, Juan R, Cuadrado R (1993). Regional economic integration and the evolution of disparities. Pap. Region. Sci. 72(4):369-387.
4178 Afr. J. Bus. Manage. Sută N, Miron D, Sută-Selejan S (2000). International Trade and
Contemporary Trade Policies, 1st vol. Eficient Publishing House, Bucharest.
http://www.insse.ro/cms/rw/pages/index.ro.do. http://www.e-intrastat.ro/incoterms.php.
i Imports FOB ii Including French Guiana, Guadeloupe, Martinique and Reunion iii Data for China, People’s Republic of, excludes those for Hong Kong SAR,
Macao SAR and Taiwan Province of China 8 Imports FOB iv Including French Guiana, Guadeloupe, Martinique and Reunion v Data for China, People’s Republic of, excludes those for Hong Kong SAR, Macao SAR and Taiwan Province of China vi Imports FOB vii Including French Guiana, Guadeloupe, Martinique and Reunion viii Data for China, People’s Republic of, excludes those for Hong Kong SAR,
Macao SAR and Taiwan Province of China ix Imports FOB x Including French Guiana, Guadeloupe, Martinique and Reunion xi Data for China, People’s Republic of, excludes those for Hong Kong SAR, Macao SAR and Taiwan Province of China xii Imports FOB xiii Including French Guiana, Guadeloupe, Martinique and Reunion xiv Data for China, People’s Republic of, excludes those for Hong Kong SAR,
Macao SAR and Taiwan Province of China xv Imports FOB xvi Including French Guiana, Guadeloupe, Martinique and Reunion xvii Data for China, People’s Republic of, excludes those for Hong Kong SAR,
Macao SAR and Taiwan Province of China xviii Imports FOB xix Including French Guiana, Guadeloupe, Martinique and Reunion xx Data for China, People’s Republic of, excludes those for Hong Kong SAR, Macao SAR and Taiwan Province of China xxi Imports FOB xxii Including French Guiana, Guadeloupe, Martinique and Reunion xxiii Data for China, People’s Republic of, excludes those for Hong Kong SAR,
Macao SAR and Taiwan Province of China