munich frankfurt paris economic social environmental
TRANSCRIPT
1 Road Show Asia 2015 Deutsche Bahn AG
Munich – Frankfurt – Paris – Zurich – Milan – Amsterdam – Edinburgh – London – Helsinki – Stockholm
ECONOMIC
ENVIRONMENTAL
SOCIAL
DB2020 – guiding us toward the future: Leaner, faster, more efficient and more customer focused.
2 Road Show Asia 2015 Deutsche Bahn AG
September 2015
Deutsche Bahn AG
Road Show Asia 2015
Investor Relations
Tokyo – Hong Kong – Taipei – Singapore – Sydney
DB2020 strategy and current challenges
ECONOMIC
ENVIRONMENTAL
SOCIAL
3 Road Show Asia 2015 Deutsche Bahn AG
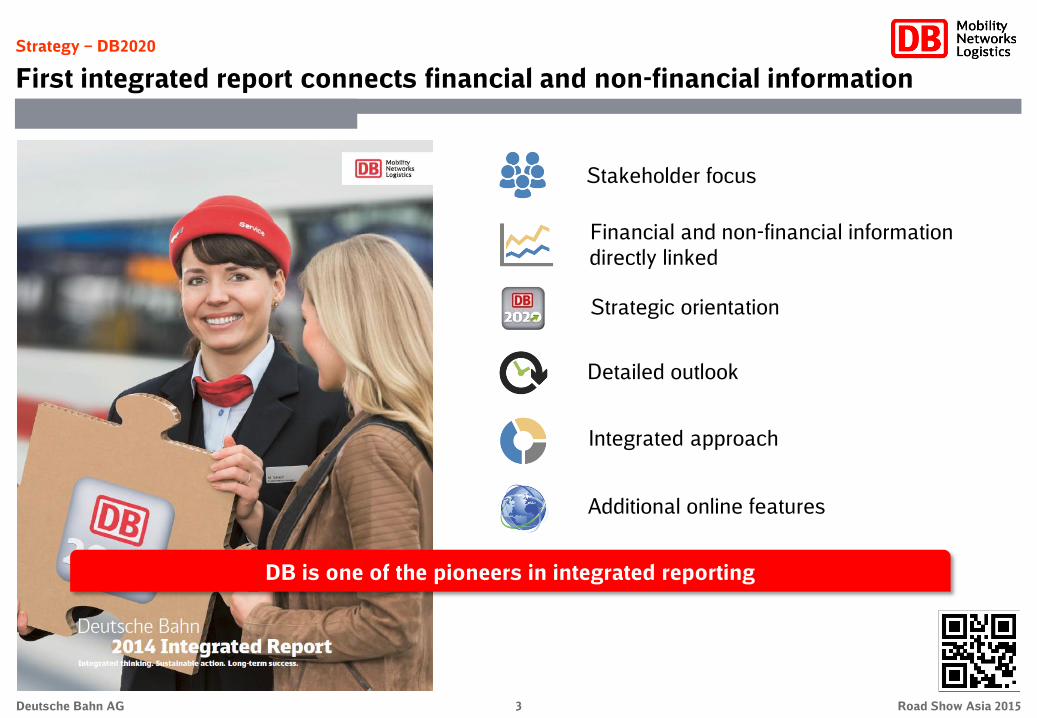
Strategy – DB2020
First integrated report connects financial and non-financial information
Strategic orientation
Detailed outlook
Financial and non-financial information
directly linked
Stakeholder focus
Integrated approach
DB is one of the pioneers in integrated reporting
Additional online features

4 Road Show Asia 2015 Deutsche Bahn AG
Strategy – DB2020
Disappointing development of top targets in economic dimension
Profitable growth Customer and quality
Target
2020
Revenues (€ billion)
2014
2013
39.7
39.1 > 50 2012 39.3
Redemption coverage (%)
2014
2013
20.9
20.5 ≥ 30 2012 22.1
Customer satisfaction B2C (SI)
2014
2013
76.1
75.1 ≥ 79 2012 75.3
Punctuality DB Group (rail) in Germany (%)
2014
2013
94.3
94.0 > 95 2012 94.4
Customer satisfaction B2B (SI)
2014
2013
68.2
66.6 ≥ 73 2012 65.8
ROCE (%)
2014
2013
6.3
6.8
2012 8.3
≥ 10

5 Road Show Asia 2015 Deutsche Bahn AG
Strategy – DB2020
Strong development of top targets in social and environmental dimensions
Top employer
Employer attractiveness (rank)
2014
2013
13
22 ≤ 10 2012 31
Reduction of specific CO₂ emissions (%)
2014
2013
22.7
18.7 20 2012 12.3
Renewable energy in the traction current mix (%)
2014
2013
39.6
35.2 35 2012 24.0
Employee satisfaction (index)
2014 3.7 4.0 2012 3.6
Survey process in two-year cycle
Eco-pioneer
Target
2020

6 Road Show Asia 2015 Deutsche Bahn AG
Customer and quality
Profitable growth
Cultural change/
employee
satisfaction
Resource preservation/
emissions and noise
reduction
Profitable market leader
Economic
Top employer
Social
Eco-pioneer
Environmental
In two dimensions we are on the right track - development of the
economic dimension (customer and quality as well as profitable growth)
is not satisfactory!
Strategy – DB2020
Social and environmental dimensions strong, economic disappointing

7 Road Show Asia 2015 Deutsche Bahn AG
Unsufficient
product quality
Increased
regulatory risks
Increasing
competition
Cost development
Personnel
Reduced
willingness to pay
Cost development
Traction power /
EEG surcharge
Railway in Germany
European and global activities
Digitalization
Pressure on margins & competition
DB Schenker
Fiscal consolidation &
growth prioritization DB Arriva
Initiatives 4.0
Key challenges - Overview
Current challenges relate to the Railway in Germany in particular

8 Road Show Asia 2015 Deutsche Bahn AG
Key challenges ‒ Railway in Germany
Since 2012 Railway in Germany under pressure
EBIT (€ million)
‒485
2014 2013 2012 2008
2,483
2,109 2,236
2,708
‒641
Fields of action
Streamlined Group structure
Modernization of rail infrastructure
New product offensive
Digitalization 4.0 initiatives
Comprehensive cost-efficiency programs
Stakeholder dialogue to promote green mobility
Collective bargaining
Foreign
countries
RiG1) Burdens from
regulatory framework
Wage tariff
increases
‒465
(69,3%)
(69%)
‒157
(31%) (19%)
(81%)
(37%)
(63%)
(41%)
(59%)
‒599
1) Railway in Germany = all subsidiaries included in collective agreements with EVG and GDL (including Group bookings)

9 Road Show Asia 2015 Deutsche Bahn AG
100 %
Deutsche Bahn Group
DB AG was founded Jan 1, 1994
and is 100% owned by the
Federal Republic of Germany
Integrated Group structure with one
holding company (DB AG), 3 divisions
and 9 business units
Deutsche Bahn AG
Fields of action – Group structure
Group structure streamlined
Deutsche Bahn
Finance B.V.
100%
Federal Republic of Germany
DB Bahn Long-
Distance DB Arriva
DB Schenker
Rail
DB Schenker Logistics
DB Services
DB Netze Track
DB Netze Stations
DB Netze Energy
DB Bahn Regional
Comments
Privatization threshold:
constitutionally mandated
Federal majority shareholding
in DB AG (“ownership clause”)
100%
100%
Restructuring of Group structure
opens up option for partial
privatization of DB Arriva and
DB Schenker Logistics, but both
will stay part and under control of
DB Group
DB Group
10 Road Show Asia 2015 Deutsche Bahn AG
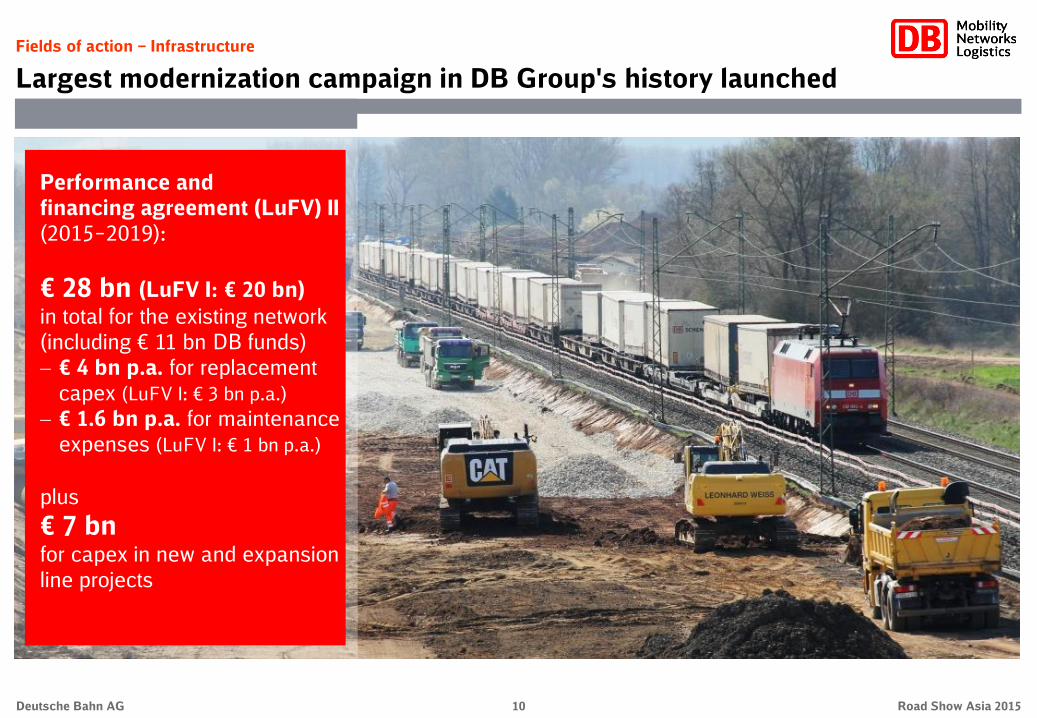
Fields of action ‒ Infrastructure
Largest modernization campaign in DB Group's history launched
Performance and
financing agreement (LuFV) II
(2015‒2019):
€ 28 bn (LuFV I: € 20 bn)
in total for the existing network
(including € 11 bn DB funds)
€ 4 bn p.a. for replacement
capex (LuFV I: € 3 bn p.a.)
€ 1.6 bn p.a. for maintenance
expenses (LuFV I: € 1 bn p.a.)
plus
€ 7 bn for capex in new and expansion
line projects

11 Road Show Asia 2015 Deutsche Bahn AG
Fields of action ‒ Long-distance transport
New long-distance strategy: More services for metropolitan areas and regions
2 per hour
1 per hour
1 every two hours
Germany in sync
(“Deutschland im Takt”)
1 per hour
1 every two hours
IC-new connection for tourists (trains not always running every two hours)
Bregenz
Rostock Stralsund
Hanover
Dresden
Berlin
Jena
Nurem- berg
Munich
Stuttgart
Mannheim
Cologne
Hamburg
Hamm
Karlsruhe
Bremen
Tübin- gen
Ffm
Trier
Aachen
Kassel Erfurt Leipzig
Magde- burg
Cottbus
Schwerin Norddeich
Münster
Duisburg
Bam- berg
Würz- burg
Saarbrücken
Chemnitz
Zurich
Regensburg
Hof
Oberst- dorf
Berchtes- gaden
Binz
Westerland
Kiel
Attractive vision for DB Group and
all its stakeholders
Major increase in long-distance services:
+25% volume produced by 2030
(2030: 162 million train-path km)
+50 million more passengers per year
(2030: 180 million)
More ICE connections, with two trains an
hour on main corridors
Integration of regions into the long-distance
rail network, with two hourly services
Five million citizen newly connected to the
long-distance rail network
Annual CO2 emissions cut by 1.7 million
metric tons (equivalent to the annual carbon
emissions of 600,000 cars)
€ 12 bn capex until 2030
(thereof about € 1.5 bn additional capex for
expansion of services)
12 Road Show Asia 2015 Deutsche Bahn AG
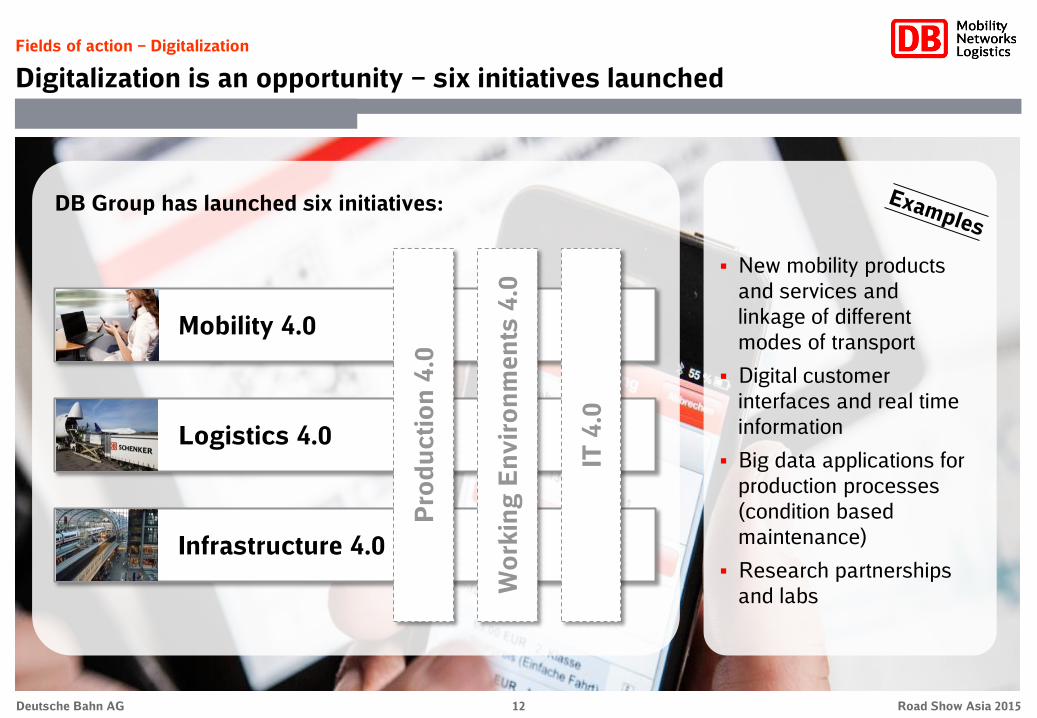
Fields of action ‒ Digitalization
Digitalization is an opportunity – six initiatives launched
New mobility products
and services and
linkage of different
modes of transport
Digital customer
interfaces and real time
information
Big data applications for
production processes
(condition based
maintenance)
Research partnerships
and labs
DB Group has launched six initiatives:
Mobility 4.0
Logistics 4.0
Infrastructure 4.0
Pro
du
cti
on
4.0
Wo
rkin
g E
nv
iro
nm
en
ts 4
.0
IT 4
.0

13 Road Show Europe 2015 Deutsche Bahn AG
Strategy ‒ DB2020
Integrated thinking. Sustainable action. Long-term success.
ECONOMIC
ENVIRONMENTAL
SOCIAL
Munich – Frankfurt – London – Edinburgh – Milan – Zurich – Paris – Helsinki – Stockholm – Amsterdam
Financial development and capital market activities
ECONOMIC
ENVIRONMENTAL
SOCIAL
Tokyo – Hong Kong – Taipei – Singapore – Sydney
September 2015
Deutsche Bahn AG
Road Show Asia 2015
Investor Relations

15 Road Show Asia 2015 Deutsche Bahn AG
Economy with slight improvements, but weaker than expected
Negative effects on rail activities due to increased competition, strikes and storms
Revenues, net profit and dividend payment rose, operating profit declined
Net financial debt decreased due to reporting day effects
Slight decrease in order book to € 84.2 bn (‒3.8%)
Weak development in key value management figures
Highlights
Revenues adjusted (€ bn)
EBIT adjusted (€ bn)
Net financial debt (as of Dec 31, € bn)
ROCE (%)
2013
2014
Gross capex (€ bn)
2014 Financial Year – At a glance
Unsatisfying development in 2014 Financial Year
39.1
39.7
+1.5 %
2013
2014
2.2
2.1
‒5.7%
2013
2014
8.2
9.1
+11.0%
2013
2014
16.4
16.2
‒0.9%
2013
2014
6.8
6.3

16 Road Show Asia 2015 Deutsche Bahn AG
H1 2015 – Overview
Highlights H1 2015
Revenue increase by 1.3% to € 20.0 bn, driven by DB Netze Track, DB Schenker Logistics
and DB Arriva
EBIT decrease by € 198 mn to € 0.9 bn due to strike effects (€ ‒252 mn)
Revenues and
profit
Performance in rail transport below H1 2014
Development in transport and logistics mostly positive
(land: +3.8%, air: +1.1%, ocean: ‒3.5%, contract logistics +7.8%)
Train kilometers on German track infrastructure stable despite strikes (+0.1%)
Performance
figures
Takeover of a bus operator in Slovakia (GOTFRI) to expand activities in Eastern Europe
DB Schenker Logistics acquired a contract logistics company (SPA)
DB Schenker Logistics established a 50%/50% Joint Venture with Shenyang Jimbei Automotive
in China
M&A activities
Decrease in order book to € 83.7 bn (‒0.6%), thereof secured € 53.0 bn and unsecured € 30.7 bn
DB Arriva won a 15 years € 2 bn transport contract in the Netherlands
Order book
World economic growth slightly weaker than in H1 2014 (+2.6% vs +2.7% in H1 2014)
Growth in the Eurozone gains momentum (+1.2% vs +0.9% in H1 2014)
In Germany, growth below previous year due to relatively weak Q1 (+1.4% vs +1.9% in H1 2014)
Economics
Ratings All ratings unchanged: Moody’s (Aa1), Standard&Poor’s (AA)

17 Road Show Asia 2015 Deutsche Bahn AG
Selected key figures (€ mn)
EBIT adjusted
Net profit (after taxes)
Net financial debt as of Jun 30, 2015/Dec 31, 2014
890
391
17,611
20,000
19,510
H1 2015 – At a glance
Negative development in the first half of 2015
H1 2015
Revenues adjusted
Revenues comparable
–18.2
–39.1
+8.6
+1.3
–1.1
absolute %
Change
–198
–251
+1,399
+266
–209
–1.4 –48 Gross capital expenditures 3,366
–11.6 –214 Net capital expenditures 1,633
ROCE (%) 5.1 – –
H1 2014
1,088
642
16,212
19,734
19,719
3,414
1,847
6.5

18 Road Show Asia 2015 Deutsche Bahn AG
Derivation of comparable revenues
Changes in scope of consolidation:
FX–effects: ‒2.4%-points (€ 481 mn)
(mainly DB Schenker Logistics and DB Arriva)
No changes in revenue structure
50%42%
7%1%
56%
32%
7%
4% 1%
H1 2015 – Revenue development
Revenue development influenced by weak Euro
Revenues (€ mn)
+266 / +1.3%
comparable: ‒209 / ‒1.1%
Highlights
Germany Rest of
Europe
Transport
and
Logistics Passenger
Transport
Infra-
structure Other
Rail Non-rail
Rest of
World
North
America Asia /
Pacific
By divisions By activities By regions
H1 2014 FX
effects
Economy,
markets &
competition
H1 2015 Others/
counter-
measures
Strikes
19,734 +481
+56 20,000 +12
‒283
19,719 19,510
‒0%-points (€ 9 mn)
Europe
88%

19 Road Show Asia 2015 Deutsche Bahn AG
H1 2015 – Profit development
Weak development of operating profit due to strikes
Adjusted EBIT (€ mn)
H1 2014
1,088 ‒190
890
+17
FX
effects
Economy,
markets &
competition
H1 2015
+25
Others/
counter-
measures
‒198 / ‒18.2%
Factor
costs
Germany
‒252
Remarks
Weak development mainly at DB Bahn
Long-Distance, DB Bahn Regional and
DB Schenker Rail
Growth at Infrastructure business units
and DB Schenker Logistics
Key impact factors:
(1) Economy, markets & competition
Positive impetus at DB Schenker Logistics,
DB Arriva and DB Netze Track
Weak development of Railway in Germany
(2) Factor costs Germany
Increases of wages and Renewable Energy (EEG)
surcharge
(3) Others/counter measures
All areas of the business, including Group
management, have a clear focus on
countermeasures and on cost-efficient structures Strikes
+202

20 Road Show Asia 2015 Deutsche Bahn AG
3,414 3,366
Gross:
‒48
‒1.4%
Highlights
Group
Focus of gross capex unchanged
Increasing infrastructure capex
Decreasing rolling stock capex at DB Bahn Regional (extraordinary high level in H1/2014)
Structure of gross capex nearly unchanged
H1 2015 – Capital expenditures
Capital expenditures activity continued at a high level
1,847 1,633
Net:
‒214
‒11.6%
Capital expenditures (€ mn)
H1 2014 H1 2015
73%
17%
5% 5%
Germany
Rest of
Europe
Transport
and Logistics
Passenger
Transport
Infra-
structure
Other Rest of
World
Gross capex by divisions Gross capex by regions

21 Road Show Asia 2015 Deutsche Bahn AG
H1 2015 – Net financial debt
Source and application of funds
EBITDA
adjusted
Net
Capex
Working
Capital/
other
Capital
costs /
taxes
Jun 30,
20151)
+1,633
+986
+1,154 17,611
16,212
Dec 31,
2014
+1,399 / +8.6%
1) Adjusted for hedged currency effects (€ 385 mn).
Forecast
Dec 31,
2014
Reporting
date effects
WC/other
17,000 ‒
17,500
‒751
751 EBIT adj.
890
Depre-
ciation
1,484
Source of funds
2,374
(€ mn)
Application of funds 3,773
Dividend 700
Interest 387
Taxes 67

22 Road Show Asia 2015 Deutsche Bahn AG
0.1
0.8
2.3
2.1 2.1 2.12.2
1.8
2.2
1.4
1.0
0.8
0.60.5
0.1
2015 2016 2017 2018 2019 2020 2021 2022 2023 2024 2025 2026 2028 2029 2072
Debt and financing
Expected funding requirements in 2015
Bond issues 2014 (9 transactions / € 2.0 bn), 2015 (-)
Redemptions in 2015 (as of Jan 1, 2015)
‒1.1
Net liquidity (as of Jan 1, 2015) 4.0
Net capex / other
Net liquidity (as of Dec 31, 2015)
Expected funding requirements 2015 (€ bn)
Operating cash flow +4.3
Dividend for 2014 financial year ‒0.7
Bond issues (as of June 30, 2015) ‒
Anticipated bond issues in 2015 +1.6
Maturity Currency
10Y 2.46 42
7Y 1.89 37
10.5Y 2.40 34
5Y - -
15Y 2.89 55
€ all-in-
costs (%)
Swap
spread (BP) Million
591)
1822)
246
73
500
1) Private placement. 2) Two transactions. 3) 3M-EURIBOR.
300 6Y
Maturity profile financial liabilities (as of June 30, 2015; € bn; incl. swaps)
Bonds EUROFIMA Bank / EIB Interest-free loans Leasing
floating 343)
8Y floating 323) 300
3001) 343) 7.25Y floating
‒5.2
2.9
23 Road Show Asia 2015 Deutsche Bahn AG
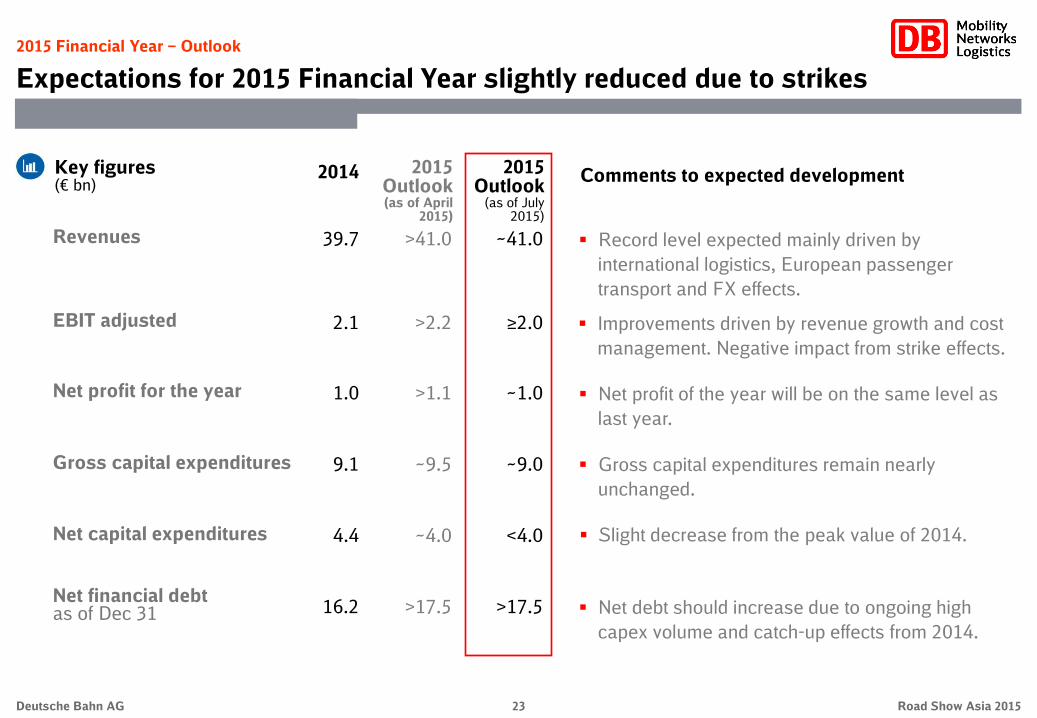
2015 Financial Year – Outlook
Expectations for 2015 Financial Year slightly reduced due to strikes
Key figures (€ bn)
Comments to expected development 2015 Outlook (as of April
2015)
2014
EBIT adjusted >2.2 2.1 Improvements driven by revenue growth and cost
management. Negative impact from strike effects.
≥2.0
Net profit for the year >1.1 1.0 Net profit of the year will be on the same level as
last year.
~1.0
Net financial debt as of Dec 31 >17.5 16.2 Net debt should increase due to ongoing high
capex volume and catch-up effects from 2014.
>17.5
Revenues >41.0 39.7 Record level expected mainly driven by
international logistics, European passenger
transport and FX effects.
~41.0
~9.5 9.1 Gross capital expenditures Gross capital expenditures remain nearly
unchanged.
~9.0
~4.0 4.4 Net capital expenditures Slight decrease from the peak value of 2014. <4.0
2015 Outlook
(as of July 2015)

Munich – Frankfurt – London – Edinburgh – Milan – Zurich – Paris – Helsinki – Stockholm – Amsterdam
Thank you for your attention.
ECONOMIC
ENVIRONMENTAL
SOCIAL
Tokyo – Hong Kong – Taipei – Singapore – Sydney

Appendix
Tokyo – Hong Kong – Taipei – Singapore – Sydney

26 Road Show Asia 2015 Deutsche Bahn AG
DB Group
Strong Group portfolio with three divisions
International provider
of mobility and
logistics services
Active in more than
130 countries
Vertically integrated
Group structure
DB AG acts as
management holding
company
Ratings: Aa1 / AA
DB Group (2014)
Total revenues
EBIT adjusted
Capital expenditures
Employees (as of Dec 31)
EBITDA adjusted
8,920
857
+3.0%
–11.2%
–1.9%
+2.5%
5,989
50,019
2,001 –3.8%
Excl. DB Services and Other / consolidation. Key figures vs. 2013.
19,806
378
+0.5%
–3.6%
–15.9%
+0.7%
435
95,652
863 –0.8%
17,356
1,320
+1.5%
–1.9%
+81.9%
–1.4%
2,458
98,778
2,496 +1.8%
39,720
2,109
+1.5%
–5.7%
+11.0%
–
9,129
295,763
5,110 –0.6%
Key figures (2014)
>329 mn t rail freight
~99 mn shipments
>1.1 mn t air freight
~2.0 mn TEU ocean freight
>4.3 bn rail and bus passengers
>11.9 mn rail and bus passengers / day
>1 bn train-path km
>148 mn station stops
33,426 km length of line operated
5,676 stations

27 Road Show Asia 2015 Deutsche Bahn AG
DB Group
New organizational structure since August 1st, 2015
Deutsche Bahn AG
Federal Republic of Germany
100%
DB Netze Track
DB Netze Stations
DB Netze Energy
Chairman and
CEO
Finance/
Controlling
(CFO)
Human
Resources
Economic, Legal and
Regulatory Affairs
Infrastructure, Services
and Technology
Business units
DB Schenker Rail
DB Schenker
Logistics
DB Services
DB Bahn Long-
Distance
DB Bahn
Regional
DB Arriva Group functions
Service functions
Traffic and Transport

28 Road Show Asia 2015 Deutsche Bahn AG
DB Group
Top management team has a wide range of competence and experience
The Management Board of DB AG
Infrastructure, Services and
Technology
Dr. Volker Kefer2)
Traffic and Transport
Berthold Huber
Economic, Legal and
Regulatory Affairs1)
Ronald Pofalla
Chairman and CEO
Dr. Rüdiger Grube
Human Resources
Ulrich Weber
Finance and Controlling
Dr. Richard Lutz
1) Economic and political affairs, legal affairs, regulatory affairs, compliance, corporate security, international business relations. 2) Vice-Chairman.

29 Road Show Asia 2015 Deutsche Bahn AG
Independent commercial services
Publicly mandated services
Passenger Transport
Long-distance transport services
Direct competition, above all, with
cars and airplanes
End-customer business
Intensive level of fixed assets
Local public transport services
Contracted routes,
tender competition
Customers here are both the
contracting organization1) as well as
the passenger (end-customer)
Intensive level of fixed assets
Transport and Logistics
Rail freight transport services
Rail competes directly with other
modes of transport
Big customer business, clear sector
focus
Intensive level of fixed assets
Freight forwarding and logistics services
Direct competition (world-wide)
Full service forwarder, large customer
base, broad mix of industries
Less intensive level of fixed assets
1) Contracting organizations can be states, state-run enterprises, transport associations, or regional bodies
We differentiate between independent commercial services
and publicly mandated services
Infrastructure
Provision of infrastructure
No competition, monopoly position
in regulated markets, public-sector
contracts for reliable and efficient
provision of infrastructure at
competitive prices
Customer: Carriers (derived demand)
Very intensive level of fixed assets
DB Group
DB Group is active in markets with commercial and publicly mandated services

30 Road Show Asia 2015 Deutsche Bahn AG
DB Group
DB Group is acting worldwide in more than 130 countries
DB networks – covering more than 130 countries worldwide
~9,000 employees
€ 1.8 bn revenues
Offerings
Logistics services
Rail projects
Americas
~188,000 employees
€ 22.9 bn revenues
Offerings
Rail infrastructure
Passenger transport (rail and bus)
Land transport (rail and truck)
Logistics services
Rail projects
Germany
~900 employees
€ 0.2 bn revenues
Offerings
Logistics services
Rail projects
Africa
~14,000 employees
€ 2.5 bn revenues
Offerings
Logistics services
Land transport (rail)
Rail projects
Asia / Pacific
~84,000 employees
€ 12.3 bn revenues
Offerings
Passenger transport (rail and bus)
Land transport (rail and truck)
Logistics services
Rail projects
Europe (excl. Germany)

31 Road Show Asia 2015 Deutsche Bahn AG
1) Within Germany as well as cross border traffic; 2) In UK with Arriva-affiliate ‘CrossCountry’ also long-distance passenger transport; 3) Business unit is assigned to the Infrastructure and Services division
Passenger Transport: Domestic and European-wide mobility
services
DB Bahn Long-Distance Long-distance rail pass. Transport1)
DB Bahn Regional Regional / urban pass. transport (GER)
DB Arriva Regional / urban pass. Transport (EU)2)
DB Services3) Integrated range of services
Infrastructure: Efficient and future-oriented rail
infrastructure in Germany
DB Netze Track Rail network
DB Netze Stations Passenger stations
DB Netze Energy Traction current
Transport and Logistics: Intelligent logistics services via land,
air and the sea
DB Schenker Rail European rail freight transport
DB Schenker Logistics Global logistics services
DB Group
Business units active in all segments of the transport market

32 Road Show Asia 2015 Deutsche Bahn AG
Figures are rounded and exclude DB Arriva; 1) DB Bahn Sales is a service center within the Passenger Transport division
DB Bahn Long-Distance
DB Bahn Sales1)
DB Bahn Regional 2.7 billion passengers per year in our trains and buses
25,000 passenger trains per day
260 ICE are included in our fleet
9 neighboring countries can be reached directly
DB Arriva
Passenger Transport
#2 in the European passenger transport market

33 Road Show Asia 2015 Deutsche Bahn AG
Passenger Transport
With its Mobility 4.0 initiative, DB Bahn is actively shaping digitalization
Customer perspective
"What services and products can DB Bahn use to inspire its customers?"
Ensuring a reliable basic quality level for services
Offering convenient, relaxing, straightforward, personalized and enriching travel experiences
Addressing customers in a consistent way across all channels and gaining fans by making the customer relationship one tied with emotions
Mobility market perspective
"How will the mobility market develop in the future and how will DB Bahn position itself within this market?"
Describing the mobility market of the future
Understanding competition on the mobility market of the future
Positioning DB Bahn as the mobility service provider of the future
Organization perspective
"How can DB Bahn become a higher performing, highly innovative organization?"
Establishing a DB Mobility Lab as a space for innovative ideas
Ongoing development of a high-performing, highly innovative organization
Profitable Growth

34 Road Show Asia 2015 Deutsche Bahn AG
DB Bahn Long-Distance operates its services on a
purely commercial basis
Germany is the home market – DB Bahn Long-
Distance is currently the only network provider with
full-coverage connections between German cities
German long-distance transport market completely
open for competition since rail reform in 1994
Market liberalization in many countries is not yet
advanced, so often only cross-border connections in
cooperation with the national railways can be
offered
DB Bahn Long-Distance links the most important
neighbouring cities with point-to-point connections
from the German network
Market overview for DB Bahn Long-Distance
Significant characteristics Domestic connections
International services
Bern, Interlaken,
Zurich
Cologne
Berlin
Stuttgart
Hanover
Frankfurt
Hamburg
Munich
Leipzig
Nuremberg
Gdansk,
Cracow,
Warsaw
Budapest,
Prague,
Vienna
Vienna
Bologna, Venice,
Verona
Paris,
Marseille
Brussels
Amsterdam
Aarhus,
Copenhagen
Key markets
DB Bahn Long-Distance
Network connected with European neighbors

35 Road Show Asia 2015 Deutsche Bahn AG
DB Bahn Long-Distance
Key customer expectations
Direct connections every two hours, including
nearly all cities with populations of over 100,000
Low fares
Direct service from regions
No-frills food service
Medium to high willingness to pay
Fast, direct connections between metropolitan
areas
Food service always available
High expectations for convenient
entertainment and internet access
Focus on basic service
Basics: on-time connections, service, seating and telecommunications1)
Extended network ("IC-new" network)
Expectation of fast, comfortable and convenient travel
Core network (ICE network)
Fast, frequent connections between major cities,
with up to two trains an hour
1) Internet und cellular reception will depend on network expansion by telecommunications companies

36 Road Show Asia 2015 Deutsche Bahn AG
DB Bahn Long-Distance
Long-distance reloaded: improvements in 2015 and 2016
2015 2016
ICE portal
Release 1.0
09
2015
12
2015
Faster connections
Frankfurt–Berlin (VDE 8.2)
Frankfurt–Dresden (VDE 8.2)
Navigator relaunch 09
2015
IC-new
Dresden–Cologne
Leipzig–Emden
12
2015
ICE: State-of-the-art mobile
telephony repeaters
08
2015
Higher capacity
Cologne–Stuttgart
12
2015
Faster connections
Frankfurt–Paris
Stuttgart–Paris
04
2016
06 2016
ICE: Free WiFi
Second class
Upgraded travel assistance 06
2016
ICE portal
Release 2.0
Content partnership
06
2016
IC: State-of-the-art mobile
telephony repeaters
07
2016
Faster connections
Germany–Tessin / Milan
12
2016

37 Road Show Asia 2015 Deutsche Bahn AG
DB Bahn Long-Distance
Capex in new rolling stock and redesign of our existing fleet
2030 2015
130
17
120
New rolling stock by 2030
Series
407 ICE
Double-
decker
IC
ICx
Fleet age and structure in 2030
[Average age]
-33%
ICE fleet
360 ICE trainsets
Speeds of 230 to 330 kph
IC-new fleet
120 double-decker
IC trainsets in total
Speeds of 160 to 200 kph

38 Road Show Asia 2015 Deutsche Bahn AG
DB Bahn Long-Distance
Green mobility, using renewable energy sources and cutting consumption
2030
-20%
2014
Energy consumption
(kWh / passenger place km) We will cut specific energy
consumption 20% by 2030
Our main tools in achieving this target will
include:
Energy-efficient driving techniques
Energy-efficient rolling stock
Long-dist. bus DB long-dist.
rail today
Air travel Car travel
Specific CO2 emissions (2014, g / pkm)
We will cut specific annual CO2
emissions by 1.7 million metric tons by
winning more passengers
That is the equivalent of the annual
carbon emissions of some 600,000 cars

39 Road Show Asia 2015 Deutsche Bahn AG
DB Bahn Long-Distance
Plans for the core network
Free WiFi in first and
second class
Free information and
entertainment portal
Feel-good atmosphere
Seat reservation included
in first and second class
On-board restaurant
Digitalization Comfort and service
Fast, direct connections between
metropolitan areas
Much shorter travel times made possible
by new infrastructure
(VDE 8.1 and 8.21), Wendlingen‒Ulm,
Stuttgart 21)
Over 150 former IC connections per day
upgraded to ICEs
Up to two trains per hour
Mobility
1) "German Unity Transport Project" (Nuremberg–Erfurt–Halle–Leipzig line upgrade)
2 ICEs per hour
1 ICE per hour
1 ICE every two hours
Target network:
≈120 million
train km
360 ICE vehicles

40 Road Show Asia 2015 Deutsche Bahn AG
DB Bahn Long-Distance
Faster connections throughout Germany by the end of 2015
Expansion of fast connections by 2030 Sprinter network in 2030
Connection much faster than today
3:00 Travel times on
sample routes
B
S
C
H
N
3:55
3:50
3:50
3:10
2:55
2:50
2:05
2:05
3:20
3:00
L
F
HH
M
3:30
1:40
4:15
1:10
Starting with the 2022 train schedule
Munich–Stuttgart 30 min. faster 1:45
Munich–Frankfurt 10 min. faster 3:00
Munich–Cologne 30 min. faster 3:50
Munich–Paris 30 min. faster 5:05
Starting with the 2018 train schedule
Munich–Berlin 125 min. faster 3:55
Munich–Leipzig 100 min. faster 3:10
Nuremberg–Berlin 115 min. faster 2:50
Nuremberg–Leipzig 115 min. faster 2:05
Dresden–Berlin 20 min. faster 1:45
Starting with the 2016 train schedule New travel time
Cologne–Stuttgart 10 min. faster 2:05
Cologne–Hamburg 30 min. faster (p.m.) 3:30
Frankfurt–Hamburg 10 min. faster (p.m.) 3:20
Frankfurt–Hanover 10 min. faster (p.m.) 2:05
Frankfurt–Dresden 65 min. faster 4:15
Frankfurt–Leipzig 35 min. faster 2:55
Frankfurt–Halle 55 min. faster 2:45
Frankfurt–Berlin 10 min. faster via Halle2) 4:00
Frankfurt–Paris 15 min. faster via Strasbourg 3:35
Stuttgart–Paris 30 min. faster und 5x / day instead of 4x 3:10
Munich–Paris 30 min. faster by TGV 5:35
1) "German Unity Transport Project" (Nuremberg–Erfurt–Halle–Leipzig line upgrade) 2) 20 min. faster starting in 2018: Frankfurt–Berlin 3:50
VDE 81)
Stuttgart 21
New Sprinter
service

41 Road Show Asia 2015 Deutsche Bahn AG
DB Bahn Long-Distance
Plans for the extended network
1) Internet und cellular reception will depend on network expansion by telecommunications companies
1 IC-new per hour 1 IC-new every two hours IC-new connection for tourists (trains not always running every two hours)
Seat reservations
included in first and
second class
No-frills food service
on board
Bicycles allowed
New saver fares starting
at € 19
Nearly all cities with populations of over
100,000 in Germany connected to the long-
distance network, two-hourly services
5 million citizen connected to the long-
distance network for the first time
Roughly 190 new direct connections from
smaller cities to 50 largest cities
Efforts to better integrate long-distance and
regional / local fares, where requested by
PTAs
Digitalization Comfort, service and fares Mobility
Stable internet and cellular
reception1)
Target network:
≈42 million
train km
120 double-
decker IC trains

42 Road Show Asia 2015 Deutsche Bahn AG
In 1996 responsibility for local rail passenger
transport (LRPT) was transferred from the German
government to the individual German states
To finance this, the government made
regionalization funds (2014 approx. € 7.30 bn)
available to the states
27 client organizations order LRPT services from
train operating companies on behalf of the states
Market volume is about 644 mn train km
The market in Germany is completely liberalized.
With a market share of around 73% DB Bahn
Regional is the backbone of the LRPT market
Market overview for DB Bahn Regional Rail
1) LRPT = local rail passenger transport
Organizations
ordering
LRPT1)
services in
Germany
LVS
VBB
VMV
NASA
ZVV
BEG
NVBW
SPNV-
Süd VGS
NVS
NVV
SPNV-
Nord
NVR
VRR
RH
LNVG
Bremen
ZVNL
ZGB
RMV
Hamburg
VRN
VVS
NWL
ZVON VVO
ZVMS
Significant characteristics
DB Bahn Regional
DB Bahn Regional Rail: 27 client organizations order services

43 Road Show Asia 2015 Deutsche Bahn AG
PRT1)
market
Regional
Bus
City Bus
Light Rail
Provider structure
DB Bahn Regional Bus
Global players
SMEs
Municipal district transport
companies
Almost exclusively municipal
transport companies
Some privatised exceptions
Almost exclusively municipal
transport companies
Very few private providers
Description
Regional overland transport with a focus on
school / college services
Predominantly franchise renewals
Increasing competition
DB Bahn Regional Bus market share: > 50%
Generally in towns with min. 20,000 inhabitants
Most contracts awarded internally to municipal
companies
DB Bahn Regional Bus market share: around 1%
In conurbations and urban regions
Contracts almost exclusively awarded internally
to municipal companies
No DB Bahn Regional Bus transport services
Sub-markets of the public road transport (PRT) market
1) PRT = public road transport
DB Bahn Regional
DB Bahn Regional Bus: market consists of three segments
44 Road Show Asia 2015 Deutsche Bahn AG
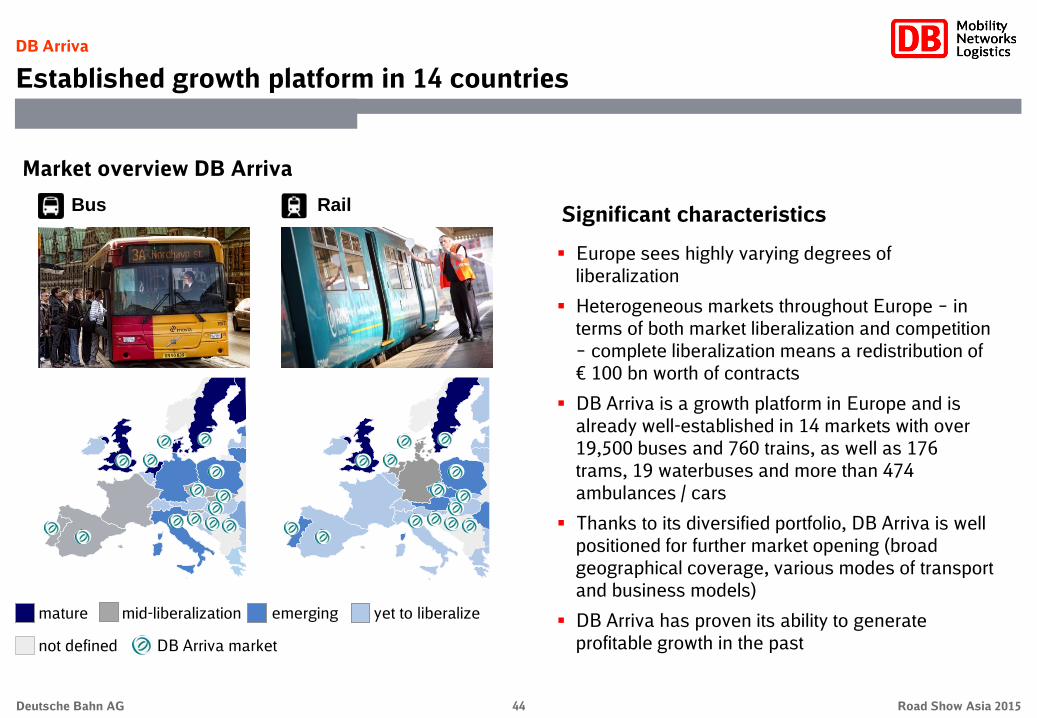
Europe sees highly varying degrees of
liberalization
Heterogeneous markets throughout Europe – in
terms of both market liberalization and competition
– complete liberalization means a redistribution of
€ 100 bn worth of contracts
DB Arriva is a growth platform in Europe and is
already well-established in 14 markets with over
19,500 buses and 760 trains, as well as 176
trams, 19 waterbuses and more than 474
ambulances / cars
Thanks to its diversified portfolio, DB Arriva is well
positioned for further market opening (broad
geographical coverage, various modes of transport
and business models)
DB Arriva has proven its ability to generate
profitable growth in the past
Market overview DB Arriva
Significant characteristics
DB Arriva
Established growth platform in 14 countries
Bus Rail
mature mid-liberalization emerging yet to liberalize
not defined DB Arriva market

45 Road Show Asia 2015 Deutsche Bahn AG
Arriva UK Trains – facts and figures
DB Arriva
Arriva UK Trains is one of the leading providers with a diversified portfolio
Important rail operator in UK with five transport service
contracts
Entered market in 2000
Market share of rail passenger transport: ~14%
6,700 employees
Fleet of 400 trains
Broad portfolio of products and services: light rail,
commuter transport, regional and long-distance
transport
Over a decade of experience in a highly competitive,
deregulated rail transport market
Close relationships with customers, transport
associations and client bodies
Operation and development of open access transport
services through Grand Central Railway and
prospectively Alliance Rail Holdings
Arriva Trains Wales
Chiltern
CrossCountry
LOROL
Tyne and Wear Metro
Grand Central
46 Road Show Asia 2015 Deutsche Bahn AG
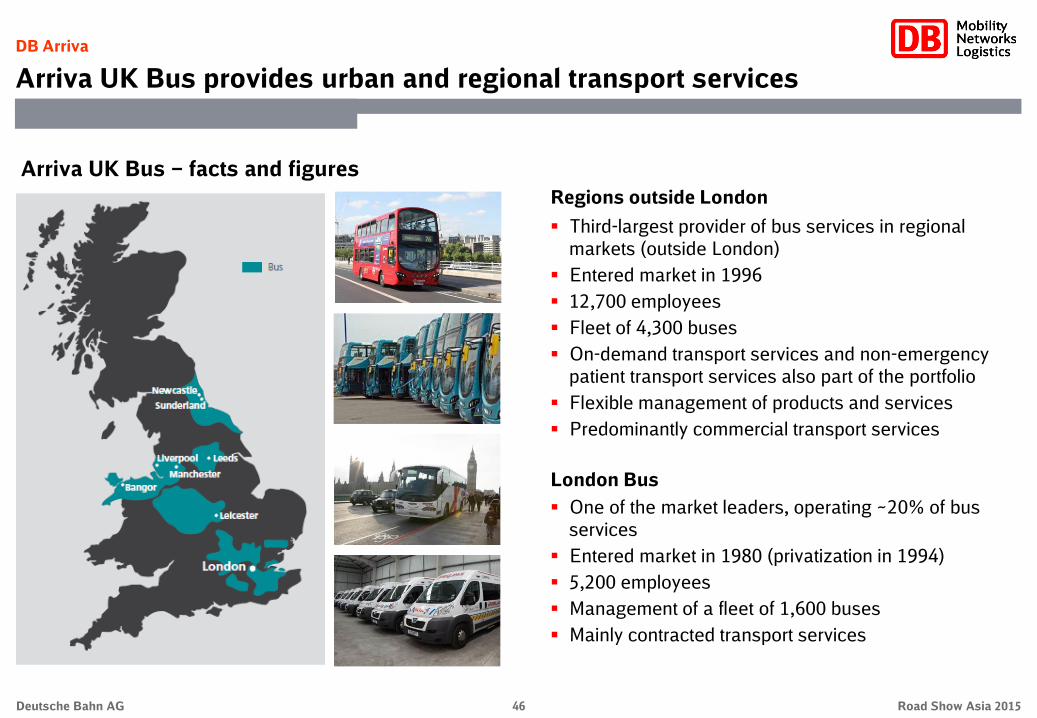
Arriva UK Bus – facts and figures
Third-largest provider of bus services in regional
markets (outside London)
Entered market in 1996
12,700 employees
Fleet of 4,300 buses
On-demand transport services and non-emergency
patient transport services also part of the portfolio
Flexible management of products and services
Predominantly commercial transport services
Regions outside London
One of the market leaders, operating ~20% of bus
services
Entered market in 1980 (privatization in 1994)
5,200 employees
Management of a fleet of 1,600 buses
Mainly contracted transport services
London Bus
DB Arriva
Arriva UK Bus provides urban and regional transport services

47 Road Show Asia 2015 Deutsche Bahn AG
DB Schenker Logistics
#2 among worldwide transport and logistics services provider
DB Schenker Logistics 2,000 locations in over 130 countries
99 million shipments sent per year via European land transport
1 million tons sent per year via air freight worldwide
2 million TEU sent per year via ocean freight worldwide
7 million square meters of warehouse space around the world
Fully integrated
network with 430
operational
branches
More than 720
locations in 36
countries with own
organizations
Own fleet with
around 26,000
trucks
Daily departures to
all European
terminals
Global presence
with 700 sites
worldwide
Worldwide network
with regional hubs
Organization of
"door-to-door"
transports
900 dedicated
charter flights p.a.
Global presence with
600 sites worldwide
Organization of
"door-to-door"
transport services
LCL services with
600 direct
connections
Global presence in
over 50 countries
Around 600
locations overall
7.1 million m2
warehouse space
Focus on industry
branches:
Automotive,
Consumer,
Electronics,
Healthcare,
Industrial
European land transport
Air freight Ocean freight Contract logistics

48 Road Show Asia 2015 Deutsche Bahn AG
DB Schenker Logistics
Global transport networks with 2,000 locations in over 130 countries
1) Based on revenues. 2) Based on t. 3) Based on TEU. 4) Air freight volume. 5) Ocean freight volume.
Shipments
Revenues
EBIT
98.9 mn
6,362
96
SQM
Revenues
EBIT
7.1 mn
2,030
79
TEU5)
Revenues
EBIT
2.0 mn
6,550
202
Tons4) 1.1 mn
EBIT adjusted 332
14,943
2014
‒0.9
+0.6
€ %
Change
‒3
+86
‒28.4 ‒95 Gross capital expenditures 240
2013
335
14,857
335
+1.2 +759 64,810 64,051
Revenues
Employees (Full-time employees)
Key figures (€ mn)

49 Road Show Asia 2015 Deutsche Bahn AG
Size is key for a high supply
density and for economies of
scale when purchasing
transport capacity
Door-to-door solutions thanks
to a global presence in 130
countries
Approximately 700,000 customers
with a wide range of industries
Large anchor customers and
small/medium-sized customers
Wide range of customers /
industries makes business less
prone to crisis
Own vehicles and swap bodies only
in parts of land transport
Predominately leased logistics
locations
Asset-light business model creates
flexibility
Land transport
Ocean freight Air freight
CL/SCM
Network business Broad customer base Asset-light business model
DB Schenker Logistics: business model
DB Schenker Logistics
Broad global customer base and an asset-light business model
50 Road Show Asia 2015 Deutsche Bahn AG
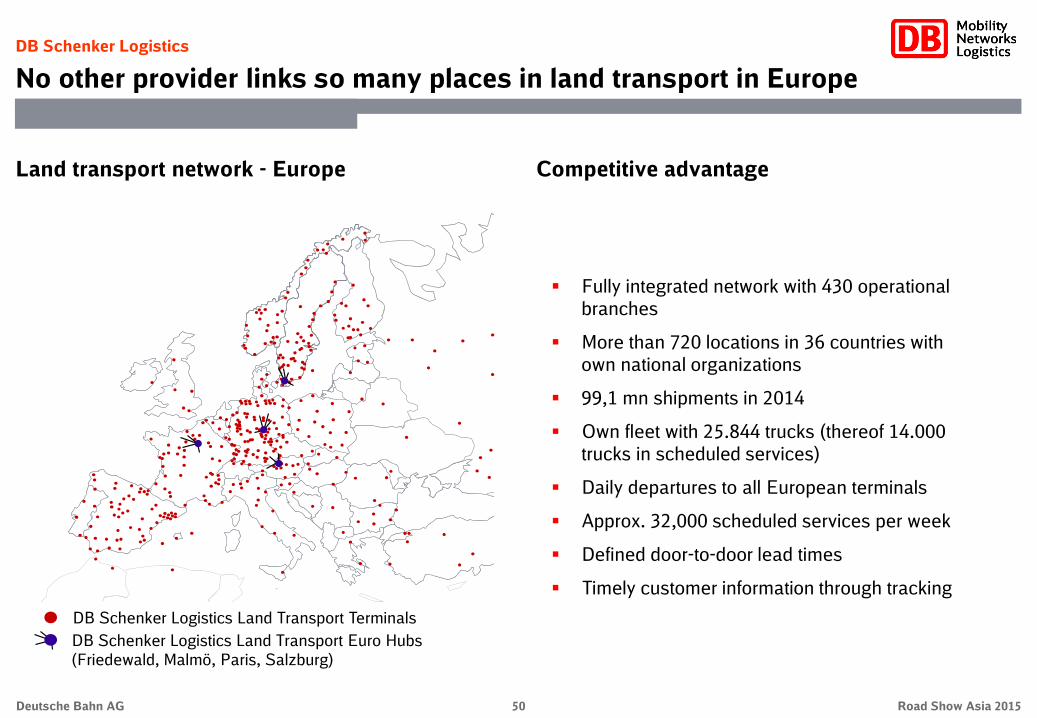
DB Schenker Logistics Land Transport Terminals
DB Schenker Logistics Land Transport Euro Hubs
(Friedewald, Malmö, Paris, Salzburg)
Fully integrated network with 430 operational
branches
More than 720 locations in 36 countries with
own national organizations
99,1 mn shipments in 2014
Own fleet with 25.844 trucks (thereof 14.000
trucks in scheduled services)
Daily departures to all European terminals
Approx. 32,000 scheduled services per week
Defined door-to-door lead times
Timely customer information through tracking
Land transport network - Europe Competitive advantage
DB Schenker Logistics
No other provider links so many places in land transport in Europe
51 Road Show Asia 2015 Deutsche Bahn AG
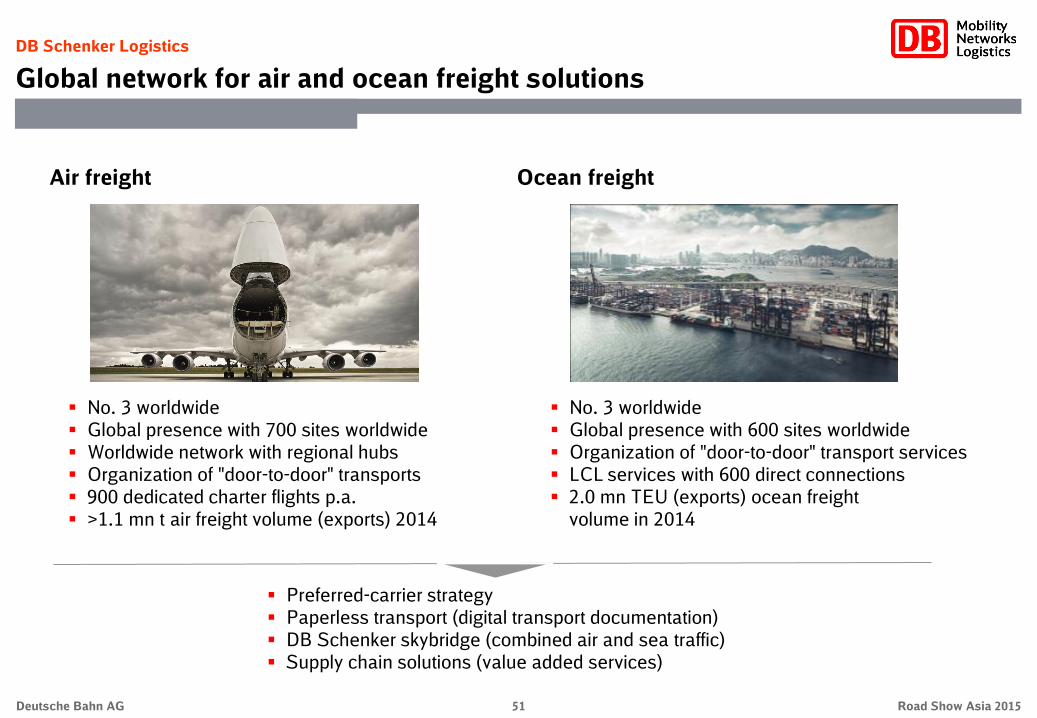
No. 3 worldwide
Global presence with 600 sites worldwide
Organization of "door-to-door" transport services
LCL services with 600 direct connections
2.0 mn TEU (exports) ocean freight
volume in 2014
Ocean freight
Preferred-carrier strategy
Paperless transport (digital transport documentation)
DB Schenker skybridge (combined air and sea traffic)
Supply chain solutions (value added services)
No. 3 worldwide
Global presence with 700 sites worldwide
Worldwide network with regional hubs
Organization of "door-to-door" transports
900 dedicated charter flights p.a.
>1.1 mn t air freight volume (exports) 2014
Air freight
DB Schenker Logistics
Global network for air and ocean freight solutions
52 Road Show Asia 2015 Deutsche Bahn AG
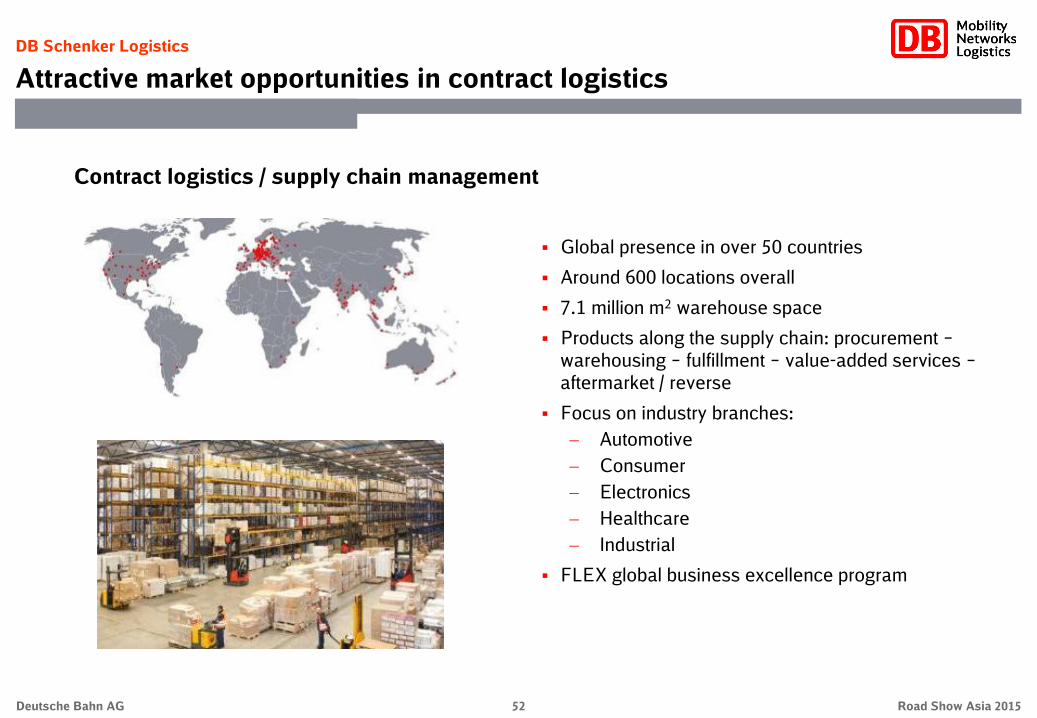
Contract logistics / supply chain management
Global presence in over 50 countries
Around 600 locations overall
7.1 million m2 warehouse space
Products along the supply chain: procurement –
warehousing – fulfillment – value-added services –
aftermarket / reverse
Focus on industry branches:
Automotive
Consumer
Electronics
Healthcare
Industrial
FLEX global business excellence program
DB Schenker Logistics
Attractive market opportunities in contract logistics

53 Road Show Asia 2015 Deutsche Bahn AG
DB Schenker Logistics
DB Schenker addresses digitalization with Logistics 4.0
1
2
3
4
Target picture:
Logistics market of the
future
Key developments
Business models
Competitive landscape
Product of the future
New digital solutions
Customer interface of the future
Optimized processes & assets
Asset intelligence
Workplace of the future
Data analytics
Enablers
DB Schenker Labs
Research cooperations
Customer innovation
projects
54 Road Show Asia 2015 Deutsche Bahn AG
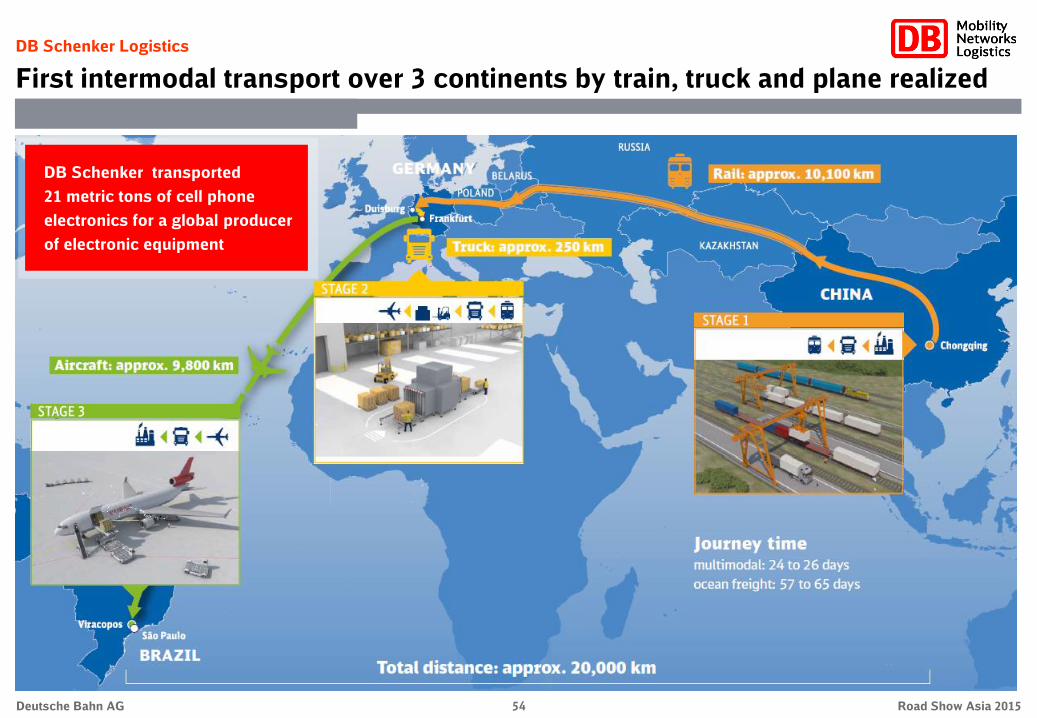
DB Schenker Logistics
First intermodal transport over 3 continents by train, truck and plane realized
DB Schenker transported
21 metric tons of cell phone
electronics for a global producer
of electronic equipment

55 Road Show Asia 2015 Deutsche Bahn AG
Leading position in Europe …
Market share 2014, % based on tkm
17
9
66 61
50 5
10
16 4
… and in individual markets
Market share 2014 per country, % based on tkm
67 2
1
32)
2 7
8
24
61)
41)
1) RCG und Trenitalia Cargo Group 2013; 2) Belgium: excluding Cobra (including Cobra market share about 29%)
DB Schenker Rail
DB Schenker Rail is perfectly positioned in Europe

56 Road Show Asia 2015 Deutsche Bahn AG
International network
alongside the major
European rail freight
corridors
Organizational benefits
from scale effects through
size
European
network
Clear sector and
customer focus
High asset
capex
Key industrial sectors: steel
& coal, chemicals,
automotive
Crude steel production as
an important driver of
results
Business mainly driven by
key accounts
Own production
Fleet1) of over 2,878
locomotives and around
89,383 wagons
High specialization of
rolling stock
SW
1) Own and finance lease
DB Schenker Rail
Significant core factors shape the business model of DB Schenker Rail

57 Road Show Asia 2015 Deutsche Bahn AG
Over 6,000 customers
Cross-border transports account
for about 60% of
DB SR’s revenue
Strong market position in
conventional transports with
special services, e.g. metals and
coal, chemicals and automotive
Building
Materials,
Industrial
&
Consumer
Goods Green Rail Automotive
Building Materials, Industrial &
Consumer Goods
Intermodal
Metals and Coal
Chemicals, Mineral Oil
and Fertilizers
DB SR
industry
sectors
DB Schenker Rail
DB Schenker Rail offers special industry solutions inline with customer needs

58 Road Show Asia 2015 Deutsche Bahn AG
1) DB Netze Projects is a service center within the Infrastructure division
DB Netze Track DB Netze Stations
DB Netze Energy DB Netze Projects1)
5,700 stations serve as railway gateways in Germany
33,300 km long rail network – three times as long as the German Autobahn network
25,000 bridges make its way through rivers and valleys
5th largest provider of energy in Germany – annual volume of available energy equal to energy consumed by Berlin metropolitan area
Infrastructure
DB Group operates the biggest rail network in the heart of Europe
59 Road Show Asia 2015 Deutsche Bahn AG
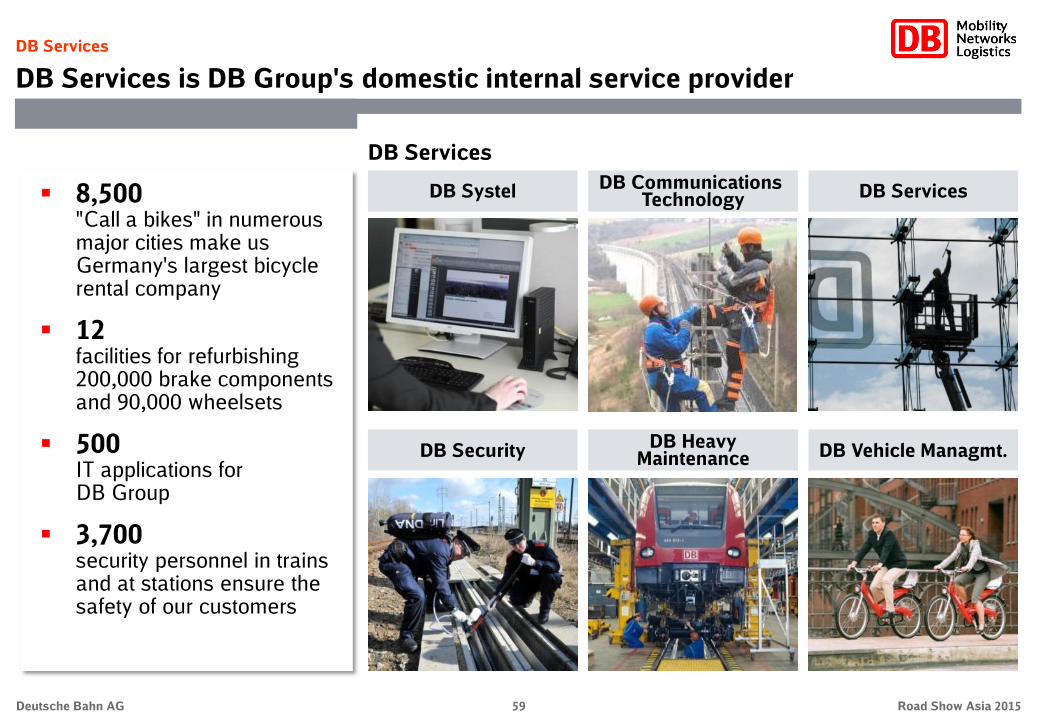
DB Heavy Maintenance
8,500 "Call a bikes" in numerous major cities make us Germany's largest bicycle rental company
12 facilities for refurbishing 200,000 brake components and 90,000 wheelsets
500 IT applications for DB Group
3,700 security personnel in trains and at stations ensure the safety of our customers
DB Services
DB Communications Technology DB Services
DB Security
DB Systel
DB Vehicle Managmt.
DB Services
DB Services is DB Group's domestic internal service provider
60 Road Show Asia 2015 Deutsche Bahn AG
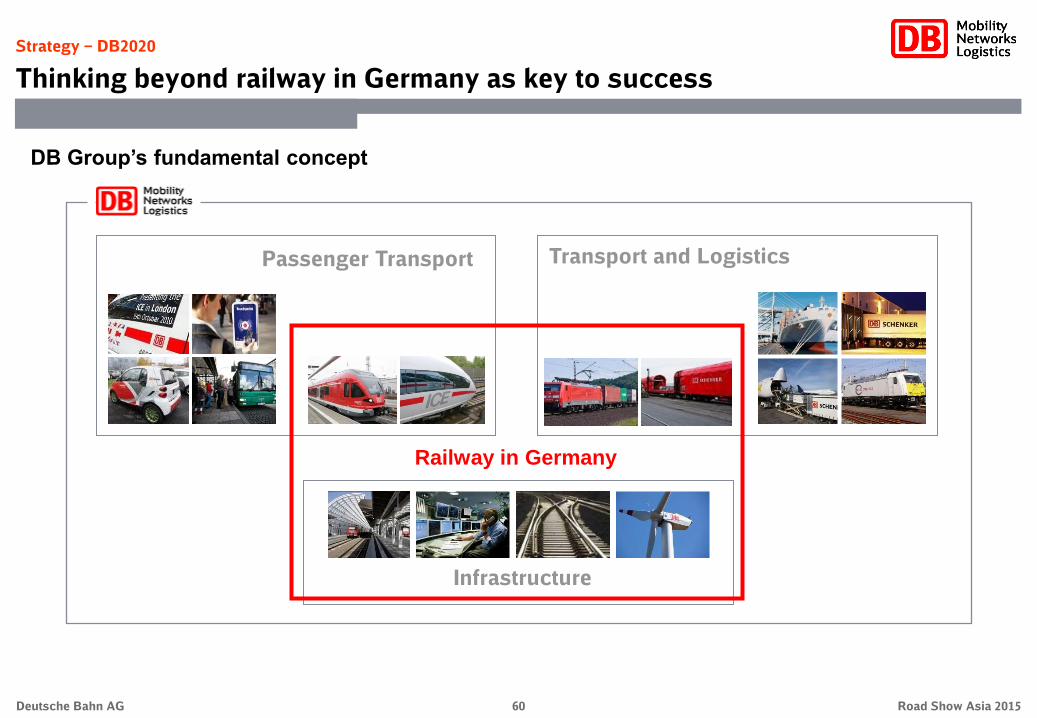
Strategy – DB2020
Thinking beyond railway in Germany as key to success
DB Group’s fundamental concept
Infrastructure
Transport and Logistics Passenger Transport
Railway in Germany

61 Road Show Asia 2015 Deutsche Bahn AG
Vision: vv
We are becoming the world’s leading mobility and logistics company (sustainable business success and social acceptance)
Dimensions Strategic directions
Resource
preservation /
emissions and
noise reduction
Cultural change /
employee
Satisfaction
Customer
and quality
Profitable
growth
Environmental
Eco-pioneer
Economic
Profitable
market leader
Social
Top employer
Strategy – DB2020
Bringing all three dimensions into harmony with each other

62 Road Show Asia 2015 Deutsche Bahn AG
DB Bahn
Long-Distance
DB Bahn
Regional
DB Arriva
DB Netze
Track
DB Netze
Stations
DB Netze
Energy
DB Schenker
Rail
DB Schenker
Logistics
DB
Services DB Bahn Sales
DB Netze
Projects
Following the successful implementation
on the Group level…
… DB2020 is established on the level of the
business units and service centers as well
Strategy – DB2020
DB2020 is established on the business level as well

63 Road Show Asia 2015 Deutsche Bahn AG
Strategy – DB2020
12 top targets were defined to implement our strategy
Profitable market leader
- Economic -
Top employer
- Social -
Eco-pioneer
- Environmental -
Top
targets
Profitability
Market position
Financial stability
Employee satisfaction
Appeal as an employer
Demographic preparedness
Reduction of CO2 emissions
Reduction of noise emissions
Material/resource efficiency
Customer and quality Profitable growth Cultural change/employee
satisfaction
Resource
conservation/emissions
and noise reduction
Strategic
directions
We are becoming the world’s leading mobility and logistics company Vision
Customer satisfaction
Product quality
Innovation (activity)
Integrated target system
Targets for 2020 set for DB Group
and the business units
Monitored regularly (on a quarterly basis)

64 Road Show Asia 2015 Deutsche Bahn AG
Strategy – DB2020
DB2020 offers us a broad base for growth in a complex environment
DB trend landscape
Environment increasingly
complex, but offers DB more
opportunities than risks
DB2020 is a broad-based
approach to management that
enables us to meet challenges
and seize opportunities
4 key areas: customer, society,
government and economy
Demographic
change
Urbanization Diverse life
patterns
Smart
Simplicity
Digital Life Performance society
Competition for
talent
Sovereign debt Regulatory
framework
Liberalization Rethinking transport
planning
Active citizens
Rise of emerging
markets
Real economic
volatility
Increasing regionali-
zation of trade flows
Declining mobility
purchasing power
Climate change Oil shortage
Electricity
turnaround
Youth without
own cars
Transport
innovations
Connected
transports
New value added
architectures in logistics
Sustainable
consumption
65 Road Show Asia 2015 Deutsche Bahn AG
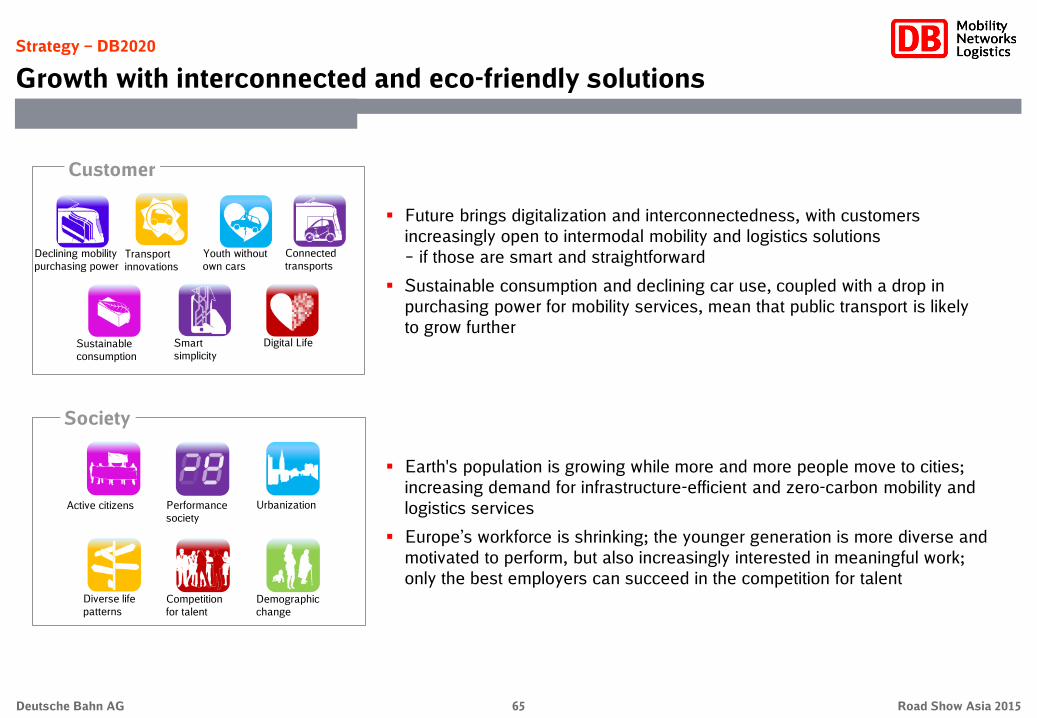
Strategy – DB2020
Growth with interconnected and eco-friendly solutions
Earth's population is growing while more and more people move to cities;
increasing demand for infrastructure-efficient and zero-carbon mobility and
logistics services
Europe’s workforce is shrinking; the younger generation is more diverse and
motivated to perform, but also increasingly interested in meaningful work;
only the best employers can succeed in the competition for talent
Future brings digitalization and interconnectedness, with customers
increasingly open to intermodal mobility and logistics solutions
– if those are smart and straightforward
Sustainable consumption and declining car use, coupled with a drop in
purchasing power for mobility services, mean that public transport is likely
to grow further
Society
Customer
Declining mobility
purchasing power Transport
innovations
Youth without
own cars
Connected
transports
Sustainable
consumption
Smart
simplicity
Digital Life
Active citizens Performance
society
Urbanization
Diverse life
patterns
Competition
for talent
Demographic
change

66 Road Show Asia 2015 Deutsche Bahn AG
Strategy – DB2020
Growth as a result of liberalization and the rise of emerging markets
Climate change and oil shortages are becoming reality; the risk of external
shocks is rising; the economy is becoming more volatile overall
Growth continues in emerging markets, in large parts due to continued
population growth; new, robust domestic markets are emerging
Rising importance of regional trade flows offers growth opportunities for
logistics
Governmental institutions are imposing tighter regulations; the public is
increasingly getting involved, e.g. in infrastructure projects
The electricity turnaround means a shift to renewable sources of power;
transport markets continue to open up for competition
Sovereign debt is making it harder to fund transport projects; at the local
level, however, people are rethinking transport planning, with a shift to more
interconnected and eco-friendly modes
Economy
Government
New value added
architectures in logistics
Rise of emer-
ging markets
Increasing regionali-
zation of trade flows
Real economic
volatility
Oil shortage
Sovereign
debt
Electricity
turnaround
Regulatory
framework
Liberalization
Rethinking
transport planning
Climate
change

67 Road Show Asia 2015 Deutsche Bahn AG
Strategy – DB2020
Program “DB2020 - Profitable Growth” is driven by the management board
Focus: safeguard
medium-term
planning (MTP) –
specifically relating
to measures for
specific business
units and across
business units
Focus: determine
future positioning
of Deutsche Bahn
– relating to
measures for growth
and innovations Initiatives 4.0
4
Business unit-
related
optimization
1
Optimization
across
business units
2
Group
portfolio
3
DB Bahn
Long-distance
DB Bahn
Regional
DB Services
DB Netze
Track
DB Arriva
DB Schenker
Logistics
DB Schenker
Rail
Procurement
Logistics 4.0
Group
management IT
Mobility 4.0
Future of the
rail system
Growth
prospects
Production 4.0 Infrastructure 4.0

68 Road Show Asia 2015 Deutsche Bahn AG
Digitalisierung verstehen wir als Chance! Initiativen 4.0 und
Competence Center gestalten die digitale Transformation bei der DB Mobility 4.0
Creation of new services focusing
on customer centricity, based on
scenarios for digital mobility markets.
Development of an innovation culture
as foundation.
Logistics 4.0
Development of services for future
needs, digital customer interfaces
and web-based production processes
based on big data und intelligent
assets.
Infrastructure 4.0
Digitalization of infrastructure by
systematic linkage with customers
and digital process improvements as
well as development of new business
models.
Working Environments 4.0
Focusing on interface topics like
working, communicating and
learning. Development of scenarios
for specific groups of jobs.
Production 4.0
Focusing on automation and
digitalization of rail operations and
maintenance.
IT 4.0
Development of a smart, agile,
effective, efficient and reliable IT
landscape for DB Group.
Competence Center Digitalization
Central platform for the coordination of and the exchange between the initiatives, CEO is patron
Strategy – DB2020
Digitalization offers huge opportunities for DB Group

69 Road Show Asia 2015 Deutsche Bahn AG
2014 Financial Year – Revenues
Development of comparable revenues on business unit level mostly positive
Total revenues (€ mn)
+739 +1.9 ‒107 +180
€ %
Change
+409 +2.8 –10 +321
+182 +3.8 – –
+52 +4.6 – –
+22 – –
‒49 ‒1.2 – –
‒7 ‒0.1 – –
+150 +3.6 –97 –116
‒12 – –
‒5 ‒0.1
‒3 +3.1 –
Consol.1) FX
Adjustments
39,793
15,254
4,951
1,172
2,797
4,034
8,831
4,278
3,172
4,838
‒9,534
39,720
2014 effective
4,951
1,172
2,797
4,034
4,491
3,172
4,863
‒9,534
2014 comp.
1) Changes in scope of consolidation.
39,054
2013 comp.
14,845
4,769
1,120
2,775
4,083
8,838
4,128
3,184
4,843
‒9,531
8,831
14,943
–25
–
‒0.4
+0.8
–
DB Group
DB Schenker Logistics
DB Netze Track
DB Netze Stations
DB Netze Energy
DB Bahn Long-Distance
DB Bahn Regional
DB Arriva
DB Services
DB Schenker Rail
Other / consolidation

70 Road Show Asia 2015 Deutsche Bahn AG
2014 Financial Year – Revenues
Revenue structure by divisions, activities and regions
2013
Germany Rest of
Europe
By divisions By activities By regions
Transport
and
Logistics Passenger
Transport
Infra-
structure Other
Rail Non-rail
Rest of world
North
America Asia /
Pacific 2014
Rail Non-rail
Germany
Rest of
Europe
Transport
and
Logistics
Passenger
Transport
Infra-
structure
Other Asia /
Pacific
North
America Rest of world

71 Road Show Asia 2015 Deutsche Bahn AG
2014
212
843
46
332
82
562
240
55
–528
2,109
265
2014 Financial Year – Profit development
Mixed profit development on business unit level
2014 (€ mn)
‒11
‒3
‒103
+11
‒16
‒33
‒127
Change absolute
‒
‒
7
–184
Extra ordinary
result
–142
24
92
–101
–32
‒
‒32
‒113
+62
‒9
‒9
+54
‒57
+14
‒16
‒67
‒109
+32
2013 Change
absolute
Operating profit after interest EBIT adjusted
323
777
57
335
29
665
229
71
–495
2,236
245
2013
212
794
–41
289
71
208
195
40
–713
1,285
230
2014
‒111
+66
+53
+20
325
732
‒32
298
17
265
181
56
–646
1,394
198
DB Bahn Long-Distance
DB Bahn Regional
DB Schenker Rail
DB Schenker Logistics
DB Services
DB Netze Track
DB Netze Stations
DB Netze Energy
Other / consolidation
DB Group
DB Arriva

72 Road Show Asia 2015 Deutsche Bahn AG
2014 Financial Year – Profit development
Differentiated EBITDA development across business units
Changes by business units (€ mn)
DB Group
EBITDA adjusted (€ mn)
DB Schenker Rail
DB Services
DB Netze Track
DB Netze Stations
DB Bahn Long-Distance
DB Bahn Regio
DB Netze Energy
DB Schenker Logistics
DB Arriva
2013
Other / Consolidation
‒103 ‒15.9%
+115 +8.6%
+31 +6.6%
‒9 ‒2.6%
+2 +0.4%
+59 +28.0%
‒53 ‒3.4%
+12 +3.3%
‒38 ‒23.6%
‒45 +9.5%
‒29 ‒0.6% 5,110
2014
343
270
1,503
375
546
1,452
123
520
498
‒520
5,139
352
211
1,556
363
649
1,337
161
518
467
‒475
73 Road Show Asia 2015 Deutsche Bahn AG
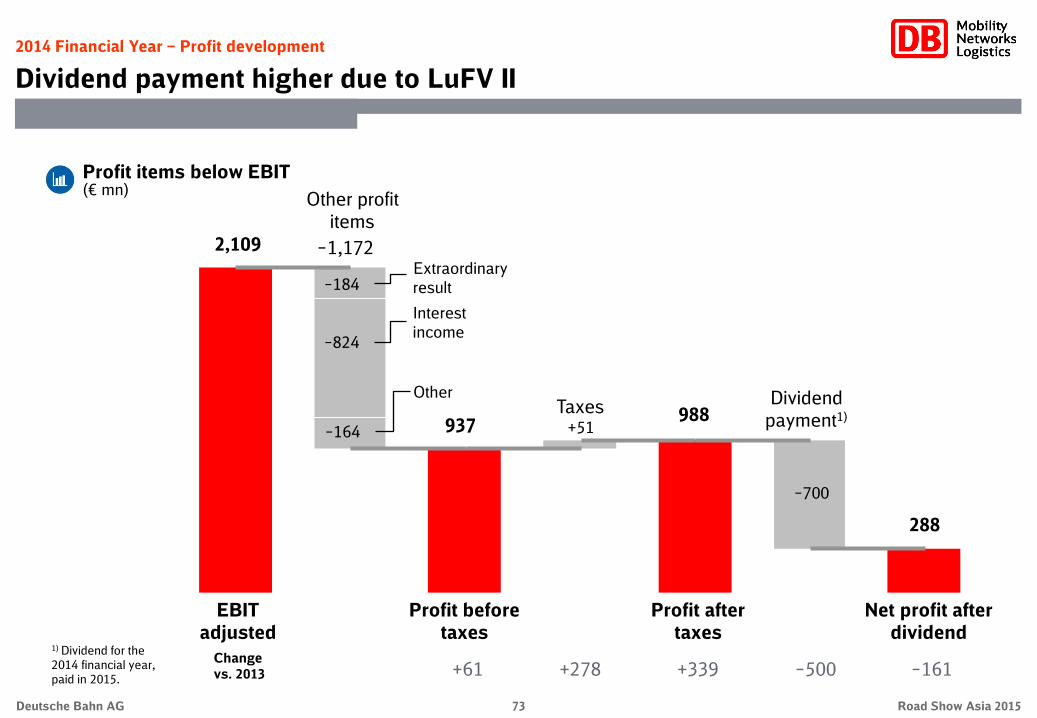
2014 Financial Year – Profit development
Dividend payment higher due to LuFV II
EBIT
adjusted
Profit before
taxes
Profit after
taxes
Net profit after
dividend
Other profit
items
Taxes Dividend
payment1)
2,109
937 988
288
Change
vs. 2013 +61 +278 +339 –500 –161
Interest
income ‒824
‒164
‒184
‒1,172
Other
Extraordinary
result
+51
‒700
1) Dividend for the
2014 financial year,
paid in 2015.
Profit items below EBIT (€ mn)

74 Road Show Asia 2015 Deutsche Bahn AG
2014 Financial Year – Profit development
Decline in operating profit
Adjusted income statement (€ mn) 2013
‒14,382
‒2,903
2,236
‒842
39,119
2,649
2,828
‒4,709
‒20,366
1,394
‒44
‒91
‒378
‒5
876
Change
‒312
‒98
‒127
+18
+601
+35
‒283
‒215
+145
‒109
‒33
‒4
+194
+13
+61
Thereof due to changes in scope of
consolidation
‒14
+23
+40
‒1
+42
+0
‒11
+23
‒23
+39
+0
‒
‒
‒
+39
Thereof due to exchange rate
effects
‒1
‒3
+7
‒1
‒180
+0
+10
+11
+170
+6
+4
‒2
+8
+0
+16
2014
‒14.694
‒3,001
2,109
‒824
39,720
2,684
2,545
‒4,924
‒20,221
1,285
‒77
‒95
‒184
8
937
Personnel expenses
Depreciation
Operating profit | EBIT adjusted
Net interest | Operating net interest
Revenues
Inventory changes and internally produced and
capitalized assets
Other operating income
Other operating expenses
Cost of materials
Operating profit after interest
Other financial result
PPA-Amortization customer contracts
Extraordinary result
Results from at equity investments | investment
income
Profit before taxes
5,139 ‒29 +17 +10 5,110 EBITDA adjusted

75 Road Show Asia 2015 Deutsche Bahn AG
2014 Financial Year – Balance sheet
Development of balance sheet
(€ mn, as of Dec 31)
Equity and liabilities
Assets
2014 + / ‒
Current assets 10,353 +1,408
Cash and cash equivalents 4,031 +1,170
Equity 14,525 ‒387
Non-current liabilities 28,527 +2,243
Current liabilities 12,831 +1,133
Non-current assets 45,530 +1,581
Total assets 55,883 +2,989
Assets
Equity and
liabilities
Non-current
assets
(81%, 2013: 83%)
Current assets
(19%, 2013: 17%)
Equity
(26%, 2013: 28%)
Non-current liabilities (51%, 2013: 50%)
Current liabilities
(23%, 2013: 22%)
Maturity structure (as of Dec 31, 2014)
€ 55.9 bn Total € 55.9 bn Total
Property, plant and equipment 39,022 +1,326
Trade receivables 4,146 +33
Intangible assets 4,195 +80
Deferred tax assets 1,604 +200
Financial debt 19,173 +1,107
Financial debt 1,161 ‒86
Trade liabilities 4,949 +570
2013
8,945
2,861
14,912
26,284
11,698
43,949
52,894
37,696
4,113
4,115
1,404
18,066
1,247
4,379

76 Road Show Asia 2015 Deutsche Bahn AG
45.7 45.3
22.924.4
2013 2014
7.5 6.9
7.98.9
2013 20142013 2014
53.254.0
31.033.5
2013 2014
2014 Financial Year – Order book
Order book in regional transport decreased
DB order book1) (€ bn; as of Dec 31, 2014)
84.2
‒3.3
‒3.8%
87.5
68.2 70.1
‒1.9
‒2.7%
1.2
+0.2
+20.0%
1.0
‒1.6
‒9.8%
14.8 16.4
DB Group DB Bahn Regional (rail) DB Bahn Regional (bus) DB Arriva
1) Secured and unsecured revenues. Unsecured revenues consist mainly of fare-box revenues.
Secured
Unsecured

77 Road Show Asia 2015 Deutsche Bahn AG
0.1
0.8
2.3
2.1 2.1 2.12.2
1.8
2.2
1.4
1.0
0.8
0.60.5
0.1
2015 2016 2017 2018 2019 2020 2021 2022 2023 2024 2025 2026 2028 2029 2072
2.0
2.42.2
2.1
2.5
2.2
0.6
1.81.71.7
2.2
1.2
1.0
00
2000 2001 2002 2003 2004 2005 2006 2007 2008 2009 2010 2011 2012 2013 2014 2015
Ratings
Very good ratings: Moody’s: Aa1 / stable
S&P: AA / stable
Key rating driver:
Improvements in performance, revenues and profits
Bond issues (€ bn)
Debt and financing
Rating and financing activities
Stable financial profile, sound financing structure and conservative funding strategy
DB guarantees overall mobility in Germany and is Europe‘s largest company providing integrated mobility, transport and logistics services
Federal obligations resulting from Art. 87e German Constitution “Infrastructure obligations”: High share in funding of infrastructure
capex in Germany,
“Public interest obligations”: Funds for ordering local passenger transport services in Germany, amounting to around € 7 bn p.a.
Privatization threshold: constitutionally mandated Federal majority shareholding (“ownership clause”)
Total: € 23.6 bn, Ø p.a.: € 1.6 bn
Maturity profile financial liabilities (as of June 30, 2015; € bn; incl. swaps)
Bonds EUROFIMA Bank / EIB Federal loans Leasing
≥1.6

78 Road Show Asia 2015 Deutsche Bahn AG
DB Group has to earn its
cost of capital (WACC) in the
mid-term; value generation:
ROCEs>WACCs
EBIT adjusted
Capital Employed
Operating cash flow
Adjusted net financial debt
Gearing Net financial debt / EBITDA
Calculation
Rationale
Targets
ROCE links requirements of controlling (success control, management instrument) with capital market requirements (derivability, acceptance)
Connection of cash flow and financial debt
Key figure in rating assessment process
Includes off balance sheet transactions
Debt figure for assess-ment of financing risks
Focus on relevant, directly manageable parameters (differently from equity capital quote)
Access to the capital markets / preservation of a broad fixed income investor base
Confirmation of credit ratings in the good investment grade area even on a stand alone
basis
2014 Target
Value management
Straight targets for yield management and creditworthiness
10.0%
= = =
30%
98%
Redemption coverage
ROCE
Equity
Net financial debt =
Net financial debt
EBITDA adjusted
Connection of cash flow and financial debt
Key figure in rating assessment process
Widely used in investment analysis
6.3%
10.0%
20.9%
30%
112%
3.2 2.5
100%

79 Road Show Asia 2015 Deutsche Bahn AG
Key financials – Track record
Track record driven by restructuring programs and portfolio measures
“Fokus” Restructuring of core business
“Qualify” Improve performance
“reACT” Coping with the crisis
Driver of changes in DB Group
(1) Internal – Major Group-wide programs
(2) External - major portfolio changes: total M&A transactions (EqV) of about € 11 bn (€ 4 bn divestitures and € 7 bn acquisitions)
2001 2002 2004 2005 2003 2006
Stinnes,
Joyau
BAX,
StarTrans
RAG Bahn
Brenntag,
Interfer,
Mitropa
2007
EWS
2008 … 2009
PCC
2010
NordCargo
SDS
Rail
freight
Logistics
Passen-
ger
transport
Divesti-
tures
DSB
Gods
Deutsche
Eisenbahn-
reklame
Scandlines,
Aurelis,
Nuclear Cargo
Linjegods Spain-Tir
Arcor
Arriva
Transfesa
Romtrans
Chiltern,
PanBus
2011
COBRA
Jean Heck
Grand
Central
2012
Suomen
Kiitoautot
Ambuline
Trans-
fracht
2013
Veolia
Eastern
Europe
2014
CupTour
Arriva Malta, The
Original London
Sightseeing Tour,
Waggonbau Niesky
80 Road Show Asia 2015 Deutsche Bahn AG
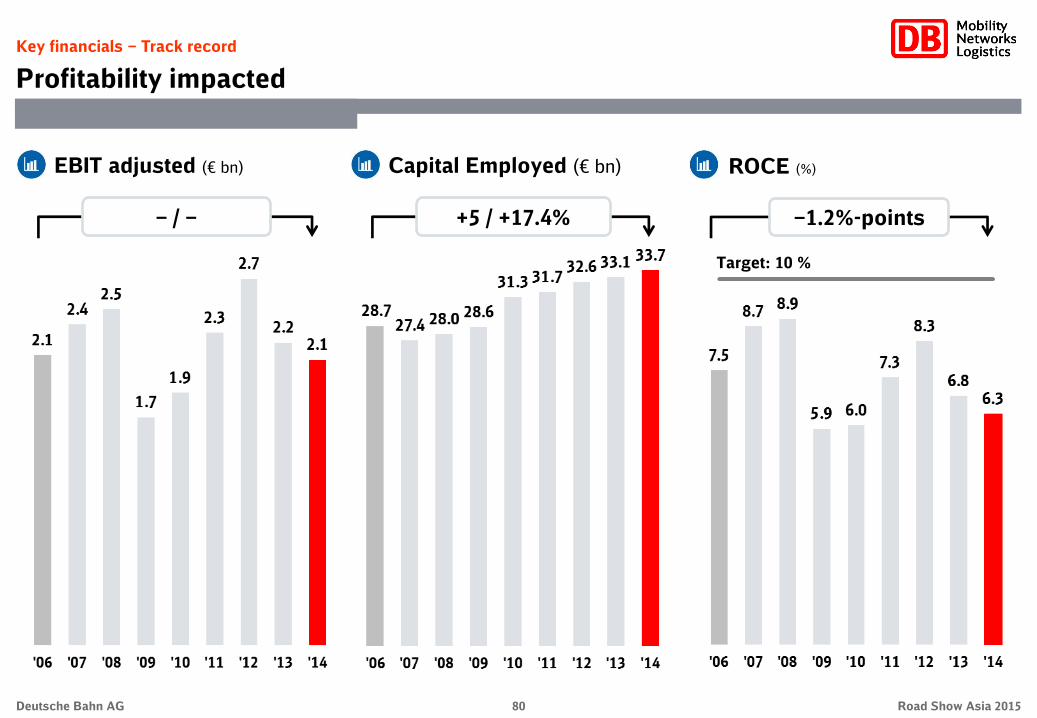
Key financials – Track record
Profitability impacted
EBIT adjusted (€ bn) Capital Employed (€ bn)
‒ / ‒ +5 / +17.4%
ROCE (%)
Target: 10 %
‒1.2%-points

81 Road Show Asia 2015 Deutsche Bahn AG
Key financials – Track record
Capital structure strengthened
Equity (€ bn) Net financial debt (€ bn) Equity ratio (%)
–3.4 / –17.3% +5.3 / +57.6% +7%-points

82 Road Show Asia 2015 Deutsche Bahn AG
Key financials – Track record
Financial stability improved
Redemption coverage (%)
Gearing (%)
Net financial debt / EBITDA (multiple)
Target: 30
Target: 100
Target: 2.5

83 Road Show Asia 2015 Deutsche Bahn AG
(€ mn)
Key financials – Track record
Development since 2000
2001
15,722
‒409
‒
41,962
7,110
3,307
Aa1/AA
109
214,371
74,459
84,716
‒
2002
18,685
‒438
‒
46,023
9,994
5,355
Aa1/AA
250,690
69,848
82,756
37
‒
2000
15,465
37
‒
39,467
6,892
3,250
Aa1/AA
222,656
74,388
85,008
450
‒
2003
28,228
‒133
‒
47,647
9,121
4,013
Aa1/AA
242,759
69,534
85,151
465
‒
2004
23,962
154
2,736
47,616
7,238
3,251
Aa1/AA
225,632
70,260
89,494
1,011
‒
2005
25,055
490
2,652
47,101
6,381
2,362
Aa1/AA
216,389
72,554
88,022
1,350
‒
2006
30,053
1,555
3,678
48,440
6,584
2,836
Aa1/AA
2,143
229,200
74,788
96,388
‒
2007
31,309
2,016
3,364
48,529
6,320
2,060
Aa1/AA
2,370
237,078
74,792
98,794
5,113
Revenues
Profit before taxes
EBITDA adjusted
Cash flow from operating activities
Total assets
Gross capex
Net capex
Ratings (Moody’s/S&P)
EBIT adjusted
Employees (as of Dec 31)
Rail passenger volume sold (mn pkm)
Rail freight volume sold (mn tkm)
2008
33,452
1,807
3,539
48,193
6,765
2,599
Aa1/AA
2,483
240,242
77,812
113,634
5,206
2010
34,410
900
3,409
52,003
6,891
2,072
Aa1/AA
1,866
276,310
78,582
105,794
4,651
2009
29,335
1,387
3,133
47,303
6,462
1,813
Aa1/AA
1,685
239,382
76,772
93,948
4,402
2011
37,901
1,359
3,390
51,791
7,501
2,569
Aa1/AA
2,309
284,319
79,228
111,980
5,141
2012
39,296
1,525
4,094
52,525
8,053
3,487
Aa1/AA
2,708
287,508
88,433
105,894
5,601
2013
39,107
876
3,730
52,894
8,224
3,412
Aa1/AA
2,236
295,653
88,746
104,259
5,139
2014
39,728
937
3,896
55,883
9,129
4,442
Aa1/AA
2,109
295,763
88,407
102,871
5,110
84 Road Show Asia 2015 Deutsche Bahn AG
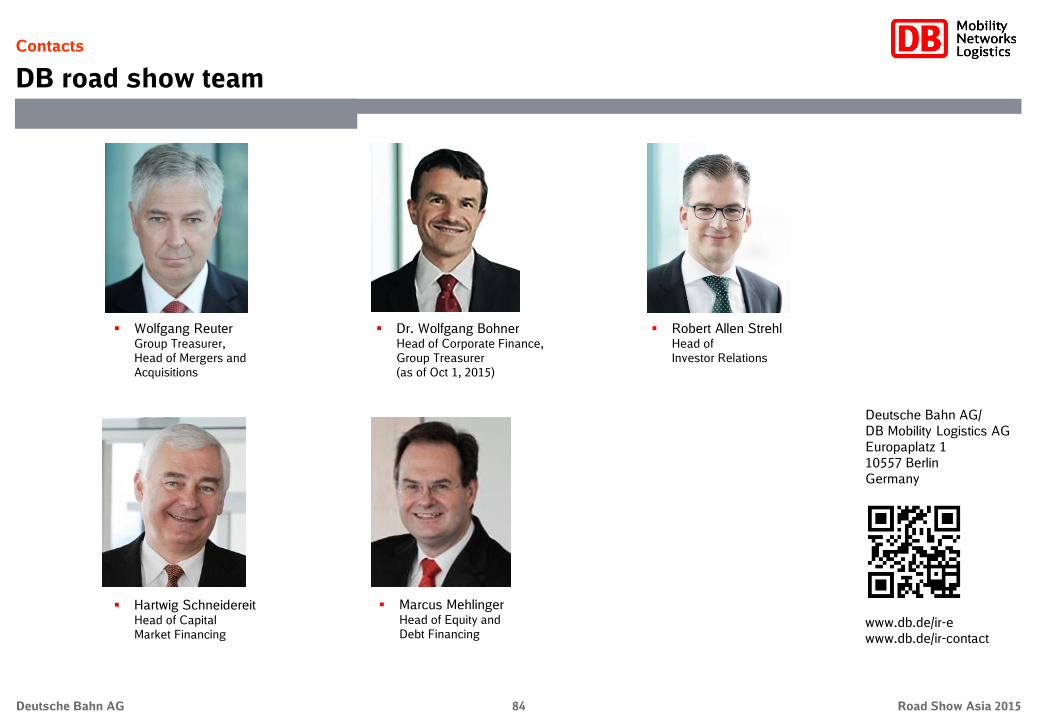
Deutsche Bahn AG/
DB Mobility Logistics AG
Europaplatz 1
10557 Berlin
Germany
www.db.de/ir-e
www.db.de/ir-contact
Contacts
DB road show team
Wolfgang Reuter Group Treasurer,
Head of Mergers and
Acquisitions
Hartwig Schneidereit Head of Capital
Market Financing
Robert Allen Strehl Head of
Investor Relations
Dr. Wolfgang Bohner Head of Corporate Finance,
Group Treasurer
(as of Oct 1, 2015)
Marcus Mehlinger Head of Equity and
Debt Financing

85 Road Show Asia 2015 Deutsche Bahn AG
Appendix
Disclaimer and photo credits
This information contains forward-looking statements or trend information that are based on current beliefs and estimates of Deutsche Bahn AG’s/DB Mobility Logistics
AG´s management and involves known and unknown risks and uncertainties. They are not guarantees of future performance. In addition to statements which are
forward-looking by reason of context, including without limitation, statements referring to risk limitations, operational profitability, financial strength, performance targets,
profitable growth opportunities, and risk adequate pricing, as well as the words "may, will, should, expects, plans, intends, anticipates, believes, estimates, predicts, or
continue", "potential, future, or further", and similar expressions identify forward-looking statements. These forward-looking statements are subject to certain risks and
uncertainties that could cause the Company's actual results or performance to be materially different from those expressed or implied by such statements. Many of these
risks and uncertainties relate to factors that are beyond Deutsche Bahn AG’s/DB Mobility Logistics AG’s ability to control or estimate precisely, e.g. future market and
economic conditions and the behavior of market participants. Deutsche Bahn AG and DB Mobility Logistics AG do not intend or assume any obligation to update these
forward-looking statements. This document represents the Company‘s judgment as on the date of this presentation.
Cover page – Max Lautenschläger
Page 3 – Max Lautenschläger
Page 4 – Oliver Lang, Max Lautenschläger
Page 5 – Arne Lesmann, Georg Wagner
Page 6 – Jo Kirchherr, Norbert Basner, Claus Weber, ClipDealer (#70420), S. Müller
Page 7 – From the left: Andrey Popov – Fotolia, Fernbus, DB AG (3-4), vege – Fotolia, Axel Hartmann, Ralf Braum, DB ...AG,
Snipview,DB AG
Page 9 – Tom Hanisch-Fotolia, Max Lautenschläger, Max Lautenschläger, Bartlomiej Banaszak, Michael Neuhaus, Heiner
Müller-Elsner, Max Lautenschläger, Max Lautenschläger, Max Lautenschläger, Max Lautenschläger
Page 10 – Frank Kniestedt
Page 11 – DB AG/Siemens AG, DB AG/Bombardier
Page 12 – DB Vertrieb (background), Jo Kirchherr, Ralf Braum, Hartmut Reiche
Page 28 – Max Lautenschläger, Jet-Foto Kranert, Christian Bedeschinski, Wolfgang Klee
Page 30 – Left row from above: Marc Darchinger, Oliver Lang, Andreas Mann; right row from
above: Marc Darchinger, Pablo Castagnola, Max Lautenschläger
Page 33 – From left: Uwe Miethe, Maurice Weiss, Günter Jazbec
Page 34 – First row from left: Stefan Warter, Max Lautenschläger, Ralf Braun; second row from left: DB Arriva, DB Arriva,
Hartmut Reiche
Page 35 – Jo Kirchherr
Page 37 – DB AG/Bombardier, DB AG/Siemens AG
Page 38 – Uwe Miethe (background), DB AG/Siemens AG, DB AG/Bombardier
Page 39 – Claus Weber
Page 40 – From left: Siemens AG, Gerhard Linnekogel, Siemens AG
Page 41 – DB AG/Bombardier, Gerhard Linnekogel, Christian Dittmer
Page 43 – DB AG, DB AG/Bombardier, André Werske
Page 46 – DB Arriva
Page 47 – DB Arriva, Oliver Lang, DB Arriva, Oliver Lang, Christiane Ziegler, DB Arriva
Page 48 – DB Arriva
Page 49 – Bartlomiej Banaszak, Christian Bedeschinski
Page 50 – Bartlomiej Banaszak, Christian Bedeschinski
Page 51 – Land transport: Michael Neuhaus; air freight: Ralf Braum; ocean freight: Michael Neuhaus; contract logistics: Stefan Warter
Page 53 – From left: Rüdiger Nehmzow, Kai-Uwe Grundlach
Page 54 – Karl-Friedrich Heisterkamp
Page 55 – DB Schenker
Page 58 – Left row from left: Hans-Joachim Kirsch, Wolfgang Klee; Right row: Claus Weber
Page 59 – Automotive: Michael Neuhaus; metals and coal: Wolfgang Klee; chemicals, mineral oil and fertilizers: Hans-Joachim
Kirsche; building materials, industrial & consumer goods: Margit Brettmann; intermodal: Michael Neuhaus
Page 60 – First row from left: Wolfgang Klee, Georg Wagner; second row from left: Michael Neuhaus, Stefan Warter, Heiner Müller-
Elsner, Michael Neuhaus
Page 61 – First row from left: Thorsten Doerr, Berger, Petra Schwaiger; second row from left: KRANERT, Jürgen Brefort, Ralph Winn
Page 62 – First row from left: Bartlomiej Banaszak, Magnus Winter, Michael Neuhaus, Michael Neuhaus; second row from left: Hartmut
Reiche, DB Arriva, Rainer Garbe, Thomas Herter, Georg Wagner, Michael Neuhaus, Ralf Braun; third row from left:
Wolfgang Klee, Mario Vedder, Günter Jazbec, Michael Neuhaus
Page 63 – Max lautenschläger
Page 64 – First row from left: (1) Pablo Castagnola, (2-5) Max Lautenschläger; second row: (1-4) Max Lautenschläger
Disclaimer
Photo credits