mum tu '-f------
TRANSCRIPT

AD-756 860
STOL TRANSPORT THRUST REVERSER/VEITORING PROGRAM. VOLUME I
John E. Petit, et al
Boeing Company
Prepared for:
Air Force Aero Propulsion Laboratory
February 1973
DISTRIBUTED BY:
mum Tu '-f----"--
U. & DEPARTMENT OF ICOMERCE5285 Port Royal Road, Springfield Va. 22151
I
AFAPL-TR-72-109Volpoe I
STOL TRANSPORT THRUST REVERSE RNECTORIONG PROGRAM
John E. PFait
Todmical Riport AFAPL-TR-72-109, Volume Ififtusy 1073
RoprodcedI hy
NATIONAL TECHNICALINFORMATION SERVICE
U S D~po,,--io 0f Comr~c1 A 721 it
Approval fat public tolow tse;4libut*~ uilimitu
Air Force Amr Nrpuihi~o LobwtryAir forceSysasm 'Commead
Wv, **t-Pstb= Air Foce So ImOh O NR 9o3
B
NOPTIC'E
When Government drawings, specifications, or other data are used for anypurpose other than in connection with a definitely related Go iernmer. procur,.-ment operation, the United States Government thereby incurý; no responsibilitynor any obl!f-ion whatsoever; and the fact that the government may haveformulatcd, furnished, or in any way supplied the said drawings, snecificationsor other data, is not to be regarded by implication or otherwise as anymanner licensing the holder or any other person or corroration, or conveyingany rights or prrn.isskn to manufacture, use, or sell any patented inventio%.that mly in any way be related thereto.
)
Copies of this report should not be returned unless return is required bysecurity considerations, contractual obliatlons, or notice on a specificdocument.
•:. ••:•4

UinelAsaffied
DOCUMENT CONTROL DATIA, R & D10 'N es,,C la s i, t'sn -tl Im.je. Is.. Ia s t,, *.l sa � ., . s I. III cen. -al . .Is Itrs,- ,v. r.,11 epswt I% elassiftediS
IO~eRIGNA ?IN(,. Ac ?svi TV I( o l.rallste I.t"..RT.~ Ns etsn YC1g.ag,S1CATION
The Boeing Compan~y, Box 3999, Seattle, Washington -CRU
STOL Transport Thrust Rleverser /Vectoring Program, Volume I
July 1971 - November l1972. FinalRe~ Volume I* Ass Tm7*40K '*tf ir" ' n-b". ..... is ) t.I't '
John E. Petit and Mahatel B. Scholey
* At P1OR, sA~ft 11 JAt .10 OF $AC.Il 'IT No Of NEFI
December 1972 -M0 1,48
F33615-71-C-1850b 0,01jf C 0.0 None
643A _____
it 1-~ s -' It N EPORT -60411 Any w~hee nsuffe,0at hwal maya be iiusind"OIthe' P'~PeI)
It AFA4PL-TR-72-109 Volume I10 nisaSifetaj"ON SVA~TIFnl"
[OtL.IIS Me ieiitatlfl N911 "ie t inI. PO',.1O4ING WsLI ?&R Ac ss
this document may be b~tte Air Force Aero Propulsion laboratorystudied on mcf"Wright- Patterson AFB, Ohio 45433
Existing data were reviewed for application to computer programs to predict TR/TVperformance and evaluating TR/TV influence on the total airplane system. Three programswere developed: 1) Jet Trajectory and Spreading Program -- to predict the shape andtrafotory of the TR/TV exhaust plume, 2) Reingestion Prediction Program - - to predictthe onset of reingestlon, and 3) TR andi TV System Performance and effect of TR/TVoperation on engine stability margin. Static tents were conducted to determine multibearingthrust vectoring nozzle performanc~e and bloclce. d!oo geometry effects on annular cascadethrust reverser performance. Results were incorporated in the TR and TV SystemPerformance Program. The programs provide relatively simple design tools to evaluateTR/TV performance and to determine potential exhausttflow Interfersice and reingestlondata to STOL transport configurations is limited. low speed wind tunnel testing isrecommended to obtain this type of data.
DD NOV 411435caele

Security Classification
4 I.' 1 iP I INK 0 LINK CKE[Y flONa - - -
ROLE WT =OLE 0. ROLE w T
Thrust Reverser
Thrust Vectoring
Nozzles
Turbine Engines
Transport Aircraft
S/
II
- - -
IUnclnasifi ed _____
STOL TRANSPORT THRUST REVERSER/VECTORING PROGRAM
VOLUME I
John E. Petit
Michael B. Scholey
This document has been approved for publicrelease, its distribution is unlimited.

FOREWORD
This report was prepared by Michael B. Scholey and John E.Petit of the Research and Engineering Division, AerospaceGroup, The Boeing Company, Seattle, Washington. The workwas conducted under USAF Contract F33615-71-C-1850, "STOLTransport Thrust Reverser/Vectoring Program," Project 643A"Tactical Airlift Technology," Task 63205F "Flight VehicleSubsystem Concepts." The program was administered by theAir Force Aero Propulsion Laboratory, Wright-PattersonAir Force Base, Ohio with Captain J. W. Schuman andMr. R. J. Krabal (AFAPL/TBP), as Project Engineers. Sub-contract support was provided by Pratt & Whitney Aircraftwith H. Kozlowski as the Project Engineer.
This is the first of a two-volume final report submittedunder the contract. Volume I covers work conducted duringPart IA - Data Review and Analysis, from July 1971 throughApril 1972. Volume II covers work conducted during Part IB- Design and Part IC - Model Testing from July 1971 throughOctober 1972. The final report was submitted to theAir Force in November 1972.
The authors acknowledge the following personnel for theirassistance during the program: T. W. Wainwright,Airbreathing Propulsion; R. L. Wilson and L. J. Kimes,Propulsion Project; N. L. Prewitt, Boeing Computer ServicesInc., and K. Ikeda and W. J. Stamm, Propulsion/NoiseLaboratories. A special acknowledgement is due toM. E. Brazier, Chief, Propulsion Technology for hiscontinuing interest and significant contributions to theprogram.
This technical report has been reviewed and is approved.
BC Sinwp ynDirector, Turbine Engine DivisionAir Force Aero PropulsionLaboratory
ii

w8
TABLE OF CONTENTS
Page
I. INTRODUCTION AND SUMMARY 1
II. PART IA - DATA REVIEW AND ANALYSIS 4
2.1 Task 1.1--Review and Correlate TR/TV 4Data
2.1.1 Cruise Nozzle Data Correlations 6
2.1.2 Thrust Reverser Data Correlations 23
2.1.3 Thrust Vectoring Nozzle rata Correlations 37
2.1.4 Casacde Lattice Loss Correlations 55
2.2 Task 1.2--Construct Computerized 69Analytical Models
2.2.1 Jet Trajectory and Spreading Program 70
2.2.2 Reingestion Prediction Program 96
2.2.3 TR and TV System Performance Program 134
2.3 Task 1.3--Plan and Conduct Supplemental 144Tests
2.3.1 Identification of Technology Voids 144
2.3.2 Supplemental Static Tests 145
III. CONCLUSIONS AND RECOMMENDATIONS 166
IV. COMPUTER PROGRAM USAGE 169
3.1 Jet Trajectory and Spreading Program 169Usage
3.2 Reingestion Prediction Program Usage 183
3.3 TR and TV System Performance Program 187Usage
APPENDIX I CHANG'S THEORY FOR THE ROLLUP OF A 216JET IN A CROSSFLOW
APPENDIX II PROGRAM SAMPLE CASES 222
REFERENCES 278
v Preceding pag tank

LIST OF ILLUSTRATIONS
FIGURE TITLE PAGE
1 Effect of Wall Angle on Velocity Coefficient for 9Conical Nozzles, DI/D 2 = 1.1
2 Effect of Wall Angle on Velocity Coefficient for 10Conical Nozzles, DI/D 2 = 1.25
3 Effect of Wall Angle on Velocity Coefficient for 11Conical Nozzles, D1 /D 2 = 1.6
4 Effect of Wall Argle on Velocity Coefficient for 12Conical Nozzles, D1 /D 2 = 1.93
5 Effect of Nozzle Offset on Velocity Coefficient 13Losses
6 Theoretical Velocity Coefficient Underexpansion 14Losses for Convergent Nozzles at SupercriticalPressure Ratios
7 Experimental Discharge Coefficient Curves for 15Convergent Conical Nozzles
8 Parametric Study of Conical Convergent Nozzles 16CD Choke
9 Effect of Nozzle Offset on Annular Nozzle Velocity 18Coefficient Losses
10 Theoretical Discharge Coefficient Curves Using 19Bragg's Theory
11 Maximum Velocity Coefficient Correlation for 21Suppressor Nozzles
12 Clamshell Target Thrust Reverser Geometric Variables 24
13 Clamshell Target Thrust Reverser Geometric Variables 25
14 Effect of Setback Ratio on Static Reverser Efficiency, 26Clamshell Target Thrust Reverser
15 Effec; of Door Length on Static Reverser Efficiency, 27Clambhell Target Thrust Reverser
16 Effect of Lip Height on Static Reverser Efficiency, 28Clamthell Target Thrust Reverser
17 Effect of Sweep Angle on Static Reverser Efficiency, 29Clamshell Target Thrust Reverser
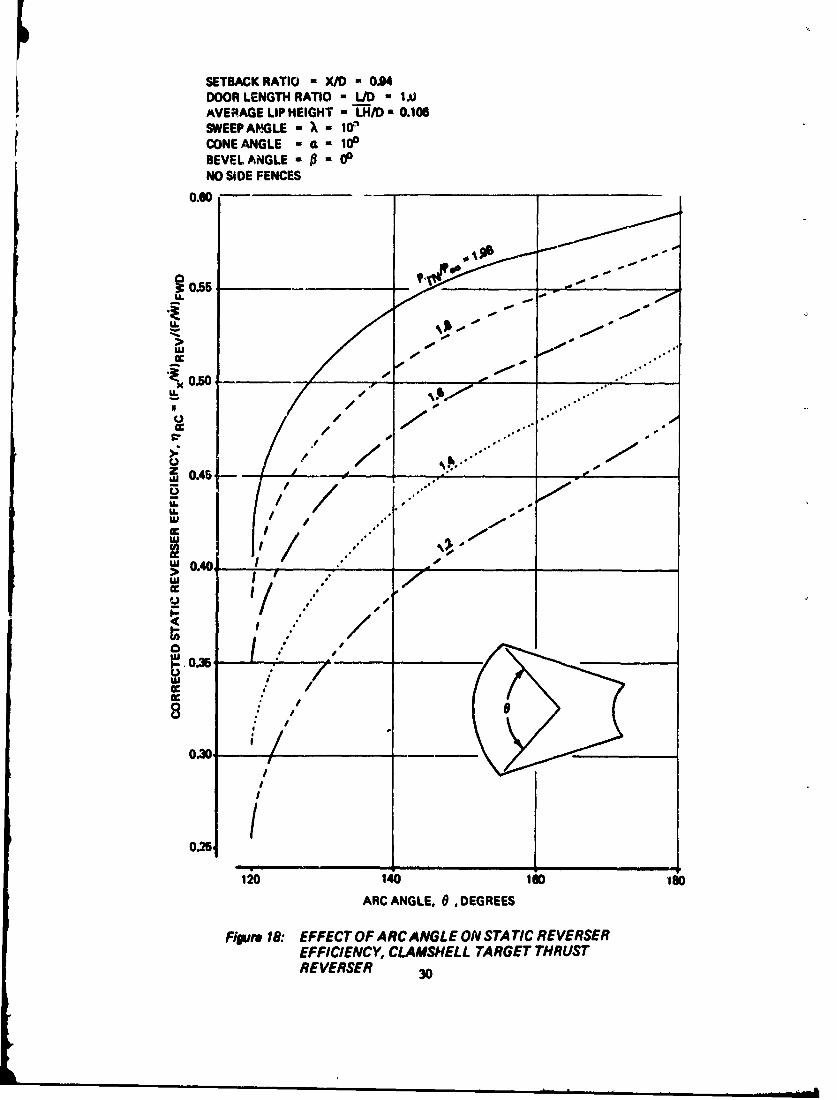
18 Effect of Arc Angle on Static Reverser Efficiency, 30Clamshell Target Thrust Reverser
vi

LIST OF ILLUSTRATIONS (Cont.)
FIGURE TITLE PAGE
19 Effect of Cone Angle on Static Reverser 31Efficiency, Clamshell Target Thrust Reverser
20 Effect of Bevel Angle on Static Reverser 32Efficiency, Clamshell Target Thrust Reverser
21 Effect of Setback Ratio on Airflow Match, 34Clamshell Target Thrust Reverser
22 Clamshell Target Thrust Reverser Baseline 35Performance
23 Effect of Blockage and Door Angle on Corrected 36Reverser Efficiency Annular Target ThrustReverser
24 Effect of Door Setback on Airflow Match Annular 38Target Thrust Reverser
25 Discharge Coefficient Correlation Annular 39Target Thrust Reverser
26 Baseline Performance for Blocker-Deflector 40Thrust Reverser
27 Effect of Blocker Door Cone Angle on Blocker- 41
Deflector Thrust Reverser Performance
28 Single Bearing Nozzle Nomenclature 43
29 Single Bearing Nozzle Thrust Component 44Relationships
30 Single Bearing Nozzle Performance 46
31 Spherical Eyeball Nozzle Performance 47
32 Lobstertail Nozzle Performance for 95 Degree 49Vector Angle
33 Effect of Vector Angle and Nozzle Pressure Ratio 50on Lobstertail Nozzle Performance
34 Effect of Deflection Angle on Flat Plate and 01Curved Deflector Performance
35 Effect of Nozzle Pressure Ratio and Deflection 52Angle on Curved Deflector Performance
vii

LIST OF ILLUSTRATIONS (Cont.)
FIGURE T ITLE PAGE
36 Effect of Flat Plate Length on Jet Deflection 53Angle
37 Mitre Bend Data, Contraction Coefficient Vs 54Setback Di3tance
38 Cascade Blade Nomenclature 56
39 Profile Losses for Reaction Blades at Zero 57incidence
40 Profile Losses for Impulse Blades at Zero 58Incidence
41 Variation of Stalling Incidence and Flow Outlet 59Angle with Pitch/Chord Ratio
42 Variation of Stalling Incidence with Blade Inlet 60Angle and Flow Outlet Angle
43 Variation of Loss and Outlet Angle with Incidence 62
44 Variation of Flow Outlet Angle with Mach Number 63and Blade Trailing Edge Curvature
45 Variation of Relative Profile Loss with Mach Number 64and Trailing Edge Curvature
46 Effects of Reynolds Number on Profile Losses for 65Cascade Lattices
47 Effects of Reynolds Number on Flow Outlet Angle 66for Cascade Lattices
48 Correlation Relating Reaction and Momentum Thickness 67
for Cascade Lattices
49 Form Factor Data for Cascade Lattices 68
50 STOL Transport Thrust Reverser Plume Side View 71
51 STOL Transport Thrust Reverser Plume Front View 72
52 STOL Transport Thrust Reverser Plume Plan View 73
53 Jet Trajectory and Spreading Program Diagram 74
54 Com.parison of Jet Trajectory Equation with Data 77for 0,- 135 Degrees
viii
LIST OF ILLUSTRATIONS (Cont.)
FIGURE TITLE PAGE
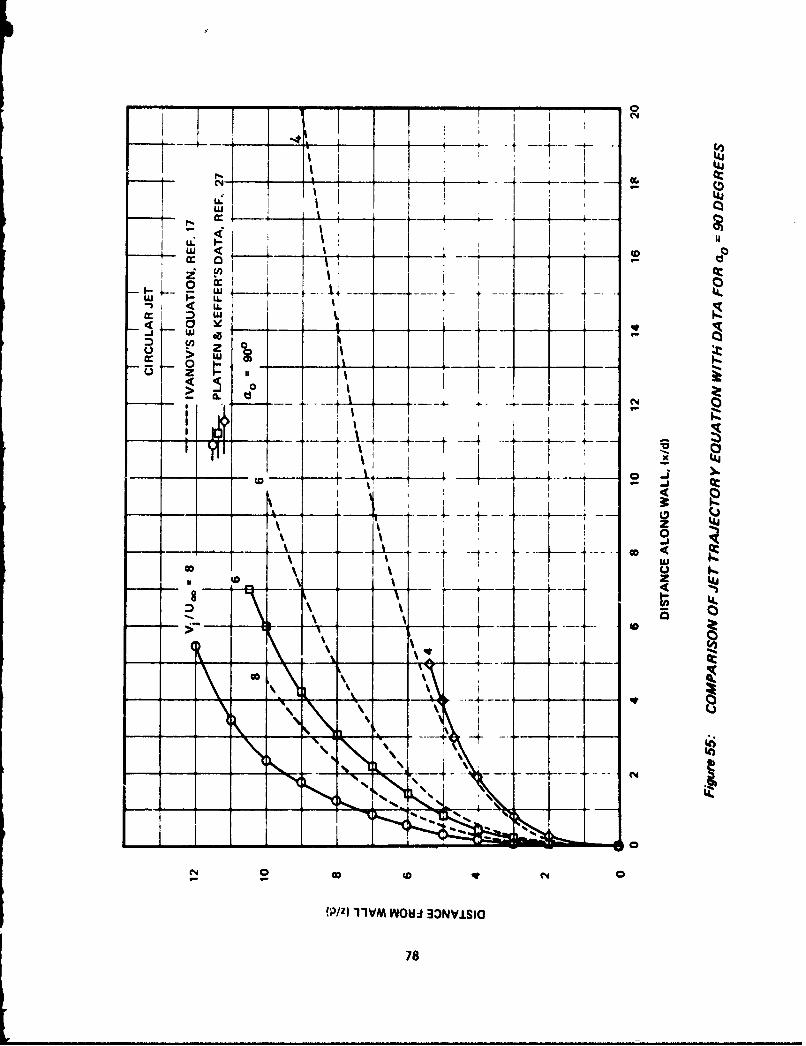
55 Comparison of Jet Trajectory Equation with Data 78for 01= 90 degrees
56 Comparison of Jet Trajectory Equation with Data 79for 06= 45 Degrees
57 Jet Penetration Coefficieut Data for Vizel and 80Mostiaskii's Trajectory Equation
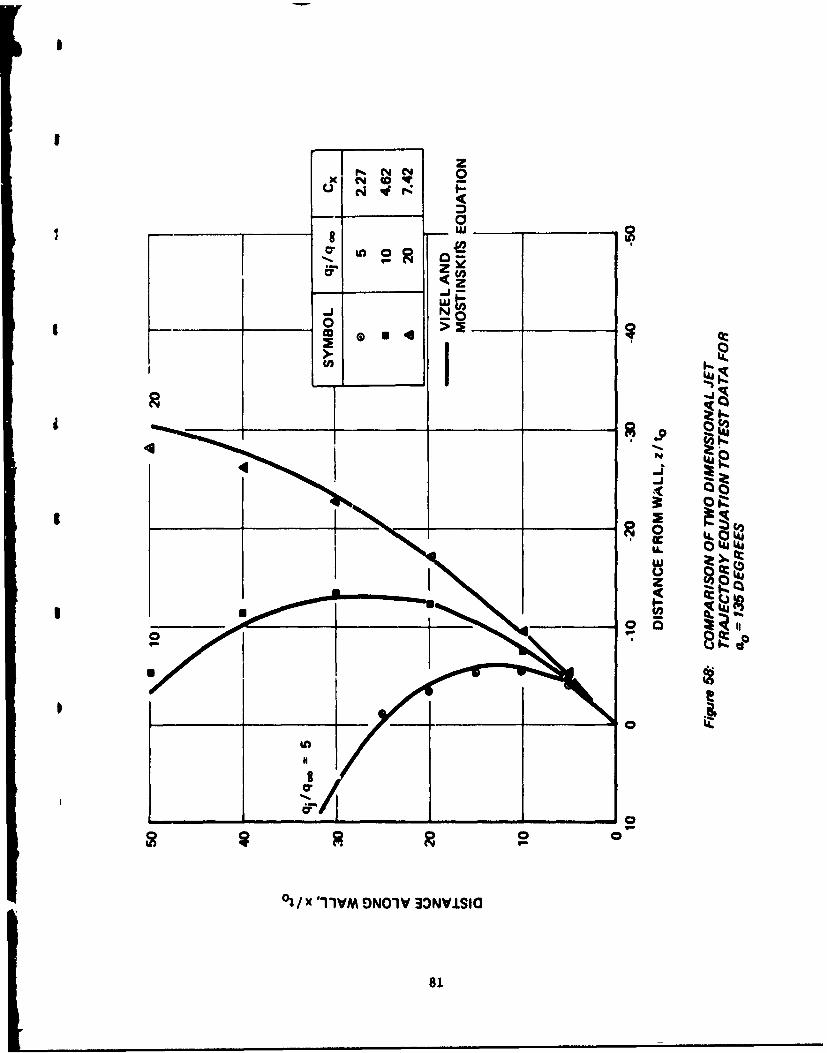
58 Comparison of Two Dimensional Jet Trajectory 81Equation to Test Data for 0,= 135 Degrees
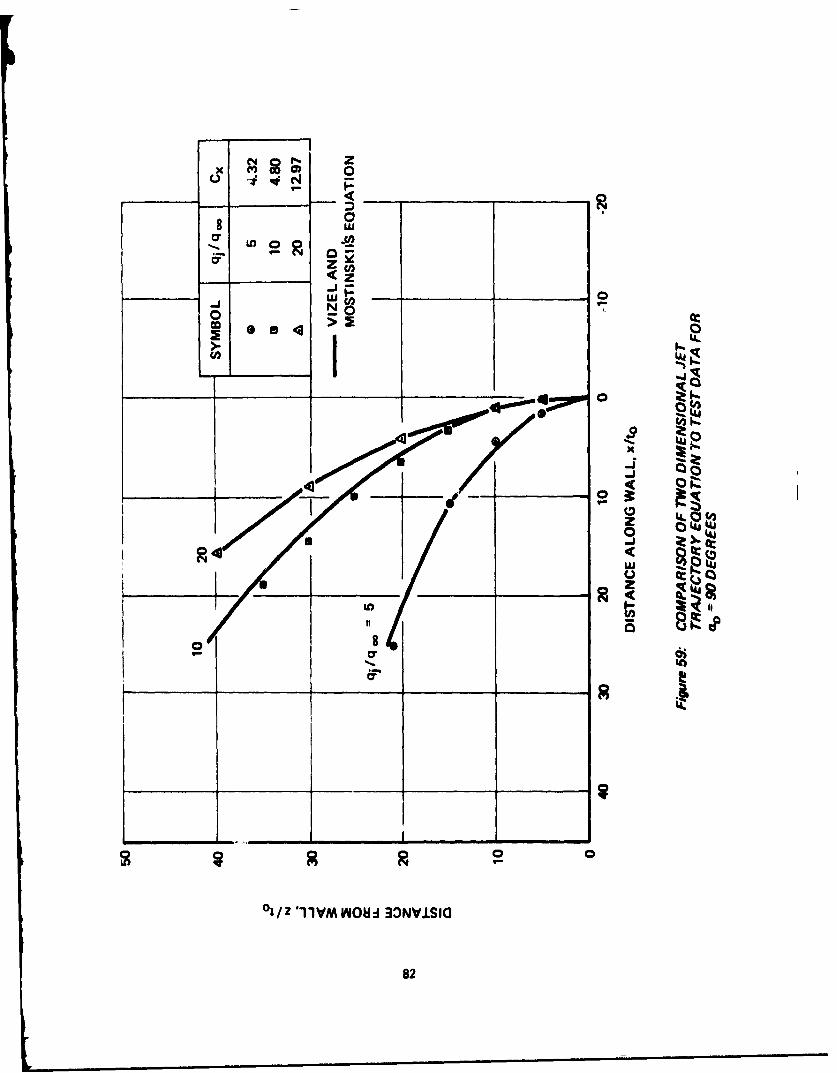
59 Comparison of Two Dimensional Jet Trajectory 82Equation to Test Data for 0,= 90 Degrees
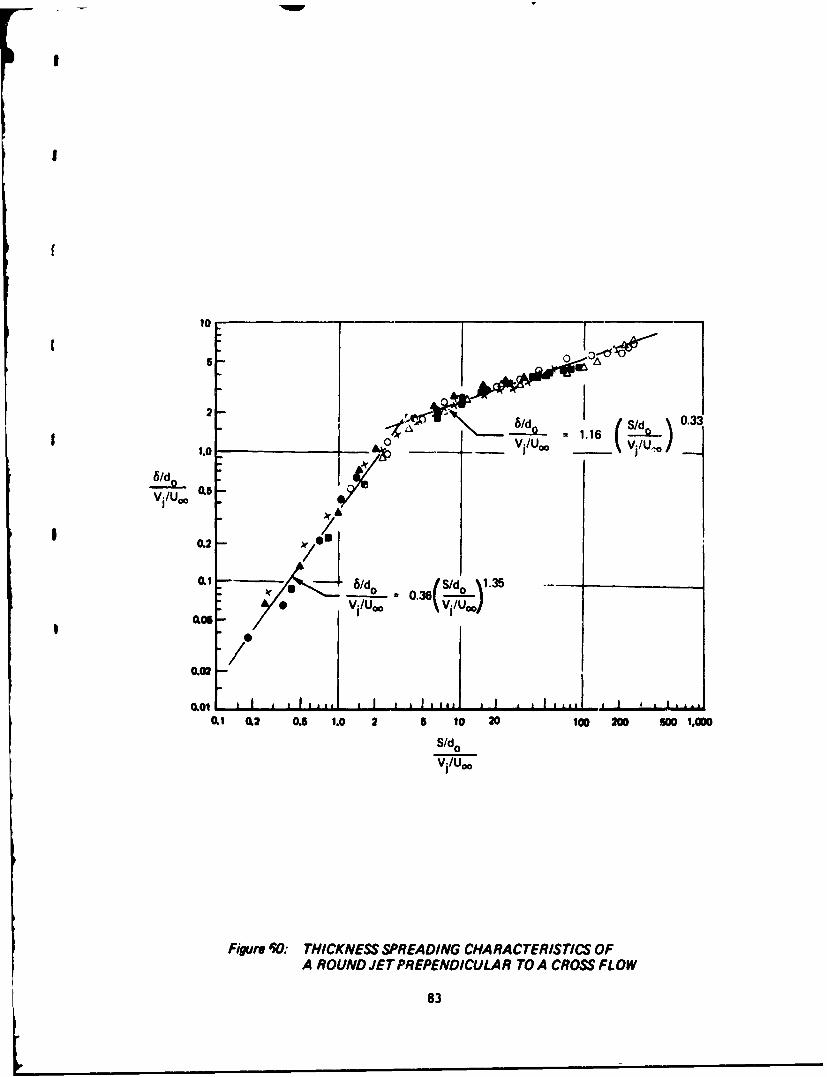
60 Thickness Spreading Characteristics of a Round 83Jet Perpendicular to a Cross Flow
61 Computer Graphic Displays of Chang Cross Section 86
for Vjo/U4 = 8
62 Jet Trajectory Photographs for Re = 710 87
63 Type = 1. Circular Jet Cross Section Geometry 90
64 Type = 2o Rectangular Jet Cross Section Geometry 92
65 Type = 3. Two Dimensional Jet Cross Section 94Geometry
66 Type = 4. Annular Jet Cross Section Geometry 97
67 Reingestion Prediction Program Diagram 100
68 Cross Flow Reingestion 101
69 Streamlines and Mach Contours for STOL Transport 103Inlet
70 Streamlines and Mach Contours for STOL Transport 105Inlet
71 Effect of Inlet Velocity Ratio on Pre-Entry 107Stagnation Streamtubes for a Representative STOLTransport Inlet
72 Inlet Streamtube Coordinate System 108
73 Jet Penetration Correlation Illustrating Data Scatter 110Due to Turbulent Fluctuations of Flow
ix
LIST OF ILLUSTRATIONS (Cont.)
FIGURE T ITLE PAGE
74 Crossflow Reingestion Results il
75 Self Reingestion 113
76 Effect of Discharge Angle and Plate Length on the 114Reattachment of a Two Dimensional IncompressibleJet
77 Reattachment of a Three Dimensional Jet 115
78 Exhaust Flow Reattachment on SST Thraist Reverser 116
79 Near-Field Fountain Reingestion 118
80 Near-Field Fountain Flow Field Sketches 119
81 Far-Field Fountain Reingestion 122
82 Comparison of Flow Separation Data for 900 Jet 123Impingement
83 Abbott's Criterion for Predicting Far Field. 124Fountain Flow Separation
84 Effect of Impingement Angle and Dynamic Pressure 126Ratio on Far 'Field Fountain Flow Separation
85 Dividing Streamline Comparison Between Theory and 127Experiment
86 Ground Plane Streamlines for 300 Jet Impingement 128Angle and Velocity Ratio VJ/U. - 1.0
87 Ground Plane Streamlines for 300 Jet Impingement 129Angle and 45* Wind Direction
83 Ground Plane Streamlines for 300 Jet Impingement 130Angle and 900 Wind Direction
89 Effect of Wind Direction on Dividing Streamline 131Shape
90 Effect of Wind Direction on Dividing Streamline 132Shape
91 Effect of Velocity Ratio and Impingement Angle 133on Dividing Streamline Shapes
92 Height of Far Field Fountain Exhaust Cloud 135
x

LIST OF ILLUSTRATIONS (Cont.)
FIr,.• .).E TITLE PAGE
03 Position of Vortex and Separation Line Vs 136Corrected Dynamic Pressure Ratio
94 Far-Field Fountain Exhaust Cloud and Inlet 137Streamtube Intersections
95 TR and TV System Performance Program 138
96 Effect of Reverse Thrust on Airplane Drag During 140Ground Roll
97 Air Flow Match Curve Representing Reverser 142Deployment
98 Multibearing Vectoring Nozzle Model Installation 147
99 Effect of Duct Contraction Ratio on Vector 1481 Efficiency 0 = 65°
100 Effect of Duct Contraction Ratio on Airflow 150Match % - 650
101 Effect o•* Duct Contraction Ratio at PT/Ps.- 1.60 152
102 Effect o Duct Turning Radius on Nozzle Vector 153Ffficiency, P - 65*
103 Efl.ect of Duct Turning Radius on Nozzle Airflow 154Match, 0 - 65*
104 Effect of Duct and Nozzle Length on Vector 157Efficiency, 0 - 65*
105 Effect of Duct and Nozzle Length on Airflow 158Match, 0 - 65*
106 Evaluation of Thrust Reverser Performance 159
107 Effect of Accelerating Duct Flow on Vector 160Efficiency
108 Effect of Accelerating Duct Flow on Airflow Match 161
109 Blocker Door Geometry Model Installation 163
110 Effect of Blocker Door Angle on Cascade Reverser 164Performance
111 Effect of Blocker Door Setback Distance on Cascade 165Reverser Performance
xi
- - Y
LIST OF ILLUSTRATIONS (Cont.)
FIGURE TITLE PAGE
112 Deck Arrangements for Programs TEZM-356A, 170TEN-3563, and TEN-357 When Using a Symbolic
113 Deck Arrangements for Programs TEM-356A, 171TE14-356B, and TEM-357 When Using a Binary Deck
114 Data Card Arrangement for Several Cases, 173
Program TEM-356A
115 Data Card Arrangement for TYPE - 1. Circular Jet 175
116 Data Card Arrangement for TYPE - 2. Rectangular Jet 177
117 Data Card Arrangement for TYPE - 3. Two Dimensional 179Jet
118 Data Card Arrangement for TYPE - 4. Annular Jet 182
119 Data Card Arrangement for Reingestion Prediction 185Program TEM-356B
120 Additional NAMELIST Data Cards for Reingestion 186Prediction Program TZN-3!S
121 Data Card Arrangement for Several Cases, Program 189TEN-357
122 Data Card Arrangement for Conical Cruise Nozzles 191
123 Data Card Arrangement for Annular Cruise Nozzles 193
124 Data Card Arrangement for Irregular Shaped Cruise 195Nozzles
125 Data Card Arrangement for Target Thrust Reversers 199
126 Data Card Arrangement for Blocker Deflector and 201Blocker Cascade Thrust Reversers
127 Data Card Arrangement for Single Bearing Nozzles 2uj
128 Data Card Arrangement for Three Bearing Nozzles 205
129 Data Card Arrangement for Spherical Eyeball Nozzles 207
130 Data Card Arrangement for Lobstertail or Aft-Hood 209Deflector Nozzles
131 Data Card Arrangement for Externial Deflector Nozzles 211
had
LIST OF ILLUSTRATIONS (Cont.)
FIGURE TITLE PAGE
132 Data Card Arrangement for Cascade Loss 213Predictions
133 Data Card Arrangement for Engine Stability 215Margin Module
xiii
LIST OF NOMENCLATURE
a longitudinal dimension of initial jet cross section
b lateral dimension of initial jet cross section
CD nozzle discharge coefficient
CV nozzle velocity coefficient
CVS standard nozzle velocity coefficient
Cx jet penetration coefficient
D jet diameter, or distance between nozzles
do jet initial diameter
Dhe equivalent hydraulic diameter
F thrust force
H boundary layer shape factor
m2 momentum deficiency at cascade lattice trailing edge
NPR nozzle pressure ratio
PTN/POO nozzle pressure ratio
q dynamic pressure
R cascade reaction, or radius
Rs separation distance of far-field fountain dividingstreamline
rs scatter radius
RV vortex distance from impingement point
t jet thickness
to jet initial thickness
U00 frestream velocity
Vhilite inlet hilite velocity
xiv

LIST OF NOMENCLATURE (Concluded)
s arc length along jet axis
w jet width, or weight flow
x body coordinate
X/D ratio of setback distance to nozzle diameter
y spanwise coordinate
Y P cascade pressure loss coefficient
z vertical coordinateSubscripts
a annular coordinate system
f forward thrust mode
j jet
o origin or initial
r reverse thrust mode
0o freestream conditions
Greek Symbolsangle of attack, azimuth angle, or cone angle
5 jet thickness
boundary layer displacement thickness
TRc corrected reverser efficiency
'IRg static reverser efficiency
1Vg vector efficiency
? angle of yaw
Cr cascade solidity, - C/Ssor vector angle
e boundary layer momentum thickness, or vector angle
I airflow match
A1 flow turning angle
7v skew angle of initial jet cross section
xv

SECTION I
INTRODUCTION AND SUMMARY
An essential requirement of military STOL tactical transportsplanned for the 1980 time period will be to operate from airfieldsof 2500 feet or less. These aircraft will use thrust reversersas primary braking devices throughout the landing ground roll.Also, some STOL concepts will use thrust vectoring systems tohelp control the flightpath of the airplane and reduce take-off and landing speeds. Consequently, emphasis must be placed ondesigning efficient and reliable thrust reverser/vectoring systemsto achieve the field length objective.
Commercial jet aircraft have used thrust reversers as secondarybraking devices since the beginning of their operation. However,the complex problems caused by the interactions between reverserexhaust and aircraft flowfields have limited their usefulness.These problems include exhaust gas recirculation which can leadto engine surge, impingement of exhaust gases on the ground oradjacent aircraft surfaces, and engine mass flow matching. Also,the reverser flow can cause blanking out of aerodynamic controlsurfaces leading to a loss in aircraft directional stabilityand control, buoyancy effects that decrease the efficiency ofthe ground braking systems, and changes in airplane drag. Allof these problems have been experienced during the developmentof existing commercial aircraft. However, the availability oflong runways has made it unnecessary to completely resolve theinteractions between the reverser and aircraft flowfields.
To avoid the limitations of existing systems on future STOL aircraft,
attention must be given to the fcllowing technical areas:
o TR/TV performance
o Exhaus- gas flowfield
o Aerodynamic interference
o Engine operation
o TR/TV system design including weights and structures
The abcve considerations have significant influence on nacelleplacement, thrust reverser and vectoring system geometry, andoperating envelope.
The Boeing Company, with subcontr'ct support from Pratt & WhitneyAircraft conducted an 18 month research program to study the above
I

technical areas. The program was administered by the Air korceAero Propulsion Laboratory, Wright-Patterson Air Force Base, Ohio.Program objectives are:
1. To develop methods to predict thrust reverser and thrustvectoring system performance.
2. To establish design criteria for high efficiency, lightweight
thrust reversers or thrust vectoring systems for STOL aircraft.
The program has three parts:
Part IA--Data Review and Analysis
Part IB--Design
Part IC--Model Testing
Part IA consists of three tasks:
Task 1.1 - Review and correlate TR/TV data
Task 1.2 - Construct computerized analytical models
Task 1.3 - Plan and conduct supplemental tests
During Task 1.1, existing data were reviewed for possible appli-cation to computer programs for thrust reverser and vectoring systems.Literature searches of DDC, NASA, and Boeing files resulted inapproximately 160 references applicable to TR/TV systems. The re-sults of the data review were used to develop data correlations for
o Cruise nozzles
o Thrust reversers
0 Thrust vectoring nozzles
o Cascade lattices applicable to cascade TR and TV nozzles
Computer programs for predicting TR and TV nozzle performance andevaluating TR and TV influence on the total airplane system weredeveloped during Task 1.2. Three programs were developed:
1) Jet Trajectory and Spreading Program -- to predict the shapeand trajectory of the thrust reverser or vectoring nozzle exhaustplume.
2) Reingestion Prediction Program -- to predict the on-setof reingestion for arbitrary thrust reverser and air-plane configurations as a function of geometry and flowconditions.
3) TR and TV System Performance Program -- consisting of fourmodules to predict:
2

o TR and TV Internal Performanceo Aerodynamic Performanceo Reingestiono Engine Stability Margin
The TR and TV Internal Performance Module was assembled usingthe data correlations developed during Task 1.1. The EngineStability Margin Module was developed by Pratt & WaitneyAircraft. Available reingestion and aerodynamic data for existingconventional take-off and landing aircraft were not applicableto the Reingestion and Aerodynamic Performance nodules. A lowspeed wind tunnel test of STOL airplane TR and TV configurationsis required to obtain the necessary data. However, logic wasprovided tc allow easy incorporation of data into the modulesas data become available.
Task 1.3 consisted of planning and conducting supplemental statictest to fill data voids discovered in the open literature. Testswere conducted to determine:
1) Multibearing vectoring nozzle performance as a function ofparametric geometry variations
2) Blocker door geometry effects on the performance of annularblocker/cascade thrust reversers
The results were incorporated into the Internal Performance Moduleof the TR and TV System Performance Program.
Detailed descriptions of the results of Part IA are provided inthe following sections. Detailed results of Parts IB and ICare provided in Volume II.
3

",lw
SECTION II
PART IA - DATA REVIEW AND ANALYSIS
2.1 Task 1.1 Review and Correlate TR/TV Data
The objective of Task 1.1 was to review the existing literaturefor data pertinent to TR/TV systems and to correlate the dataas a function of fundamental geometric and aerodynamic para-meters. The data correlations are used to predict TR and TVnozzle performance. The first step of this task, a litera-ture search, was made prior to start of the study contract. Theliterature search included the following sources of information,
1) Defense Documentation Center computerizedliterature search. This search was updatedduring Task 1.1
2) Computerized literature search of NASA reports
3) Boeing documents, STAR and TAB abstracts,technical journals (search performed byBoeing library personnel)
4) Foreign literature available through services ofthe Boeing International Corporation
5) Patent search
Approximately 160 reports found during the literature searchwere obtained and reviewed. Boeing was assisted in the litera-ture review by the subcontractor, Pratt & Whitney Aircraft,who provided references and abstracts. Results were publish-ed as an Air Force Technical Report (Ref. 1). The data reviewdocument contains three types of information.
Bibliography Summary Chart
A typical bibliography 3ummary chart for thrust reversersystems is shown in Table I. This chart summarizes informationextracted from reports and cross references them by subjectmatter.
Report Abstracts
Abstracts were written for all reports reviewed. Abstractsdescribe contents of the report and provide an objectiveassessment of applicability and usefulness of the contents.
4

- -Y I
%b~~
N1011
MN N N
0N N
wN
>
N NN NNW4NN N .
NLLN N
S0
4. 4t:
LUa046, "
44. u, J ;4 ;t ; ;t j, L
-yo A5

Data Review Charts
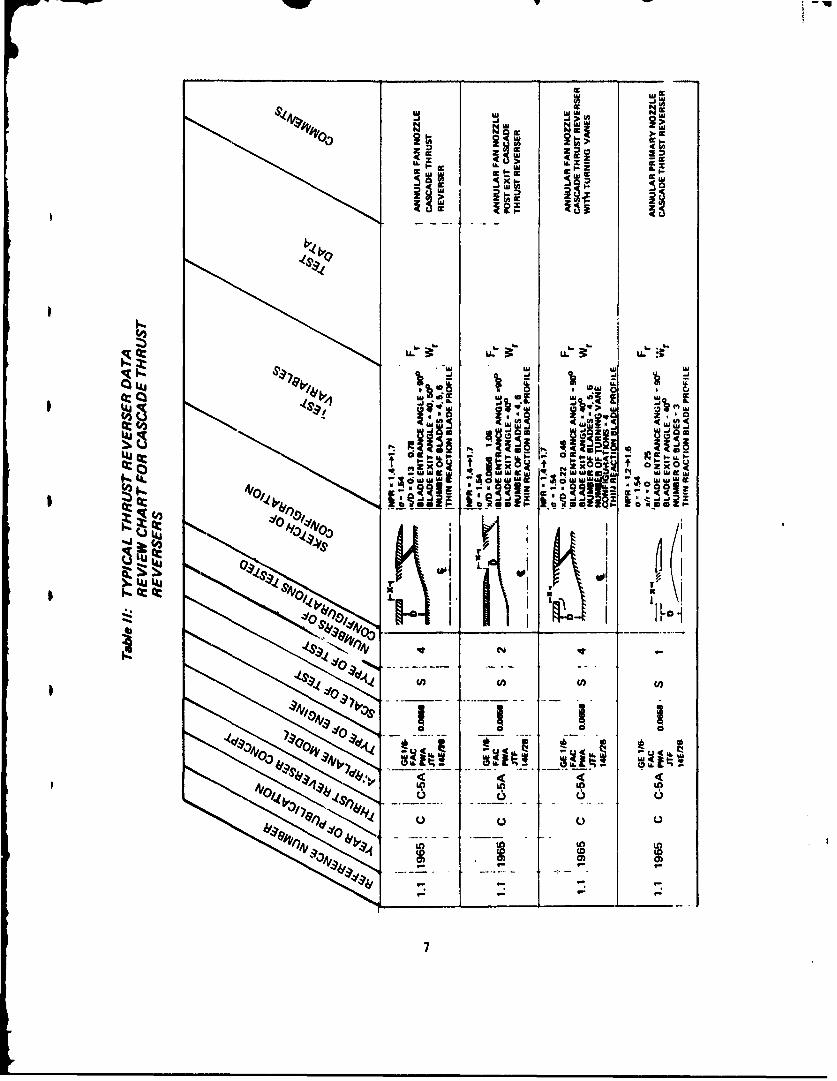
A sample data review chart is shown in 'able II. This chartcontains a sketch of the TR or TV configuration, summarizesthe range of test variables, and lists the type of data con-tained in the report. Comments are included conoerAnng the model,data quality5or usefulness of the data.
The second major objective of Task 1.1 was to formulate datacorrelations for thrust reverser and thrust vectoring systemsas functions of fundamental geometric and aerodynamic parameters.Correlations were developed for the following types of TR/TVnozzles:
1) Cruise nozzlesa) Conicalb) Annularc) Noncircular
2) Thrust reversers
a) Target (clamshell and annular)b) Blocker deflector and blocker cascade
3) Thrust vectoring nozzles
a) Single bearingb) Three bearingc) Spherical eyeballd) Lobstertaile) External deflector
4) Cascade lattices applicable to cascade TR and TV nozzles
Data correlations for the above TR/TV nozzles are describedin the following paragraphs.
2.1.1 Cruise Nozzle Data Correlations
This section describes methodE, used to predict cruise nozzleperformance in terms of velocity and discharge coefficients.Extensive parametric data for convergent conical nozzles arepresented covering a wide range of wall angles and diameterratios. Analytical results are also presented end comparedto experimental data.
Conical Nozzle Velocity Coefficient
A sketch of a conical nozzle is shown on page 8.
6
ILLu
j
~fr a, t;
I* Nz
2 LU ~ ~ ~ w~4' ~diz
cc4 .-- - .- LL
wil
II . w!. I?~ V,
4u 4 us 4 L
4,~~~- a. go C)
7;w ,
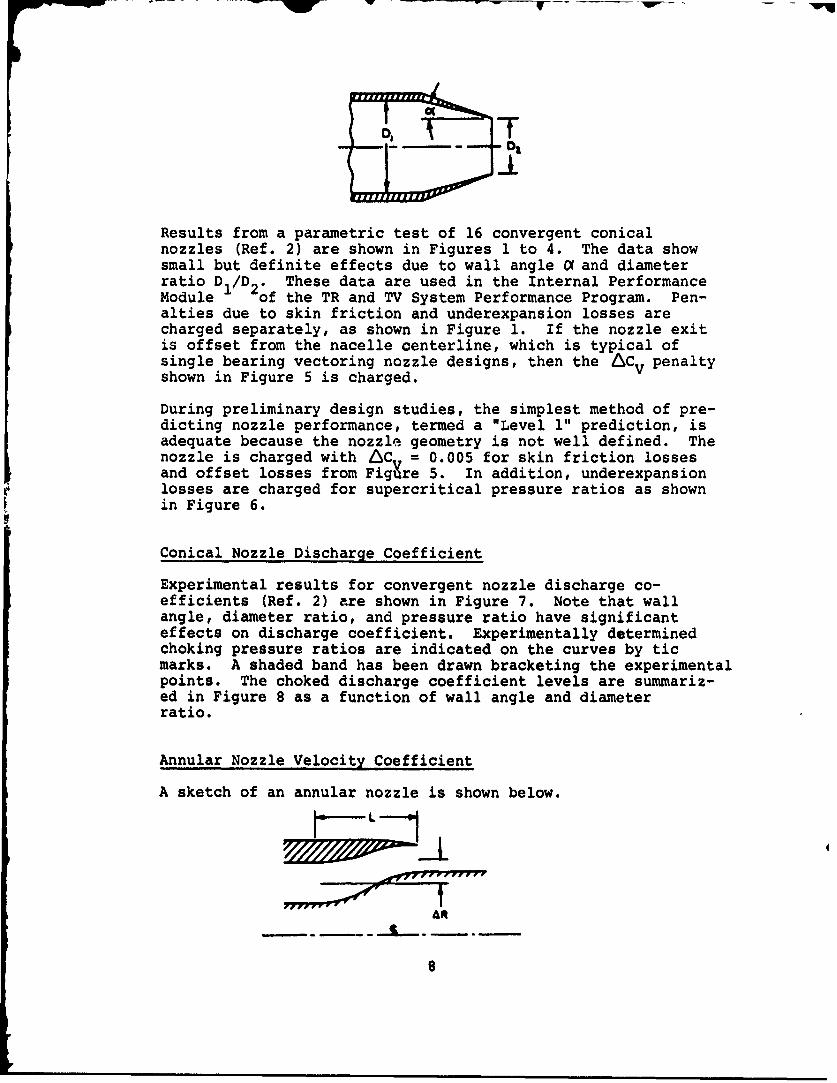
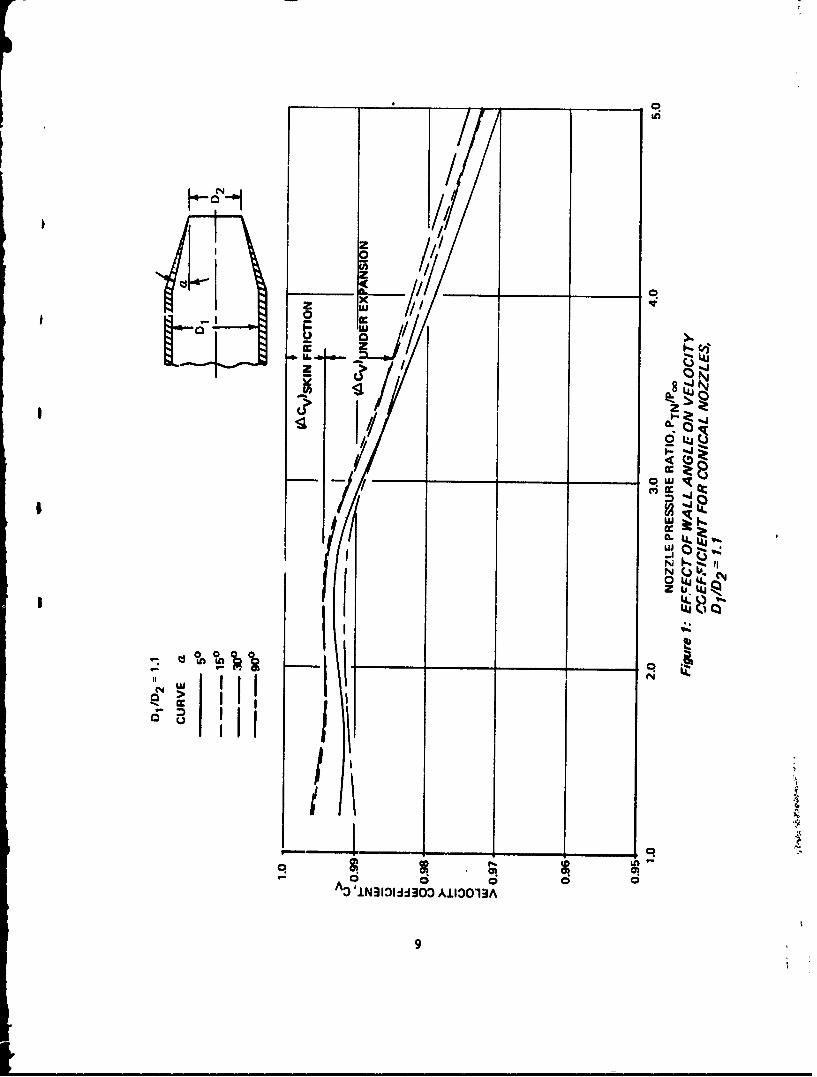
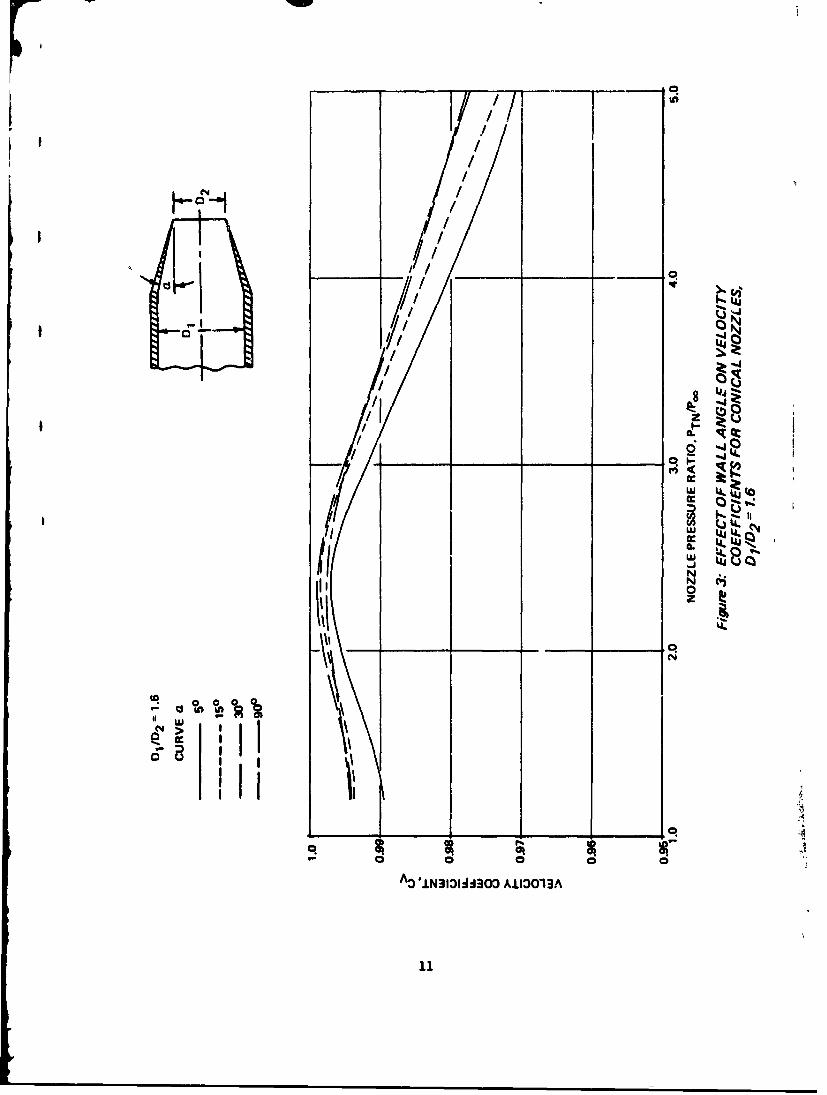
Results from a parametric test of 16 convergent conicalnozzles (Ref. 2) are shown in Figures 1 to 4. The data showsmall but definite effects due to wall angle C and diameterratio D1 /D2. These data are used in the Internal PerformanceModule of the TR and TV System Performance Program. Pen-alties due to skin friction and underexpansion losses arecharged separately, as shown in Figure 1. If the nozzle exitis offset from the nacelle centerline, which is typical ofsingle bearing vectoring nozzle designs, then the 6Cv penaltyshown in Figure 5 is charged.
During preliminary design studies, the simplest method of pre-dicting nozzle performance, termed a "Level 1" prediction, isadequate because the nozzle geometry is not well defined. Thenozzle is charged with 6C = 0.005 for skin friction lossesand offset losses from Fig~re 5. In addition, underexpansionlosses are charged for supercritical pressure ratios as shownin Figure 6.
Conical Nozzle Discharge Coefficient
Experimental results for convergent nozzle discharge co-efficients (Ref. 2) are shown in Figure 7. Note that wallangle, diameter ratio, and pressure ratio have significanteffects on discharge coefficient. Experimentally determinedchoking pressure ratios are indicated on the curves by ticmarks. A shaded band has been drawn bracketing the experimentalpoints. The choked discharge coefficient levels are summariz-ed in Figure 8 as a function of wall angle and diameterratio.
Annular Nozzle Velocity Coefficient
A sketch of an annular nozzle is shown below.
S~t
A8
8.l._
/, q
118 N
1/ I~C J
-/1 owi
04
D'AMW30N k 10191:9

wC
/Af'/9U
S.
N
L
I
N> 51
AO J.N3I01dJ303 A±I13O13A
10
I ~C!
//L/z/I
cc/
'-I iCIa '1'
/0/z
LIU>/
0i 0A3*N33A30 IIO3

Kw/J _ -
( c
.LA'us
04JI~ U. AJ
Lbq
W4 49UA~>IIcc_ _
AO ±IN3DIAI430 AIIOO13A
12
AR
0.12
0.10
I>
U 0.08z
2
uu" 0.06
0> A.R .0.8
• LS0.04-
o0.02
• "-'-'-- ,--- - .•0.2
1.0 2.0 3.0 4.0
NOZZLE '•RESSURE RATIO, PTNP
Figre 5: EFFECT OF NOZZLE OFFSET ON VELOCITYCOEFFICIENT LOSSES
13

~~F~q.w~u~~w w
if 11
t .4.
ID CIu
pc cc4
I qIc
IC
1
qs
qEI0
"D #i31:)~id3O AIDO13
14#

L)
2I0
c0.8 6_ _
1. 2.0 4. .
15.

NOTE: CONICAL CONVERGEN7 NOZZLESCHOKE AT PRESSURE RATIOS HIGHERTHAN CRITICAL. CONSEQUENTLY CD CHOKEDOES NOT APPLY AT CRITICAL PT/Pw
1.00 -
S.98-.. o= 150
I--Z_z
LL
a
w• .92
.90
EXPERIMENTAL 0ESTIMATED
Figw 8.: PARAJ.7TRIC STUDY OF CONICAL CONVERGENTNOZZLES - CD CHOKE
16

iU
Test results are used to predict the 6C penalty of annularnozzles relative to conical nozzles. Relults from Boeingtests of JT3D and C-5A fan nozzles are shown in Figure 9. Theconical nozzle C data are charged with this additional incrementto predict annulXr nozzle performance.
Annular Nozzle Discharge Coefficient
Review of the literature did not produce a usable set of datafor annular nozzle discharge coefficients. However, a combin-ation of conical nozzle data and theory was developed that isadequate. Boundary layer theory is used to determine dischargecoefficient assuming only viscous losses, i.e., no vena con-tracta or three-dimensional flow effects. For a conical nozzle,
S=---=
where R is the nozzle exit radius and 5* is the boundarylayer displacement thickness at the nozzle exit. For anannular nozzle,
CID@AAA1I,- "i RoR (2)
where R.and R are the annular nozzle inner and outer radii.Assumin• that the conical and annular nozzles have the samelength, area, exit Mach number, and Reynolds number
C 0640%L141%V (3)
Eliminating S* between Equations 1 and 2 and solving forCDannular gives
S- I - 0 - Con icai) (4)Re -Rj
The term CDconical is obtained from the conical nozzle data
at choked flow conditions, Figure 8. Equation 4 is used tocalctiate CD annular at choked conditions.
In order to predict C, at subcritical pressure ratios, theanalytical method of •ragg (Ref. 3) is used. Bragg's analyticaldischarge coefficient curves are shown in Figure 10. Bragg'sresults are erroneous for pressure ratios greater than choke.Consequently, the curves were corrected by making C constantabove the choked pressure ratio. The choking line Ras takenfrom Figure 7. A good check of the accuracy of Bragg's theoryis made by overlaying Figures 7 and 10.
Bragg's theory does not permit the discharge coefficient to becalculated for a particular nozzle geometry. It predicts howthe discharge coefficient of a nozzle, known under choked flowconditions will vary for subcritical pressure ratios. To useBragg's method, the choked discharge coefficient is located on
17

0.06
0.07.
0 .0 60-
AR
.0.00
zLM
0.04
1 8ri0.03 0.8
0
0.60.02 0.
-0
0.01
01.0 2.0 3.0 40
NOZZLE PRESSURE RATIO, PTNIPo
Figure 9: EFFECT OF NOZZLE OFFSET ON ANNULAR NOZZLEVELOCITY COEFFICIENT LOSSES
18
1.0
0.9.
z
LLIL0 0.8U
0.7 ______________
1.0 2.0 3.0 4.0
NOZZLE PRESSURE RATIO0. PTN/Poo
Figure 10: THEORETICAL DISCHARGE COEFFICIENT CURVESUSING BRAGG'S THEORY
19
the right side of Figure 10. The curve is followed back to theleft by fairing in the best fit at the choke line.
Noncircular Nozzle Velocity Coefficient
Noncircular nozzles have rectangular, D-shaped, or ellipticalshaped cross sections as shown in the sketches below.
+
The prediction method for noncircular nozzles employs anequivalent hydraulic diameter correlation developed to predictthe maximum velocity coefficient of suppressor nozzles, asshown in Figure 11 from Ref. 4. If the losses are assumed to becaused predominantly by skin friction losses in the boundarylayer, the maximum velocity coefficient of circular convergentnozzle is given by
(Cv.,n&,X . = 1- (5)
where D is the diameter and e is boundary layer momentumthickness at the nozzle exit. The maximum velocity coefficientoccurs at a pressure ratio such that the convergent nozzle ischoked but does not exhibit any underexpansion loss. Thistypically occurs at a nozzle pressure ratio of about 2.2. Bydimensional analysis, it can be shown that for noncircularnozzles,
I C v16)
where C is the maximum velocity coefficient of a standardconvergXRt nozzle, and Dhe is the equivalent hydraulic diameter
Perimeter (7)
20
REF. 4
1.00 " 1-lx4RECTANGLE NO. 3
lx6 RECTANGLE NO. 5 SQUARE NO. OSTANDARD
2 SECTOR NO. 7S1 9 16 PT DEEP STAR NO. 9
2 40% PENETRATION
RT 9TUBE NO. 10
>> 0.98 4 SECTORNO-11 + 16 PT=STAR NO. 2
0X 15% PENETRATIONLu> 0.97 8 LOBE NO.8 1-1 x5 RECTANGLE NO. 4
2 01
6 LOBE NO. 6-
4 -1 x5X RECTANGLE NO. 12
O- 096 / 1TB O 31 1. - CvN O . 14Cv m ax 21 .-
12 SECTOR NO. 15 Dh
0.95I -- I I I I I0 0. 1 0.2 0.3 0.4 0.5 0.6 01 0.8 0.9 -1.0
h. Dh =HYDRAULIC DIAMETER ='4 -AREDe-Do DIAMETER OF EQUIAL AREA CIRCLE PERIMETER
Figure 11: M4AXIMUM VELOCITY COEFFICIENT CORRELATIONFOR SUPPRESSOR NOZZLES
21.

The percent loss in velocity coefficient relative to thestandard nozzle is given by
6C V (.__ .4. = (C6o CiOUlS (8)Cvs CYS
To apply the equivalent hydraulic diameter correlation to anoncircular nozzle, the parametric velocity coefficient datashown in Figures 1 to 4 are used to obtain the nozzle skinfriction loss 6C.. The increase in skin friction loss due toincreased wetted Xrea of the noncircular nozzle is given by
IAC ( - 6e skn ;V;CGw (9)
Noncircular Nozzle Discharge Coefficient
Boundary layer theory is employed to predict discharge co-efficient penalties. Assuming only skin friction losses,
Cv skii Pir- I - - (10)0
C - -4.-2S•0 skin 44.ote D (11)
Combining Equations 10 and 11 gives
46 CO sitif ;#idlf a H 6 C Vskin ;oiaie (12)
where H - i*/e is boundary layer shape factor. For a turbulent,flatplate boundary layer with MO4- 1, a good value for H - 1.7.The discharge coefficient penalty due to wetted area increaseis given by
6 C ° 0=We~ H 6Cv w e~ j goo* (13);•Iweat inceasel
The maximum discharge coeeficient is given by
C O " " C O ckok - l C O W & 44 a0 "4 (14)
where CD choke is obtained from the conical nozzle choked dis-
charge coefficient data, Figure 8. Discharge coefficient is pre-dicted at lower pressure ratios using Bragg's theoreticalcurves with CDmax from Equation 14 as the choked discharge co-efficient value.
22
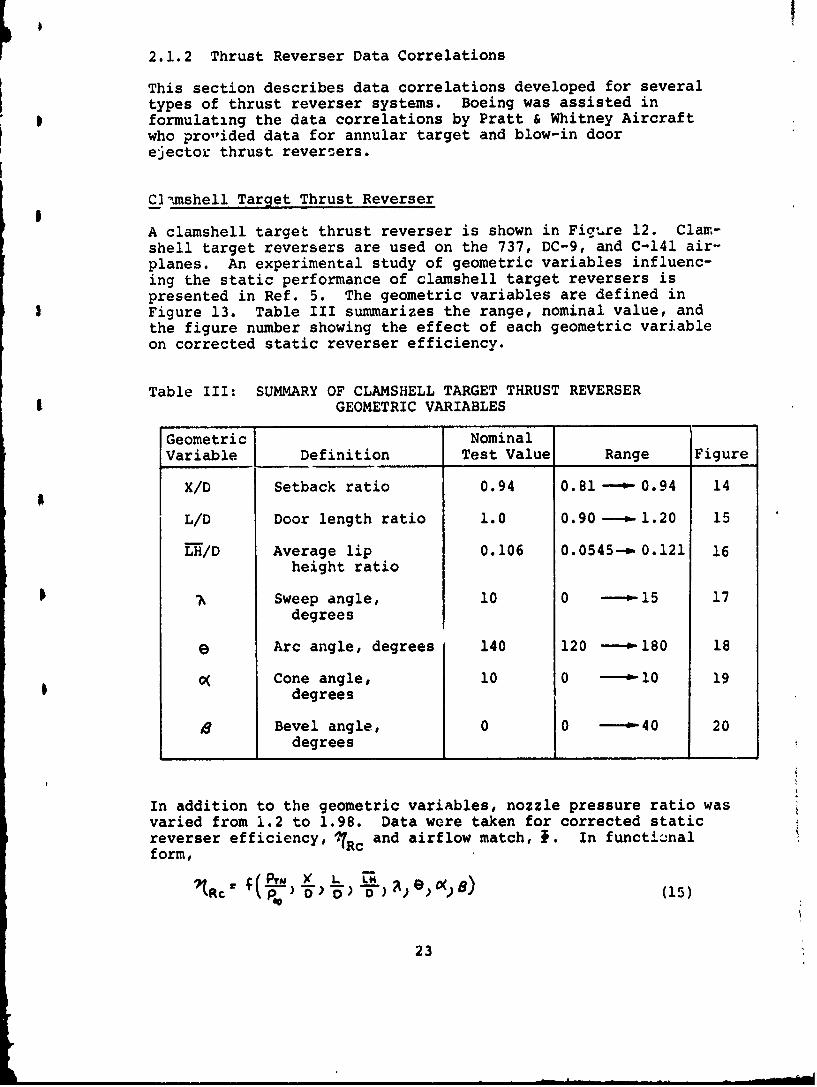
2.1.2 Thrust Reverser Data Correlations
This section describes data correlations developed for severaltypes of thrust reverser systems. Boeing was assisted informulating the data correlations by Pratt & Whitney Aircraftwho pro-ided data for annular target and blow-in doorejector thrust reversers.
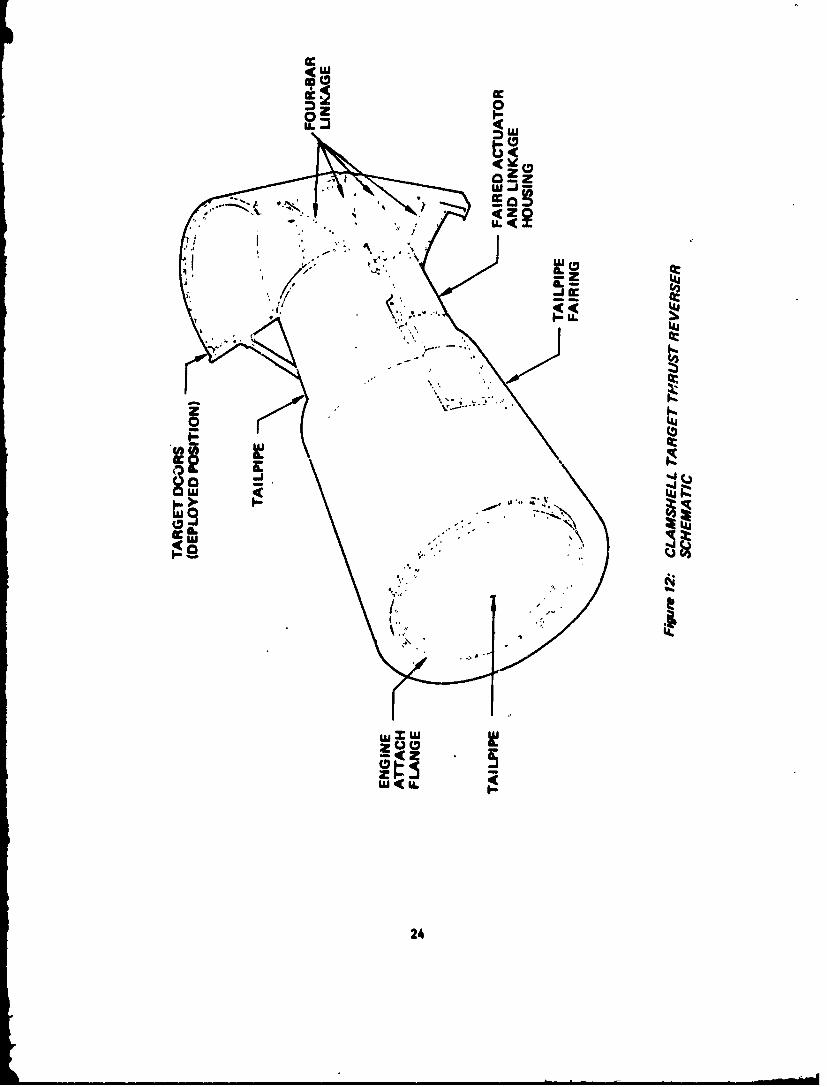
Climshell Target Thrust Reverser
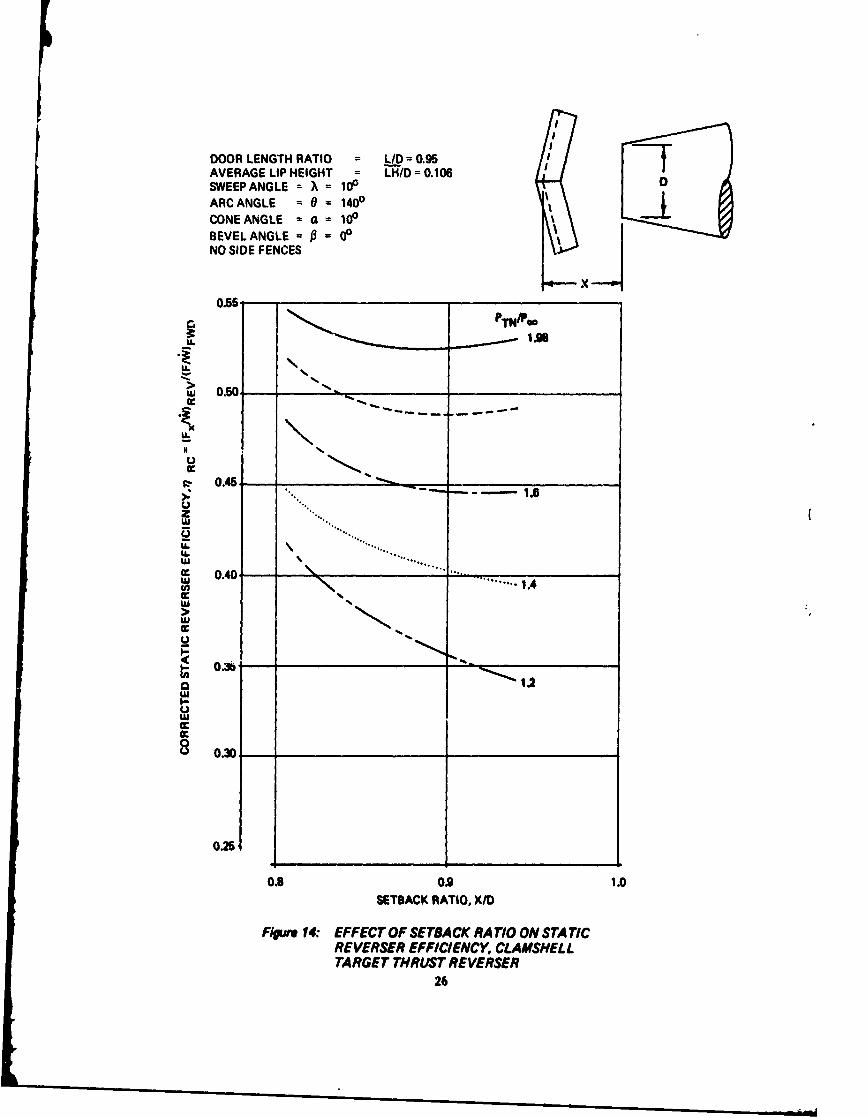
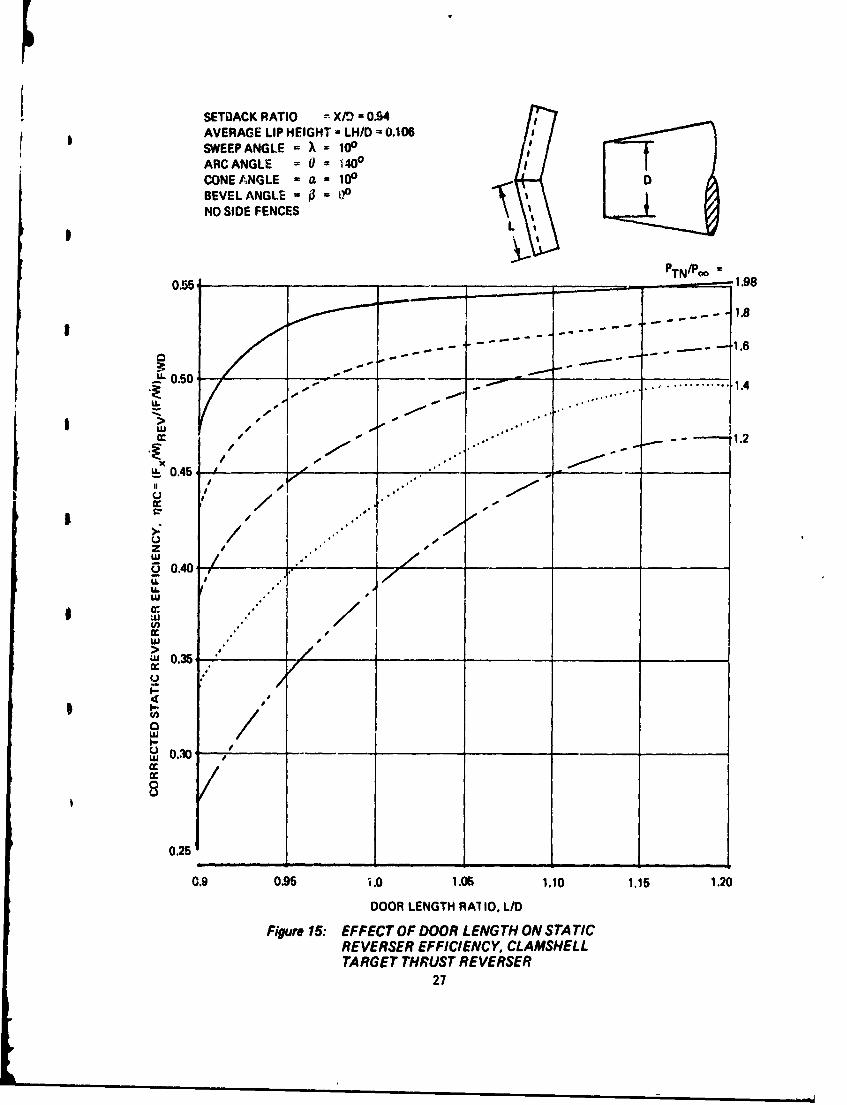
A clamshell target thrust reverser is shown in Fig.re 12. Clam-shell target reversers are used on the 737, DC-9, and C-141 air-planes. An experimental study of geometric variables influenc-ing the static performance of clamshell target reversers ispresented in Ref. 5. The geometric variables are defined inFigure 13. Table III summarizes the range, nominal value, andthe figure number showing the effect of each geometric variableon corrected static reverser efficiency.
Table III: SUMMARY OF CLAMSHELL TARGET THRUST REVERSERGEOMETRIC VARIABLES
Geometric Nominal
Variable Definition Test Value Range Figure
X/D Setback ratio 0.94 0.81--0.94 14
L/D Door length ratio 1.0 0.90---m1.20 15
L-H/D Average lip 0.106 0.0545-.w0.121 16height ratio
1 Sweep angle, 10 0 --- 15 17degrees
e Arc angle, degrees 140 120 ---- o180 18
SCone angle, 10 0 - 10 19degrees
8Bevel angle, 0 0 ---- 40 20degrees
In addition to the geometric variables, nozzle pressure ratio wasvaried from 1.2 to 1.98. Data were taken for corrected staticreverser efficiency, ?Rc and airflow match, I. In functionalform,
23
000
0 9
U.j
zkiJ
9-4wU <
I LA
LII'
AzucZý5
24

lI ,
- ~LI
EXHAUST TNOZZLE D.
I
I L
X DESIGN PARAMETERS
SETBACK - XDOOR LENGTH - LLIP HEIGHT - LHSWEEP ANGLE - XARC ANGLE- eCONE ANGLE -a
BEVEL ANGLE -
Figure 13. CLAMSHELL TARGET THRUST REVERSERGEOMETRIC VARIABLES
25
DOOR LENGTH RATIO LID = 0.96 IAVERAGE LIP HEIGHT = LHID = 0.106SWEEPANGLE = ' = 10&
ARC ANGLE = 0 = 1400CONE ANGLE = a - 10PBEVEL ANGLE =3 = 0ONO SIDE FENCES
0.55.
Iw 0.50-
0.4
w~0.40 ....cc
N14
I-
•- 0.45"30-_.
0 51..I I-B 0.30- _ _ _ _ _ _ _ _
0.25
0.8 0.9 1.0SETBACK RATIO, X/D
Fitu. 14: EFFECT OF SETBACK RATIO ON STATICREVERSER EFFICIENCY, CLAMSHELLTARGET THRUST REVERSER
26
SETBACK RATIO XID = 0.94AVERAGE LIP HEIGHT = LH/D 0.106SWEEP ANGLE = ) = 100ARC ANGLE = 0 - 40°CONE/ANGLE - a - 100 DBEVEL ANGLE = 0 = 00NO SIDE FENCES
PTN/Po -0.55 . -1.98
1.6
L 0.50 IAr. . . . 1.4>
,>- -".- """ - - 1.2
x/ 1 .'.0.45 ' .
II I '
/ •
z I
0. 40 I.i/
U.w
w
Wu 0.35
I-g
nI-.4'
0.25
0.9 0.95 'i.0 1.06 1.10 1.15 1.20
DOOR LENGTH RATIO, L/D
Figure 15: EFFECT OF DOOR LENGTH ON STATICREVERSER EFFICIENCY, CLAMSHELLTARGET THRUST REVERSER
27
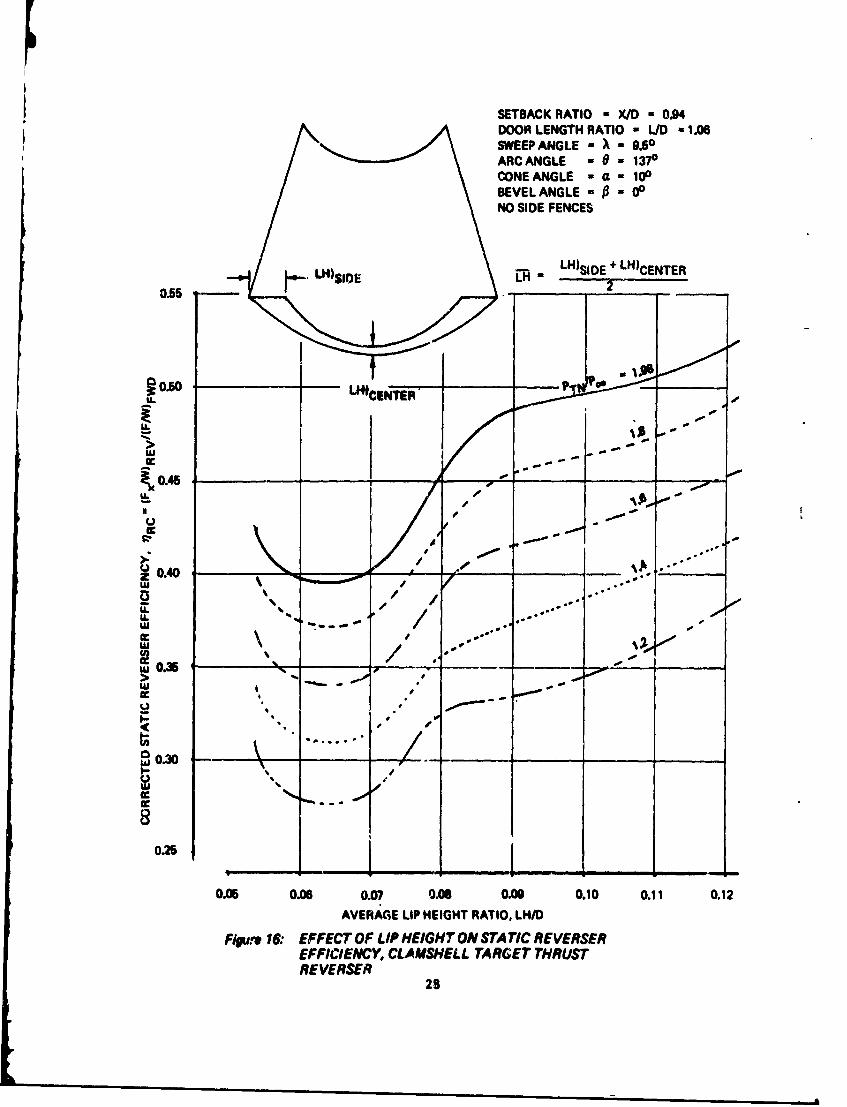
SETBACK RATIO - X/D - 0.94DOOR LENGTH RATIO - L/D - 1.06SWEEPANGLE - X. - 9.50ARC ANGLE - 0 - 137°CONE ANGLE - a. - 10DBEVEL ANGLE - P• - 0°
NO SIDE FENCES
LH)"ILE ER LH)SIDE + LH)CENTER
0.65
10.50 MINEtP
w
U..U.
w 0.35
(l~ -TI
>
0.25
- -
0.05 0.06 0.07 O.AS 0.00 0.10 0.11 0.12AVERAGE LIP HEIGHT RATIO, LH/D
Figure 16: EFFECT OF LIP HEIGHT ON STA TIC REVERSEREFFICIENCY, CLAMSHELL TARGET THRUSTREVERSER
25
It/ oS• • .-,

SETBACK RATIO = X/D = 0.94DOOR LENGTH RATIO - L/D = 1.0AVERAGE LIP HEIGHT = LH/D= 0.106ARC ANGLE = 0 = 1400CONE ANGLE =a= 100BEVEL ANGLE = 3 = 00NO SIDE FENCES
0.55
0.50.
0.45.
U. - -
•,I A
. 0.40 .
wLu
0.30
I-
Lu
CCw
0.25
0 5 10 15
SWEEPANGLE, A., DEGREES
Figure 17.' EFFECT OF SWEEP ANGLE ON STATIC REVERSER EFFICIENCY,
CLAMSHELL TARGET THRUST REVERSER
29
SETBACK RATIO - X/D - 0.94DOOR LENGTH RATIO - LID - I AAVEPAGE LIP HEIGHT - LHID *0.106
SWEEP ANGLE *- 10,CONE ANGLE - -100
BEVEL ANGLE - & 0NO SIDE FENCES
0.60--
~0.55-
U. 01
S0.50
z 0.45
LL-w
w 04
8/ 0
0.25
120 140 160 lisARC ANGLE, 0 DEGREES
Figur. 18: EFFECT OF ARC ANGLE ON STA TIC REVERSEREFFICIENCY, CLAMSHELL TARGET THRUSTREVERSER 30~

SETBACK RATIO = X/D - 0.84DOOR LENGTH RATIO I/D - 1.0AVERAGE LIP HEIGHT Ml/D a 0.106SWEEPANGLE - ). - 100ARC ANGLE - 0 = 1400BEVELANGLE = - 00
0.55- NO SIDE FENCESPTN/Poo = 1.98
I
.0 1.8U.0.50- oe
-S
w 1.6
- - -"u' 0.45 -, .
u. le " 1.4UJu -
Zi I .opsw
S0.3O5/
0.25 -0 I
/1
0 5 10TARGET DOOR CONE ANGLE. a, DEGREES
Figure 19: EFFECT OF CONE ANGLE ON S7 ATIC THRUSTREVERSER EFFICIENCY, CLAMSHELL TARGETTHRUST REVERSER
31
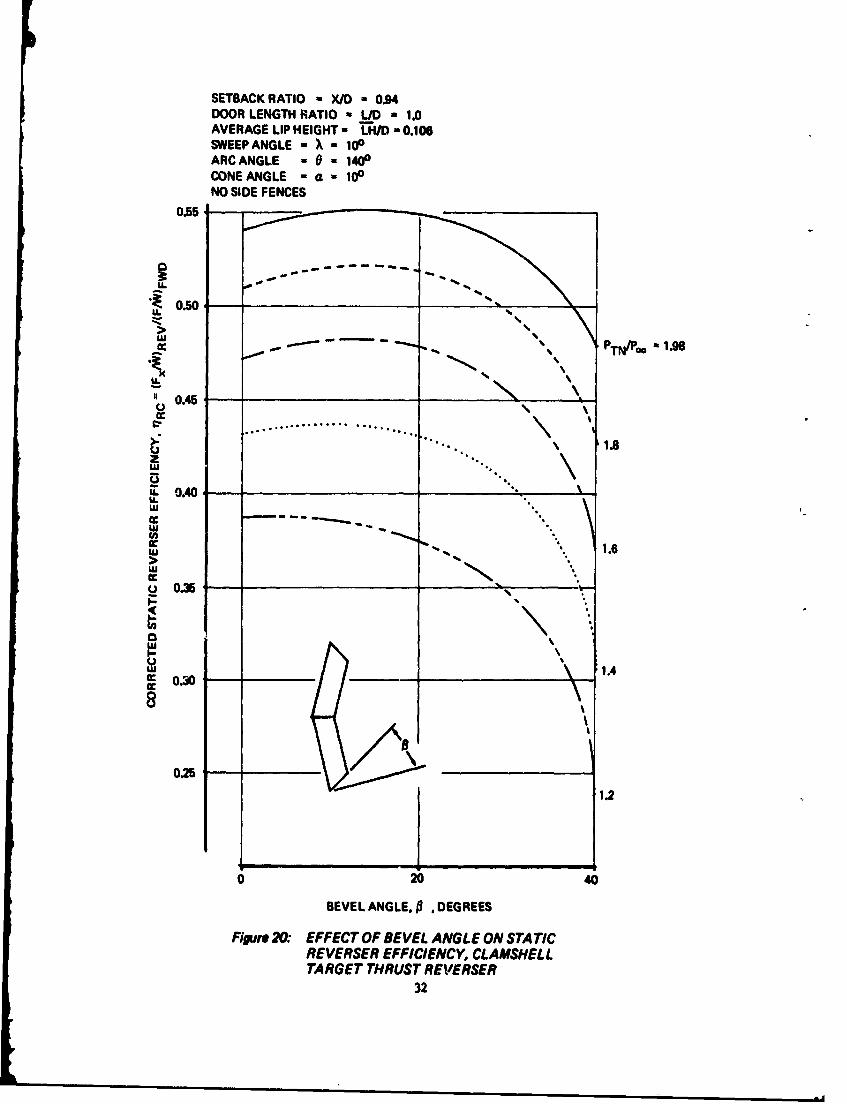
SETBACK RATIO a X/D - 0.94DOOR LENGTH RATIO L/D a 1.0AVERAGE LIP HEIGHT - LH/D - 0.106SWEEP ANGLE - X - 100ARC ANGLE - 0 - 1400CONE ANGLE - a - 100NO SIDE FENCES
0.55
" 0.45..
. . . .. . . . . .. ......... ".. .,, 1.8
0o.40
.1.6
0.35
\ o%
0.30
025
w
1.2
BEVEL ANGLE. P3 DEGREES
Figure 20: EFFECT OF BEVEL ANGLE ON STA TICREVERSER EFFICIENCY, CLAMSHELLTARGET THRUST REVERSER
32
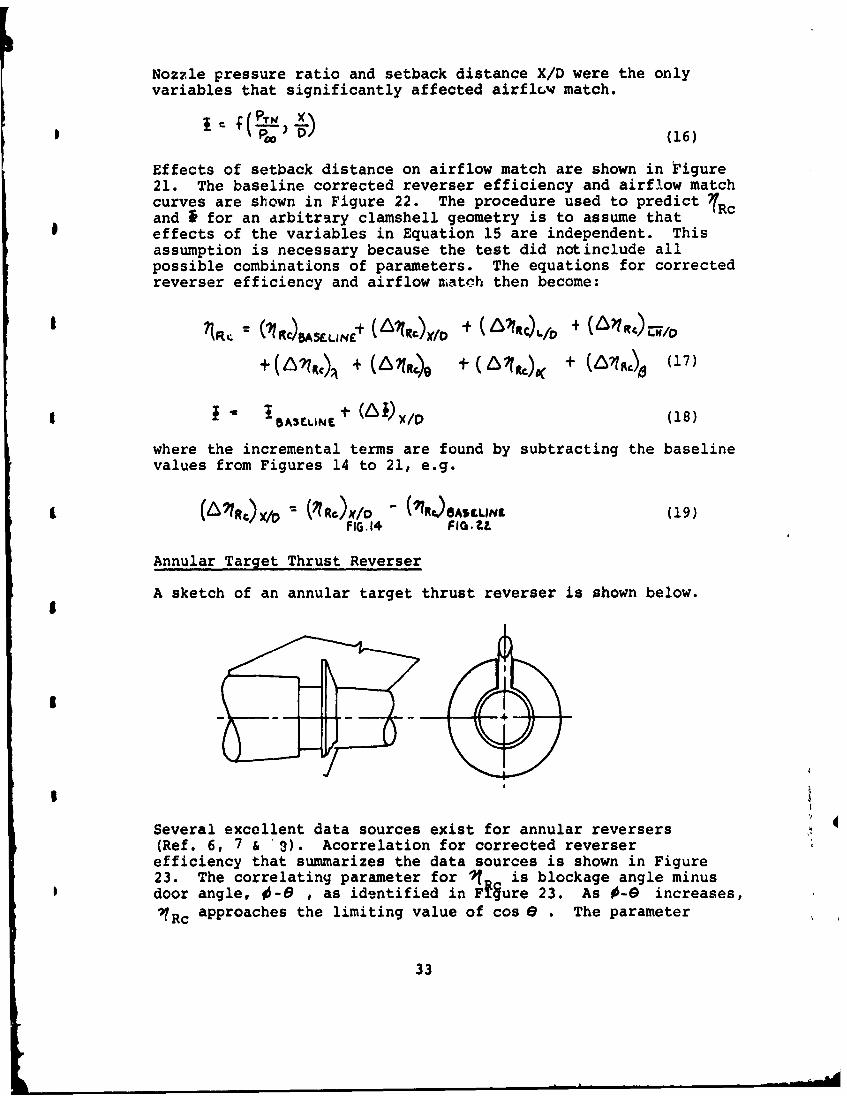
Nozzle pressure ratio and setback distance X/D were the onlyvariables that significantly affected airflow match.
go U (16)
Effects of setback distance on airflow match are shown in Figure21. The baseline corrected reverser efficiency and airflow matchcurves are shown in Figure 22. The procedure used to predict T-Rcand I for an arbitrary clamshell geometry is to assume thateffects of the variables in Equation 15 are independent. Thisassumption is necessary because the test did not include allpossible combinations of parameters. The equations for correctedreverser efficiency and airflow niatch then become:
=R (NC)DA5ELINEII (-''R)j + 61O + (ncr-/
+ Z~4)a+ (,oj'q + + (17)
I SAMCINE~ t 0 I (18)
where the incremental terms are found by subtracting the baselinevalues from Figures 14 to 21, e.g.
u. (AN7RX) - (flR1)sACLIeN& (19)FIG.14 FIGA.LZ
Annular Target Thrust Reverser
A sketch of an annular target thrust reverser is shown below.
£i
£1
Several excellent data sources exist for annular reversers(Ref. 6, 7 & 3). Acorrelation for corrected reverserefficiency that summarizes the data sources is shown in Figure23. The correlating parameter for it is blockage angle minusdoor angle, 0-0 , as identified in Ffure 23. As 0-0 increases,
IRc approaches the limiting value of cos e . The parameter
33

1.0-
II
iD
0.95
0.9
O.8 0.9 1.0
SETBACK RATIO, X/D
Figun, 21: EFFECT OF SETBACK RATIO ON AIRFLOWMATCH, CLAMSHELL TARGET THRUST REVERSER
34

0.6 lORC (Fxl*.)REV.(Fi") FWD,.U
ILu
c.U.
"cc 0.4Lu
1-all
w 0.3
1.0 ,.5 2.0
NOZZLE PRESSURE RATIO# PTN/Pao
1.0
om
it
I-0
0.90
1.0 1.5 2.0
NOZZLE PRESSURE RATIO, PTN/P".
Figure 22: CLAMSHELL TARGET THRUST REVERSERBASELINE PERFORMANCE
35
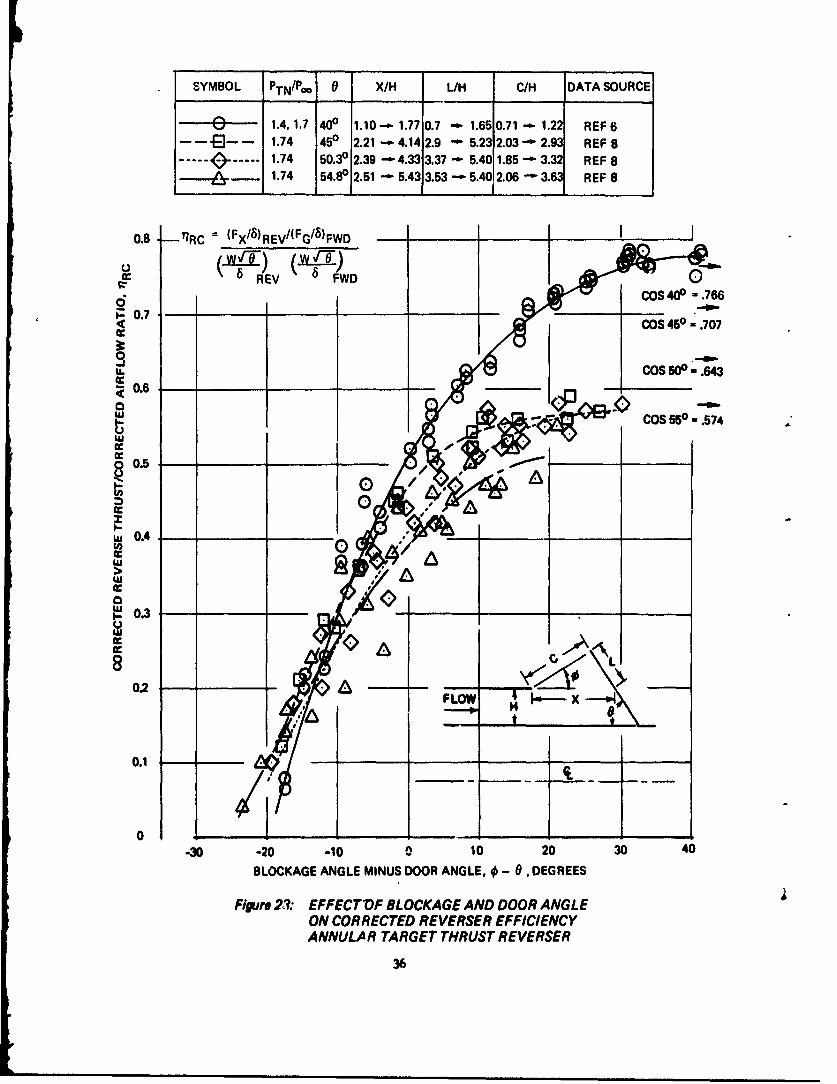
SYMBOL PTN'Poo 0 X/H L/H C/H DATA SOURCE
0 1.4, 1.7 400 1.10 1.77 0.7 - 1.65 0.71 1.22 REF 6- - .-- -- 1.74 450 2.21 -"4.14 2.9 - 5.23 2.03 2.93 REF 8
- 1.74 50.30 2.39 4.33 3.37 - 5.40 1.85 " 3.32 REF 8
S1.74 54.80 2.51 "" 5.43 3.53 "" 5.40 2.06 3.6 REF 8
0.8 -- 7RC = (Fx/ 6)REv/(FG/b)FwD I Io ~(V)} ,s-F--cc REV FWD
COS 450 - .7079. _°"____.____s,,o..,Ocos_.___._
90
0.6
COS 5°0 = .574
cc 0.5
I-Iw 0.4 -
cc>
S0.3 -
c-.0.2 -
FLOW k-x-4
0.1
0-30 -20 -10 0 10 20 30 40
BLOCKAGE ANGLE MINUS DOOR ANGLE, # - 0, DEGREES
Figure 23 EFFECTOF BLOCKAGE AND DOOR ANGLEON CORRECTED REVERSER EFFICIENCYANNULAR TARGET THRUST REVERSER
36

ý-e was found to improve the ability to correlate annularTR data.
The airflow match data are correlated as a function of throatgap over annulus height in Figure 24, The Boeing 707 and Pratt& Whitney Aircraft data are for a pok.texit annular targetreverser. Because the controlling area for a postexit reverseris the cruise nozzle are&,the limiting value for airflow match* equals 1.0. On the other hand, the Boeing C-5A proposal dataare for a pre-exit annular blocker deflector reverser. Thecontrolling area in the TR mode is larger than the cruise nozzleare so i is greaterlhan 1.0. The equation for airflow match is
%;-vw :CoD Aiw• Cof A; (20)
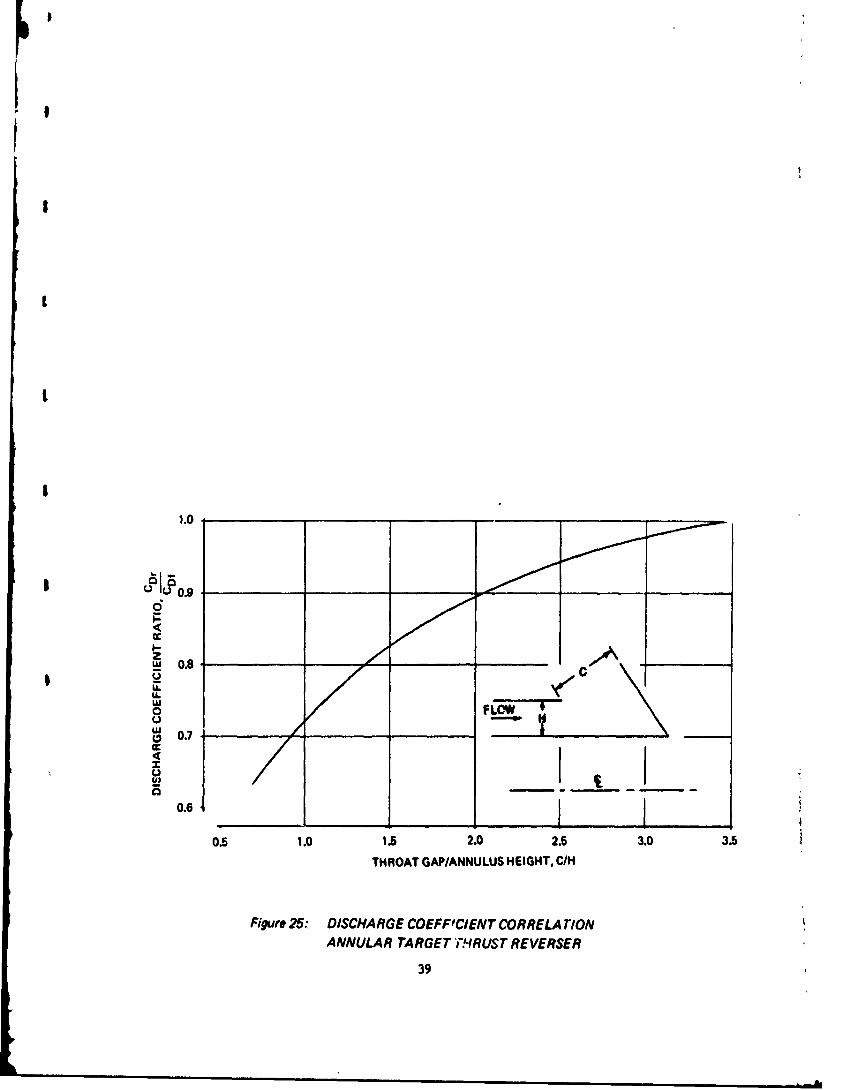
where w is mass flow rate, C is discharge coefficient, A isexit area and subscripts r aRd f refer to reverser and forwardthrust modes, respectively. Equation (20) was used to calculatedischarge coefficient ratio from the Boeing C-5A airflow matchdata. The resulting data correlation curve for discharge co-efficient ratio is shown in Figure 25.
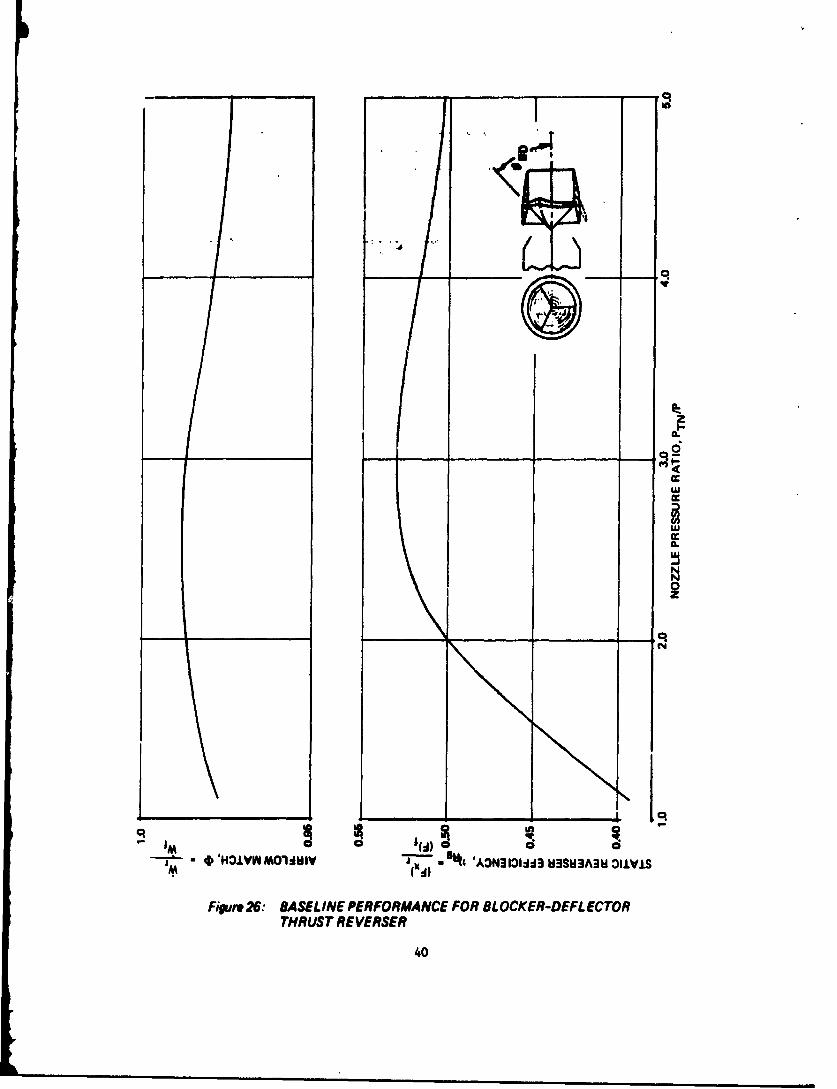
Blocker Deflector Thrust Reverser
Data correlations were developed for two types of blocker de-fleý.or reversers, a blocker with cascade deflectors, and ablocker reverser with deflector doors. Cascade blocker deflectorthrust reversers are used on the 707, 747, DC-10, and L-1011airplanes. Blocker reversers with deflector doors are used onthe 727 and F-11A airpla-cs.°
The cascade blocker deflector shown in Figure 109 on page 163was tested during the Task 1.3 supplemental static test and theresults are discussed in Section 2.3. Baseline performance ofthe blocker reverser with deflector doors is presented in Figure26 from Ref. 9. The effects of blocker door cone angle onreverser efficiency and aiilow match are displayed in Figure 27.
2.1.3 Thrust Vectoring Nozzle Data Correlations
This section describes data correlations developed for severaltypes of thrust vectoring nozzles. Boeing was assisted in thisisk by Pratt & Whitney Aircraft, who provided data for single-taring and spherical eyeball vectoring nozzles.
37
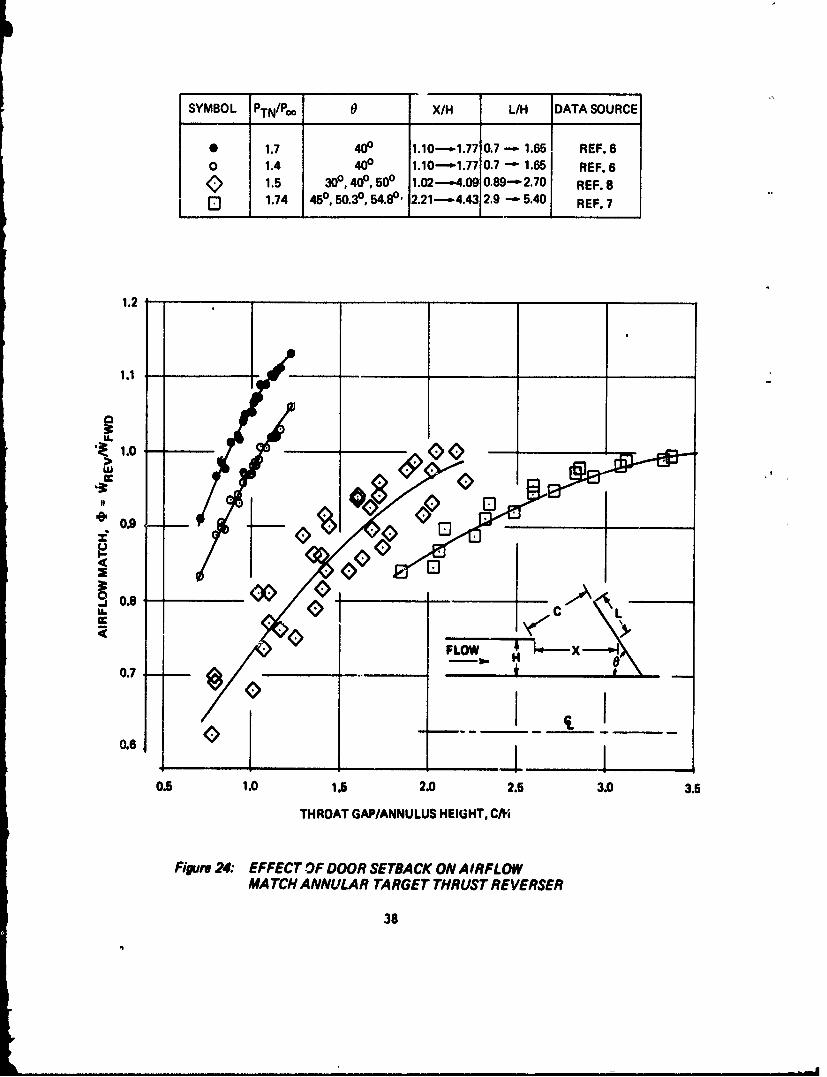
SYMBOL PTN'Poo 0 X/H L/H IDATA SOURCE
* 1.7 400 1.10---1.77 0.7 - 1.65 REF. 6O 1.4 400 1.10--•1.77 0.7 - 1.65 REF. 6
S1.5 30 , 40& , 500 1.02---4.09 0.89- 2.70 REF. 8Q 1.74 450, 50.30, 54.89. 2.21---4.43 2.9 -5.40 REF. 7
1.2
1.1
1.0Lu
cc
0._
/ _ _ _ _ _ -
0.68
015 1.0 1.5 2.0 2.5 3.0 3.5
THROAT GAP/ANNULUS HEIGHT, CL
Figure 24: EFFECT OF DOOR SETBACK ON AIRFLOW
MA TCH ANNULAR TARGET THRUST REVERSER
38
,
I
1.0
z-u 0.8*Y
LLLLLu0 FLOW
L 0.7
0.6 I
0.5 1.0 1.5 2.0 2.5 3.0 3.5
THROAT GAP/ANNULUS HEIGHT. C/H
Figure 25; DISCHARGE COEFFICIENT CORRELATION
ANNULAR TARGET THRUST REVERSER
39
cq2
040

I
0.7
.. . .z- 6& 0 D
F 0.6. "450 810
z3 LU 1130
U. 0.56Lu
) -- 300
Lu
u 0.44
I-
S1.0 1.5 2.0
NOZZLE PRESSURE RATIO, PTN/poo
1.0 . 300= 0 81-- s 450
600
N 0.9
1130
0081.021
1.0 1.5 2.0
NOZZLE PRESSURE RATIO. PTN/P'c
Figure27: EFFECT OF BLOCKER DOOR CONE ANGLEON BLOCKER-DEFLECTOR THRUSTREVERSER PERFORMANCE
41

Single-Bearing Nozzle
Sketches of single-bearing nozzles are shown below.
Ka
.-. _ i • "S- *-L .....
Considerable geometric flexibility is possible by varying thenozzle offset, bearing plane angle, and bearing duct angle.Single-bearing nozzles frequently are designed in symmetricpairs to mkmize assymetric engine side loads. Theoreticalthrust components for a single-bearing nozzle or half of adual swiveling single-bearing nozzle are given by
Fx/F,.- I - Sti1S (i-cost) (21)
Fy/F, SINA S"eN Cos3 (I-COS0) - COIFJw S 1140 (22)
F,/F - -COSA 5 INe Cos08 ()- C050) ,5,WO Sm MS 19 (23)
where the resultant force Fr is given by
Fr- (FZ + F. + F*) /" (24)
The (x, y, z) coordinate system and angles o, 1, and#are definedin Figure 28. Theoretical thrust components for a nozzle withbearing plane and duct angles of 45 and 58 degrees are given inFigure 29. The theoretical flow turning angle is given by
I). u (25)
42
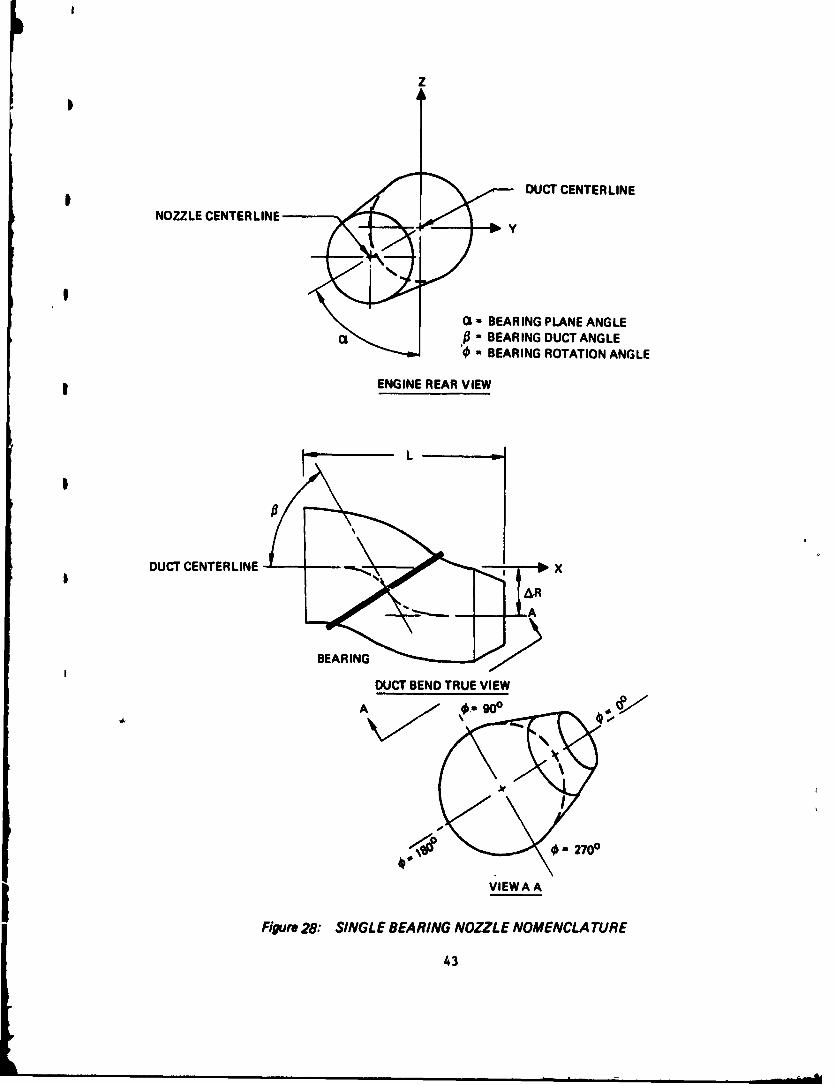
Z
DUCT CENTERLINE
NOZZLE CENTERLINEV
01- BEARING PLANE ANGLEa BEARING DUCT ANGLE
B - BEARING ROTATION ANGLE
ENGINE REAR VIEW
L
DUCT CENTERLINE X
II
AADUCT BEND TRUE VIEW
VIEWA A
Figure 28: SINGLE BEARING NOZZLE NOMENCLATURE
43

AXIAL FORCE RATIO - FX/Fr-6-A4-. 0 .2P A0. .6 .8 1.0
LATERAL~~ -OC RATO .7F I
4.6
ILI
12
o -.6
IL
0-.6
> -.
444

Vector angle is given by the following equation
I ICm (26)
Several data sources exist for single-bearing nozzle performance(Ref. 8, 10,and 11). As shown in Figure 30, the various datasources agree fairly well considering the geometric differencesbetween test configurations. Consequently, data supplied byPratt & Whitney Aircraft was selected for use in the InternalPerformance Module.
Three-Bearing Nozzle
Data measured during the Task 1.3 supplemental static tests areused to predict three-bearing nozzle performance. The dataare discussed in Section 2.3.
I Spherical Eyeball Nozzle
A sketch of a spherical eyeball nozzle is shown below.
IL
Velocity and discharge coefficient performance is shown inFigure 31 from Ref. 8 and 11.
* Lobstertail Nozzle
A lobstertail (also known as aft hood deflector) sketch is shownbelow.
45

1.0,.U
U.fU.LL."w 0.90o -
O / CRUISE PERFORMANCE
�- --- 90& VECTOR PERFORMANCE
0.8
1.0
U. O
U.
,lo,
S-- CRUISE PERFORIAWA
0.- -- gOW VECTOR ,ERFORIANCE
1.0 2.0 3.0 4.0
NOZZLE PRESSURE RATIO, PTN/Poo
Figure 30: SINGLE BEARING NOZZLE PERFORMANCE
46

W .9
W I CRUISE PERFORMANCE
SIP VECTORPEFRAC
0.8
1.0
z
LL
o -o
-CRUISE PRFORMAW
0 -- ---- 1-..-00 VECTOR PERFORKANCE
1.0 2.0 3,0 4.0
NOZZLE PRESSURE RATIO, PTW/P@O
Figure X: SINGLE BEARING NOZZLE PERFORMANCE
46

DATA: REF 8AND 11
1.0 0
wu 500
w0 S0.9
I-
0
w0.0U2
C< VETRINLE - 0w50m I.
0.7
1.0. 2____0_ 3.0__ __ _ __ _ 4.0__ __ __
NOZEPESR AIUNp
0.77
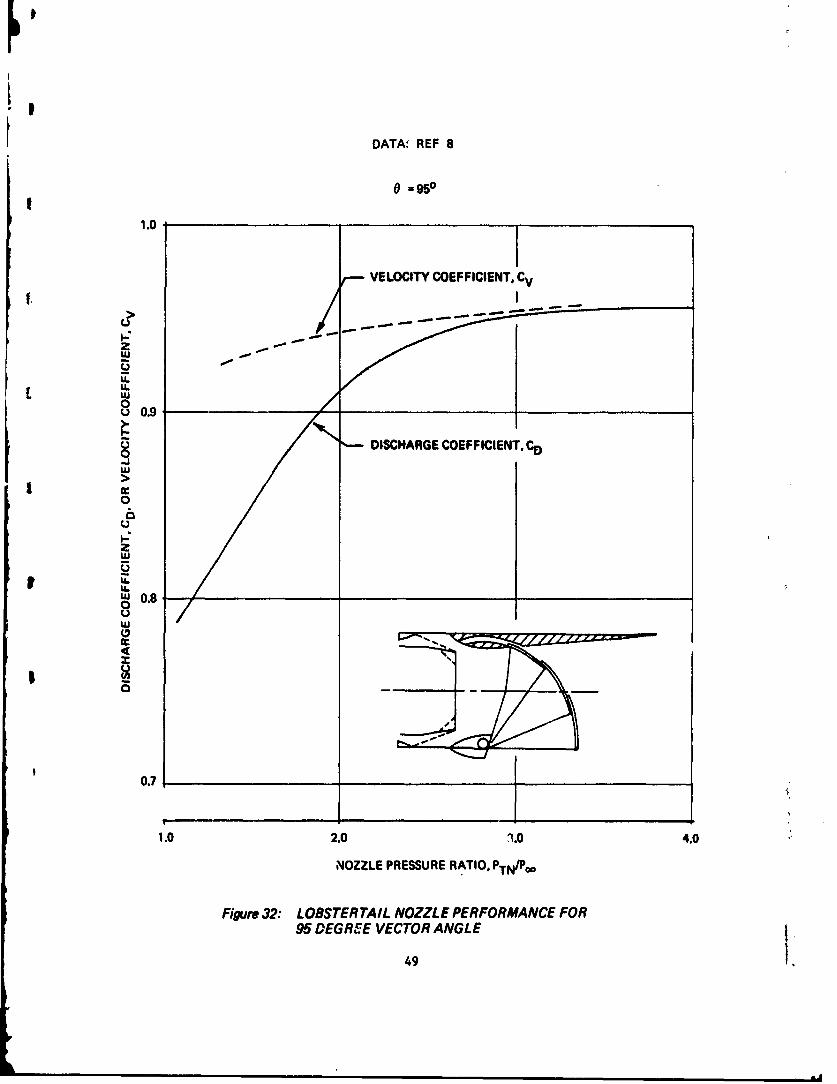
Velocity and discharge coefficient performance for 95-degreevector angle is shown in Figure 32 from Ref. 8. Effects ofvector angle and nozzle pressure ratio on CV and C are given inFigure 33. The cruise nozzle CV and CD areestimaRed to be0.995 and 0.98, respectively at Vchoked conditions. Bragg'stheoretical discharge coefficent curves are used for CD atintermediate vector angeles.
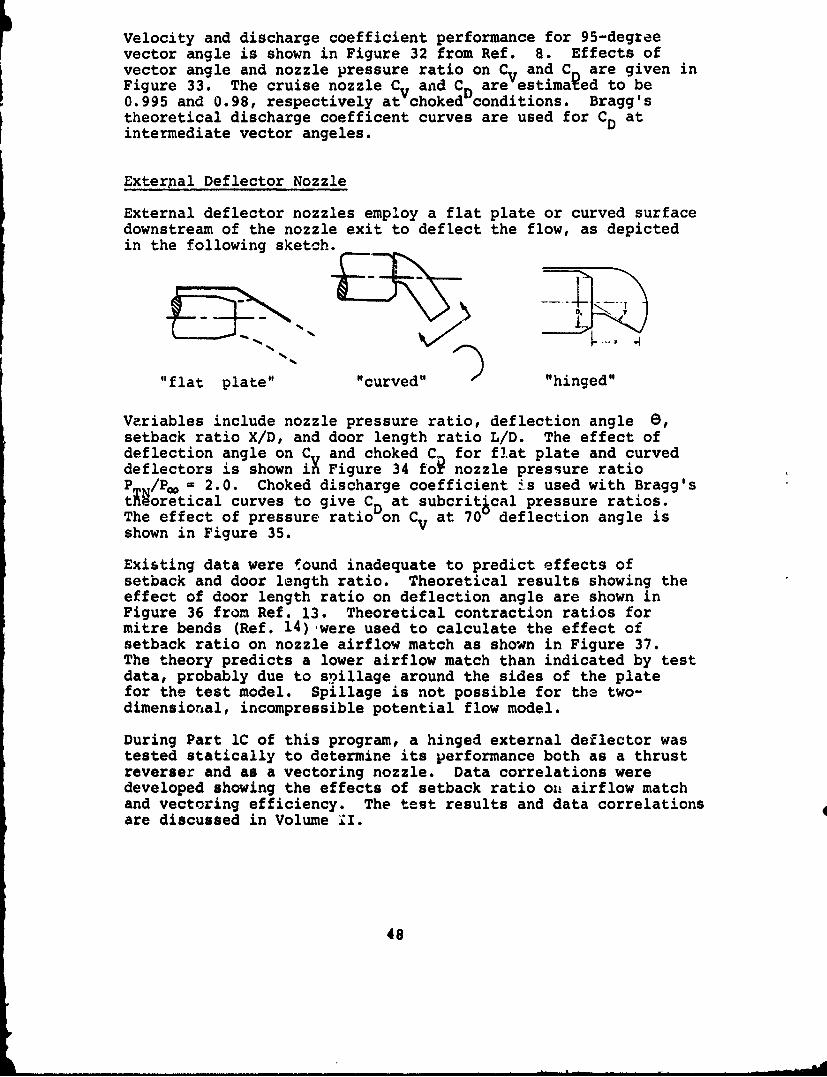
External Deflector Nozzle
External deflector nozzles employ a flat plate or curved surfacedownstream of the nozzle exit to deflect the flow, as depictedin the following sketch.
"flat plate" "curved" "hinged"
Variables include nozzle pressure ratio, deflection angle e,setback ratio X/D, and door length ratio L/D. The effect ofdeflection angle on C and choked C for flat plate and curveddeflectors is shown Figure 34 foi nozzle pressure ratioP /Po = 2.0. Choked discharge coefficient .s used with Bragg'stworetical curves to give CD at subcrit cal pressure ratios.The effect of pressure ratio on C at 70 deflection angle isshown in Figure 35.
Existing data were tound inadequate to predict effects ofsetback and door length ratio. Theoretical results showing theeffect of door length ratio on deflection angle are shown inFigure 36 from Ref. 13. Theoretical contraction ratios formitre bends (Ref. 14)-were used to calculate the effect ofsetback ratio on nozzle airflow match as shown in Figure 37.The theory predicts a lower airflow match than indicated by testdata, probably due to spillage around the sides of the platefor the test model. Spillage is not possible for the two-dimensional, incompressible potential flow model.
During Part 1C of this program, a hinged external deflector wastested statically to determine its performance both as a thrustreverser and as a vectoring nozzle. Data correlations weredeveloped showing the effects of setback ratio oii airflow matchand vectoring efficiency. The test results and data correlationsare discussed in Volume .I.
48
II
DATA: REF 8
0 =950
1.0
-- VELOCITY COEFFICIENT. CV
w-
S0.9 ,
| ! •DISCHARGE COEFFICIENT, CD
t 0.w
0 1.0_ ____.0__ __ .0 _ __ _4.0___ __
w
0
z
U.
La.
LU0.7
NOZZLE PRESSURE RATIO. PTN/Po-
Figure 32: LOBSTER TAIL NOZZLE PERFORMANCE FOR95 DEGREE VECTOR ANGLE
49 L

DATA: REF 8
0.04,
It
• 0.02 ŽN.
q
L -0.02
-MO4.
-01.04
1.0 4.0
2.0 PRESSURE RATIO - PT/P'o 3.0
PTO* 2A0
> /A4
<0.02 4-
0.02
0 20 40 0 8o 100
VECTOR ANGLE, 0 , DEGREES
Fitwre 33: EFFECT OF VECTOR ANGLE AND NOZZLEPRESSURE RA TIO ON LOBSTERT.* IL NUZZL FPERFORMANCE
50

DATA: REF 12
1.0
IH--------------------- -FLAT PLATE, CURVED
-S/ CUDEFLECTOR CVzLa
. 8/-CURVED DEFLECTOR C
~0.8
0
o0.7
FLAT PLAT DEFLECTOR C
ull
S0.5
0.4
0 20 40 60 80 O00
IDEAL DEFLECTION ANGLE.O DEGREES
Figure34: EFFECT OF DEFLECTION ANGLE ON FLAT
PLATE AND CUR VED DEFLECTOR PERFORMANCE
51

DATA: REF 12
1.0 comwAYREFP ENCE .... .__ 00NOZZLE CD
-r" .. - - . . . . . . .700
U.u_0
uol
T'/ EST OLEC .V,70 H
1 TEST.0---0---NOZZLEERco
LLLL
o0.u
(1.7
1.0 2.0 3.0 4.0
NOZZLE PRESSURE RATIO, PTN/Po
Figure 35: EFFECT OF NOZZLE PRESSURE RATIO ANDDEFLECTION ANGLE ON CURVED DEFLECTORPERFORMANCE
52

UU
I - -____ - -
ICIm
Ab 0
cF
N
Na
LV0_____ 0
£z
* 4 N
:110- 3l9NV UOLD3A 3A1±)3dJ3
Figure 36:- EFFECT OF FLA TPLA TE LENGTH ON JETDEFLECTION ANGLE
53

0O0.8
401°
0.7
0.6
" 0.5
-II
U. O.A
02
0.1
00 1.0 2.0 3.0
SETBACK RATIO - X/h
Figure 37. MITRE BEND DATA, CONTRACTION COEFFICIENT
VS SETBACK DISTANCE
54
2.1.4 Cascade Lattice Loss Correlation
Correlations were employed to predict losses across TR or TVcascade lattices in terms of velocity and discharge coefficients.The prediction method employs pressure loss data of Ainley andMathieson (Ref. 15) and a momentum thickness correlationdefeloped by Stewart (Ref. 16). Ainley and Mathieson's dataare used to obtain total pressure loss, exit Mach number andexit flow angle. The entrance and exit flow propertiesused to calculate reaction across the blade row. Reaction isused in Stewart's correlation for trailing edge momentumthickness. Velocity and discharge coefficients are readilydetermined from boundary layer momentum and displacementthicknesses.
A commonly used system for defining the geometry of a bladerow and the flow angles relative to a blade row is illustratedin Figure 38. Flow inlet angle 0(, is a required input for theanalysis. For thrust reverser lattices, 0, may vary from 0 de-grees to 90 degrees along the blade row. Consequently, alogical range of values should be used when analyzing a particu-lar design. Also, note that the values of flow outlet angle 01are numerically negative in Figure 38. For thrust reverserlattices, discharge angle eis related to Az by the followingequation.
C°e + 0(, (27)
A family of profile loss curves are shown in Figure 39 forreaction blades at iow Mach number (M-0.5), high Reynoldsnumber (Re = 2 x 10 ), and zero incidence. Profile losses arepresented in terms of pressure loss coefficient, Yp.
Yp = loss of total pressurertotal pressurel ptatic pressure 1[at blade outlet]-[at blade outlet] (28)
A family of curves for profile losses of impulse blades is shownin Figure 40. Profile losses of blades intermediate betweenreaction and impulse blades are interpolated by the followingequation:
=( t/1cO )Ye 0);--' [+(hL "tP(.LeO)]J (29)
In order to find the variation of profile loss with incidenceangle, it is necessary to find the stalling incidence (i ),defined as the incidence at which the profile loss is twice theminimum loss. The variation of stalling incidence and flowoutlet angle with pitch to chord ratio is shown in Figure 41.The effects of blade inlet angle and flow outlet angle on stallingincidence are shown in Figure 42. The stalling incidence foundfrom Figures 41 and 42 is used to find the relative profile loss
55

d rq
zz20
zz0 >2 z
CA 0 N
00
2I IL N
2 IL
2 1 -
zz
taa
5> 1 1
\Krl
56

00tIC = 02M < 0.6Re 2 x 10⁵
0.12
0.10
0. -800 = c,C 2
g 0.06z
-750U.LL
o 0.060 -700
-0
-J .650LL0.04
0 0.02.-0
0 0.2 0.4 0.6 0.8 1.0
BLADE PITCH/CHORD, S/C
Figure 39: PROFILE LOSSES FOR REACTION BLADES AT ZERO INCIDENCE
57

0.20
0.18
0.16 __-__°
0. \0
S0.14 -zLu
o0.0
M0LL0 S 0.10-
Lu
U.
o0o0.0 48.0 .2
0.0
- 00
0.02 ~Rea -2 x10
0 0.2 0.4 0.6 0.8 1.0 1.2
BLADE PITCH/CHORD. S/C
Figure40: PROFILE LOSSES FOR IMPULSE BLADES ATZERO INCIDENCE
58

VARIATION OF STALLING INCIDENCE WITH a 2 AND SIC__0
10
S-10 M <0.6
I R- 2x 100
-20-
0 0.2 0.4 0.6 0.8 1.0 1.2
BLADE PITCH/CHORD, S/C
* VARIATION OF a2 WITH S/C
1.1-
* ; 1.0-dr
1,1
0.9-
0 0.2 0.4 0.6 0.8 1.0 1.2
BLADE PITCH/CHORD. S/C
Figure 41: VARIATION OF STALLING INCIDENCE AND FLOW OUTLET
ANGLE WITH PI TCH/CHORD RATIO
59

p
M < 0.6Re -2 x 10⁵
a 2- "70°
40
LU
0L 2oz
0
-1.0 -0.5 0 0.5 1.0
a 2(SIC -0.75)
Figure 42: VARIATION OF STALLING INCIDENCE WITH dLADEINLET ANGLE AND FLOW OUTLET ANGLE
660

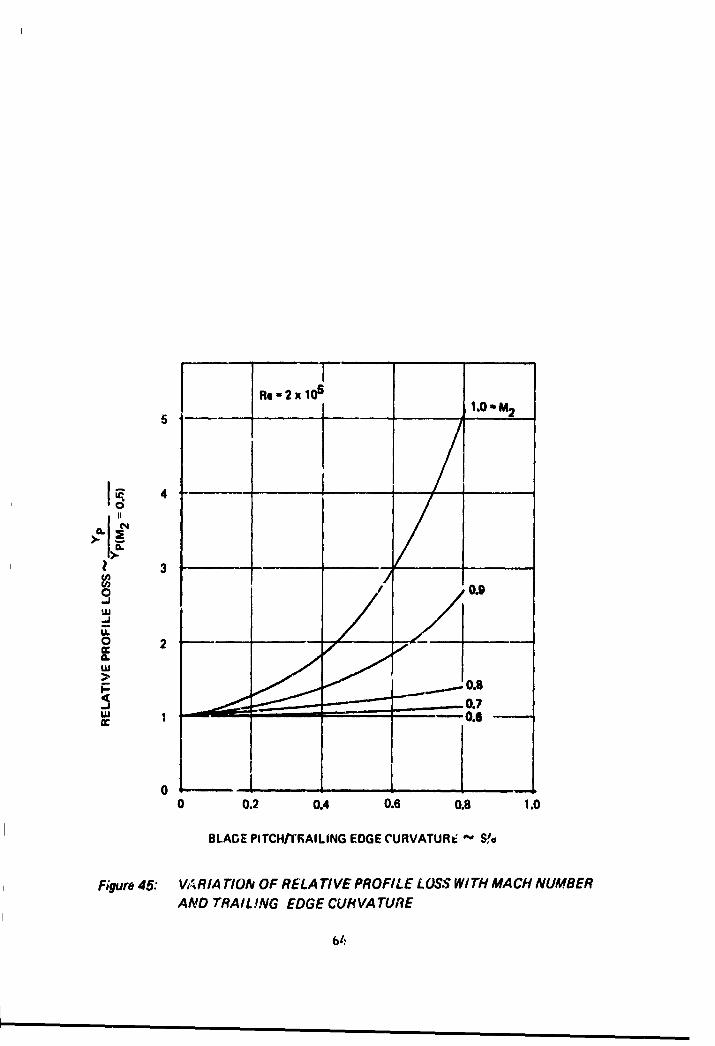
and change in flow outlet angle from Figure 43. For positiveincidence angles, the flow outlet angle decreases with increasinglosses. Effects of exit Mach number M are shown in Figures44 and 45. Flow outlet &ngle is obtaifed from Figure 44a forexit Mach number M e- 0.5 and Figure 44b for M = 1.0. Linearinterpolation is uied for intermediate Mach numaers. The effectof exit Mach number and blade trailing edge curvature on re-lative blade profile loss is given in Figure 45.
Effects of Reynolds number are shown in Figures 46 and 47. Pro-file losses and flow outlet angle decrease as Reynolds numberincreases.
Entrance and exit flow properties (Figures 39 to 47) are used tocalculate reaction across the blade row:
Rc I I- V- (30)Vt.
where V1 and V are entrance and exit velocity. A correlationbetween reactign and trailing edge momentum thickness wasestablished by Stewart (Ref. 19) as shown in Figure 48. Thefollowing equation corrects for Reynolds number effects.
A \. \~bL ReJ (31)
where ( ,/.Z )6 is obtained from Figure 48 and baselineRe =300,000. The fraction of momentum loss ba3ed on actual weightflew is given by the following equation for a ).wo-dimensionalcascade.
"4 ."o I ) ( + ( + (32)It+
where total boundary layer displacement thickness at the bladetrailing edge St is related to momentum thickness Of by theequation
Stet (33)
Data and theory for form factor H are shown in Figure 49. Theterm m,,•Dconsiders the blades to have infinite length. In acascade, however, there are end walls and stiffeners that alsohave boundary layer losses that are appreciable. Losses onthese surfaces are assumed equal to the average loss occuringon the blade surfaces. Therefore, the factor to correct forend walls is given by the area ratio
A ,_ A wal.e+ Awail = I+ W411 (34)
61

VARIATION OF RELATIVE PROFILELOSS WITH RELATIVE INCIDENCE
5
M2 <O.
Re-2x 10l
4
- 3
w-iU.0cc
Lu> 2_ _
Lu
0-4 -3 -2 -1 0 2
RELATIVE INCIDENCE, i/is
0._ VARIATION OF a2 WITH RELATIVE
2 •PROFILE LOSS AT POSITIVE INCIDENCE
(g -3
1.0 1.2 1.4 1.6 1.8 2.0 2.2
RELATIVE PROFILE LOSS, YP/YPMIN
Figure 43: VARIATION OF LOSS AND OUTLET ANGLE WITH INCIDENCE
62

-90 - -u
Re - 2x 10l
a 2 a*- 4 s--70
wLU
fs0
-m0
-40-
I/
20 30 40 50 60 70 80
COS"1 0.), DEGREESS
0) FLOW OUTLET ANGLE WHEN M2 < 0.5
C ha Re a2 x.1068 0.2n
+ 0.1
00 0.2 0.4 0.6 0.8 1.0
BLADE PITCH/TRAILING EDGE CURVATURE, S/e
b) FLCW OUTLET ANGLE WHEN M2 = 1.0
Figure 44: VARIATION OF FLOW OUTLET ANGLE WITH MACH NUMBER
AND BLADE TRAILING EDGE CURVATURE
63
6 1.0- M2
5
F, 3
0 . 0.9
"".0 2 - _
w
>
01--0I
0 0.2 0.4 0.6 0.8 1.0
BLADE PITCH/TRAILING EDGE CURVATURE - S!,s
Figure 45: VARIA TIOIl OF RELATIVE PROFILE LOSS WITH MACH NUMBER
AND TRAILING EDGE CURVATURE
64

5.0
S..... SUGGESTED MEAN CURVE
'FOR TURBINE BLADES
x
a3.0 ____TYPICAL
I COMPRESSORcc J BLADE
--J 2.0 . .U. 0
- 1.00
0.2 0.3 0.4 0.6 0.8 1.0 2.0
REYNOLDS NUMBER X 10-5
Figure 46: EFFECTS OF REYNOLDS NUMBER ON PROFILE LOSSES FOR CASCADE LATTICES
65

+10
100N
reII
-2 .10
I- .30
_ 0.2 0.3 0.4 0.6 0.b 1.0 2.0
REYNOLDS NUMBER X 10-5
Figure 47: EFFECTS OF HEYNOLDS NUMBER ON FLOW
OUTLETANGI.F FOR CASCADE LATTICES
66

0.02
DATA: fIEF 16
. 0.01
002 0.4 0.6 0.8 1.0
REACTION, R
Figure 48.' CORRELATION RELATING REACTONA#ND
MWqENTUM THICKNESS FOP, CASCADE LA TTICES
67

3.0 S.Ot) DATA: REF 16
- CALCULATED FOR POWER LAW VELOCITY,PROFILE WITH n , 1/7
S2.0 0
1.0
0 0.2 0.4 0.6 0.8 1.0 1.2
FREESTREAM MACH NUMBER, Mo
Figure 49: FORM FACTOR DATA FOR CASCADE LATTICES
68
For a cascade lattice with no stiffeners, it can be shown that
Azo - I + --Az ( A (35)
where S is stagger angle (see Figure 38) and blade aspect ratioA = blade length/chord. If the cascade lattice has stiffeners,their wetted area should be included in the term Awall of
Equation ý4. The area ratio A3 D/A2 D is used to correct"'o. for
losses on end walls and stiffeners.
AspM•)•O ' A% A, (36)
Velocity coefficient is given by
Cv =-M2,0P - !LN Q~ , mso kVeXF 1io103e3 r' (37)
Discharge coefficient is given by
Co = l-HmZ,•o (38)
The prediction method computes C and C for cascade lattices.To obtain reverser efficiency, v;ctor eificiency, and airflowmatch, the following equations are used:
CyCvo5r (39)
CV• (40)
Co A t- (41)Co, A*
2.2 Task 1.2--Construct Computerized Analytical Models
The purpose of Task 1.2 was to develop computer programs forpredicting TR and TV nozzle performance and evaluating TR andTV influence on the total airplane/engine system. Three computerprograms were developed:
1) Jet Trajectory and Spreading Program (TEM-356A)2) Reingestion Prediction Program (TEM-356B)3) TR and TV System Performance Program (TEM-357)
69

The numbers in parenthesis are permanent identificationnumbers assigned to the programs by Boeing Computer Services,Inc. Further description of the programs is provided in thefollowing sections.
2.2.1 Jet Trajectory and Spreading Program
The purpose of the Jet Trajectory and Spreading ProgramTEM-356A is to predict the shape of the exhaust plume emanatingfrom a TR or TV nozzle. The exhaust plume definition is usedto predict potentially severe aerodynamic interference and controlproblems that could be caused by plumes impinging on or passingclose to flight control surfaces. The program also is used toprovide definition of TR exhaust plumes to the ReingestionPrediction Program TEM-356B as described in Section 2.2.2.
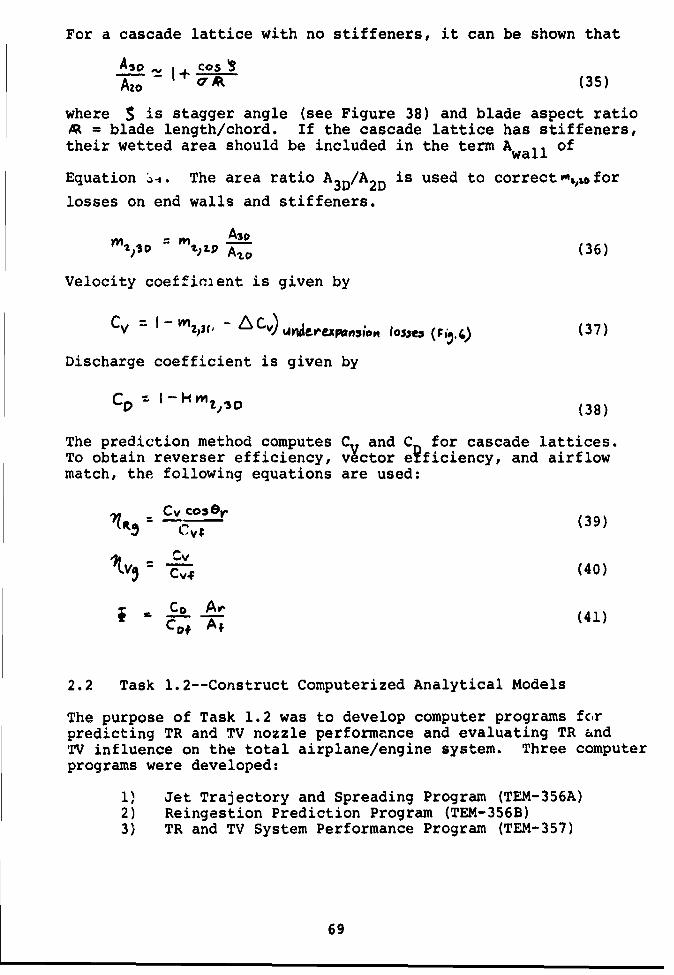
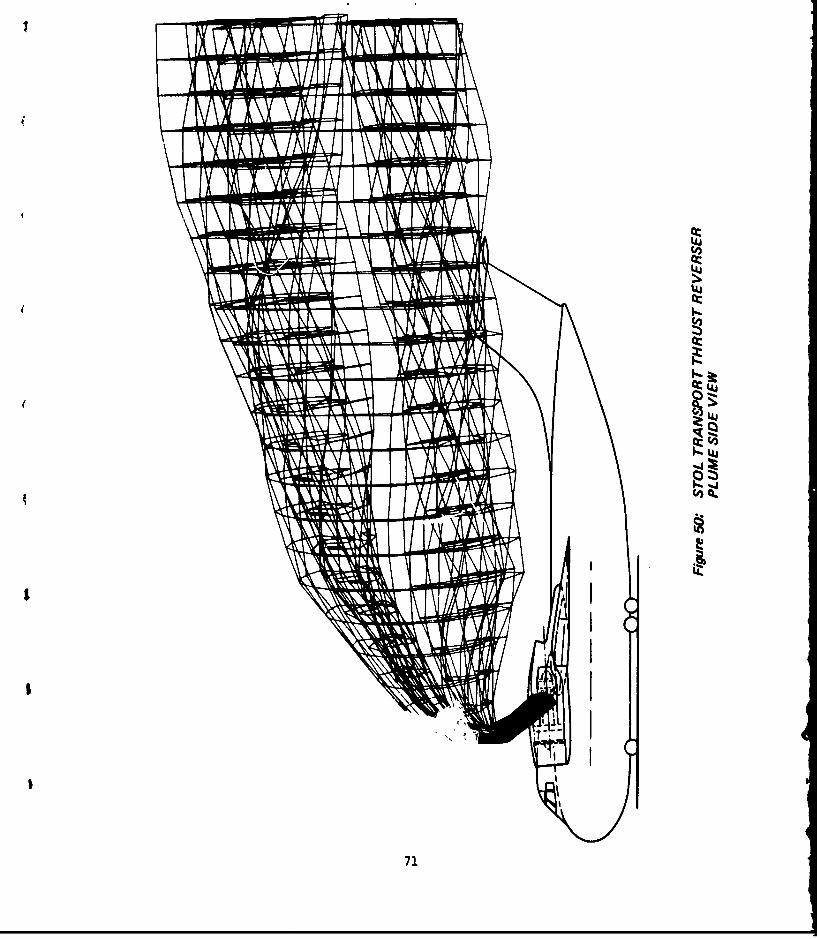
As an example of the program's usefulness and purpose, Figures50 to 52 show a thrust reverser exhaust plume for a two-engineSTOL transport. The jet plume was computed by TEM-356A todetermine the jet trajectory and plume shape relative to theaerodynamic control surfaces at 110 knot freestream velocity.Most STOL transports are expected to land at about 90 knots,so 110 knots should represent a more critical condition fortail interference effects. The thrust reverser efflux appearsto impinge on the horizontal stabilizer in the side view. How-ever, the front view shows that the lower vortex lobe is outboardof the stabilizer. The analysis indicates that the thrust re-verser plume would not cause any severe aerodynamic interferenceproblems by impinging on flight control surfaces.
A diagram showing inputs and outputs of the Jet Trajectory andSpreading Program is given in Figure 53. Inputs conzist ofTR or TV nozzle position, orientation, exhaust flow direction,the type of jet and nozzle and freesteam flow conditions. Out-put consists of the jet centerline in (x, y, z) space and con-tours of the jet cross sections defining the boundaries betweenthe TR or TV exhaust flow and freestream flow. The analysisuses an empirical equation 'or the jet centerline, empiricaljet spreading coefficients, and theory for the jet crosssection. The following sections describe the analysis in moredetail.
Jet Trajectory Equation
There are numerous empirical equations that predict the trajectoryof a jet in a crossflow (Ref. .17 to 24). Table IV summarizesempirical equations for the jet trajectory, together with theirrespective ranges of validity. The empiric'l equations wereobtained by curve-fitting data from flow visualization experi-ments. Comprehensive reviews of the empirical equations weremade by Filler (Ref. 25) and Margason (Ref. 24). Filler con-cluded that empirical equations of Ivanov, Shandorov, andMargason compared favorably within their respective ranges ofvalidity. Margason also concluded that Ivanov's equation provided
70
kI
IJ
I.
II
71

QC
acI
I..-
72
A LLU
LU
a-c-
ý j
73

JET TRAJECTORY AND SPREADING PROGRAM
INPUTS:
1. TR or TV NOZZLE POSITION AND ORIENTATION
2. TR or TV EXHAUST FLOW INITIAL DIRECTION
3. TYPE OF JETa. ROUNDb. RECTANGULARc. TWO-DIMENSIONALd. ANNULAR
4. FLOW CONDITIONSa. JET/FREESTREAM DYNAMIC PRESSURE RATIOb. FREESTREAM VELOCITY MAGNITUDEc. ANGLE OF ATTACKd. ANGLE OF YAW
JET TRAJECTORY AND SPREADING PROGRAM
1. EMPIRICAL EQUATION FOR JET CENTERLINE
2. EMPIRICAL JET SPREADING COEFFICIENTS
3. JET CROSS SECTION ANALYSIS
OUTPUTS:
1. POSITION OF JET CENTERLINE IN (X,Y,Z) SPACE
2. CONTOURS OF JET CROSS SECTION (BOUNDARIES
BETWEEN TR or TV EXHAUST FLOW AND FREESTREAMFLOW)
Figure 53: JET TRAJECTORY AND SPREADING
PROGRAM DIAGRAM
74

91-4
cc
-0-
0'0 u'
000'6
a mu!
V - 75

--W- .w r T
a good fit to his data at most of the deflection anglesbetween 30 and 150 degrees. The range of validity forIvanov's equation is clearly known and closely meetsconditions of thrust reverser/vectoring, namely0 i qj/qw t 200 and 30 degrees t_ K0 ! •150 degrees. For
these reasons, Ivanov's equation was selected for use in theJet Trajectory and Spreading Program. Trajectories comput-ed using Ivanov's equation are compared to test data inFigures 54 to 56.
Ivanov also experimented with rectangular jets (1:5 -a/b. 5:1)and concluded that to a first approximation the equation fora circular jet is adequate provided the hydraulic diameteris used instead of the initial jet diameter.
For two-dimensional jets, the equation of Vizel and Mostinskii(Ref. 23) was selected.
t CO A0 (42)
Experimental data for jet penetration coefficient C are shownin Figure 57 from Ref. 26. The straight lines drawK throughthe data are used in program TEM-356A. The line for 0( = 90degrees is used for discharge angles less than 90 degrgesand the line for 0( = 135 degrees is used for angles greaterthan 135 degrees. Interpolation is used to obtain jetpenetration coefficients for 90 degrees ( o- 4 135 degrees.Comparisons of Vizel and Mostinskii's results with test dataare shown in Figures 58 and 59.
Jet Spreading Coefficients
Experimental jet spreading coefficients obtained for around jet discharging at 90 degrees to a freestream flow(Ref. 22) are used to predict thickness and width of theexhaust plume. A lack of data exists for other dischargeangles and jet shapes. Moreover, there is considerabledisagreement for jet thickness to width ratio, 6/w, betweenthe data of several investigators.
Pratte and Baines' jet thickness spreading coefficient datafor a round jet in crossflow are presented in Figure 60 fromRef. 22. The following empirical equations provide a goodcurve fit to the data.
(0id) Toe 316 (43)Vi /Us 7A0 Z Vj /U00
V-' /L-00 1... k V./WOO) Vi7 (44)
76

ww
I2
I0
z owz cc-
00 I
4Uu4
CN w
C4 C6 0
0Oco Zi
448Dk
,--Il - -
zzzzz'2z:..77
LUjI T4 -
I I U.
1% 'a -t
0
~ w I
0~~~~~~ 1e__-
_- -
WT-
Go V
PI) 1V YOWf 0NiI--07

0 rrCD
v'-1 -
U. Z
4k 0~
4u.u
~~ Lw
W/O -IMWW3NII
799

XAOO
Z/t /
x/t
x
1. o 130 - -
LU
\z _
9wo-
LL Cx"'1+0.5(..L
0 Us
14 I -
u 8
-6
--I •,,"I • CxlO.6':-
VETY UOO
00
Figure 57; JET h"ENETRA T/ON COEFFICIENT DATA FOR
VIZEL ,AV&j MOST.'NSKII'S TRAJECTORY EQUATION
80
zC4 0
N 4
0JN
0
jj.j--
0;z
U. C
z
U,5
47
SlX'1MOO1V3Nii
a81
x C' Y) 0
8 0w0*
z (n(z
co
040000
491
ac 00
1 11
ol.3 z Q' V WNA 0NISC
_ _ _ _ _ _ _ _ 82
lw
10
5
2 &6/do(/ 0.331.~~0 v______ /0. 1 .16
-.0 - Vuo ___ iU:
6/do
0.5
0.2
0.1 6/o 0(S/do )1-35
0.05 v i/uc,. vi/uz@
0.02
0.01 1...............A... 1 1 1 tillIAI I I . i. .I A lif A I
0. 02 0.5 1.0 2 5 10 20 too 2010 500 1,000
S/d0
v ./umo
Figure %O THICKNESS SPREADING CHARACTERISTICS OF
A ROUND JET PREPENDICULA R TO A CROSS FLOW
83

These empirical equations are used downstream of the jet'spotential core. In the potential core region, the thicknessto diameter ratio is equal to 1.0. Setting S/do = 1.0 inEquation 43 and solving for s/d gives
(-L) = Z.131 V 0.Z.93 (5
Summarizing, the following equations are used to compute jetthickness.
- = ).0 foe Xs C.Ž.- (46)Ci d, dS Ipoeftalw
Vl -0.35 Co^
3 c _.1 A_ (47)
CO V*
: .,., Oi[ 0.- v o.t7Hb W for -. 1311 ,*I.- (48)
Pratte and Baines recommend a jet width-to-thickness ratio of1.4 based upon their flow visualization experiments. Thisvalue compares to width/thickness ratio w/S = 1 measuredby Gerend (Ref. 28), w/5 - 4 recommended by Wooler (Ref. 29)and w/5 - 5 suggested by Abramovich (Ref. 17). Pratte andBaines' w/S - 1.4 was selected because the test section wasconsidered large enough to represent full-scale jet spread-ing characteristics and because of superior data repeatability.
In the potential core region, jet width is obtained by inter-polating between w/S - 1 at the origin and w/S - 1.4 atthe end of the potential core. Equations for jet width are
w r /dor 'a41.4L fTOP (49)0 W40) do do
"tooI COP&
84
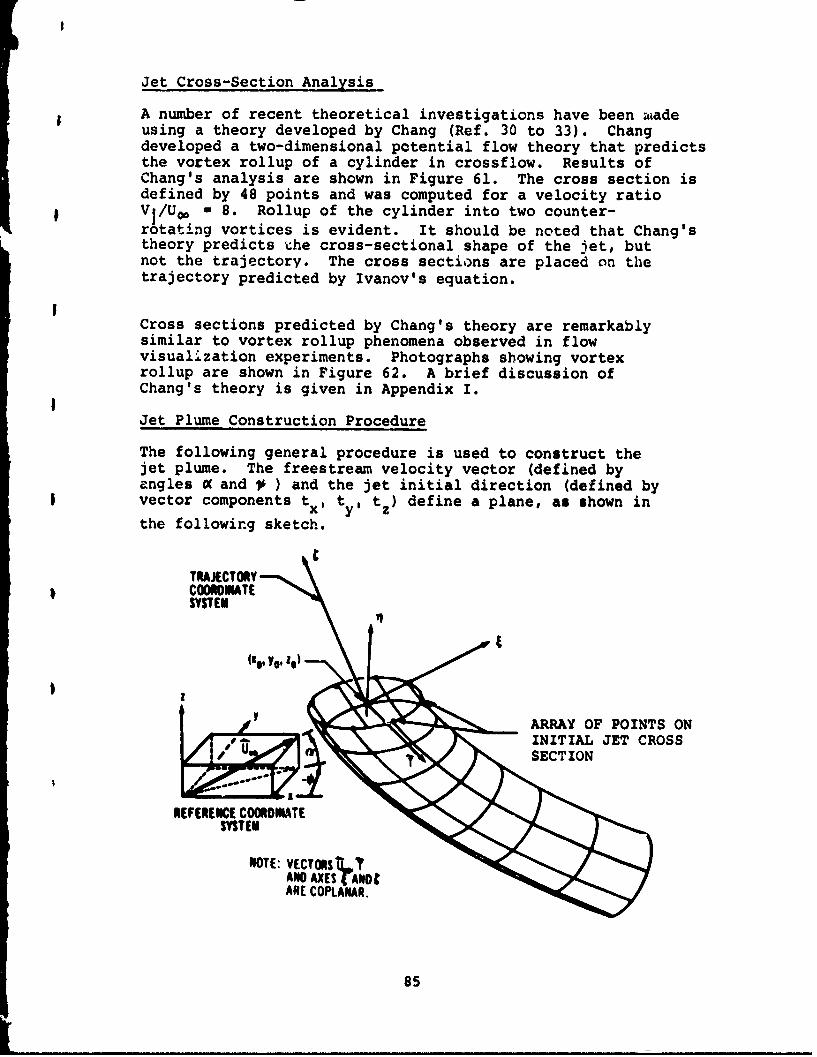
Jet Cross-Section Analysis
A number of recent theoretical investigations have been itiadeusing a theory developed by Chang (Ref. 30 to 33). Changdeveloped a two-dimensional potential flow theory that predictsthe vortex rollup of a cylinder in crossflow. Results ofChang's analysis are shown in Figure 61. The cross section isdefined by 48 points and was computed for a velocity ratioVj/Uo = 8. Rollup of the cylinder into two counter-rotating vortices is evident. It should be noted that Chang'stheory predicts the cross-sectional shape of the Jet, butnot the trajectory. The cross sections are placed on thetrajectory predicted by Ivanov's equation.
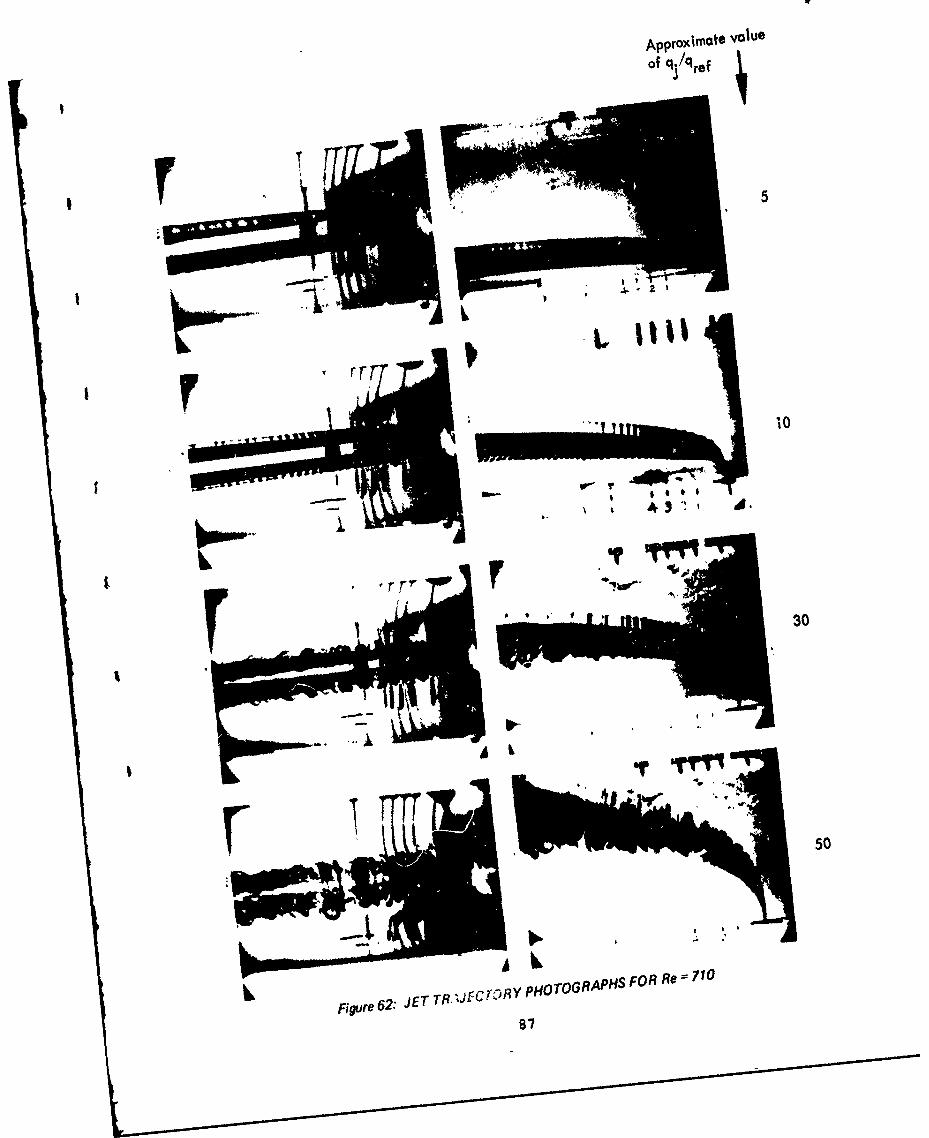
Cross sections predicted by Chang's theory are remarkablysimilar to vortex rollup phenomena observed in flowvisual1zation experiments. Photographs showing vortexrollup are shown in Figure 62. A brief discussion ofChang's theory is given in Appendix I.
Jet Plume Construction Procedure
The following general procedure is used to construct thejet plume. The freestream velocity vector (defined byangles 0 and P ) and the jet initial direction (defined byvector components tx, ty, t ) define a plane, as shown in
the following sketch.
TRARCTORYCO1MNATESYSTEM
(i. Y, z a) --
ARRAY OF POINTS ONINITIAL JET CROSS
REFERENCE COORDINATESYSTEM
NOTE: VECTORS
ARE COPLANAR.
85

ISOMETRIC VIEW
TOP VIEW OF BOTTOMHALF OF JET
SIDE VIEW OFBOTTOM HALFOF JET
FCire 61: COMPUTER GRAPHIC DISPLA YS OF CHANGCROSS SECTION FOR Vio/U8 886
Approximate valueof q./q ref
5
30
50
Figure 62: JET TRIJErC)Ry PHOTOGRPSFRR 1

The jet centerline is assumed to lie in the plane defined byvectors V, and I.
Jet cross sections are computed for each station along thejet centerline using Chang's analysis for round or rectangularjets. Thickness and width spreading coefficients are usedto define gross deformation of the jet as shown in the followingsketch.
SW
The program then centers the cross section on the axis andscales the jet cross-section to the correct size, as shownin the following sketch.
Ye
+ (51)
(52)
YC 2 iCy(53)
Yc V C - (54)
88

Geometric Capability
The Jet Trajectory and Spreading Program was formulatedwith considerable flexibility so that it can be applied toa wide vnriety of TR/TV geometries. The program predictsfour types of TR/TV exhaust plumes. Inputs and calculationprocedures unique to each jet type are discussed below.
1) TYPE = 1. Circular jet cross-section.
This type of jet models the flow from round nozzles,e.g., three-bearing nozzle, spherical eyeball, or a purelift engine buried in a fuselage or pod. Inputs forTYPE = 1. are depicted graphically in Figure 63 andsummarized in Table V. The calculations use Ivanov'strajectory equation and Pratte and Baines' spreadingcoefficients. Vortex strengths for Chang's analysisare computed using Equation 11 in Appendix I. Asample case is given in Appendix II.
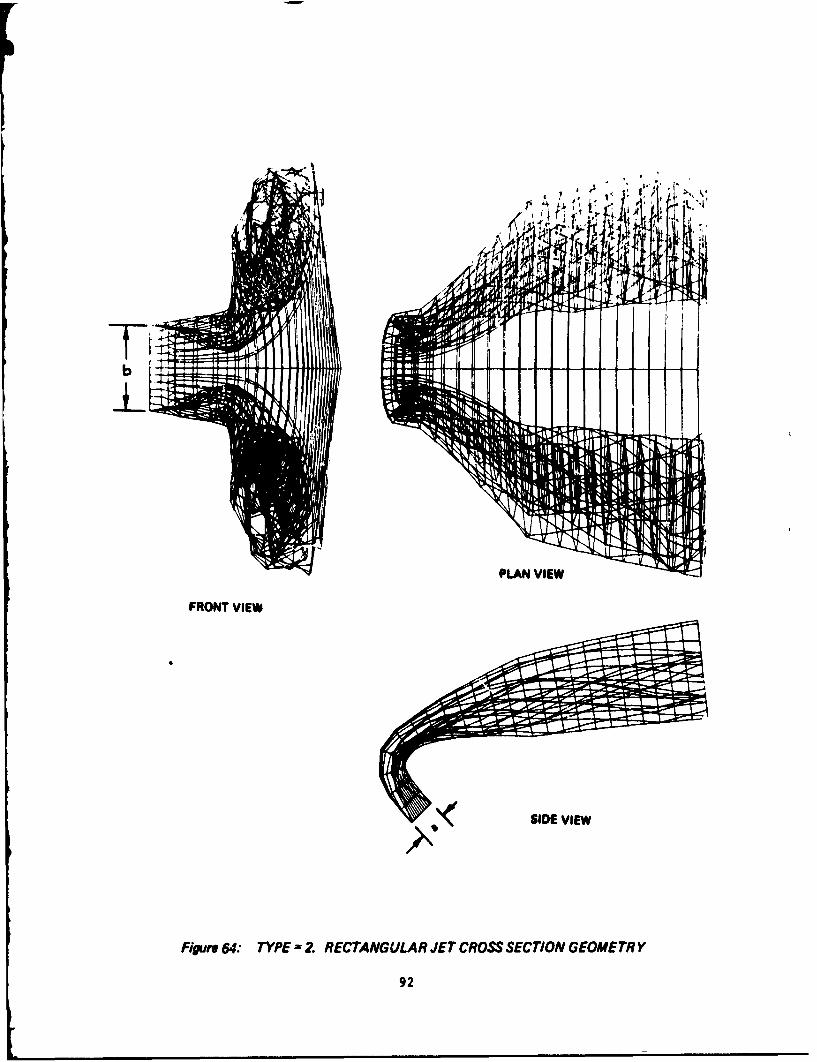
2) TYPE = 2. Rectangular jet cross-section.
This type of jet is best suited for cascade or targetthrust reverser plumes that can be approximated by arectangular iniLial cross-section. Inputs for TYPE = 2.are depicted in Figure 64 and summarized in Table VI.The calculations use a hydraulic diameter in Ivanov'strajectory equation
4(i4itiaI•. ar) 7.k bpom• r: wie"--"44 (55)
where a and b are the length and width of the initialcross-section. Pratte and Baines' empirical jet-spreadingcoefficients are used for jet thickness and width.Vortex strengths for Chang's analysis are computed fromtable lookup as described in Appendix I. A sample caseis given in Appendix II.
3) TYPE - 2. Two-dimensional jet cross-section.
This type of jet models the flow from a slot nozzle orhigh aspect ratio rectangular nozzle. Inputs forTYPE a 3. are depicted in Figure 65 and summarized inTable VII. Vizel and Mostinskii's quadratic equation isused for the jet centerline. Pratte and Baines' spreadingis used for the jet width. Chang's analysis for thejet cross-section is not used because it was developedfor a discrete jet shape, not an infinite jet sheet. Asample case is given in Appendix II.
4) TYPE = 4. Annular jet cross-section.
89

cl)
900

a, E~ 44
ON ty l ~U
4) 4Q (4 , a, ~ a
H 0 0$.94 r4
u 0 03Un 4) 4J *9-q
M) M 4J V44
U) U) 4.) (d*Haon U) 14n
0 am4a ,E9. 04 4) Id4) L
C)$ 04J 43 U)4Ur, 4.) to V'a
4) to 9 : *r4 4 ) 1.)
ri 4 " a 1 0 ON-4-Il to 0 9' IVar4 C) P.4 .4 W*4).
H 3 C: 4.4 9 :0 olr-4u 4) w4 a, a, Ire go >
14 ra 4) NU' 4) 194go E 44 m ) a, V 9 4 14
H- r- a, 4) -#.14 4J W)' 4~ 4~ u C) a 0 9 0
~4) 41 a w rq
rj rf 0* 41 14 Eu r.* , U% C 4 tU% 4.4 ) N~ 4.4 0 0
4) -r *94 94 w 0 0 too Eu1414 a~ 0 0 4)4) 0 0 94 H. 41 IA a, a ~ >5
.94 41 ) H- H C)w 'a 41 C) 41) 04) 4) U' U'
4 a, a, 0 1 w w 01 w 9D9 , > *r-Eu 4.4 E u ~
144)4 In U
>.40 r-4 Z4H ,~U) C
1 4 11.H4)
4)4.94
Eu .4 0 N 4)
4) 41)-r4 4J % % N. U' w9
CZ E-4 X 4.) of
1*1
PLAN VIEW
FRONT VIEW
,•,•rSIDE VIEW
Figure64: TYPE-2. RECTANGULAR JET CROSS SECTION GEOMETRY
92

41)
* a 0) 0)0 0) 14 10
4) N r4 01 a) toEn m 1 m V ..4 V V1
H 0 r- o4) 0 (
W41 IV - 4 ) IV 0.4 j.r -r 4) U mua
)4 VC) r. H 4- 4)r4 0) -,- 4 U) 0 f0g
a)V e 0 0Pr -0% U r 4 9: 4.) -.4 0
o 04 >, 0 0H >) -j 4b14 U) 9r r. rl 4) o4 II
a) -H r. -,- a) 0 V4)V 4) 0 H 44 4) >1 *.4 0 9
Ca ) 0 *4 0 0 - v. >0 o4 V )~0 41 V'. 14 0 )U 14*9 0) J 0 -v4 4) r. U) V a)
IV 14 l0 .,4 0 c 9:V- 0 .'4 0 0) 0 4 U 0 4
go 0) tI1 14. 9-4 U)
94) ti 0 V4. 4 4) 44 U4 t 0 0)V -A 4 0 r'4 1440 0 0r(d .$* 4 a) 4J Ud 4) 0 V d
0 0' 0 0 r4 0 44). 0. >P1 4 0% 04 0 r4HI t
M ) r. a) a) -'. 4 4*4~ ) w>19: 9t
0r4 I N 4 V U O
0'6. 0) 0@ N -.4 -' a$ Ha)w >0 4) x 0 He 0 = Q '0
0 Z E-4 X E-4 -. U 2 Z) 0 .x N' 0
A 0#a 0.wa 4) 0 V4 -4
of 0- N. .6 a)>4. )4o U)4.. 0 *'4 V 4) 1
4)% 0'. %0 H 1 0 00 14 X 44 V E-0440
9.3.

II~li Mllllli.ll
PLAN VIEW
j ISOMETRIC VIEW
SIDE VIEW
Figure 65: TYPE" TWO DIMENSIONAL JET CROSS SECTION GEOMETRY
94

14 14
0
0 0)H 0 U
E-4 4) 0 I
cn 0 f 14
* ~~ 1414 Hr 4) IA4 0U0
C4J FA -.4 V lH o 4) H 41U)'
4) IA4 4) H ) 4 .E- *r, V r,'
H .4 01 H' 4. w40
U) 0 -. '
r40 .,4 41 0 I
( ~~ 0 41V(d F4 '44 to 4j ~ ~ fVH
*4 Vo 4) 4) a >4 EU V -.V 1 q 4 -4) Id 04U
20 ) 9: r.~04 ) 'E- -'4 0 U) 0) 4
Cal U ) * 4 J 0 * 4 J -. 4 4) 4>4 0) .94 to 4 41 0 0 VJ 00
1 4 ) 14 -A Id 54 0VU0 0 0. )14 '- 4) V .
01 V toU )4 4 1 414a. r- V- V1 $4 (Ak -A
-.4 0 r -A F4 -A~ 9U 0r 0U 0 0E- U V
0 0.0-A 'A r-44
C4 F4 0
E-4 > l
.V4V___ ___M__ ____m__ __ __In___.IA4
04 0 W1.44
> U w 0 N 4)oIN *.p E4 x q 061)4 >
r. l 14)) ~ a
OK U)N4S 0
9 Z -4 x A.) e ruu 0Cal 04 2
95
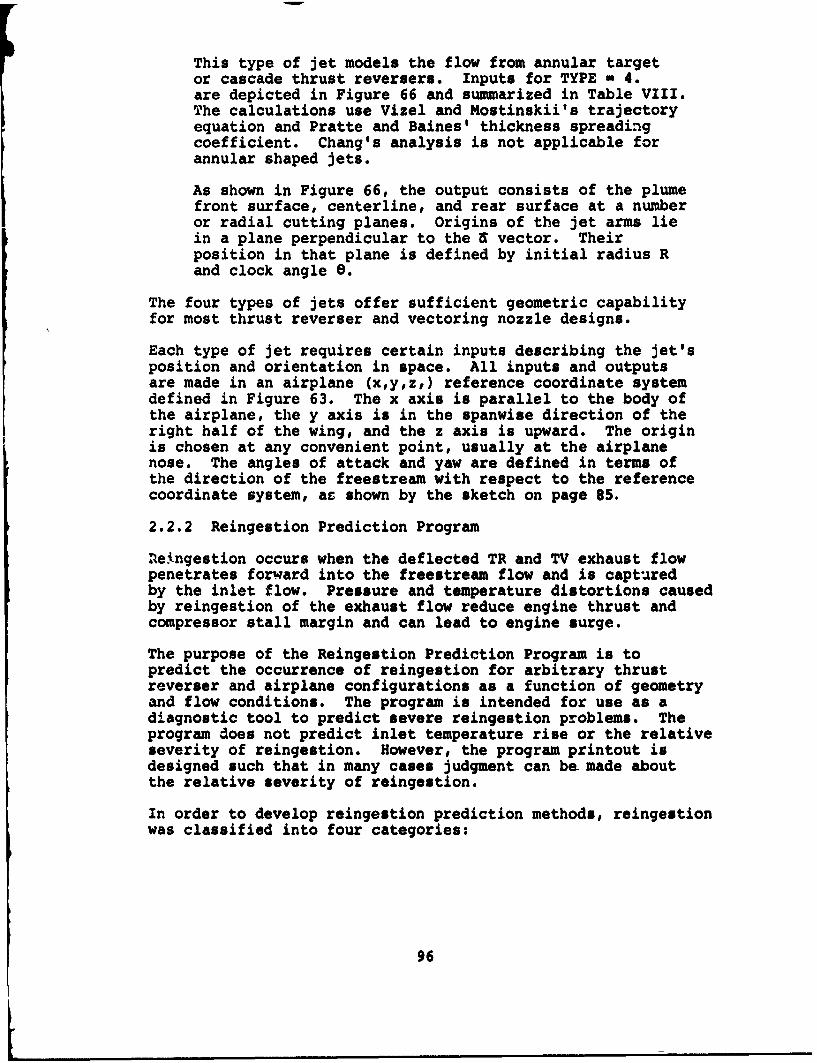
This type of jet models the flow from annular targetor cascade thrust reversers. Inputs for TYPE - 4.are depicted in Figure 66 and summarized in Table VIII.The calculations use Vizel and Mostinskii's trajectoryequation and Pratte and Baines' thickness spreadingcoefficient. Chang's analysis is not applicable forannular shaped jets.
As shown in Figure 66, the output consists of the plumefront surface, centerline, and rear surface at a numberor radial cutting planes. Origins of the jet arms liein a plane perpendicular to the I vector. Theirposition in that plane is defined by initial radius Rand clock angle 8.
The four types of jets offer sufficient geometric capabilityfor most thrust reverser and vectoring nozzle designs.
Each type of jet requires certain inputs describing the jet'sposition and orientation in space. All inputs and outputsare made in an airplane (xy,z,) reference coordinate systemdefined in Figure 63. The x axis is parallel to the body ofthe airplane, the y axis is in the spanwise direction of theright half of the wing, and the z axis is upward. The originis chosen at any convenient point, usually at the airplanenose. The angles of attack and yaw are defined in terms ofthe direction of the freestream with respect to the referencecoordinate system, ac shown by the sketch on page 85.
2.2.2 Reingestion Prediction Program
neingestion occurs when the deflected TR and TV exhaust flowpenetrates forward into the freestream flow and is capturedby the inlet flow. Pressure and temperature distortions causedby reingestion of the exhaust flow reduce engine thrust andcompressor stall margin and can lead to engine surge.
The purpose of the Reingestion Prediction Program is topredict the occurrence of reingestion for arbitrary thrustreverser and airplane configurations as a function of geometryand flow conditions. The program is intended for use as adiagnostic tool to predict severe reingestion problems. Theprogram does not predict inlet temperature rise or the relativeseverity of reingestion. However, the program printout isdesigned such that in many cases judgment can be made aboutthe relative severity of reingestion.
In order to develop reingestion prediction methods, reingestionwas classified into four categories:
96
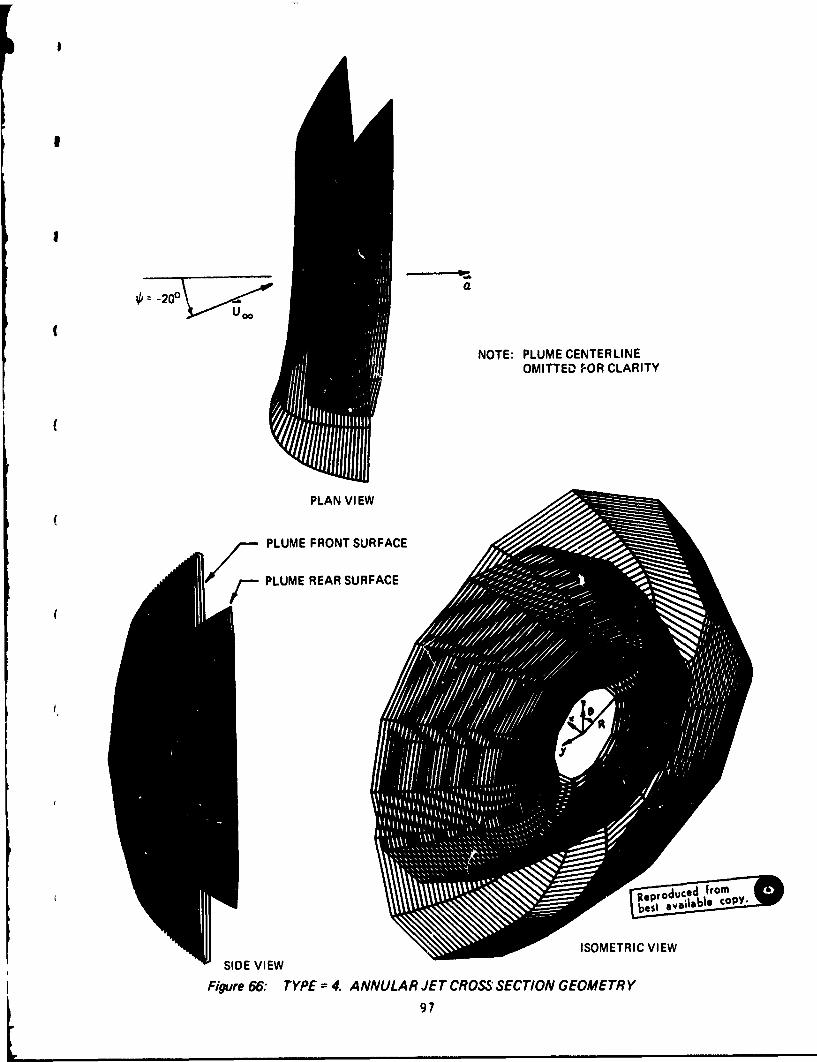
a
NOTE: PLUME CENTERLINEOMITTED FOR CLARITY
PLAN VI EW
PLUME FRONT SURFACE
F PLUME REAR SURFACE
(y
eR;oioue rombe I aearo ale COPY
ISOMETRIC VIEW
SIDE VIEW
Figure 66. TYPE =4. ANNULAR JET CROSS SECTION GEOMETRY
97
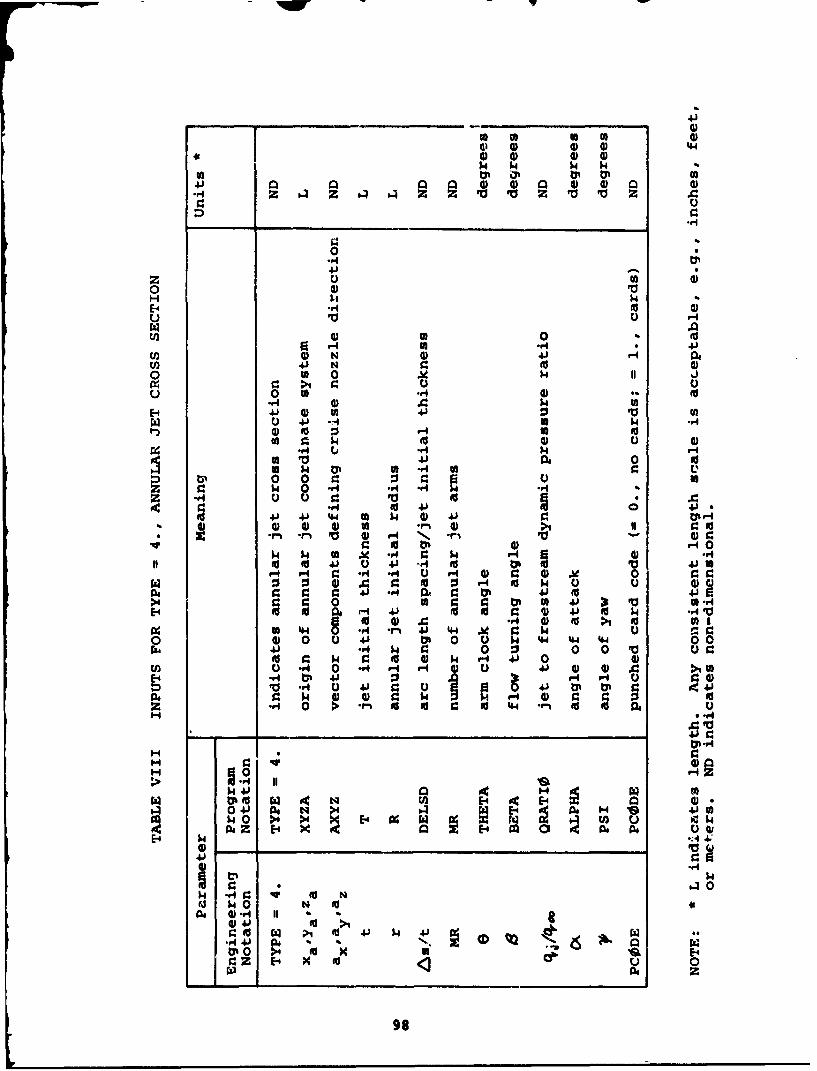
w --
I V V 44
14 1.4 14 14~
41 0 0 V 0 V 0 (Da*.4 4 z. 0 A. .4 z V 'a 'a to Va '
00
0 10
H 5414
E-4 0'-
En V) ra 0 to'
cl) 4 N V41 4Wl 41 N ( V0 to 0 .~14 I
u 0 FAr.0A *.9 V4 to
E-1V 41 'a m)W 41 *-4 FA r4
a- 4 14 r-V4IA u.4 14 '
to 'a 41 J 0 0d
a4 1 4 r4 a r4 a4
'ieU 41 41.41J 4 4 m a 4 0) 41ti f
V) V) Vo V, 4) " Vv- rl 'a V -4 N**r, 'a
40 t% V-014 14 t0 M& -r 9 $4 F-4~ F 94lN eU VU 4 0 04 A' 0dt VI"4- 9-4 13 -A q. -A r-I4 ) V 4) V 014
:% V3 4) 4 0 r 4 014w 0 0 VC : 41 r4 r. 0%U 41 i0 41J1 ~ ~ 1 9 0' FAr N P 4) VO a'a
E-4 C- 44)' 0 (d (d 4 1 0 148 d 0 ) C r~4 V) 0 >,0 40
-A -r, 0 ,4 414 re W 0o V 0 0 41 IM 0 0 W4. W 1. W44 0 0
F441 $' 4 0 :3 0 0 Va0 4~ 0 V 144 441 0V
U) .r 0 -A4P"4 "14 V 41 V V >1t.r 17 41 r.~4 m4
fa P4 V V V 144
al-r
0r4 m 40
0 140 ~ 40 1E40IAs Z; E-4X0
41~
C% 14
CL l Grl II id Nqe 0 N N
4)41 EU >1ao rd w 0 44tr 0 >4 0 x U -
SZ E-4 X i 0
99

o Crossflow reingestiono Self or closed loop reingestiono Near-field fountain reingestiono Far-field fountain reingestion
The computer program treats each category of reingestionseparately. Computer program inputs are the TR/TV and inletgeometry and flow conditions as diagrammed in Figure 67.Output consists of lagnostic statements predicting whetheror not reingestion occurs for the case in question. Methodsused to predict each category of reingestion are discussedbelow.
Crossflow Reingestion
Crossflow reingestion occurs when the exhaust flow from oneengine is captured by the inlet flow of an adjacent engine.The most common occurrence of crossflow reingestion is inthe outboard engine of a four-engine airplane, as shown inFigure 68.
The method used to predict crossflow reingestion employsthrust reverser exhaust plumes calculated by the JetTrajectory and Spreading Program. The exhaust plumes arechecked for intersections with inlet streamtubes. Theprogram prints out the number of points intersecting aninlet streamtube at each jet station.
To predict crossflow reingestion, definition of the inletstreamtube is required. Streamtubes were calculated for arepresentative STOL transport inlet using axisymmetric com-pressible potential flow program TEM-095 (Ref. 34). Theinlet hilite to throat contraction ratio is approximately1.3, diffuser angle equals 5 degrees, and throat Mach is 0.6.Computer-generated plots of streamlines and symbols indicat-ing Mach contours are shown in Figures 69 and 70 for free-stream velocities of 2 and 10 knots, respectively. For lowfreestream velocities, the stagnation streamline attacheson the cowl outer surface far downstream of the cowl leadingedge.
The stagnation streamline defines the pre-entry streamtubeused in predicting crossflow reingestion. Streamtubes aresummarized in Figure 71 for inlet hilite to freestreamvelocity ratio from 137.3 to 2.5. Streamtubes for othervelocity ratios are obtained by quadratic interpolation orextrapolation to obtain the streamtube radius R at anystation.
Arbitrary crosswind angle is accounted for by aligning theaxisymmetric streamtube in the direction of the freestreamflow, as shown in Figure 72. A local inlet coordinate systemis constructed along the streamtube axis. The (x,y,z) co-ordinates of the exhaust plume computed by the Jet Trajectoryand Spreading Prcgram are transferred into this inlet co-ordinate system and checked for possible intersections.
99

I N PUTS:
1. TR orTV GEOMETRYa. POSITION AND ORIENTATION OF NOZZLES AND iN LETSb. EXHAUST FLOW INITIAL DIRECTIONc. HEIGHT FROM GROUND
2. FLOW CONDITIONSa. JET/FREESTREAM DYNAMIC PRESSURE RATIOb. FREESTREAM VELOCITY MAGNITUDEc. ANGLE OF YAW
REINGESTION PREDICTION PROGRAM
1. CROSS-FLOW REINGESTION THEORY,2. CLOSED-LOOP REINGESTION COEMPIRICALCORRELATIONS3. FAR-FIELD FOUNTAIN REINGESTION4. NEAR-FIELP FOUNTAIN REINGESTION
OUTPUT:DIAGNOSTIC COMMENTS PREDICTING THE FOUR CATEGORIESOF REINGESTION
Figure 67: REINGESTION PREDICTION PROGRAM DIAGRAM
100
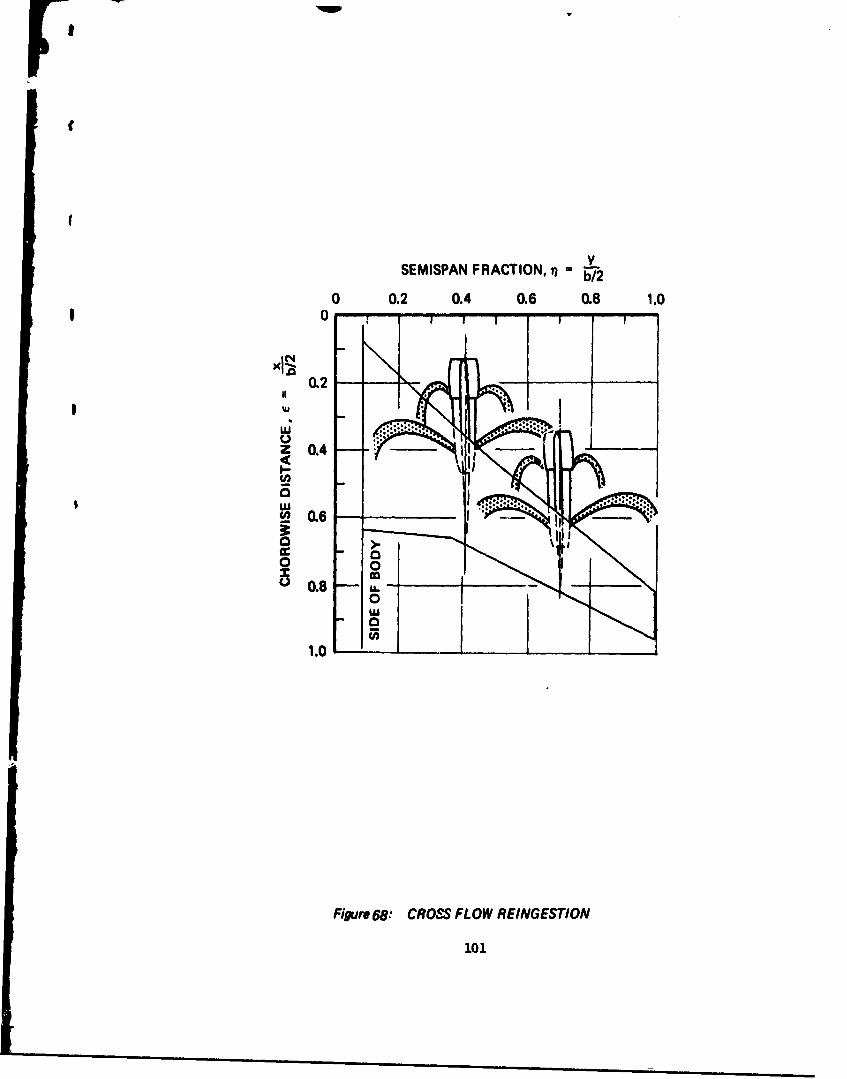
F
SEMISPAN FRACTION, = b2y
0 0.2 0.4 0.6 0.8 1.0
0,2C4
I 'U
xla
1101
z 0.4
0 .8
1.0
Figure6e: CROSS FLOW REINGESTION
101

S.SYMBOL MACH NO.-u 100-00 STRERMTUBEm .2oD .31 •.4 95.00 - -
+ .5x .60 .7 90.00•- -
+ .8
85.00
80.00
75.00
70.00
65.00 -
60.00 ---
55.oo00
45.000 - -
40 "00 I
35.00
30.00 -
25.00 - __ - - --
20 .00 -
15.00
50.00
-1&.00 -90.00 -80.00 -70.00 -60.00

RPES FOR COWL NUMBER C3 CASE. I U= 2. KNOlS V 1 ,,ITAu5d~ 139.33 M t-IN
-SOOG0 -40.00 -30.00 -20.00 -10.00 0 1 0.00 20.00 30.00 40.00
Figure 69
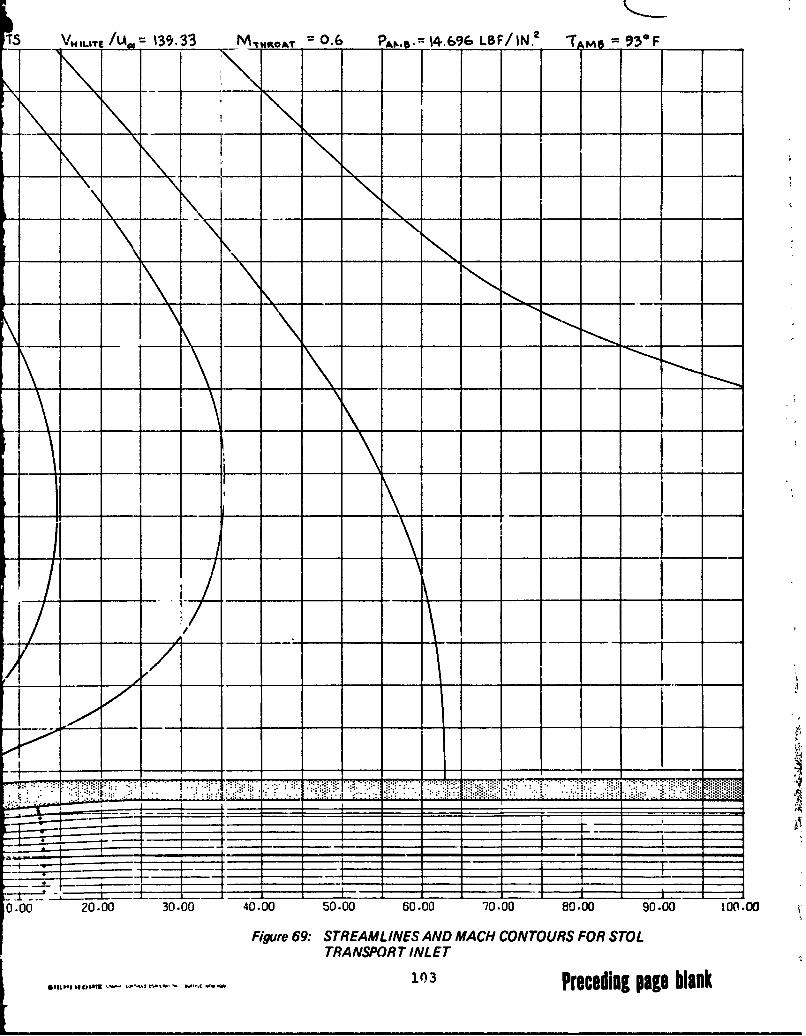
T5 Y 4 41LIT / = 139.33_ MvIT9•.w'r = O.6 PA=.. a 4. 696, LBF/IN.2 =TAMB 9___F
I N
0.00 20.00 30.00 40.00 50.00 60.00 70.00 8o.00 90.00 100.00
Figure 69: STREAMLINES AND MACH CONTOURS FOR STOLTRANSPORT INLET
o 103 Preceding page blank

wxSYI180L MACH NOuut 100.00 -- -STREPMTUBE SHRPESFCR COWNLUl.2 T- _ _
A 495.00- -- - - -
+ .5IX .6
+ .8
85.00 - -- - - - -
80.00 - - - - - - - -
75.00
'70.00
60.00 ---
50.00
45.00
40.00 ... ......
35.00
30.00
15.00 - - - - -
10 .0 0-0- - - - - -
5.00 - - - - - --- - -
A-1ti00 -90.00 -80.00 -70.00 -60.00 -50. 00 -. 0
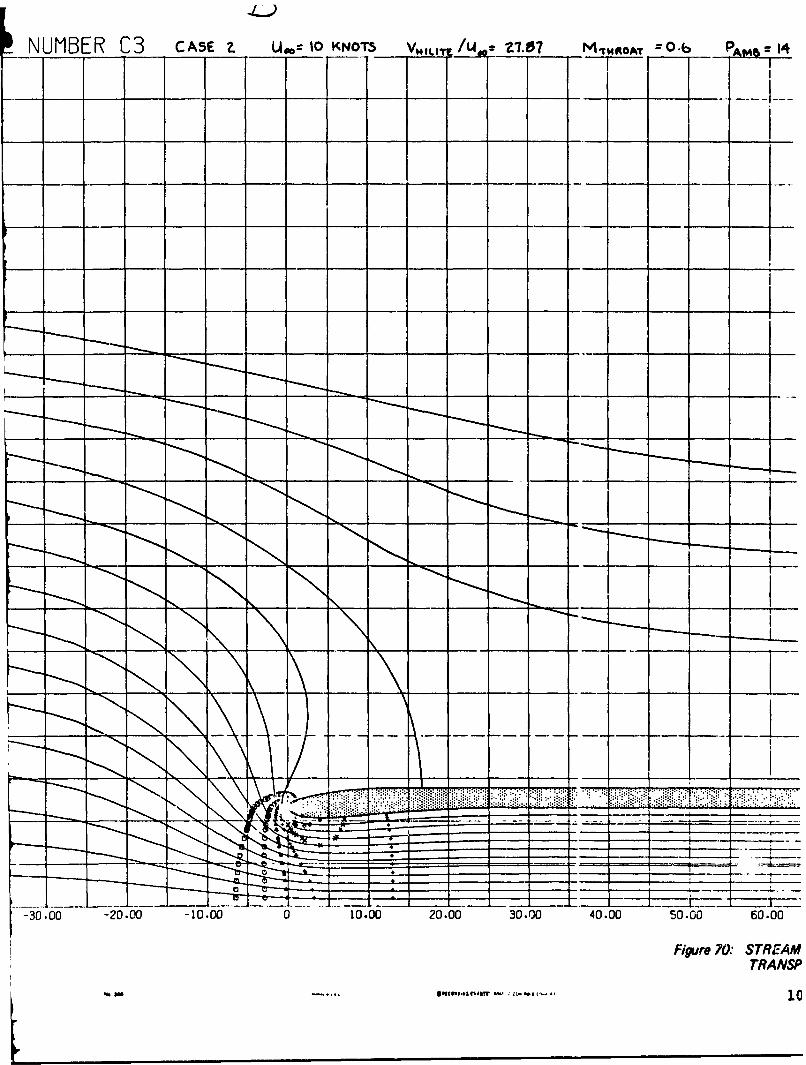
J-m-
Figure 70.: STRE'AMTRANSP
.~N........tdi ... 10
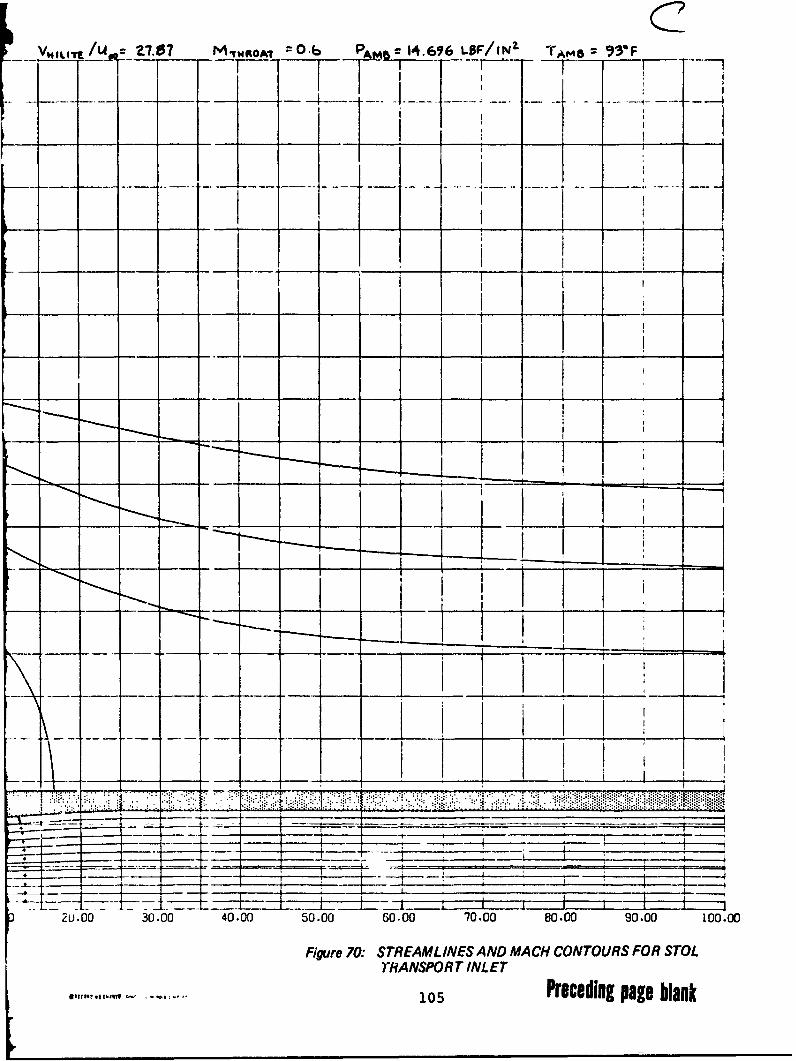
CVgL/I It~/4 Z-.07 M.HIOA? o 0 :0 PA & 14.6 (6 L•F/IN" TAMS : B 3"F
II
I ,
- - - - - - - - - - - - - - ---4 -- - 1- - --. 1 -- --
%! 7
k u.00 30.00 40.00 50.00 60.00 70.00 80.00 90.00 100.00
Figure 70: STREAML INES AND MACH CONTOURS FOR STOLTRANSPORT INLET
105 Preceding page blank
i -1 - ,W .- .

z('o.n 4 r4U.
(a M II
UU B.
I--zE
u.~j
cc_ 1/i:,:c
CC-J0_ _ _ _ _ _ _ _ _ ~:zc
_________ 0k)(1/
£ / I ,.4 :
4 R 9 )v/3OIW3VIWO *I Ia ,
10 /rcdn page blan/kf' _

AIGAErFH NL SRE TiEIORI~EY3EWI~HFESRAIEO~YVCOI0
Existing jet penetration data (Ref. 35) show that the thrustreverser plume is extremely unsteady and that large turbulentfluctuations occur in the mixing region with the freestreamflow. To account for flowfield unsteadiness in predictingcrossflow reingestion, the correlation shown in Figure 73is used. Data are shown for the jet maximum penetration point(MPP) as a function of velocity ratio and discharge angle.The scatter radius is given by
V 0 4 . Qe ., $ $E o. j(57)
From the nozzle exit to the MPP, a linear interpolation isused to obtain scatter radius.
!1' s /d ds o (58)d (5SM)MM, or M.cI/M
Downstream of the maximum penetration point, the scatterradius at the MPP is used
4h (d)MPP d MP
The scatter radius is a measure of uncertainty in predictingthe plume's position due to large-scale turbulent fluctuationsof exhaust flow. Because of this uncertainty, the plume'sforward boundary is increased by the scatter radius. Theadjusted plume surface is checked for crossflow reingestion.
Crossflow reingestion results are shown in Figure 74. Theconfiguration is an early version of the 747 airplane with longduct nacelles and annular target thrust reversers. The con-figuration was tested for reingestion characteristics in alow-speed wind tunnel test. The computer program predictscrossflow reingestion at about 90 knots. The wind tunneltest indicated crossflow reingestion at 90 knots (Ref. 36).
The main limitation to the crossflow prediction method isthat inlet and exhaust flows are assumed to act independently.Effects of inlet suction on the exhaust flow are not included.Mutual interactions between impinging jet flowb are alsonot included.
Self or Closed Loop Reingestion
Self or closed loop reingestion occurs when the TR or TVexhaust flow forms a continous closed path back into theengine inlet. Two types of self-reiagestion are shown in
109

V00
vj D
0
60 L"so/REFERENCE 2
0 LOCKHEED TEST DATANASA LANGLEY DATA
td 40C.)z
z00 Rs = SCATTER RADIUS 0 0
0 30IIwz
2010
0
0 10 20 30 40 50 60
V. 0.94
2.97 (-L .) (1 - 0.734 SIN 0.685Voo
Figue 73: JET PENETRATION CORRELATIONILL USTRA TING DATA SCA TTER DUE TOTURBULENT FLUCTUATIONS OF FLOW
110

V INLET STREAMTU4E *~
ANNULAR JET PLUME - Y.'"'*
CROSSFLOW REINGESTION
Fipire 74: CROSSFLOW REINGESTION RESULTS FOR90 KNOTS FREESTREFAM VELOCITY
Figure 75. The first type is caused by the thrust reverserexhaust flow attaching to the cowl surface and penetratingforward into the oncoming flow, where it is captured by theinlet flow. For the second type, the exhaust flow does notattach to the cowl, but the proximity of inlet and nozzlecauses exhaust flow to be captured. This type of self-reingestion is treated by the procedure discussed previouslyfor crossflow reingestion.
In order to predict self-reingestion due to exhaust flow re-attachment, it was first necessary to develop reattachmentcriteria. For a two-dimensional jet discharging obliquelyfrom a plate, it is well known that under certain conditionsthe jet bends towards the plate and reattaches due to re-duced pressures caused by entrairient in the separationbubble. As shown by the data in Figure 76, the jet willalways be separated for discharge angles greater than about 60degrees. As the discharge angla decreases, the value ofplate length over slot width required for attached flow alsodecreases. Figure 76 is used to predict reattachment fortwo-dimensional and annular jets (TYPE = 3. and 4.).
The reattachment of a three-dimensional and annular jet behavesdifferently from a two-dimensional jet. Freestream flowenters the separation bubble from the side as illustrated inFigure 77, thus relieving reduced pressures in the bubble.Presence of a counterflow further complicates the flow field.Considerable effort was made in searching for data or theoryto predict the reattachment of a three-dimensional jet. Notheory and very little data were discovered. Test datafrom an SST thrust reverser concept with a 30-degree dis-charge angle revealed a strong reattachment under staticconditions. A schematic of the thrust reverser and flowfield is shown in Figure 78a. Oil flow visualizationproved that reattachment occurred along the centerline of thesecond door as shown in Figure 78b.
Reingestion testing conducted during the development of the707 cascade thrust reverser resulted in the following generalcriteria for jet discharge angles
J55 degrees, jet will no reattach6 a 45 degrees, jet may or may not reattach (60)
30 degrees, jet will reattach
Based on the 707 and SST test data, the criteria given byEquation (60) are used to predict reattachment for discretejets (TYPE a 1. and 2.).
No method has been developed to predict whether or not re-ingestion occurs once a jet has reattached to the cowl. Con-ceivably, it could separate again in presence of a strongcounterflow. Experience has shown, however, that reingestion
112
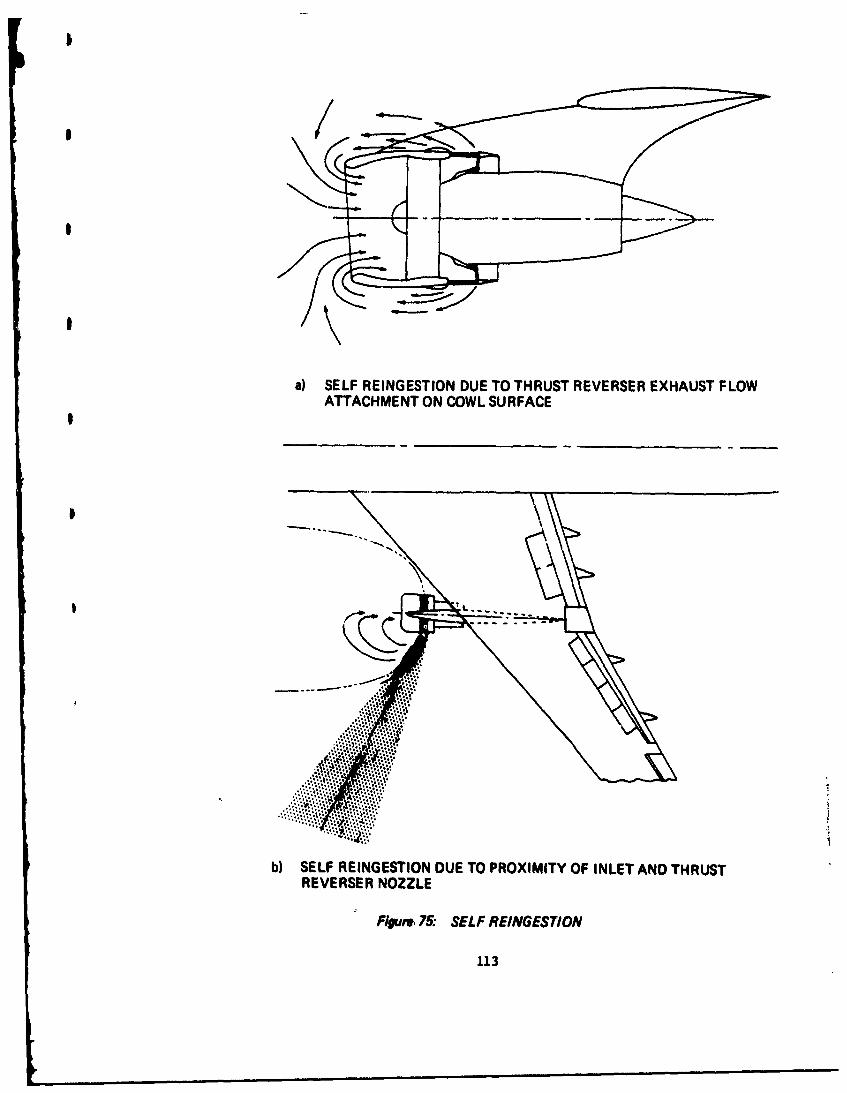
a)SELF REINGESTION DUE TO THRUST REVERSER EXHAUST FLOWATTACHMENT ON COWL SURFACE
b) SELF REINGESTION DUE TO PROXIMITY OF INLET AND THRUSTREVERSER NOZZLE
Figue. 75: SELF REINGEST/ON
113
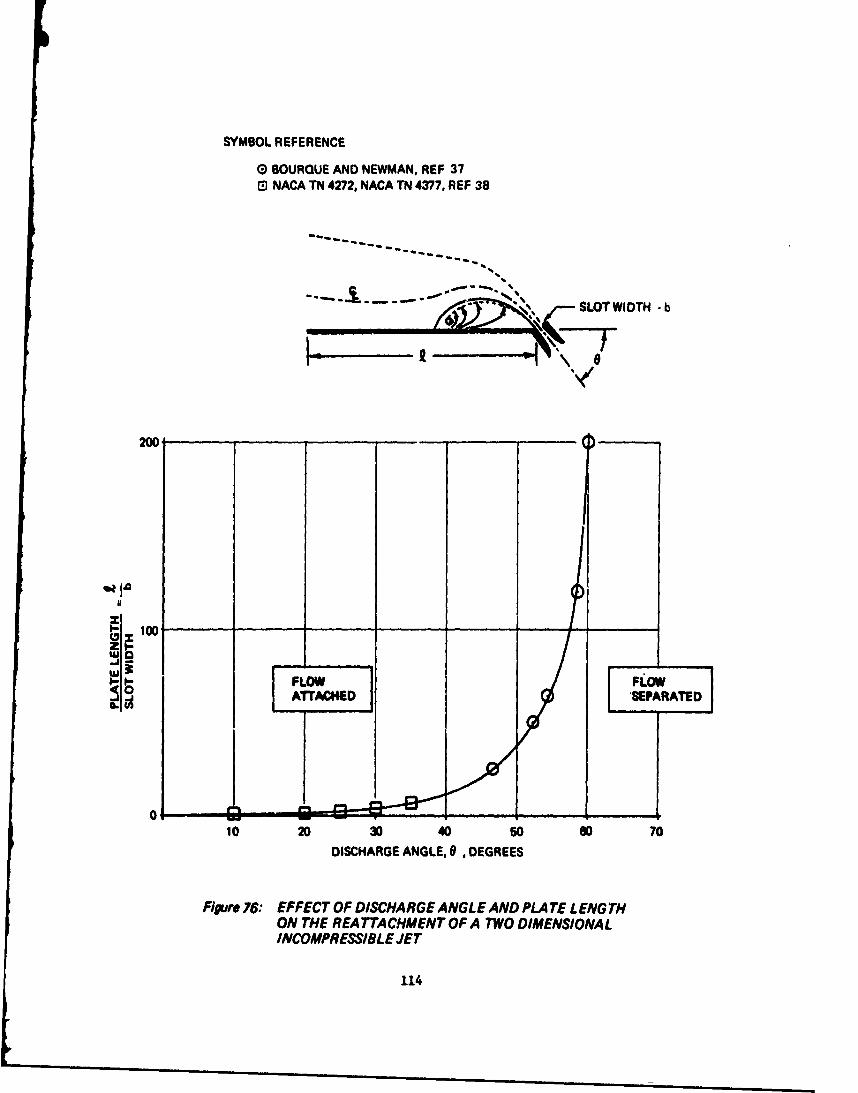
SYMBOL REFERENCE
G BOURQUE AND NEWMAN, REF 37G NACA TN 4272, NACA TN 4377, REF 38
----..1....•°:SLOT WIDTH b.
K--
200.
2,-
LOW FLOWOAITACIED SEPARATED
0.10 20 30 40 so O0 70
DISCHARGE ANGLE, 0 , DEGREES
Flours 76: EFFECT OF DISCHARGE ANGLE AND PLATE LENGTHON THE REA TTACHMENT OF A TWO DIMENSIONALINCOMPRESSIBLE JET
114
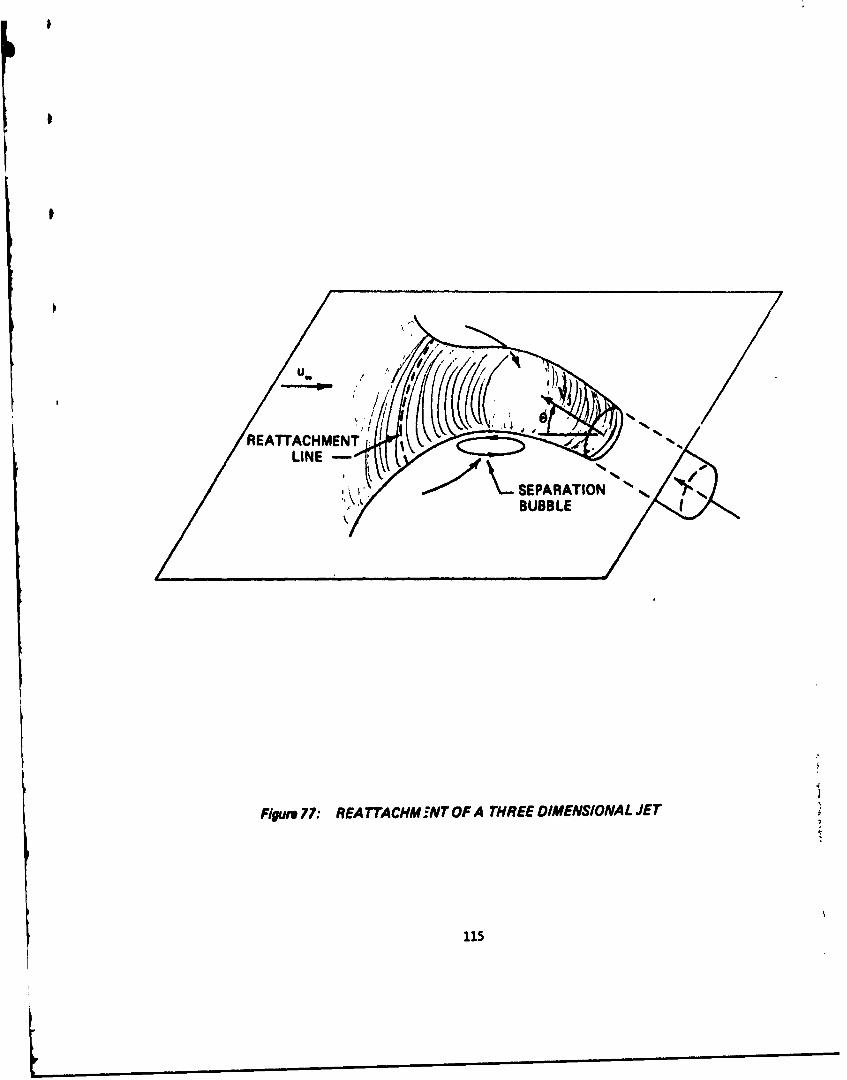
/REATTACHMENT• "'
LIN
S ", ' 'BUBBLE
Figure 77: REA TTACHM 5NT OF A THREE DIMENSIONAL JET
115
V
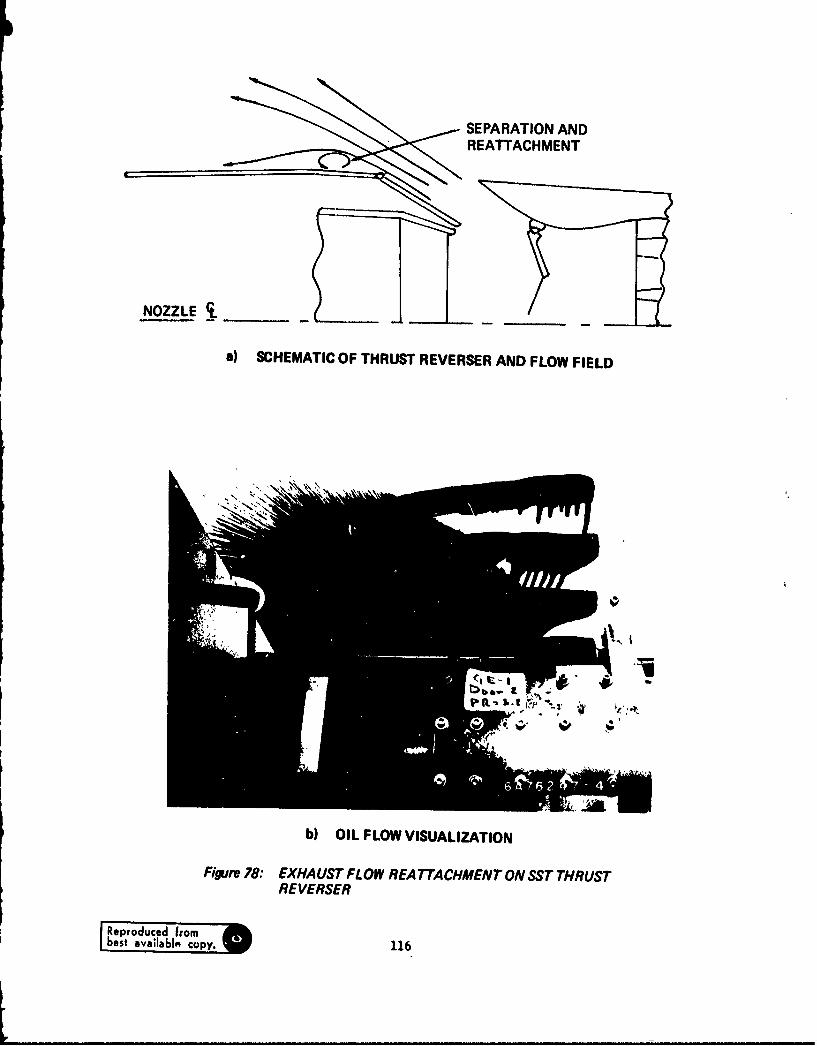
SEPARATION ANDREATTACHMENT
NOZZLE CL_______
a)SCHEMATIC OF THRUST REVERSER AND FLOW FIELD
b) OIL FLOW VISUALIZATION
Figure 78:, EXHAUST FLOW REATT7ACHMENT ON SST THRUSTREVERSER
Reproduced frombest available copy. 116
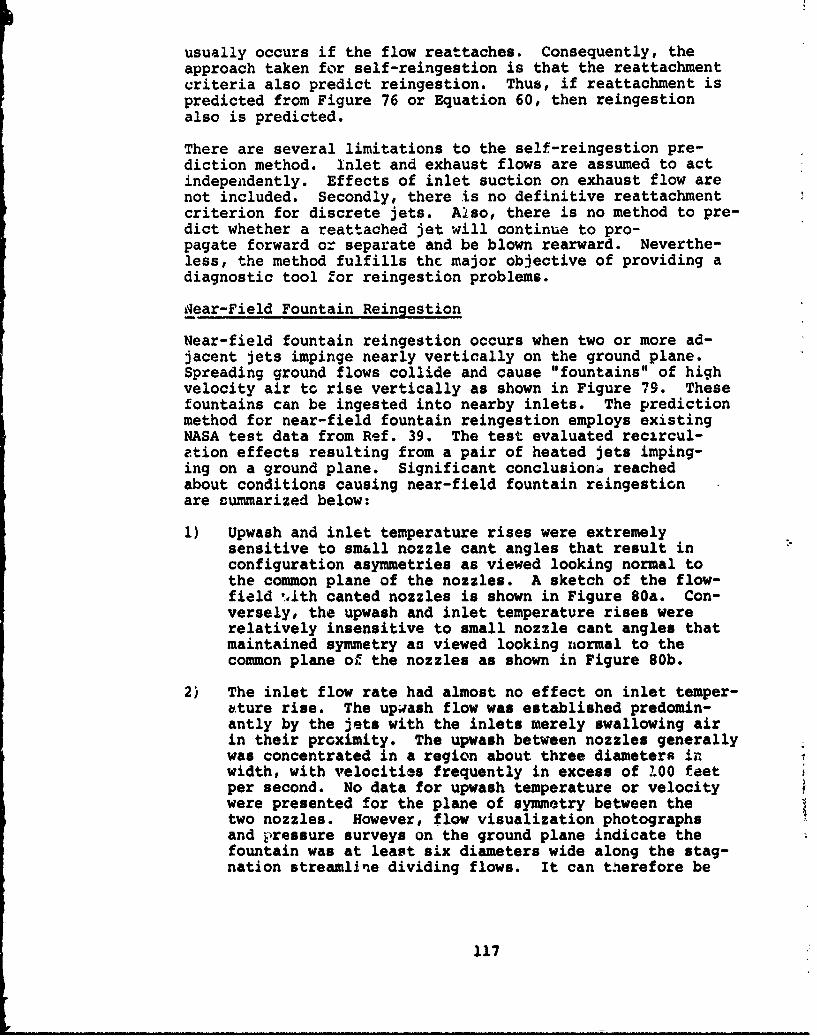
usually occurs if the flow reattaches. Consequently, theapproach taken for self-reingestion is that the reattachmentcriteria also predict reingestion. Thus, if reattachment ispredicted from Figure 76 or Equation 60, then reingestionalso is predicted.
There are several limitations to the self-reingestion pre-diction method. Inlet and exhaust flows are assumed to actindependently. Effects of inlet suction on exhaust flow arenot included. Secondly, there is no definitive reattachmentcriterion for discrete jets. Also, there is no method to pre-dict whether a reattached jet will continue to pro-pagate forward or separate and be blown rearward. Neverthe-less, the method fulfills the major objective of providing adiagnostic tool for reingestion problems.
Near-Field Fountain Reingestion
Near-field fountain reingestion occurs when two or more ad-jacent jets impinge nearly vertically on the ground plane.Spreading ground flows collide and cause "fountains" of highvelocity air to rise vertically as shown in Figure 79. Thesefountains can be ingested into nearby inlets. The predictionmethod for near-field fountain reingestion employs existingNASA test data from Ref. 39. The test evaluated recircul-ation effects resulting from a pair of heated jets imping-ing on a ground plane. Significant conclusion.2 reachedabout conditions causing near-field fountain reingestionare summarized below:
1) Upwash and inlet temperature rises were extremelysensitive to small nozzle cant angles that result inconfiguration asymmetries as viewed looking normal tothe common plane of the nozzles. A sketch of the flow-field ',ith canted nozzles is shown in Figure 80a. Con-versely, the upwash and inlet temperature rises wererelatively insensitive to small nozzle cant angles thatmaintained symmetry as viewed looking normal to thecommon plane of the nozzles as shown in Figure 80b.
2) The inlet flow rate had almost no effect on inlet temper-ature rise. The upwash flow was established predomin-antly by the jets with the inlets merely swallowing airin their proximity. The upwash between nozzles generallywas concentrated in a region about three diameters inwidth, with velocities frequently in excess of .00 feetper second. No data for upwash temperature or velocitywere presented for the plane of symmetry between thetwo nozzles. However, flow visualization photographsand pressure surveys on the ground plane indicate thefountain was at least six diameters wide along the stag-nation streamline dividing flows. It can therefore be
117

LL
I,-
Figure 79: NEAR-FIELD FOUNTAIN REINGESTION
118

INLET
INLET
a) FLOW FIELD WITH CANTED NOZZLES
• , UNSTEADY STAGNATION REGION
II • • VORTEX
"9'- INE INLET1
b) NOMINAL FLOW FIELD WITH SYMMETRIC NOZZLES ANDEQUAL NOZZLE PRESSURE
Figure 80. NEAR-FIELD FOUNTAIN FLOW FIELDS
119
Vi

assumed that inlets located parallel to the symmetryplane also reingest flow from the fountain.
3) The jets merged if they were located close together andhigh off the ground. The criterion for a pair of paralleljets to merge is given by
(S + t- ix (61)
where o is the half angle of the spreading jet plume, Sis the spacing between jets, and H is the height. Usinga spreading angle of 7 degrees gives
0 (62)
When the jets merged, no fountain or reingestion occurred.4) The effect of wind in altering the near flowfield was
negligible for wind speeds less than 6 feet per second.With the wind parallel to the common plane of the nozzles,further increases in wind speed shifted the fountaindownstream, until at about 16 feet per second, the up-wash was shifted beyond the downstream jet, thus elimin-ating the fountain between the jets.
With the wind at 90 degrees to the common plane of thenozzles, no significant change in either the upwashflow or inlet temperature rise was detected within therange of wind speeds investigated, i.e., wind speed '<16feet per second. However, analysis of the jet trajectoryof the fountain shows that for wind speeds greater thanabout 25 feet per second, the fountain will be sweptdownstream.
Based upon these conclusions, certain criteria have been estab-lished for near-field fountain reinqestion to occur, namely:
1) Near-field fountain reingestion will not occur for free-stream velocities greater than about 25 feet per secondbecause the fountain is swept downstream by the freestreamflow. S
2) There must be a minimum of two jets directed downwardfor a fountain to form.
3) The jet pairs are checked to see whether they merge. Ifthe jets merge before impinging on the ground, no fountainor reingestion occurs.
120
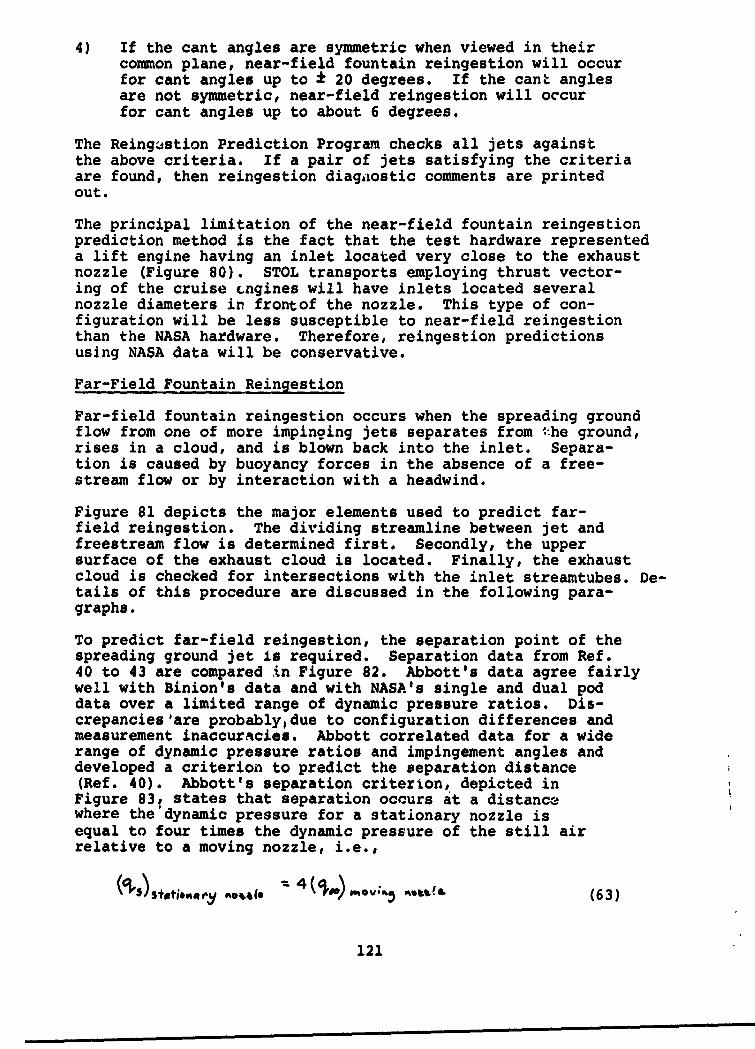
4) If the cant angles are symmetric when viewed in theircommon plane, near-field fountain reingestion will occurfor cant angles up to 1 20 degrees. If the cant anglesare not symmetric, near-field reingestion will occurfor cant angles up to about 6 degrees.
The Reingstion Prediction Program checks all jets againstthe above criteria. If a pair of jets satisfying the criteriaare found, then reingestion diagaostic comments are printedout.
The principal limitation of the near-field fountain reingestionprediction method is the fact that the test hardware representeda lift engine having an inlet located very close to the exhaustnozzle (Figure 80). STOL transports employing thrust vector-ing of the cruise cngines will have inlets located severalnozzle diameters in frontof the nozzle. This type of con-figuration will be less susceptible to near-field reingestionthan the NASA hardware. Therefore, reingestion predictionsusing NASA data will be conservative.
Far-Field Fountain Reingestion
Far-field fountain reingestion occurs when the spreading groundflow from one of more impinging jets separates from .-he ground,rises in a cloud, and is blown back into the inlet. Separa-tion is caused by buoyancy forces in the absence of a free-stream flow or by interaction with a headwind.
Figure 81 depicts the major elements used to predict far-field reingestion. The dividing streamline between jet andfreestream flow is determined first. Secondly, the uppersurface of the exhaust cloud is located. Finally, the exhaustcloud is checked for intersections with the inlet streamtubes. De-tails of this procedure are discussed in the following para-graphs.
To predict far-field reingestion, the separation point of thespreading ground jet is required. Separation data from Ref.40 to 43 are compared in Figure 82. Abbott's data agree fairlywell with Binion's data and with NASA's single and dual poddata over a limited range of dynamic pressure ratios. Dis-crepancies'are probablyidue to configuration differences andmeasurement inaccuracies. Abbott correlated data for a widerange of dynamic pressure ratios and impingement angles anddeveloped a criterion to predict the separation distance(Ref. 40). Abbott's separation criterion, depicted in
Figure 83, states that separation occurs at a distancawhere the'dynamic pressure for a stationary nozzle isequal to four times the dynamic pressure of the still airrelative to a moving nozzle, i.e.,
4. (63)
121
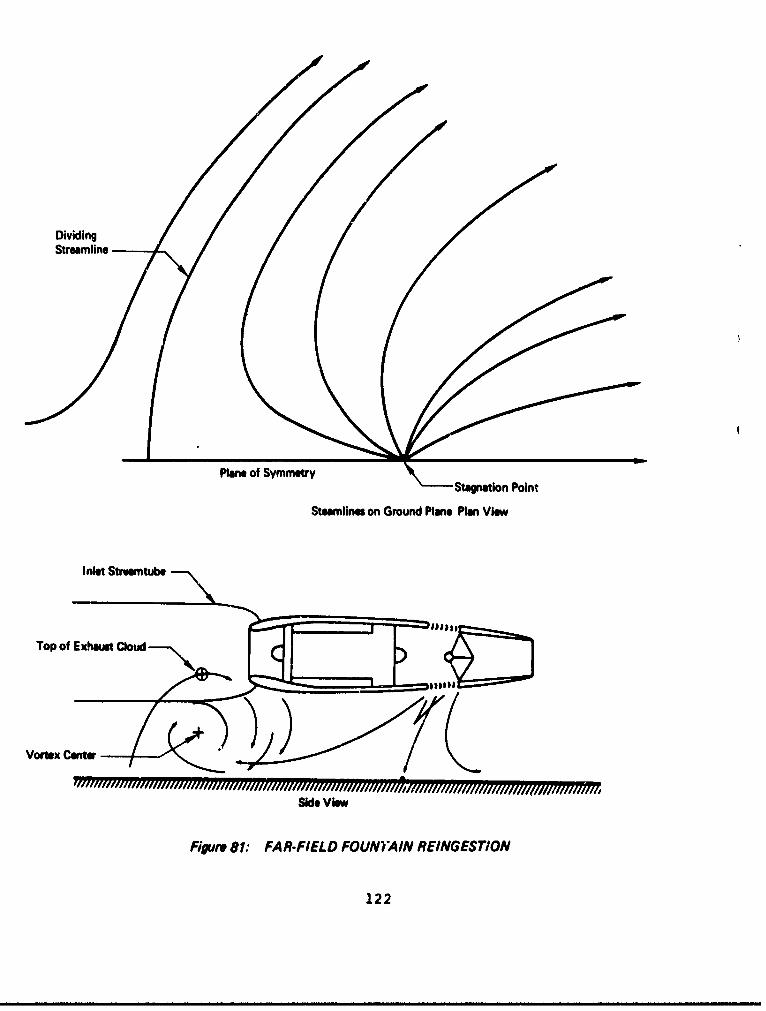
DividingStreamline
Plane of Symmetry \ Santo on
Steamilnes on Ground Plane Plan View
Top of Exhaust Cloud
Side View
Figure 81: FAR-FIELD FOUN) A/NREINGEST/ON
122
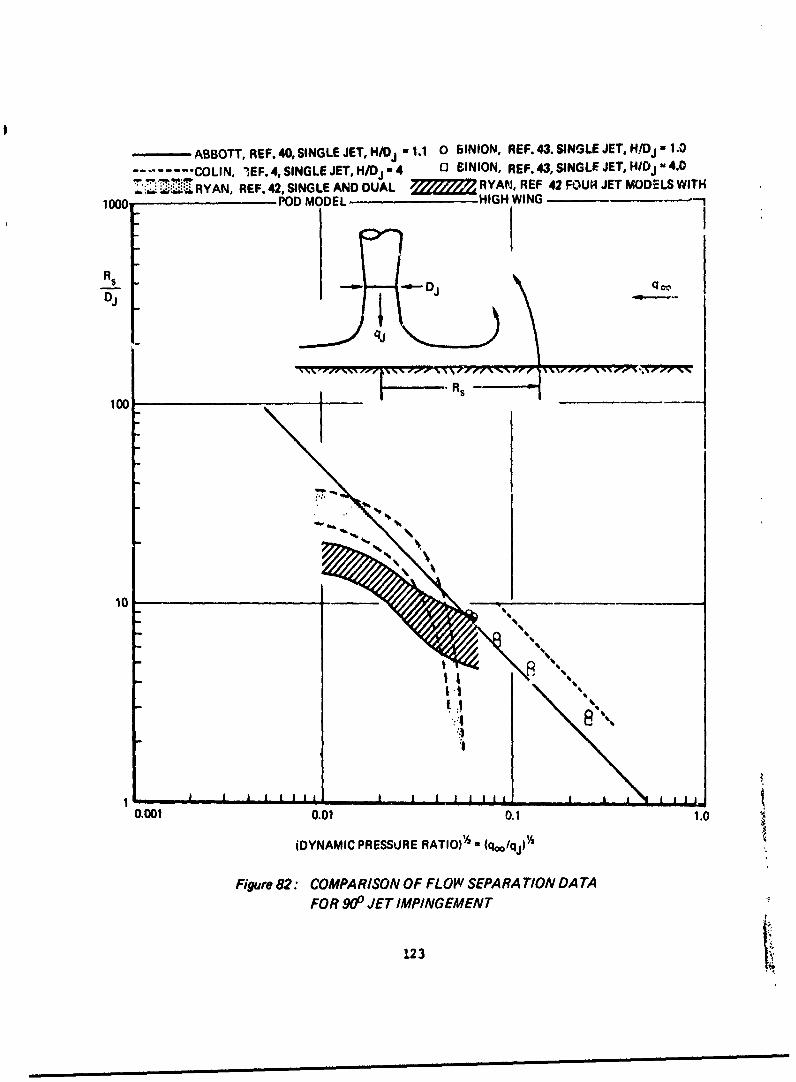
-ABBOTT, REF. 40, SINGLE JET, H/Dj -1.1 0 SINION, REF. 43. SINGLE JET, H/Dj - 1 .0
;- -~COLIN. 'JEF.4,SINGLEJET.HIDj=4 0 EINION, REF.43, SINGLE JET, HID - 4.0
RYN REF. 42, SINGLE AND DUAL ý ýRRAN, REF 42 FOUR4 JET MODELS WITH
1000 POD MODEL HIGH WING
R5
100 R
10
0.001
.010.01 0.1 1.0
(DYNAMIC PRESSURE RATIO)1/2 (q/=
Figure 82: COMPARISON OF FLOW SEPARA TION DATAFOR 900 JET IMPINGEMENT
123

*(A) MOVING NOZZLE
q*oqj
(B) STATIONARY NOZZLE
qj qS 4q0
Figure 63 ABBOTT'SCRITERION FOR PREDICTING FARFIELD FOUNTAIN FLOW SEPARA TION
124

Abbott conducted extensive dynamic pressure surveys forstationary nozzles and used flow visualization for movingnozzles in order to develop this criterion. Results areshown in Figure 84 for impingement angles from 40 to 150degrees and dynamic pressure ratios from 4 to 40,000.
Abbott's correlation for separation distance of the spreadingground jet applies only in the vertical plane of symmetry.The general case of far-field reingastion involves inletslocated to the right or left of this plane. Therefore, itis necessary to predict the position of the dividing stream-line out of the plane of symmetry. Potential flow theory wasused by Colin with good results to predict the peeling linefor a jet impinging at 90 degrees (Ref. 41). Comparison ofColin's theory to test data is shown in Figure 85. Hispotential flow model consisted of a line source combined witha freestream flow. The source strength was sized to makethe dividing streamline match data in the plane of symmetry.
Colin's theory was extended to jets impinging at arbitraryangles by specifying a nonuniform outflow velocity distri-bution around the periphery of the jet's cross ection pro-jected on the ground plane. The outflow velocity wasdetermined by balancing the momentum of radial streamlinesleaving the stagnation point. Computer-plotted results areshown in Figures 86 to 88 for 0, 45, and 90-degree winddirection. Streamlines are shown emanating from the jetstagnation point and in the freestream surrounding the zone ofjet flow. Streamlines without symbols were traced fromseparate computer submissions. Jet impingement angles of30, 60, 90, 120, and 150 degrees were run with 0, 45, and90-degree wind direction at velocity ratios V /U = 1 to 100.Wind direction has a pronounced influence on the dividingstreamline as shown by Figure 89. However, when thedividing streamlines are aligned along the direction ofapproach flow as in Figure 90 the effect of wind directionis seen to be small. As expected, velocity ratio had alarge influence on the dividing streamline as shown inFigure 91. However, the influence of jet impingementangle on dividing streamline shape was unexpectedly small,indicating that total jet strength is more important indetermining dividing streamline shape than the relativedistribution of outflow velocity.
As discussed previously, Abbott's criterion is used to predictthe separation point in the plane of symmetry. The peelingline radius out of the plane of symmetry is determined fromthe dividing streamline for 90 degree impingement. Becausethe jet impingement angle has only a small influence ondividing streamline shape, the dividing streamline for 90degree impingement is used for all impingement angles.
125

REFERENCE 40. SINGLE NOZZLE S/D� <6
1000
-s 0= � D� -
R qj1350\ -x
110� "" 9)o
\ \\100 900\
\ \\
800 \ 1%'
700 \ \
570
10 -___________________ __________________
1 a sinai a a a a pans anna0.001 0.01 0.1 1.0
(DYNAMIC PRESSURE RATIO)"' = (q�/qj)%
Figure 84: EFFECT OF IMPINGEMENT ANGLE AND DYNAMICPRESSURE RATIO ON FAR FIELD FOUNTAIN FLOWSEPA RA lYON
126

1.6
( ~~~~~1.2.____ A____
0.81
A EXPERIMENTAL POINTS FOR A* 5.35OLNSTHEORY (REF 41)
-1.2 -0.18 -0.4 0 0.14 0.8 1.2 x 1.6
.0.41 ~03 A ?-1
-1.2.
I4.
VRVRE 4 (P STAGNATION POINT - Poo)U.. RE
Figure 85: DI V/DING STREAMLINE COMPARISONBETWEEN THEORY AND EXPERIMENT
127
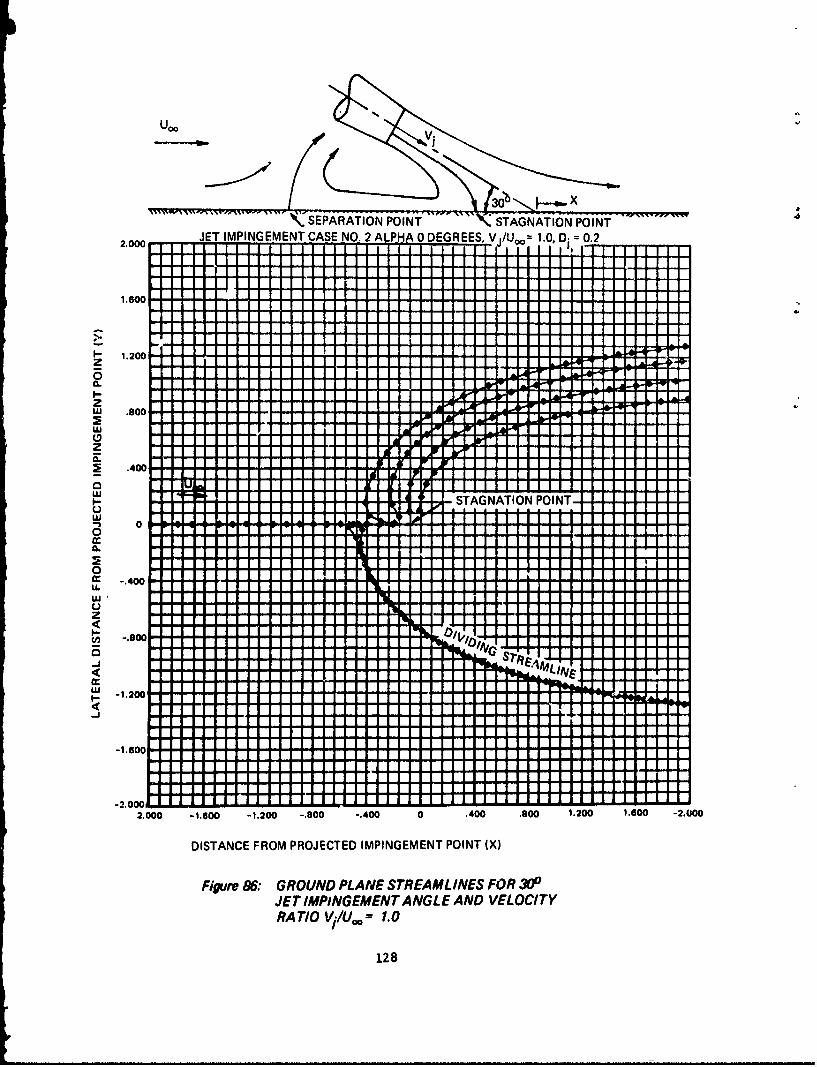
300 0
\.SEPARATION POINT N STAGNATION POINT2.00 JET IMPINGEMENT CASE NO. 2ALPHA 0 DEGREES. Va/U ,= 1.0 DC 0.2
1.600
z
z
w
0
-.40
U.
z.40
'm-d
-2.0002.000 -1.600 -1.200 -.800 -.400 0 .400 .800 1.200 1.600 -2.000
DISTANCE FROM PROJECTED IMPINGEMENT POINT (X)
Figure 86: GROUND PLANE STREAMLINES FOR 300JET IMPINGEMENT ANGLE AND VELOCITYRATIO V-/Urx= 1.0
128
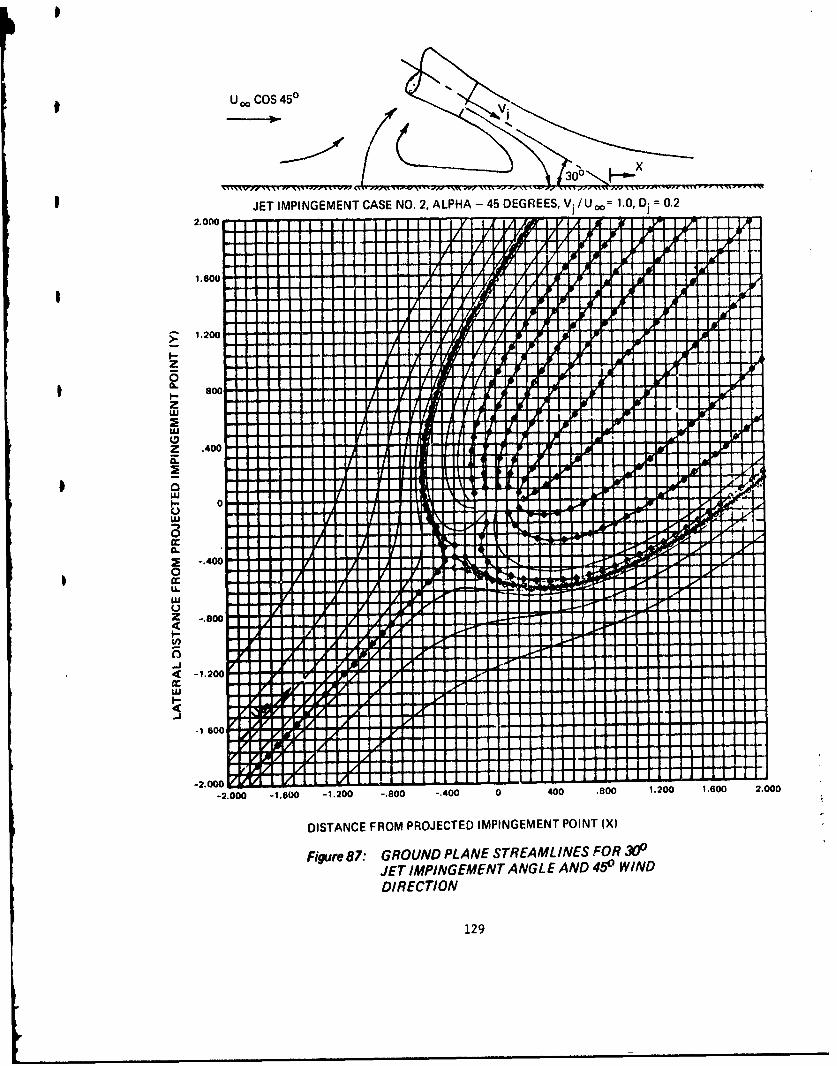
x
JET IMPINGEMENT CASE NO. 2. ALPHA - 45 DEGREES, V. I U = 1.0, D. 0.2
I -
z
Lu
L0 III -Z 401 Aa
44I -I
-000c 200 160 -120 -80 -40 0i80 1.0 .0 .0
DITAC FRO PRJCE IMIGMN POIN IX
Fiur 87: GRUN PNITEMIE O dJE IMINEMN ANL AN 40INDIRECTIO
I129

NOTE: FREESTREAM FLOW ISINTO PLANE OF PAPER
JET IMPINGEMENT CASE NO. 2, ALPHA - 90 DEGREES, V1i /Uo= 1.0, Di0.2
2.0z
1.00LuL
I,-
z -
2.8000r
JET .4IGE0TANL0AD9'WN
DIEC/O
t I I3I

D0.2
v /iu00 = to0IMPINGEMENT ANGLE =300
WIND DIRECTION=
1.6 4
* 5- 1.2t
I-0.8-z
z 0.4
U- 00
0ILl
-0.40L-Lu
z -0.8 -
,(-1.2
-2.4 -2.0 -1.6 -1.2 -U.8 -0.4 0 0.4 0.8 1.2 1.6 2.0
DISTANCE FROM PROJECTED IMPINGEMENT POINT (X)
Figure 89: EFFECT OF WIND DIRECTION ON DIV/DINGSTREAMLINE SHAPE
131

D= 0.2
V./U0 = 1.0
IMPINGEMENT ANGLE - 300
WIND DIRECTION = 0&
WINDDIRECTION= 450
- - -WIND DIRECTION = 900
2.0
1.6
1.2 -
S0.8 -_ _
2 0.4
zw
-0.4--o U
--1.
w
-2.0-2.0 -1.6 -1.2 -0.- -0.4 0 0.4 0.8 1.2 1.6 2.0
DISTANCE FROM PROJECTED IMPINGEMENT POINT (XI
Figur# 90: EFFECT OF WIND DIRECTIOJN ON DIVIDINGSTREAMLINE SHAPE
132
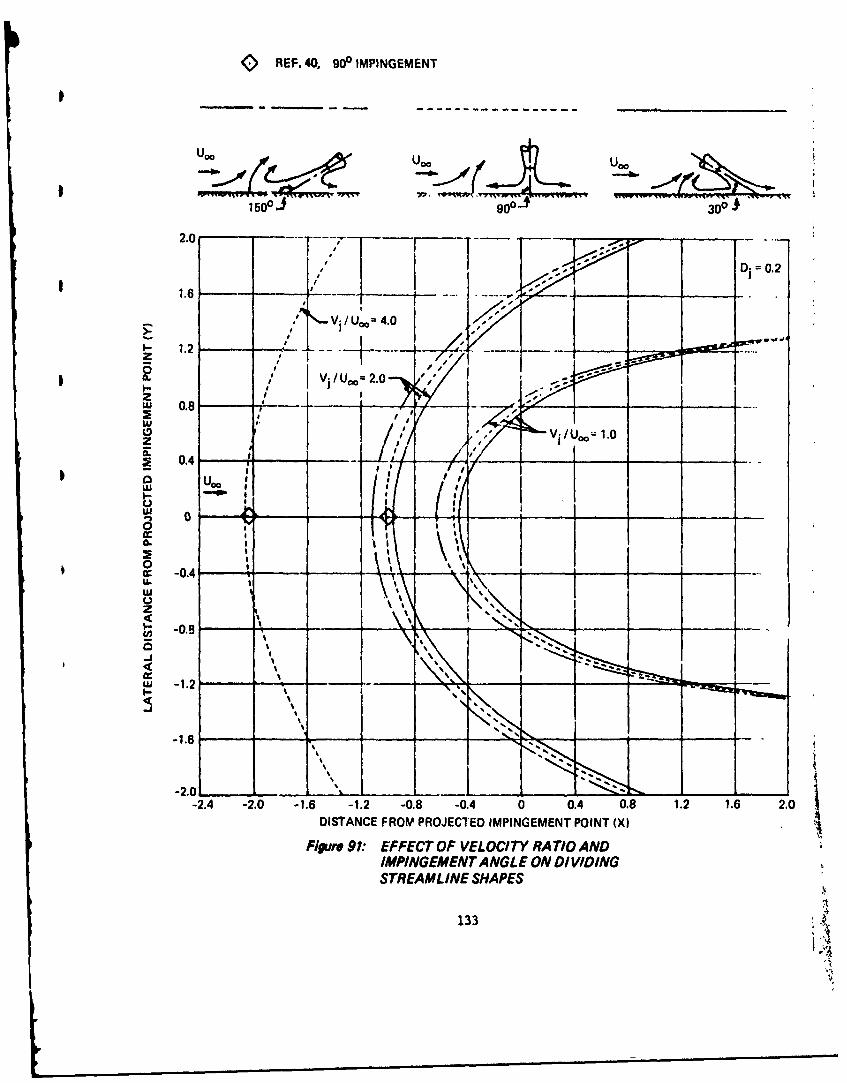
cREF. 40, 900 IMPINGEMENT
U' ucm
Dj 0.2
za'Vj U1/.= 2.0
0U 0.
S 0.4 ___
-1.6wa
-2.4 -2.0 -1.6 -1.2 -0.8 -0.4 0 0.4 0.8 1.2 1.6 2.0
DISTANCE FROM PROJECTED IMPINGEMENT POINT (X)Figure 97: EFFECT OF VELOCITY RATIO AND
IMPINGEMENT A NGL E ON DIVIDINGSTREAMLINE SHAPES
133
Once the position of the dividing streamline is determined,it is necessary to predict the hehiht of the exhaust cloud.Abbott's data shown in Figure 92 are used for this purpose.Data scatter is due in part to turbulent fluctuationspresent in the exhaust cloud. The top line is used toprovide a factor of conservatism in the prediction method.The radial position of the top of the exhaust cloud isassumed to lie above the vortex center given by Colin'sdata, as shown in Figure 93.
The final step necessary to predict far-field reingestionis to check the exhaust cloud upper surface for possibleintersections with inlet streamtube surfaces. The Re-ingestion Prediction Program checks a limited number of pointsin the cloud for intersections with inlet streamtube surfaces.As shown in Figure 94, points are checked at azimuth anglesfrom 30 to 330 degrees. This simplified intersection pro-cedure was chosen because the exhaust cloud surface is notknown with sufficient accuracy to warrant a more sophisticatedsurface intersection technique.
Steps used to predict near-field fountain reingestion aresummarized below.
1) Separation of the spreading ground jet is predictedusing Abbott's data correlation.
2) The dividing streamline in the ground plane is predictedby potential flow.
3) The exhaust cloud upper surface is predicted by Abbott'sand Colin's data.
4) The exhaust cloud is checked for intersection with inlet
streamtubes.
2.2.3 TR and TV System Performance Program
The TR and TV System Performance Program consists of fourmodules containing empirical data correlations and someanalyses developed during Tasks 1.1 and 1.3. Inputs andoutputs of the program are shown in Figure 95. Detaileddescription of the four performance modules follows.
Internal Performance Module
Data correlations developed during Tasks 1.1 and 1.3 wereincorporated into the Internal Performance Module, whichcontains data correlations for the following types of cruisenozzles, thrust reversers, and vectoring nozzles.
134

"RELATIVEh CROSSWIND
II
40
*SINGLE NOZZLE 0 = 90 h/Rs= 1
.SINGLE NOZZLE 0 = 70
A SINGLE NOZZLE 0 = 110
30 * DOUBLE NOZZLE 0 = 90
* DOUBLE NOZZLE 0 = 70
DOUBLE NOZZLE 0 - 110
h/Dj REFERENCE 40, ABBOTT, ARC h/RsC.P. NO. 911 0
20
H/Dj -2. 410
0 10 20 30 40 50 60
Rs/DJ
Figure 92. HEIGHT OF FAR FIELD FOUNTAINEXHAUST CLOUD
135

TOP OF EXHAUSTCLOUD - 1Rs)O Ih)
h V~ORTEXIU") CENTER
Rv STAGNATION' POINTR s
12
10
Rv Rs
.- or 3D D
6 0/
O SEPARATION LINE (Rs/D)
E POINTS WHERE Cpm 0
2 A POSITION OF VORTEX (Rv/D)A POINTS WHERE Cp a MIN
h =4D
0 V4 80 120 A*2 160 2000 4
URE VREF = 2( STAGNATION POINT - P-)
pFigure 93: POSITION OF VORTEX AND SEPARATION
LINE VS CORRECTED DYNAMIC PRESSURE RATIO136
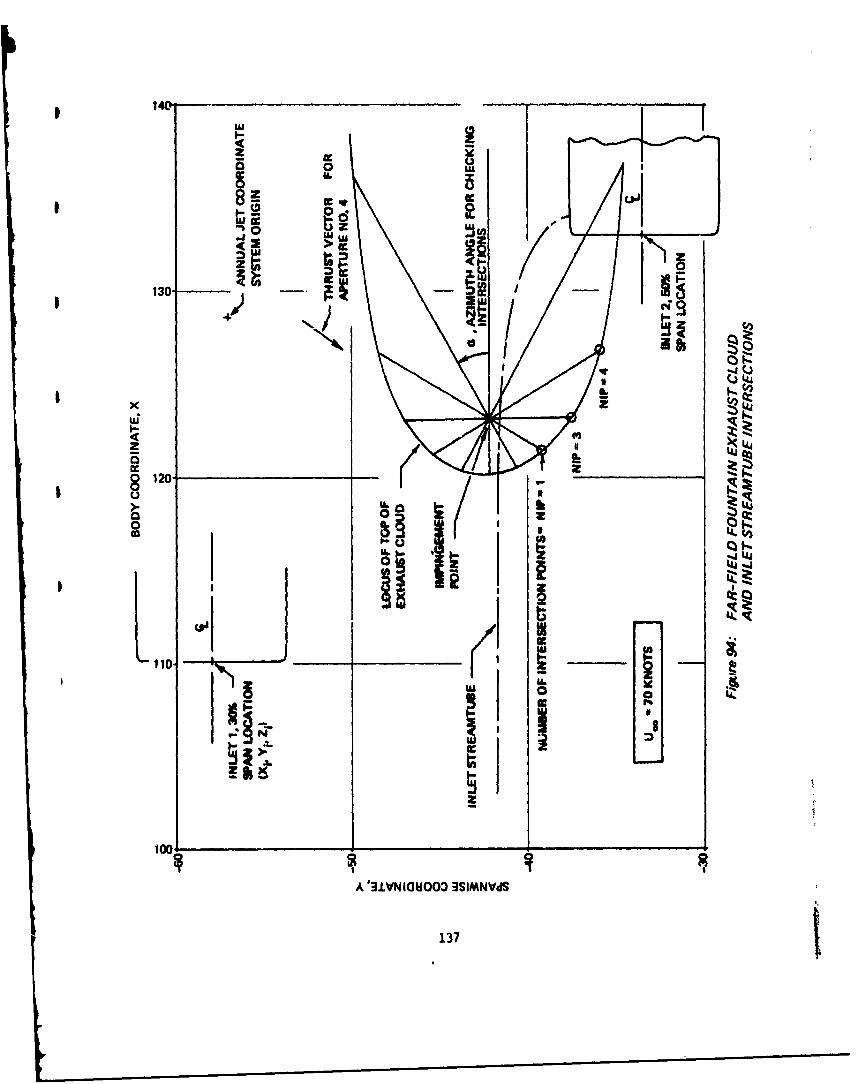
Lo40
zc d
LU t;
z Z
130- -
4~~4i jj('
IIx z
4L~
8120-UUaO
II
1000
137

INPUTS:
1. TR orTV TYPE AND GEOMETRY
2. GEOMETRIC DISCHARGE ANGLE
3. NOZZLE PRESSURE RATIO
TR AND TV SYSTEM PERFORMANCE PROGRAM
INTERNAL PERFORMANCE i AERODYNAMIC INTERFERENCEMODULE MODULE
RE INGESTION ENGINE STABILITYMODULE MARGIN MODULE
OUTPUTS:
1. TR AND TV INTERNAL PERFORMANCE CONSISTING OF
Cv.CD, 'nRg 77W,0,,P
2. ENGINE STABILITY MARGIN
Figure 95- TR AND TV SYSTEM PERFORMANCE PROGRAM
138
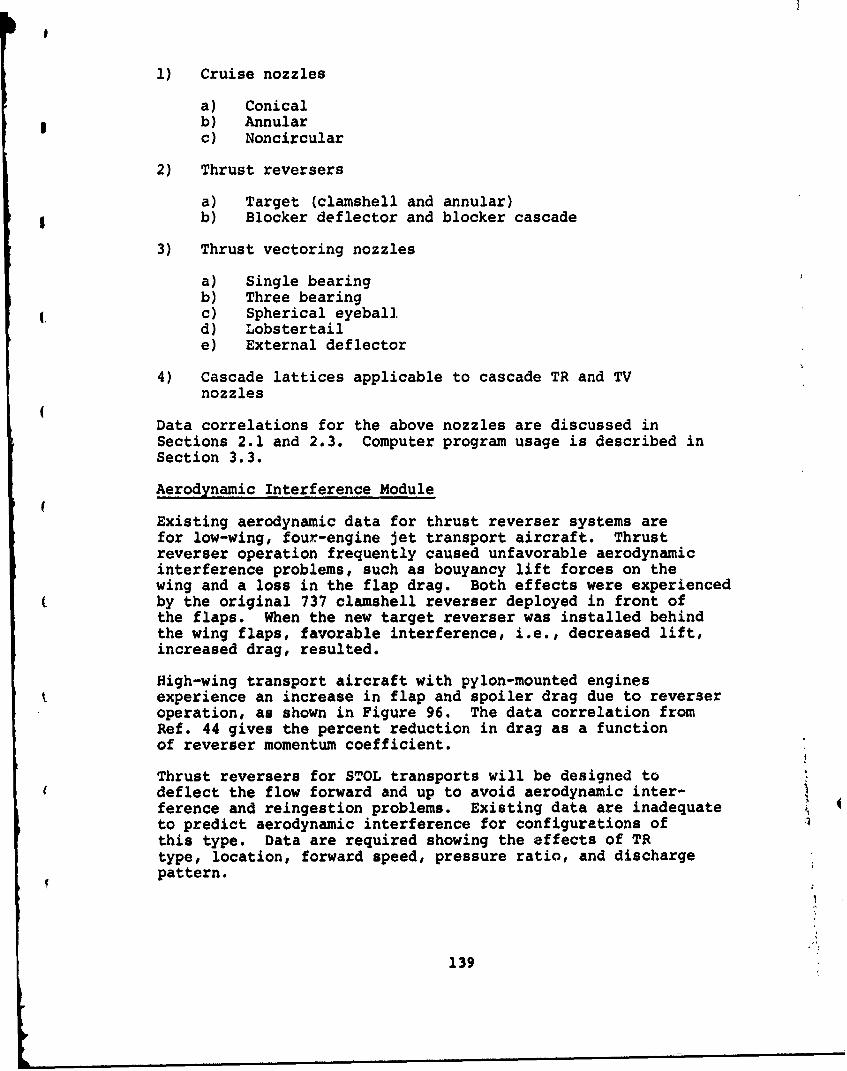
1) Cruise nozzles
a) Conical* b) Annular
c) Noncircular
2) Thrust reversers
a) Target (clamshell and annular)| b) Blocker deflector and blocker cascade
3) Thrust vectoring nozzles
a) Single bearingb) Three bearingc) Spherical eyeballd) Lobstertaile) External deflector
4) Cascade lattices applicable to cascade TR and TVnozzles
(Data correlations for the above nozzles are discussed inSections 2.1 and 2.3. Computer program usage is described inSection 3.3.
Aerodynamic Interference Module
Existing aerodynamic data for thrust reverser systems arefor low-wing, four-engine jet transport aircraft. Thrustreverser operation frequently caused unfavorable aerodynamicinterference problems, such as bouyancy lift forces on thewing and a loss in the flap drag. Both effects were experiencedby the original 737 clamshell reverser deployed in front ofthe flaps. When the new target reverser was installed behindthe wing flaps, favorable interference, i.e., decreased lift,increased drag, resulted.
High-wing transport aircraft with pylon-mounted enginesexperience an increase in flap and spoiler drag due to reverseroperation, as shown in Figure 96. The data correlation fromRef. 44 gives the percent reduction in drag as a functionof reverser momentum coefficient.
Thrust reversers for STOL transports will be designed todeflect the flow forward and up to avoid aerodynamic inter-ference and reingestion problems. Existing data are inadequateto predict aerodynamic interference for configurations ofthis type. Data are required showing the effects of TRtype, location, forward speed, pressure ratio, and dischargepattern.
139
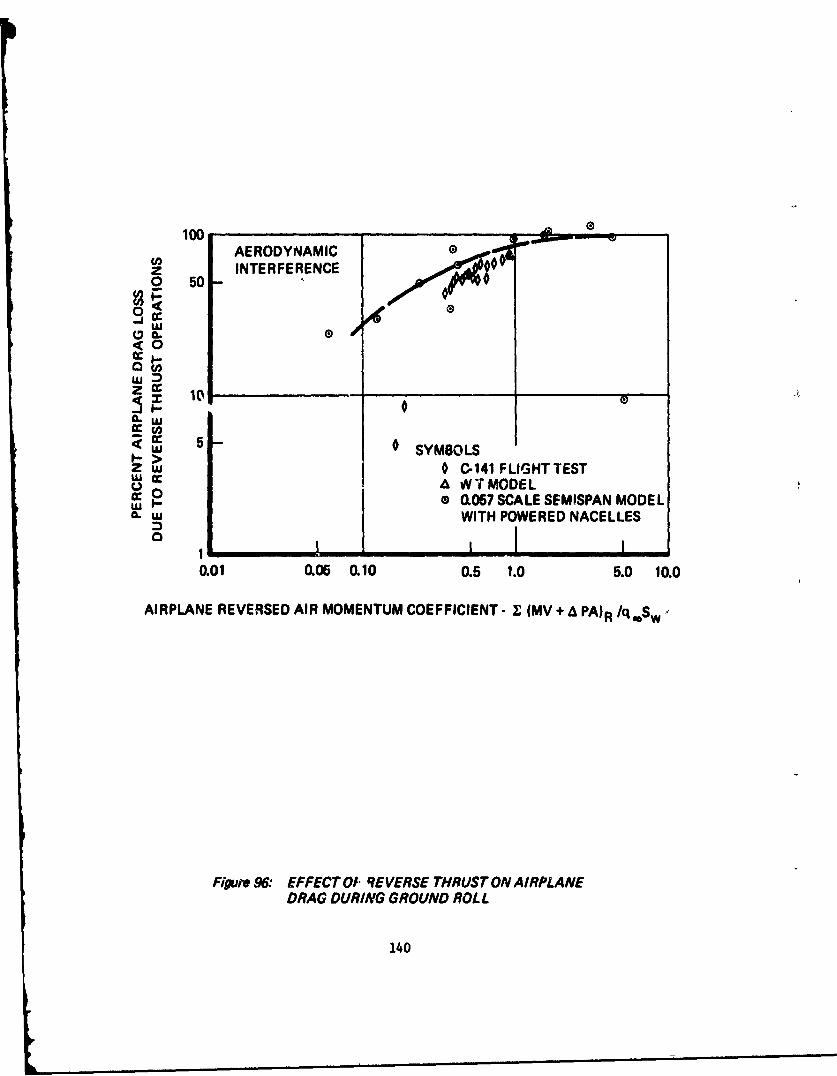
100 _ _ ____ _ _ _...
CAAERODYN~AMICz INTERFERENCE0 50
w 123•a . o .0< 0(CC
(00
In,
U J -SYMBOLSZ u >0 C-141 FLIGHTTEST
S•.A WTMODELw. a067 SCALE SEMISPAN MODEL
Sw WITH POWERED NACELLES
0.01 0.5 0.10 0.5 1.0 5.0 10.0
AIRPLANE REVERSED AIR MOMENTUM COEFFICIENT- Z (MV + A PA)RR /qoSw
Figure 96: EFFECT 01- 9EVERSE THRUST ON AIRPLANEDRAG DURING GROUND ROLL
140
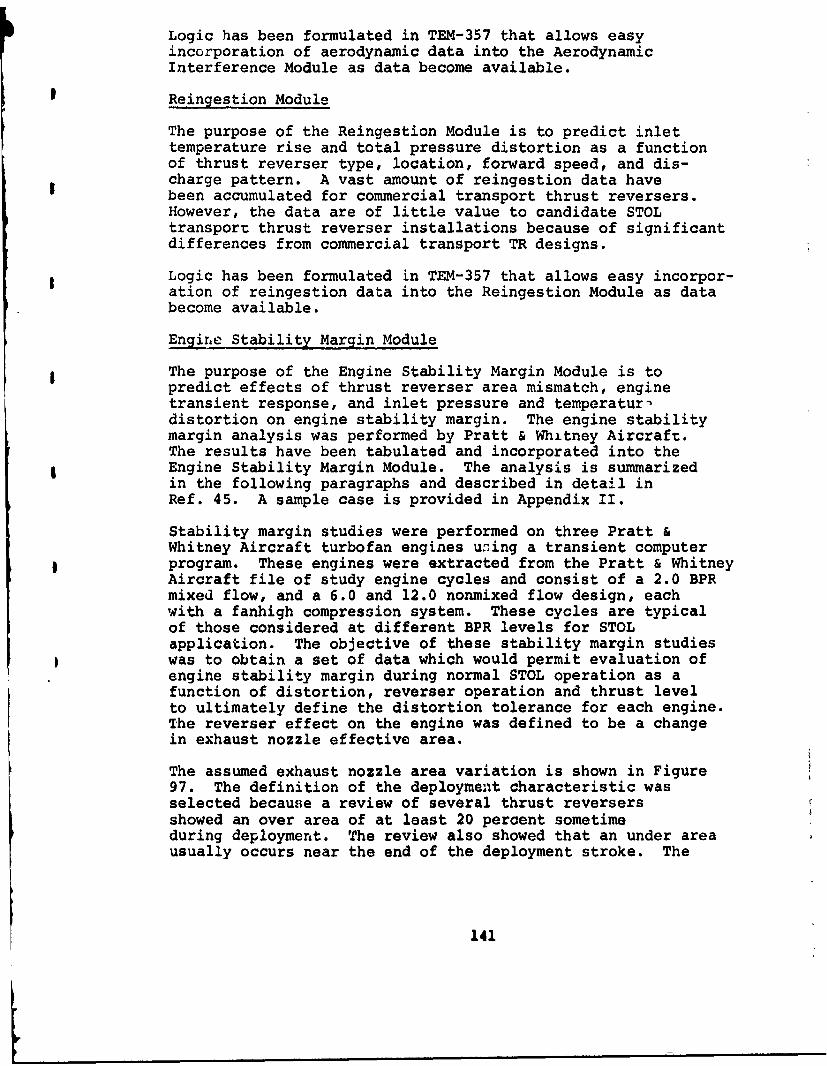
Logic has been formulated in TEM-357 that allows easyincorporation of aerodynamic data into the AerodynamicInterference Module as data become available.
Reingestion Module
The purpose of the Reingestion Module is to predict inlettemperature rise and total pressure distortion as a functionof thrust reverser type, location, forward speed, and dis-charge pattern. A vast amount of reingestion data havebeen accumulated for commercial transport thrust reversers.However, the data are of little value to candidate STOLtransport thrust reverser installations because of significantdifferences from commercial transport TR designs.
Logic has been formulated in TEM-357 that allows easy incorpor-ation of reingestion data into the Reingestion Module as databecome available.
Engine Stability Margin Module
The purpose of the Engine Stability Margin Module is topredict effects of thrust reverser area mismatch, enginetransient response, and inlet pressure and temperatur-distortion on engine stability margin. The engine stabilitymargin analysis was performed by Pratt & Whitney Aircraft.The results have been tabulated and incorporated into theEngine Stability Margin Module. The analysis is summarizedin the following paragraphs and described in detail inRef. 45. A sample case is provided in Appendix II.
Stability margin studies were performed on three Pratt &Whitney Aircraft turbofan engines uzing a transient computerprogram. These engines were extracted from the Pratt & WhitneyAircraft file of study engine cycles and consist of a 2.0 BPRmixed flow, and a 6.0 and 12.0 nonmixed flow design, eachwith a fanhigh compression system. These cycles are typicalof those considered at different BPR levels for STOLapplication. The objective of these stability margin studieswas to obtain a set of data which would permit evaluation ofengine stability margin during normal STOL operation as afunction of distortion, reverser operation and thrust levelto ultimately define the distortion tolerance for each engine.The reverser effect on the engine was defined to be a changein exhaust nozzle effective area.
The assumed exhaust nozzle area variation is shown in Figure97. The definition of the deployment characteristic wasselected because a review of several thrust reversersshowed an over area of at least 20 percent sometimeduring deployment. The review also showed that an under areausually occurs near the end of the deployment stroke. The
141

20 2o i/.
/ \
10-
\ I
LU
-10 02 40 w so 100
REVERSER DEPLOYMENT •1%)
Figure 97: AIRFLOW MATCH CURVE REPRESENTINGREVERSER DEPLOYMSYVT
142

deployment rate in all cases was one second from stowedto fully deployed. This rate was identified as a goal forthrust reverser design studies conducted in Part 1B ofthe program.
Data were calculated for both steady and transient operationat a sea level flight condition. Steady state data show theeffect of thrust reverser area variation on the stability marginof the fan and compressor, as well as the thrust split betweenthe flowstream. The thrust split can be used to estimate thereverse thrust of different types of reversers. The steadystate data were obtained from each engine model by simulatingthe effect of a thrust reverser as a change in either primaryor duct stream effective area. The effective area valuesinvestigated were the extremes of minimum and maximum areapositions as identified by Boeing.
Transient operation consisted of engine accels and decels atvarious area values, as well as thrust reverser transitions.Accels and decels were obtained to determine the influenceof off design area value on stability margin as well as thetime it takes to achieve a desired thrust change. Thrustreverser transitions were obtained for the one second deploy-ment rate with engines set at 80 percent of takeoff power,and were made from stowed to deployed as well as from deployedto stowed.
It is concluded from analysis of these data that the influenceof a thrust reverser on component stability margin during trans-ient operation is approximately equivalent to changes obtainedduring steady operation at the same nozzle positions. Thiscan be observed by examination of accel and decel data, aswell as thrust reverser deployment data. This conclusionsimplifies thrust reverser analysis because it eliminates theneed for incorporating transient stability margin datainto the analysis.
A further simplification was derived for accel and decelinfluence on high compressor stability margin. These datahave been reduced to a set of curves that define theloss or gain in stability margin as a function of enginepower.
Other factors that influence stability margin are pressure andtemperature distortion. Data were obtained for each engineon a "change in stability margin" basis. The effect of dis-tortion was obtained using parallel compressor theory re-sulting from 180 degree square wave patterns.
143
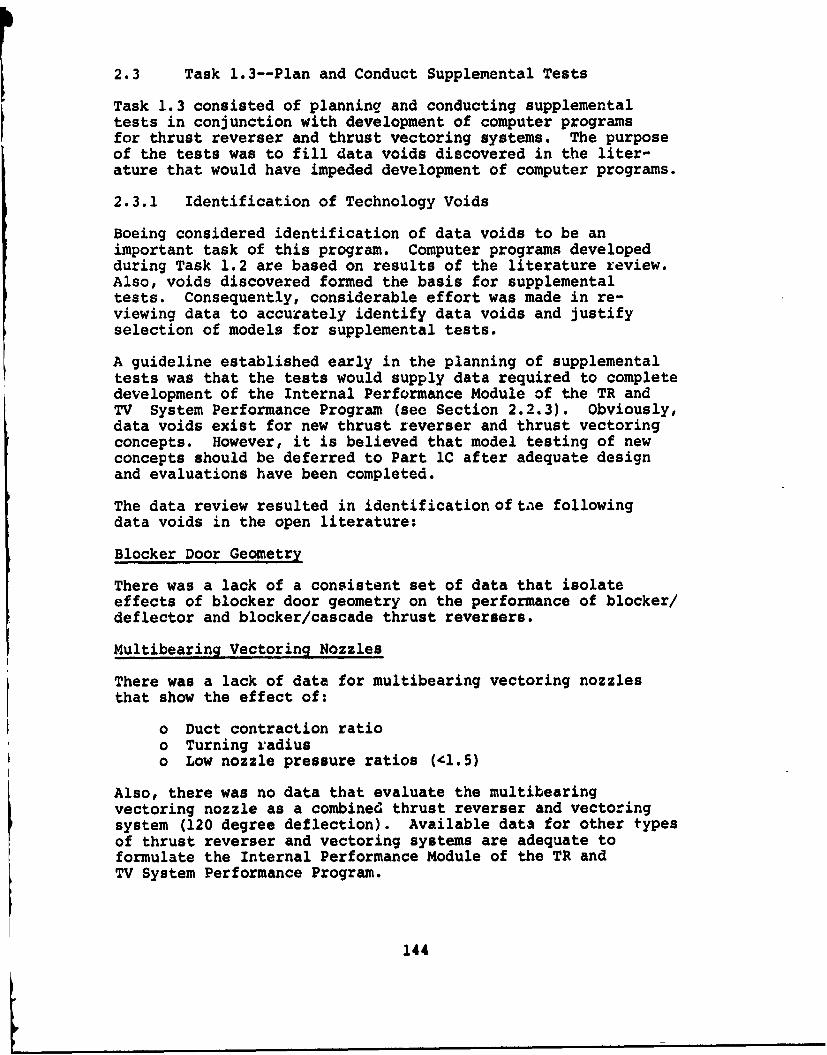
2.3 Task 1.3--Plan and Conduct Supplemental Tests
Task 1.3 consisted of planning and conducting supplementaltests in conjunction with development of computer programsfor thrust reverser and thrust vectoring systems. The purposeof the tests was to fill data voids discovered in the liter-ature that would have impeded development of computer programs.
2.3.1 Identification of Technology Voids
Boeing considered identification of data voids to be animportant task of this program. Computer programs developedduring Task 1.2 are based on results of the literature review.Also, voids discovered formed the basis for supplementaltests. Consequently, considerable effort was made in re-viewing data to accurately identify data voids and justifyselection of models for supplemental tests.
A guideline established early in the planning of supplementaltests was that the tests would supply data required to completedevelopment of the Internal Performance Module of the TR andTV System Performance Program (see Section 2.2.3). Obviously,data voids exist for new thrust reverser and thrust vectoringconcepts. However, it is believed that model testing of newconcepts should be deferred to Part 1C after adequate designand evaluations have been completed.
The data review resulted in identification of tae following
data voids in the open literature:
Blocker Door Geometry
There was a lack of a consistent set of data that isolateeffects of blocker door geometry on the performance of blocker/deflector and blocker/cascade thrust reversers.
Multibearing Vectoring Nozzles
There was a lack of data for multibearing vectoring nozzlesthat show the effect of:
o Duct contraction ratioo Turning radiuso Low nozzle pressure ratios (41.5)
Also, there was no data that evaluate the multibearingvectoring nozzle as a combined thrust reverser and vectoringsystem (120 degree deflection). Available data for other typesof thrust reverser and vectoring systems are adequate toformulate the Internal Performance Module of the TR andTV System Performance Program.
144

2.3.2 Supplemental Static Tests
On the basis of the data review, a test plan (Ref. 46) wasformulated for iupplemental static tests to determine:
1) Multibearing vectoring nozzle performance as afunction of parametric geomeziuy variations.
2) BloGYer door geometry effects on performance of blockei/cascade and blocker/.,rflector thrust reversers.
The tast plan was submi.ttad to the Air Force program managerin September 1971 and wrs approved in October. Static teet-ing was conducted from 20 December 1971 to 14 February 1972on the thrust vector rig at the Boeing Propulsion/NoiseLaboratories.
A test report (Ref. 47) was prepared and submitted to theAir Force program manager in March 1972. Descriptions oftest models and results are summarized in the followingaections. The test results have been incorporated into theInternal Performance Module of TR and TV Systerm PerformanceProgram TEM-357.
Multibearing Vectoring Nozzle Static Test
The objectives of the multibearing vectoring nozzle statictests were to:
1) Evaluate the vectoring nozzle internal performance (thrustand mass flow) for variations of:
a) Bearing angJeb) Duct turning Mach number (inlet and exit)c) Duct turning radiusd) Overall duct and nozzle lengthe) Thrust vector anglef) Nozzle pressure ratio
2) Evaluate the multibearing vectoring nozzle as a thrustreverser system.
3) Establish design criteria for full-scale nozzle design.
A total of 10 multibearing nozzle test configurations weretested including the following geometric variations:
-I, 14) 5
--• 145

1) Bearing angle, O= 65°, 60*
2) Duct contraction ratio:
O= 650, AD/AE = 1.345, 1.760, 2.94
0 60, AD/AE - 1.345, 2.94
3) Duct turning radius ratio:
O= 650, (r/D)min = 0.641, 0.926
0= 60*, (r/D)min m 0.645, 0.840
4) Overall duct and nozzle length:
O= 650, L/D = 2.415, 1.996
0= 6u0 , L/D = 2.944, 2.301
5) Thrust vector angle
S= 650,4 = 00, 300, 600 1000
S= $50, 1 = 00, 300, 60c, 900, 1200
In additiLn, one of the models tested has a converging ductsection that accelerated flow through the duct turn. Themodel had a contraction ratio of AD/AE - 2.94 and bearingplane angles of 60 degrees. All models were tested overthe pressure ratio range from 1.1 to 3.0. A test model isshown installed on the vectoring rig in Figure 98.
Many of thoconfiguratiors hao nearly equivalent performance.Therefore to improve readability, data points are not shownon the following comparison plots. Plotted data foreach nozzle configuration are presented in Appendix I ofRef. 47. Results of the multibearing static test aresummarized below.
1) Vector efficiency and airflow match are decreased asduct contraction ratio decreases (and duct Mach numberincreases) especially below contraction ratio cf 1.760.Airflow match was significantly lower for contractionratio of 1.345 at maximum deflection angle (Figure 99through 101).
2) The duct turning radius was not a significant influenceon vectoring nozzle performance. Generally, vectoringefficiency was improved 0.5 to 1.5 percent and airflowmatch was improved by two percent when the turning radiusratio was increased at maximum deflection (Figure 102and 103).
146

Figure 98. MUL TIBEA RING VECTORING NOZZL E MODEL INSTA LLA TION
1 147

CC,
1-bus9
ow 0
CC
~LLC) U
N _ _ _
- - -
ADN311IJ3 0133
e _ _8
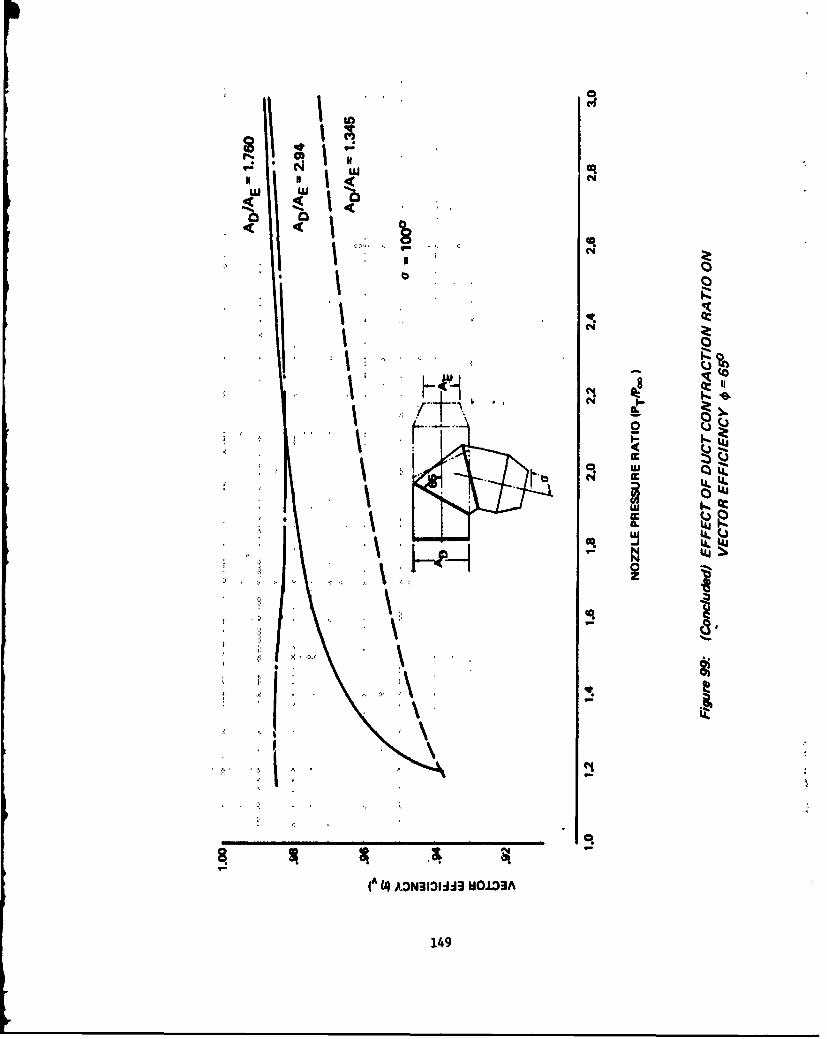
ICE
1494

H U )
0
Nww
H3IV MJ IV
150j

C4
N
N
H8
bC
Ix L
li-I
[Ia
Nt
HOVWMIAMI
151k~
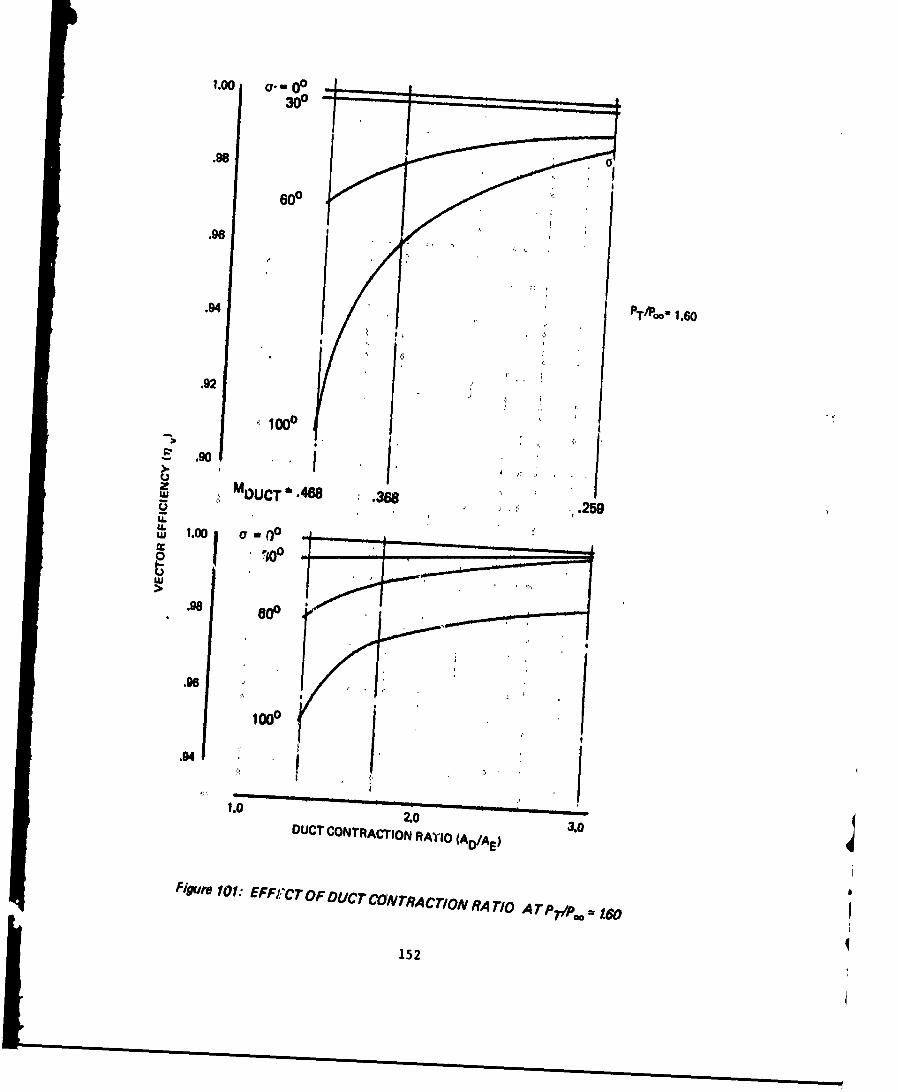
1.00 acft0O
300
600
.96o 16
.92
1001U.9
ww
.98 6000
INIzo3.04DUCT CONTRACTON RAYnO (AWIAE)
Figure 101: EFFjP.CTOF DUCT CONTRACT/ON RA TiO AT PT/Pa42 160
152

1.00 U-0 0 -
600 ,
.96
PT/'O"- 1.60
.94
.92 : "
• 1000
~.90
z MDUCT .366 .259
.u 1.00 a
• 'iflO
.961000 _
.94 ,
I I 41.0 2.0 3.0
DUCT CONTRACTION RATIO (AD/AE)
Figure 101: EFF/CT OF DUCT CONTRACTION RATIO A T P/P== 160
152
I C
a..q
N
IC
el4Q1 8
0C4I
CD ;:
flu. CC
I 'a
1541
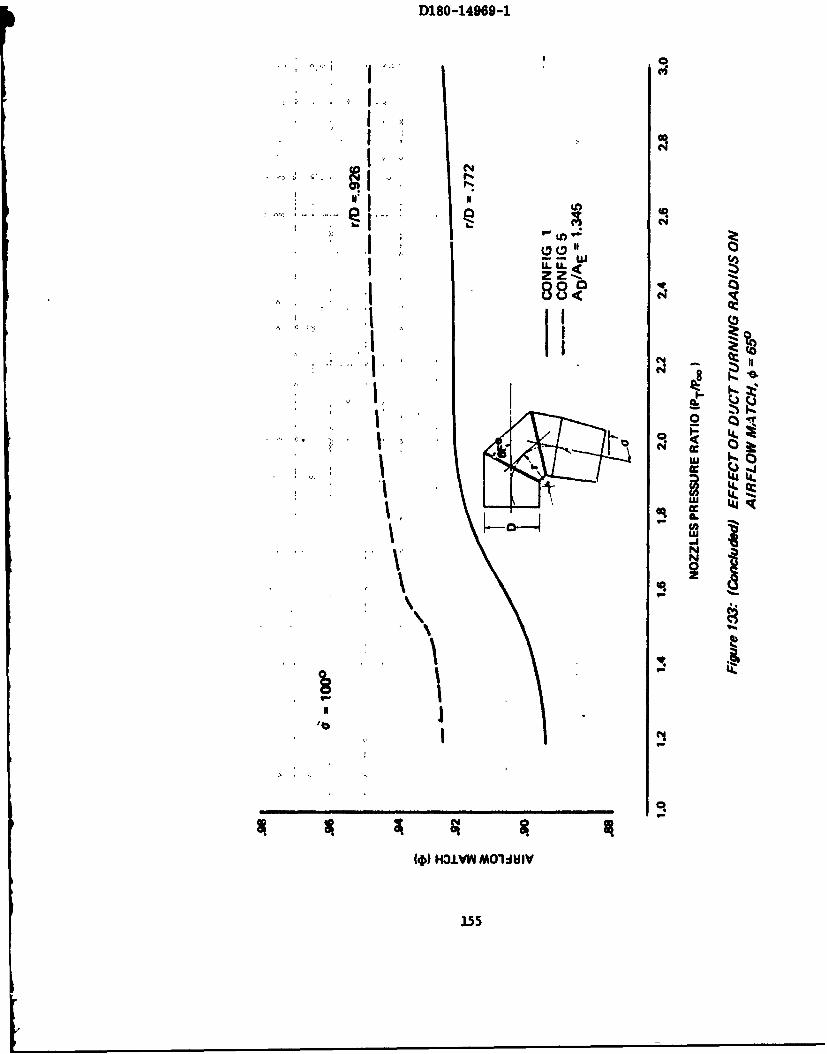
D180-14969-1
IL
WILII I
1%l
1%*
N*I I, i
( I-' H31V MOD.
155

3) The effect of overall duct length indicated duct andnozzle length can be made as short as possible withoutsevere penalty to vectoring nozzle performance (Figures104 and 105).
4) Reverser efficiency of 47 to 49 percent was obtained whenthe 60 degree bearing plane angle configurations weretested at 120 degree deflection angle. The data indicatethat satisfactory levels of reverser performance arepossible when the multibearing nozzle is used as athrust reverser (Figure 106).
5) The converging duct model configuration had equivalentvectoring performance when compared to a constant areaduct configuration with the same contraction ratio. Thisdesign is attractive because it is shorter than constantarea duct designs and therefore will have less weight(Figuresl07 and 108).
Thrust Reverser Blocker Door Geometry Static Test
The purpose of this static test was to investigate blockerdoor geometry effects on thrust reverser performance. Testobjectives were:
1) Determine the effect of blocker door deflection angleand setback distance on performance of blocker/deflectorand blocker/cascade thrust reversers installed in thefollowing ducts:
a) Annular duct of a fan nozzleb) Circular duct of a primary (or mixed flow nozzle)
2) Establish design criteria for the above thrust revez~syinstallations.
Initial planning for this test included four types of thrustreversers:
o Annular duct blocker/cascadeo Annular duct blocker/deflectoro Circular duct blocker/cascadeo Circular duct blocker/deflector
However, static testing of the blocker door geometry model wasterminated after completion of the annular duct blocker/cascademodel testing. It was decided that the results obtained wouldsatisfy the overall objectives of the program without expendi-ture of funds bityond the budgeted amount. Since effects ofblocker door geometry were found to be relatively small, lackof data for untested configurations will not significantlyaffect the accuracy of internal performance predictions ofthe TR and TV System Performance Program.
156

C.
b (.4
*1c I-(
N z lk
II
2 dC
*15
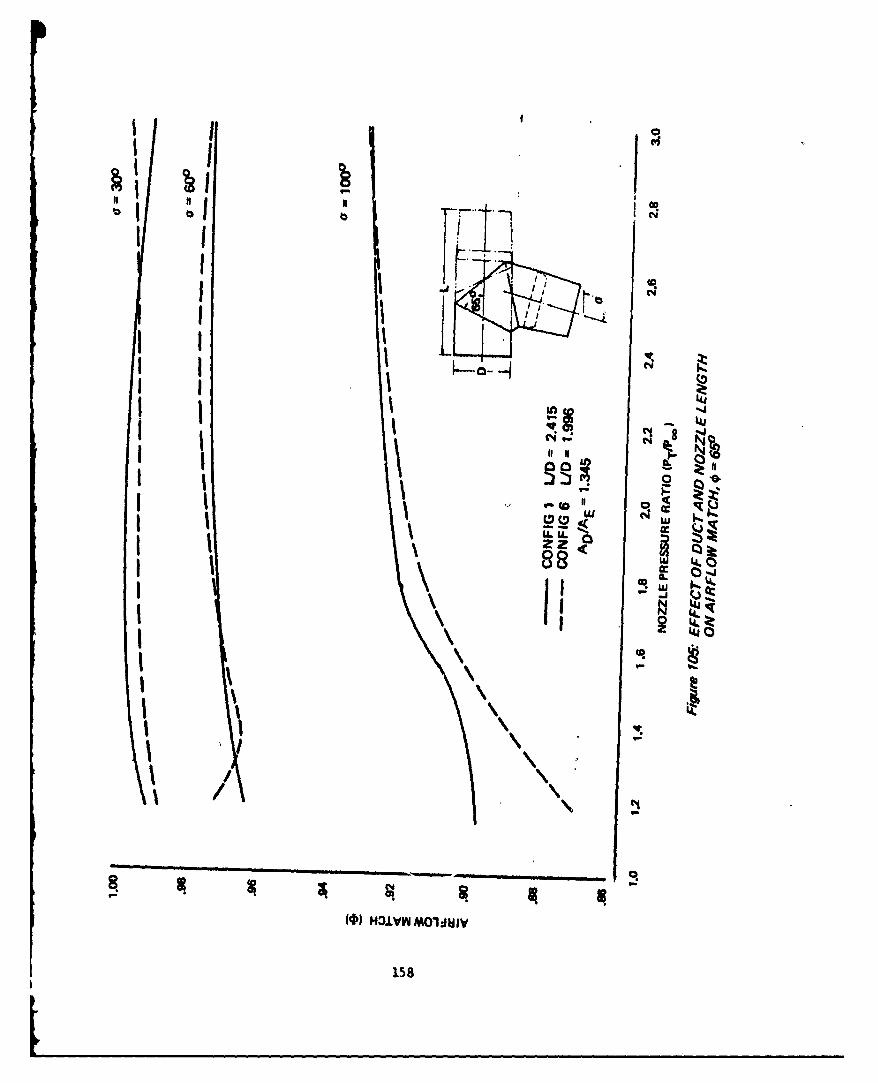
NIN
I~ L_
15
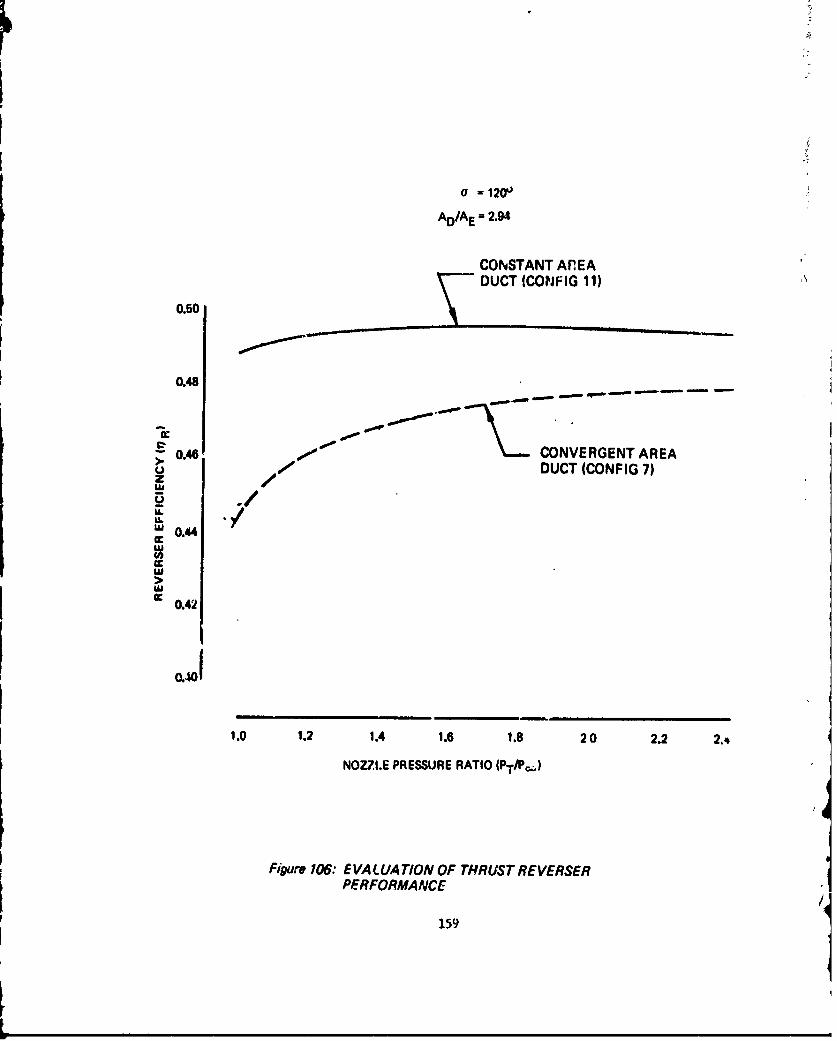
o=120
AD/AE 2.94
CONSTANT AFIEA-- "DUCT ICONF IG 11)
0.50
0.48
S0.46 CONVERGENT AREAz08 4" DUCT (CONFIG 7)Uz °/
w0.44w
0.42
0.401
1.0 1.2 1.4 1.6 1.8 20 2.2 2.4
NOZZLE PRESSURE RATIO (PT/Pc.;)
Figure 106: EVAW.UATION OF THRUST REVERSERPERFORMANCE
159

cc NUL CD
0 Z.
ua-U r'.M>
zC
88C
elt AM 11LU ~:3
16
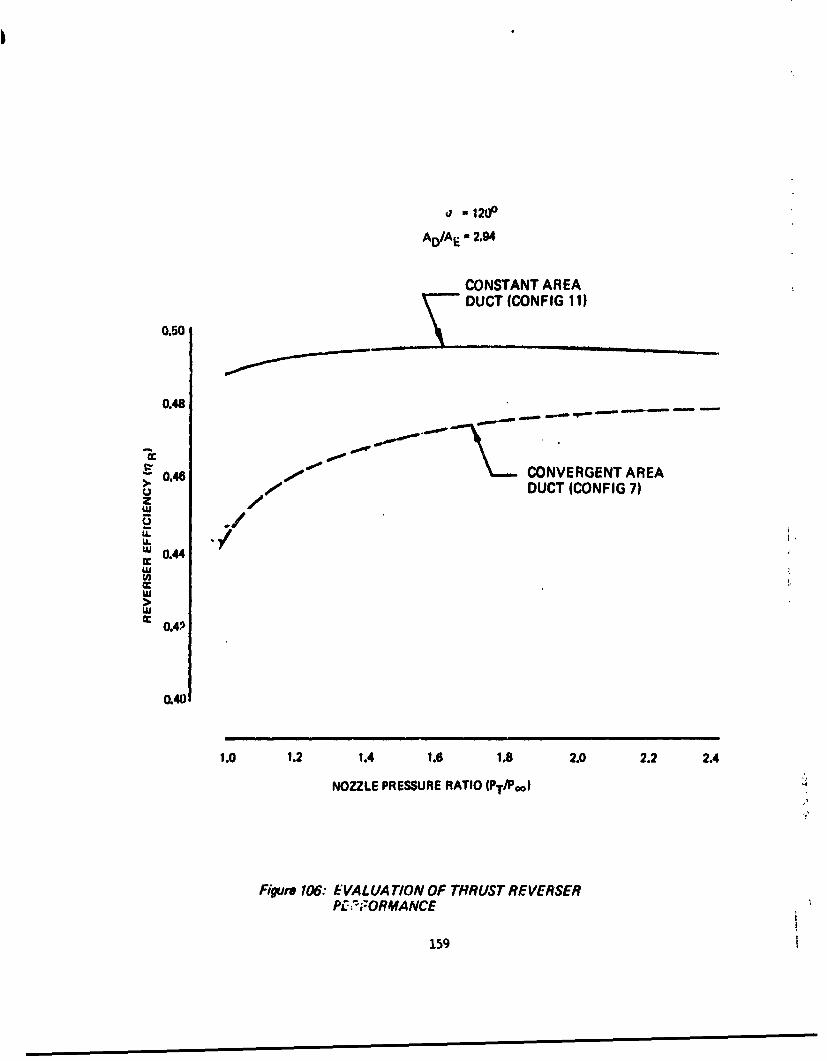
S120°
AD/AEl 2.94
CONSTANT AREADUCT (CONFIG 11)
0.50
0.48
0.46 CONVERGENT AREAo DUCT (CONFIG 7)
U.9u 0.44Lu
cc 0.40
0.40
1.0 1.2 1.4 1.6 1.8 2.0 2.2 2.4
NOZZLE PRESSURE RATIO IPTIPoo)
Figurv 106: EVALUATION OF THRUST REVERSERPLI2UORMANCE
159
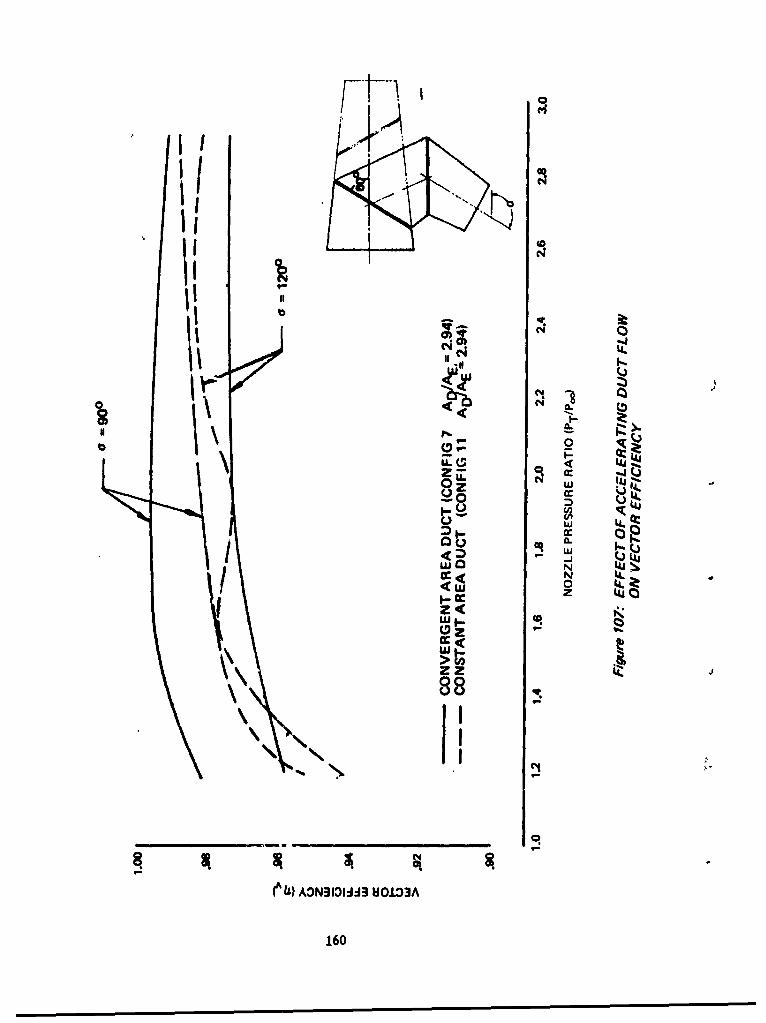
II
NU3 0
zu.z 4
-0
z 4*
160

..0C
zI Ceq
uj 0>
Iz I80 8 0CR
*p XWM-: IV161

The blocker door geometry static test model consisted of anannular flow duct simulating a fan exhaust duct, a simulatedengine strut (internal), and a cascade reverser model similarto the type used on the fan reverser on the Model 747 JT9D-3Aengine. A photograph of the model installation is shown inFigure 109.
CAS CA E -
FLOW
B BLOCKER DOO INSERTS
Inserts for 45, 90, and 135 degrees were used to simulate theblocker door geometry. The model was tested with setbackdistances of s/h = 0 and 0.50.
The effects of blocker door geometry were evaluated as incre-ments relative to the G= 90 degrees, s/h = 0, blocker doorconfiguration. Data points are not shown in the comparisoncurves. Test data for each model configuration showingabsolute levels are shown in Appendix I of Ref. 47. The re-sults of the test are summarized as follows:
1) Data indicate optimum blocker door design for an annularcascade reverser is the 90 degree door geometry. Reverserperformance was lower for the 45 and 135 degree blockerdoor geometry configurations. (Figure 110)
2) Blocker door setback distance has minimal effect onreverser performance, as shown in Figure 111. The datashow that small positive or negative changes in reverserefficiency occurred when the blocker door was set backfrom the cascade depending on the nozzle pressure ratio.
Details of test models and installation, instrumentation, pro-cedure, and results of the multibearing vectoring nozzle andblocker door geometry static tests are presented in Ref. 47.
162

SOO
MEM
Figure 709: BLOCKER DOOR GEOMETRY MODEL INSTALLATION
163 Reproduced frombest available copy.
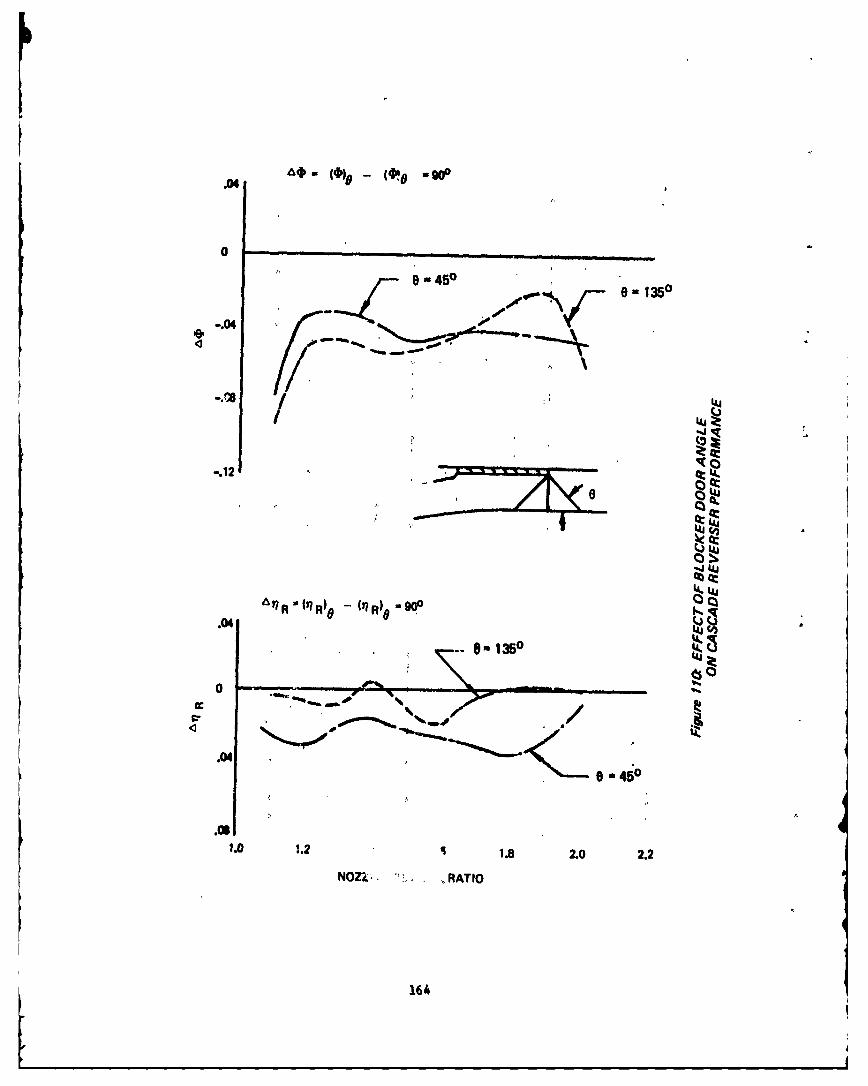
.04
0 _ _ _ _ _ _ _ _ _ _ _ _ _ _ _ _ _ _ _ __.. ... _ _ _
"0- 450
le-e 1350
-.04
/. . ';1820 Ii2
NOZRU?1R) .R' -0 ... .. ATIL4
-.12
1.00 1.0. . .
1634

-' (4)A~ -(M)m -0.04
0 -
-.04/
s/ 0.50
.0
-.04
1.0 1.2 1.4 1.6 1.8 2.0 Z22
NOZZLE PRESSURE RATIO (PT/Pa.)
Figure I11:. EFFECT OF BL OCKER DOOR SETBA CKDISTANCE ON CASCADE REVERSERPERFcORMANCE
165
SECTION III
CONCLUSIONS AND RECOMMENDATIONS
The tasks conducted during Part lA of this program have pro-duced several useful tools for thrust reverser and vectoringnozzle design studies:
1) Thrust Reverser and Thrust Vectoring Literature ReviewDocument (Ref. 1 ) -- to allow a reader to easily determinesources of data related to his particular interest.
2) Jet Trajectory and Spreading Program--to predict thetrajectory and shape of the thrust reverser or vectoringnozzle exhaust plume.
3) Reingestion Prediction Program--to predict the on-setof reingestion for arbitrary thrust reverser and airplaneconfigurations as a function of geometry and flow con-dition.
4) TR and TV System Performance Program--to predict TR andTV nozzle performance and engine stability margincharacteristics.
In addition, static tests were conducted to determine:
1) Multibearing vectoring nozzle performance as a functionof parametric geometry variations.
2) Blocker door geometry e.fects on the performance ofannular blocker/cascade thrust reversers.
The test results filled data voids discovered during theliterature review and were incoporated into the TR and TVSystem Performance Program. The primary conclusions tobe drawn from the Part 1A analytical work are:
1) The analytical and semi-empirical methods developedprovide relatively simple design tools to evaluate theperformance of many types of thrust reverser and thrustvectoring systems and to determine potential exhaustflow interference and reingestion problems. They arelimited only by the current-state-of-the-art of analysisand existing empirical data.
166
2) There are many sources of thrust reverser reingestionand aerodynamic interference data for current CTOLtranspurts. However, application of the data to STOLtransports is limited because the specific requirementsof STOL transports cause the thrust reverser installationto be highly configuration dependent. The requirementsof exhaust flow directional control to minimize reinges-tion result in thrust reverser types that are significant-ly different than conventional designs. The aircrafthigh lift system has a direct influence on the nacellelocation, reverser type, and hence reingestion andaerodynamic interference characteristics.
3) The methods used to predict the onset of reingestion wouldbenefit from comparisons with experimental results thatisolate the specific type of reingestion i.e., crossflow,self (closed loop), near field fountain, or far fieldfountain.
4) The influence of thrust reverser operation on enginestability margin during transients is approximatelyequivalent to changes obtained during steady stateoperation at the corresponding partially deployed reverserposition.
5) Existing data for flat plate and curved external deflectorsis inadequate to predict effects of setback distance anddoor length for other types of deflector nozzles. Statictests were conducted during Part 1C on a hinged deflectornozzle and data correlation showing effects of setbackdistance were incorporated into the TR and TV SystemPerformance Program.
Recommendations for future thrust reverser and thrist vector-ing work pertinent to the tools developed for Part 1A includethe following:
1) Interactions between thrust reverser and inlet flow fieldsand the effects on airplane aerodynamic characteristicsshould be studied using three-dimensional potential flowtechniques.
2) The closed loop reingestion criteria should be improvedby using a free streamline analysis or by experiment.A parametric test of variables influencing self re-ingestion is recommended.
3) Improvements should be made to the Jet Trajectory andSpreading Program to handle multiple, merging jets, includ-ing effects of inlet suction and nonuniform flow field.
167

4) A low speed wind tunnel test should be conducted toobtain thrust reverser and thrust vectoring performancedata allowing correlations of aerodynamic interferenceand reingestion as a function of TR and TV system type,location, forward speed, pressure ratio, vector angle,and angle of attack and yaw.
168
1*. .. .. _ _ _

bISECTION IV
COMPUTER PROGRAM USAGE
Three computer programs have been developed:
1) Jet Trajectory and Spreading Program TEM-356A
2) Reingestion Prediction Program TEM-356B
3) TR and TV System Performance Program TEM-357
The programs are coded in FORTRAN IV language for the ControlData Corporation 6600 (131K) digital computer. They may becompiled with either FORTRAN IV (Extended) or FORTRAN IV (Run)compilers by changing the end-of-file test in input routines.The standard FORTRAN system library (FTN) is used. There isno overlaying or use of scratch tapes. Control of the com-puter during checkout was by the KRONOS operating system.
Card deck arrangements for the programs are shown in Figures112 and 113. Each program consists of control cards, eithera symbolic or binary deck, and a group of data cards. Thecontrol cards shown are common for the three programs but arecharacteristic of the particular computer installation. Datacards for the particular problem and the first two controlcards, which contain run priority, time estimate, and useridentification are inserted into the deck. The other cardsnormally remain unchanged.
The remainder of this section describes mechanics of inputdata preparation. Complete descriptions of card inputs toeach program are presented. Appendix II contains samplecases to acquaint users with input card format and printoutformat for each program. These sample cases are also in-tended for use in checking out the programs on computerfacilities.
3.1 Jet Trajectory and Spreading Computer Program Usage
Program TEM-356A provides a simple method of obtaining jetplume shapes for four types of initial jet cross ections.
TYPE = Initial Jet Cross Section Page
1. Circular 1742. Rectangular 1763. Two-dimersional 1784. Annular 180
169
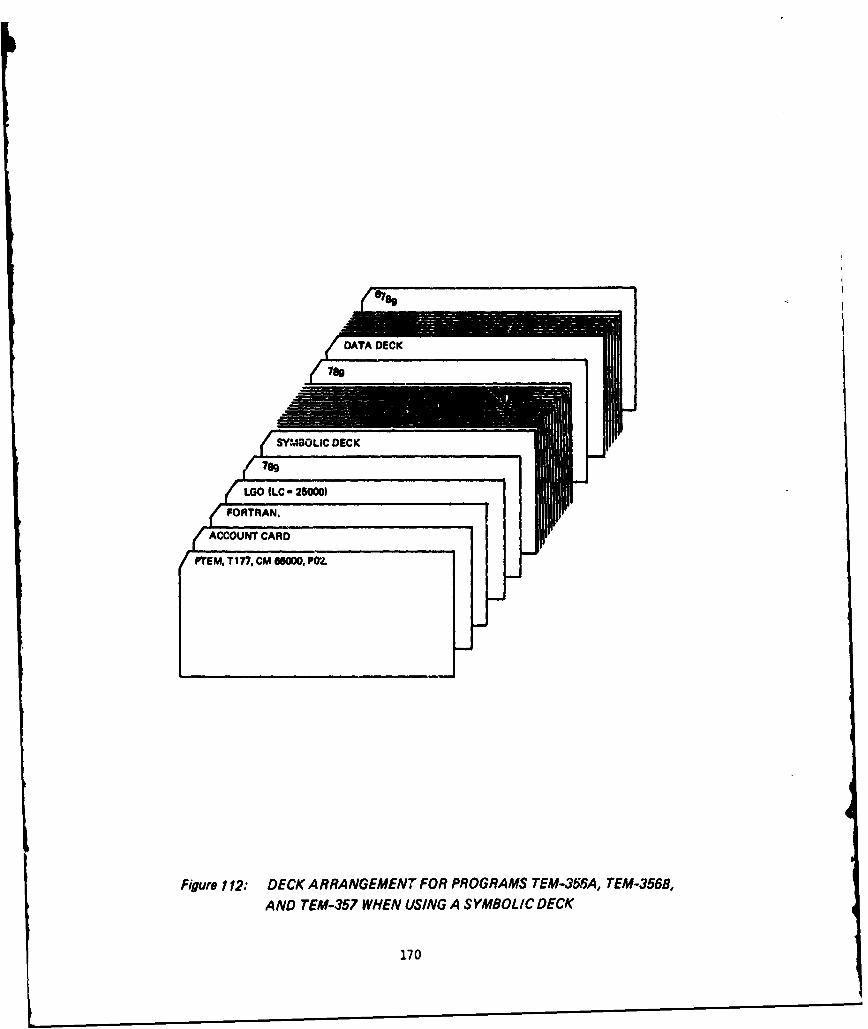
AYNDSI DECK5 HNUIG YBLCDC
7170

PTMTI?,CDPSOOO IIP02.LG
NOTE:' THIS CARD MUST eEINSERTED IF PUNCHED
I CAWlS ARE REQUESTED.
Figure 113: DECK A RRANGEMENT FOR PROGRAMS TEM-356A, TEM-3568,AND TEM-357 WHEN USING A B/NARY DECK
171
Data Input Format
All input to program TEM-356A is in the "NAMELIST" format,except one table of vahies used for TYPE - 4. (page 181).The following rules must be followed to use NAMELIST format.
1) Card Column 1 must be blank, always.
2) A data set begins with a $NEW card and ends with a $ENDcard.
3) Commas are used to separate numbers and variable names.
4) Variable names must be properly spelled.
5) Card Columns I to 80 are read using NAMELIST. Thismeans that CC 73-80 cannot be used for identificationpurposes.
6) Variable names and values are read "free field." Thismeans imbedded blanks may be used at the user's dis-cretion, and that more than one variable may be inputper card. However, the input system described on thefollowing pages is recommended because it separatesthe numbers and makes data checking easier.
The general card stacking arrangement is shown in Figure 114.The user may run as many jet plumes as he desires in asingle computer submission. There are no restrictions as tosequence of the four types. Detailed card inputs for the fourtypes are contained in the next section. Users are cautioiedto check their inputs carefully before submitting a computeerun.
172

I I0
[D.•TA CAROS FOR SECOND JET
* SEND
DATA CARDS FOR FIRST JET
$NEW
Fgure 114: DATA CARD ARRANGEMENT FOR SEVERAL CASES, PROGRAM TEM-356A
173
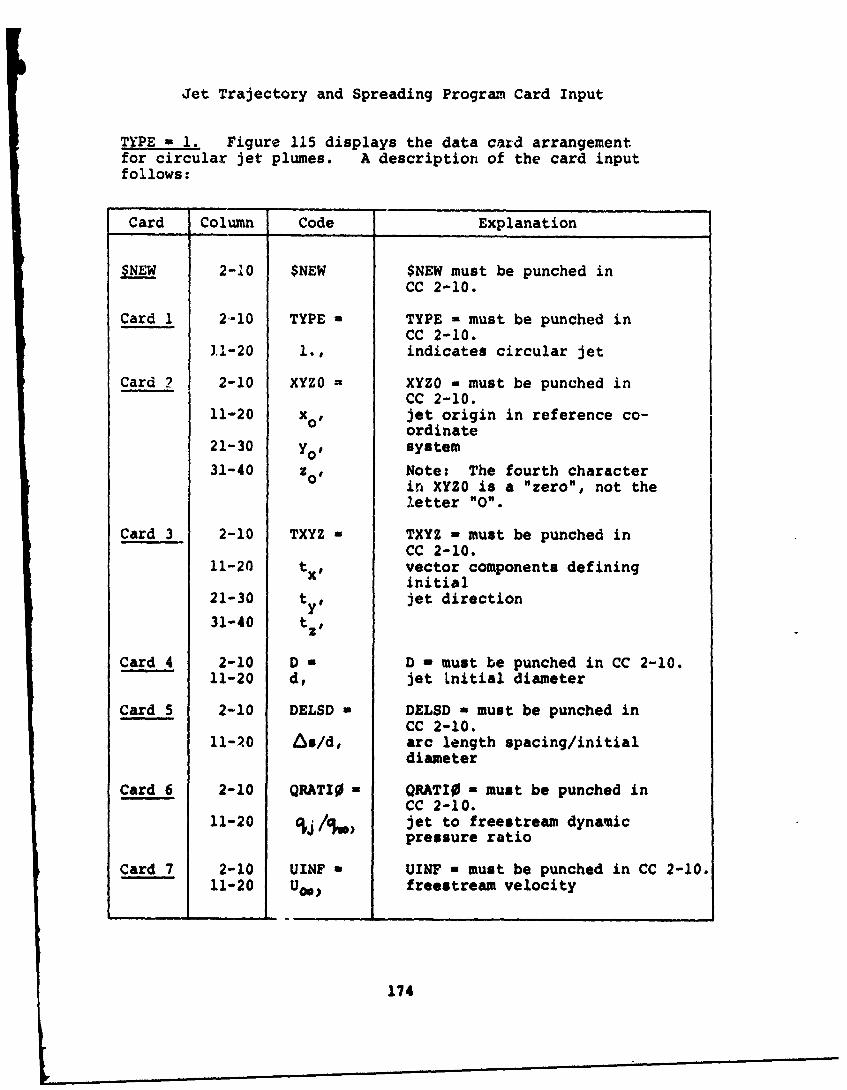
Jet Trajectory and Spreading Program Card Input
TYPE - 1. Figure 115 displays the data card arrangementfor circular jet plumes. A description of the card inputfollows:
Card Column Code Explanation
$NEW 2-10 $NEW $NEW must be punched inCC 2-10.
Card 1 2-10 TYPE - TYPE - must be punched inCC 2-10.
].1-20 1., indicates circular jet
Card 2 2-10 XYZO - XYZO - must be punched inCC 2-10.
11-20 xo, jet origin in reference co-ordinate
21-30 Yo' system31-40 zO, Note: The fourth character
in XYZO is a "zero", not theletter "0".
Card 3 2-10 TXYZ = TXYZ - must be punched inCC 2-10.
11-20 tx, vector components defininginitial
21-30 ty, jet direction
31-40 t ,
Card 4 2-10 D * D - must be punched in CC 2-10.11-20 de jet Lnitial diameter
Card 5 2-10 DELSD - DELSD - must be punched inCC 2-10.
II-20 6s/d, arc length spacing/initialdiameter
Card 6 2-10 QRATI0 = QRATI0 a must be punched inCC 2-10.
11-20 jet to freestream dynamicpressure ratio
Card 7 2-10 UINF - UINF - must be punched in CC 2-10.11-20 U0) freestream velocity
174
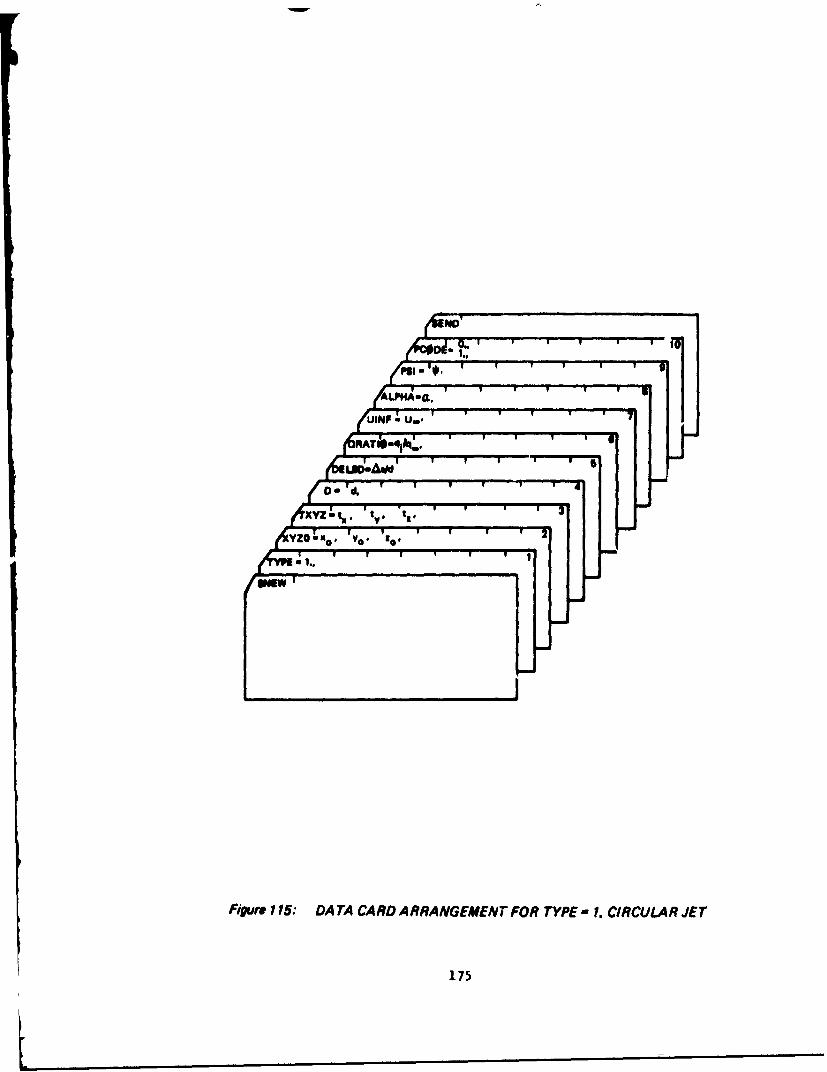
w9
( I ,51 -' U . v I '
A1O -W I II-
•vZ~o'-,. Vo. ',0. ' 2
Figure 115: DATA CARD ARRANGEMENT FOR TYPE 1. CIRCULAR JET
175
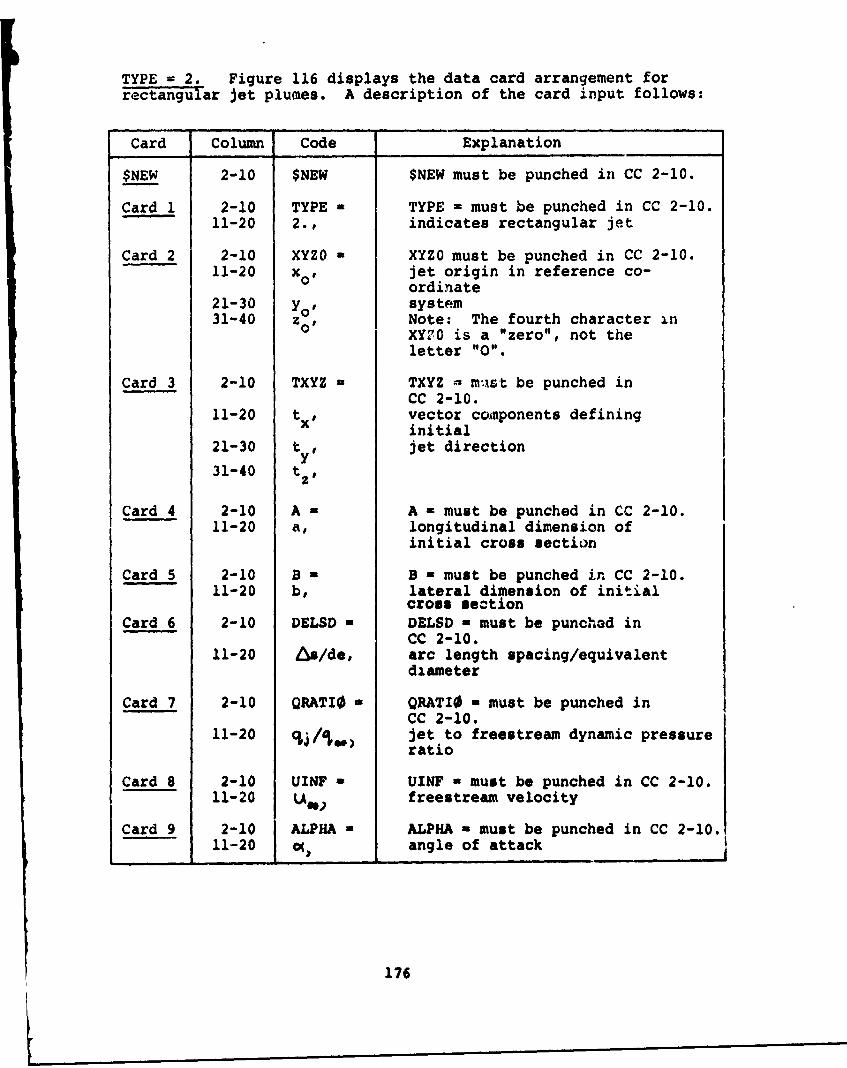
TYPE = 2. Figure 116 displays the data card arrangement forrectangular jet plumes. A description of the card input follows:
Card Column Code Explanation
$NEW 2-10 $NEW $NEW must be punched in CC 2-10.
Card 1 2-10 TYPE = TYPE = must be punched in CC 2-10.11-20 2., indicates rectangular jet
Card 2 2-10 XYZO a XYZO must be punched in CC 2-10.11-20 xo, jet origin in reference co-
ordinate21-30 yo0 system31-40 zo, Note: The fourth character in
XY?0 is a "zero", not theletter "0".
Card 3 2-10 TXYZ - TXYZ - m*st be punched inCC 2-10.
11-20 t , vector components defininginitial
21-30 t , jet direction31-40 t
Card 4 2-10 A- A - must be punched in CC 2-10.11-20 a, longitudinal dimension of
initial cross section
Card 5 2-10 B - B - must be punched in CC 2-10.11-20 b, lateral dimension of initial
cross sectionCard 6 2-10 DELSD - DELSD - must be punchad in
CC 2-10.11-20 As/de, arc length spacing/equivalent
diameter
Card 7 2-10 QRATIO a QRATIO a must be punched inCC 2-10.
11-20 jet to freestream dynamic pressureratio
Card 8 2-10 UINF - UINF - must be punched in CC 2-10.11-20 LAW) freestream velocity
Card 9 2-10 ALPHA - ALPHA a must be punched in CC 2-10.11-20 C angle of attack
176

E I N DEDO .4,
XNUWV.
info, I
ALPHAI-lal,
9INF -U.. -
(so b,
An 4
YZ_ tx.
Aa '4 p
XYZI tV. ts, 3
;YZC zo.YZO zoo VON Not
It
$NEW
,Fjgur&116.- DATA CARD ARRANGEMENT FOR TYPE 2. RECTANGULAR JET
177

TYPE = 3. Figure 117 displays the data card arrangement fortwo-dimensional jet plumes. A description of the card inputfollows:
C,rd Column Code Explanation
SNEW 2-10 $IE$ $NEW must be punched in CC 2-10.
Card 1 2-10 TYPE - TYPE - must be punched inCC 2-10.
11-20 3., indicates two-dimensional crosssection
Card 2 2-10 XYZO - XYZO - must be punched inCC 2-10.
11-20 xo, jet origin in reference co-ordinate
21-30 Yo, system31-40 zaO Note: The fourth character in
XYZO is a "zero", not theletter "0".
Card 3 2-10 TXYZ * TXYZ - must be punched inCC 2-10.
11-20 tX0 vector components defininginitial
21-30 ty, jet direction
31-40 t
Card 4 2-10 T - T - must be punched in CC 2-10.11-20 t, jet initial thickness
Card 5 2-10 W - W a must be punched in CC 2-10.11-20 w, jet initial width
Card 6 2-10 DELSD * DELSD a must be punched inCC 2-10.
11-20 6`s/t, arc length spacing/jet initialthickness
Card 7 2-10 QRATIO - QRATIO a must be punched inCC 2-10.
11 20 S/68) jet to freestream dynamicpressure ratio
Card 8 2-10 ALPHA . ALPHA - must be punched inCC 2-10.
11-20 0( angle of attack
Card 9 2-10 PSI - PSI a must be punched in CC 2-10.11-20 angle of yaw
178
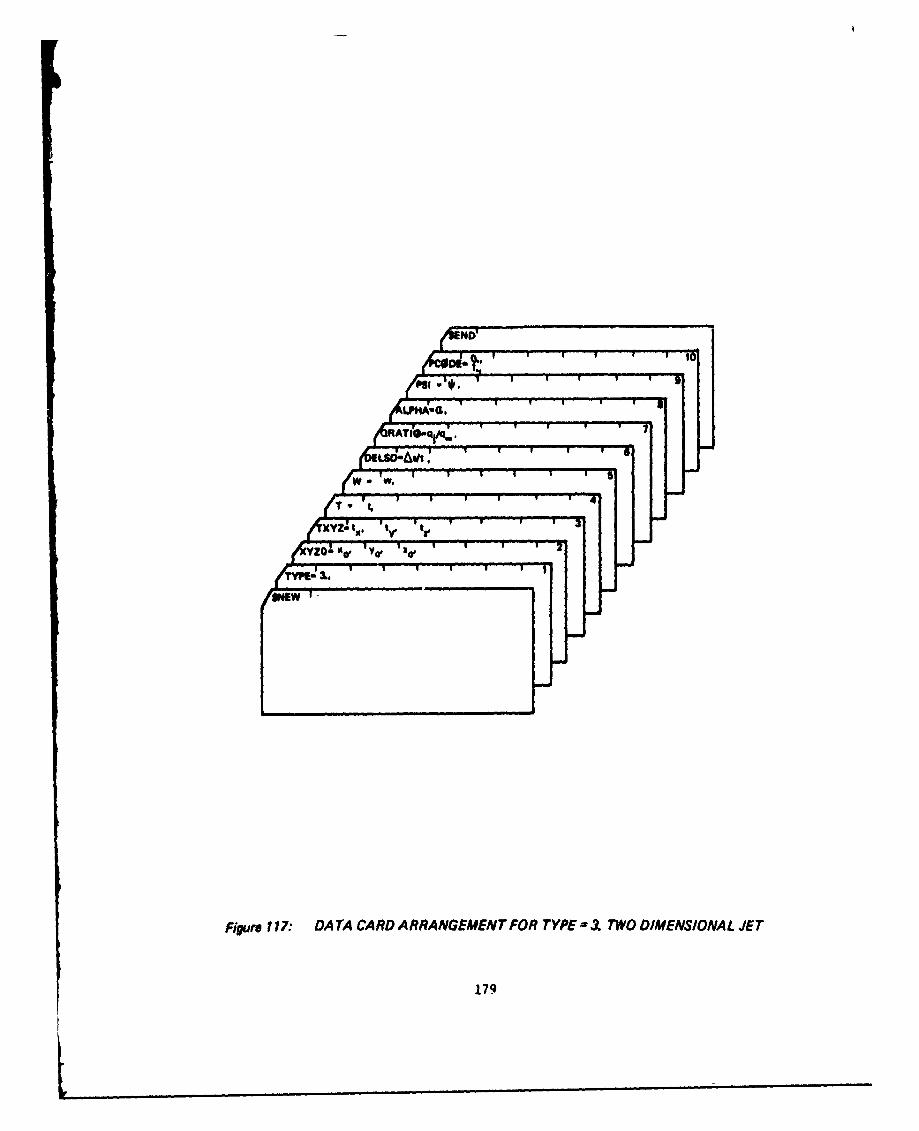
*amn
Figure 17: DATA CARD ARRANGEMENT FOR TYPE -I, TWO DIMENSIONAL JET
179
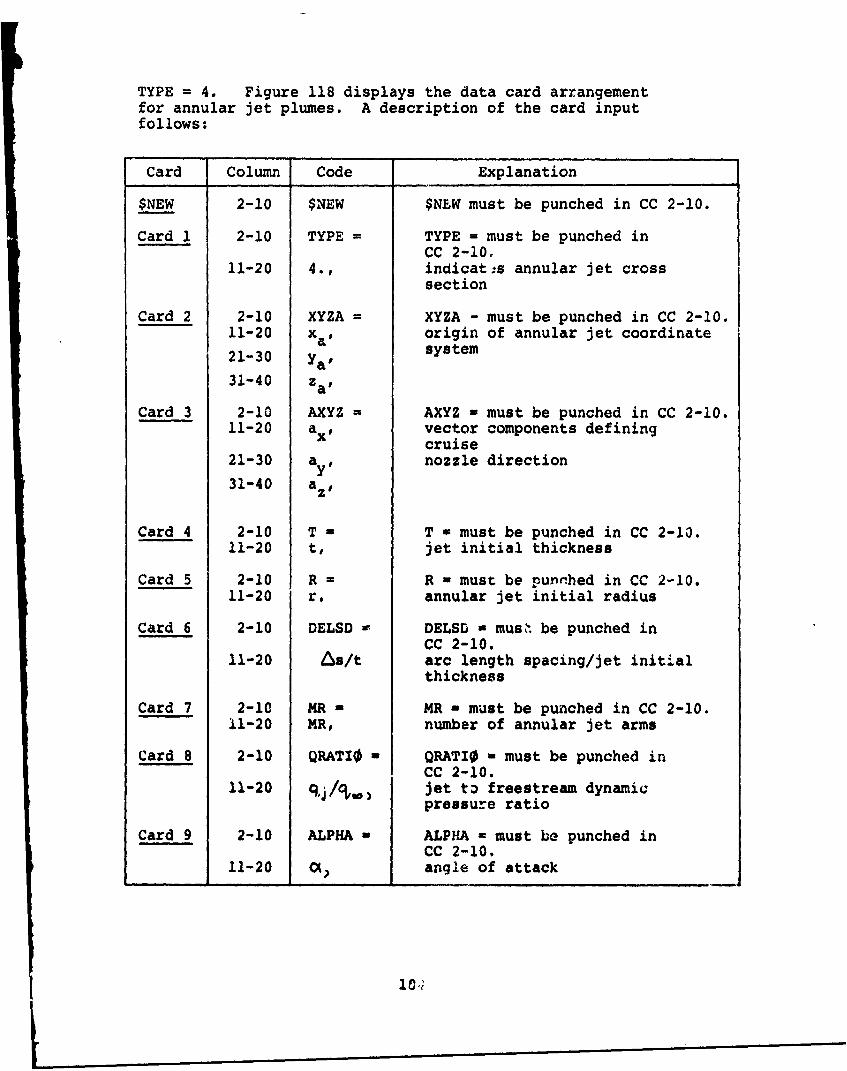
TYPE = 4. Figure 118 displays the data card arrangementfor annular jet plumes. A description of the card inputfollows:
Card Column Code Explanation
$NEW 2-10 $NEW $NLW must be punched in CC 2-10.
Card 1 2-10 TYPE = TYPE = must be punched inCC 2-10M
11-20 4., indicat.is annular jet crosssection
Card 2 2-10 XYZA = XYZA - must be punched in CC 2-10.
11-20 xa, origin of annular jet coordinatesystem21-30 Ya'?
31-40 za,
Card 3 2-10 AXYZ = AXYZ - must be punched in CC 2-10.11-20 ax, vector components defining
cruise21-30 ay, nozzle direction
31-40 a2,
Card 4 2-10 T - T - must be punched in CC 2-10.11-20 t, jet initial thickness
Card 5 2-10 R = R - must be punched in CC 2-10.11-20 r, annular jet initial radius
Card 6 2-10 DELSD = DELSD - musk be punched inCC 2-10.
11-20 As/t arc length spacing/jet initialthickness
Card 7 2-10 MR - MR - must be punched in CC 2-10.11-20 MR, number of annular jet arms
Card 8 2-10 QRATI0 - QRATIO = must be punched inCC 2-10.
11-20 q,/ jet to freestream dynamicpressure ratio
Card 9 2-10 ALPHA - ALPHA - must be punched inCC 2-10.
11-20 (X angle of attack

Card Column Code Explanation
Card 10 2-10 PSI = PSI = must be punched in CC 2-10.11-20 W5 angle of yaw
Card 11 2-10 PCODE = PCODE = must be punched inCC 2-10.
11-20 PCODE, = 0., no punched cards produced= 1., punched cards produced
$END 2-10 $END $END must be in CC 2-10.
The following additional data must be input for TYPE = 4.,Note that NAMELIST format is not used for these inputs. Inputformat is 2F10.0 (two fields, each ten digits wide).
Card Column Code Explanation
Card 1-10 9 arm clock angleSet A 11-20 i flow turning angle
Note: There must be MR of the cards, two numbers per card,where MR is the number of annular jet arms.
181

6 182

3.2 Reingestion Prediction Computer Program Usage
Data Input Format
Inputs describing jet plume geometry use the NAMELIST formatand are nearly identical to that described for the Jet Trajectoryand Spreading Program. The only exceptions are noted below:
1) ALPHA is not input. The theory assumes the freestreamflow is parallel to the ground plane and automaticallysets 0= 0. Yaw angle 1p is input as usual.
2) PCODE is not input. The program assumes PCODE = 0.
3) A new parameter, XCOWL, is input for all jet types. XC0WLis the length of the cowl from the inlet leading edge tothe front of the thrust reverser exit. XC0WL is usedin place of plate length in the criterion for reattachmentof exhaust flow to the cowl surface (see Figure 76).
4) A new parameter, N01, is inpu. for all jet types. NOIis the inlet number associated with a particular jet.
5) UINF must be input for all type jets. In TEM-356A, UINFis required for TYPE - 1. and 2. only.
6) The inlet data are input in 10F7.0 Iformat.
The general card stacking arrangement is shown in Figure 119.The user may submit up to four inlets and four jets (otherthan TYPE - 4.) in a single-case. Only one TYPE - 4. jet-maybe run per case. However, as many cases as are desired canbe stacked for a single computer submission.
183

REINGESTION PREDICTION PROGRAM CARD INPUT
Figure 119 displays the data card arrangement for theReingestion Prediction Computer Program. All numbers mustbe punched with a decimal point. The inlet card input dataare input in 7F10.0 format rather than NAMELIST.
Card Cr'umn Code Explanation
I Card 1 1-10 NI - number of inlets1. v NI A 4.
11-20 ZGRND height of (x,y,z) referencecoordinate system from groundplane
CardSet 2 1-10 xi position of inlet center in
11-20 Yi reference coordinate system21-30 zi31-40 di inlet diameter41-50 Vhi inlet hilite velocity
Note: There must be NI cardsin Card Set 2, five numbersper card. L
Card 3 1-10 NJ 2 - number of jets1. aLNJ A 4.
Figure 120 displays additional !LIMELIST data cards for usein program TEM-356B. The cards are inserted in any order Lbetween the $NEW and $END cards with the other NAMELISTcards describing the jet geometry. A description of theadditional input follows:
Card Column Code Description
Card Nl 2-10 XCOWL - XCOWL - must be punched inCC 2-10.
11-20 Xcowl, length of cowl surface
Card N2 2-10 N0I - N0I - must be punched inCC 2-10.
11-20 N01, inlet number associated withthis jet
Card N3 2-10 UINF a UINF - must be punched inCC 2-10.
11-20 U0) freestream velocity, ft/sec
184
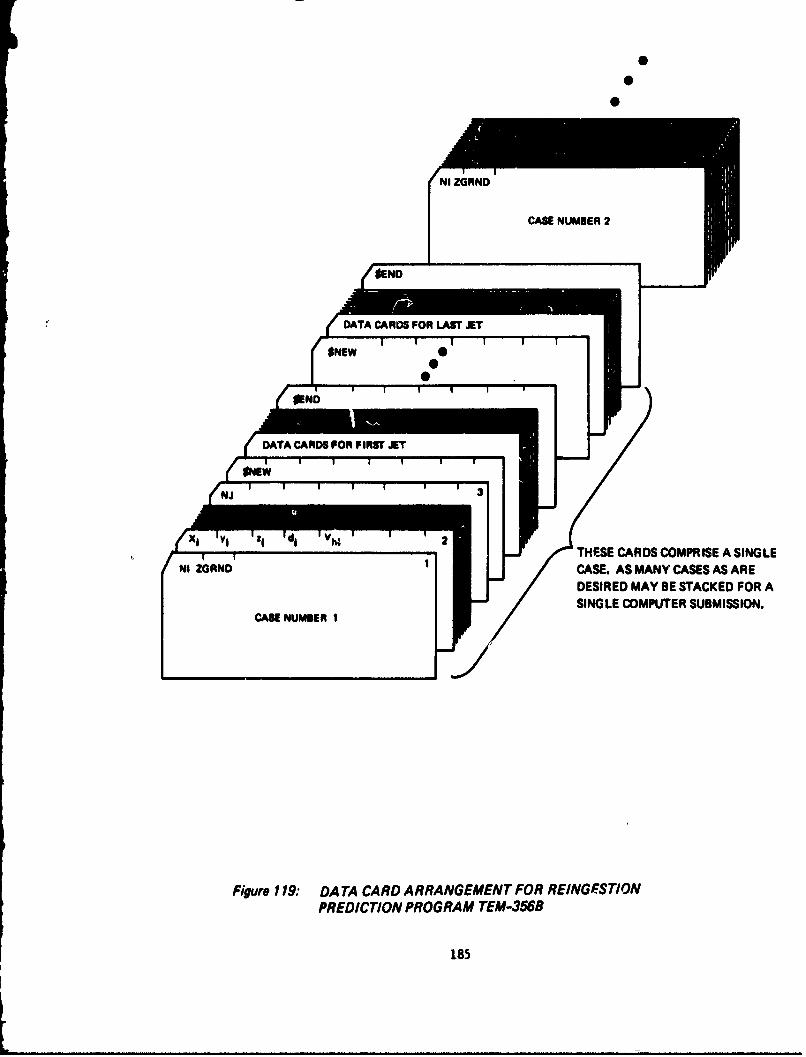
0
0
NI ZGRND
CASE NUMBER 2
$ENDAACARDS FOR LARST JET
'NI ;RND'THESE CARDS COMPRISE A SINGLE
N. ZANDCASE. AS MANY CASES AS ARE
DESIRED MAY BE STACKED FOR ACABENUMBR I - /SINGLE COMPUTER SUBMISSION.
Figure 179: DATA CARD ARRANGEMENT FOR REINGISTAONPREDICT/ON PROGRAM TEME3568
185
LJ
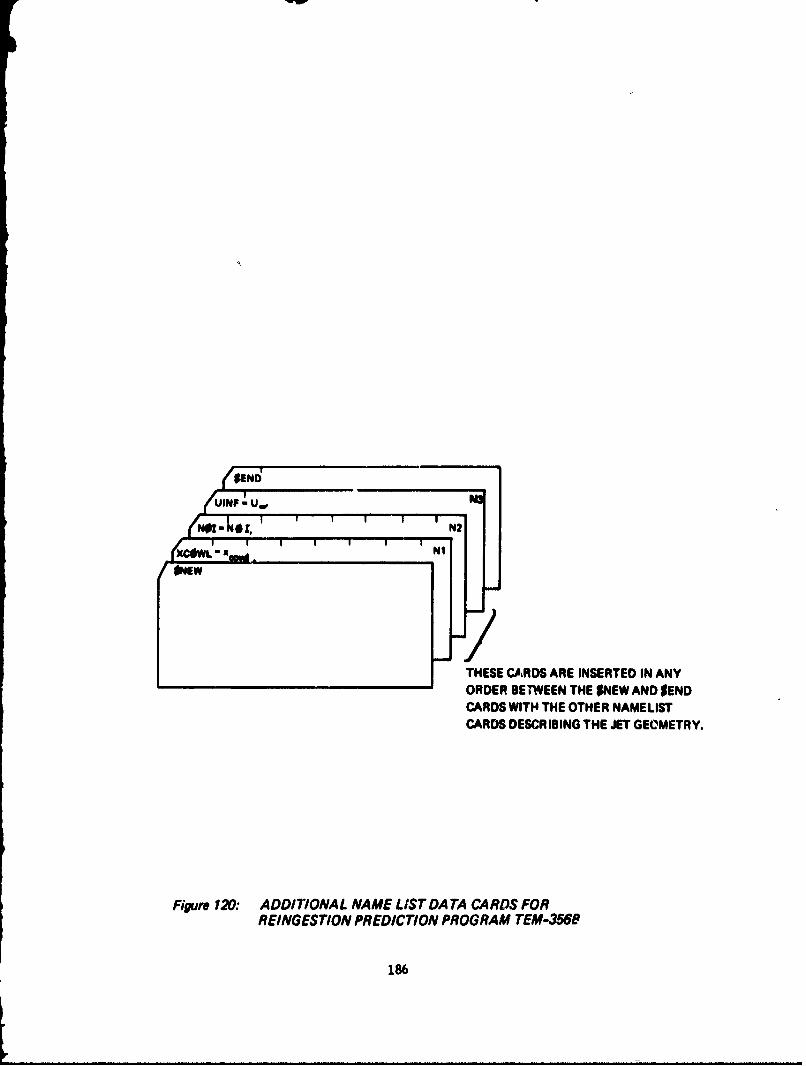
UINS" mSu.,
•N•-•IZ. I , , l J I N:-- -..•;WL" .,•'., ' ' ' ' 'N,
/ •Ew
ma
- /THESE CA•flDS ARE INSERTED IN ANYORDER BETWEEN THE •NEW AND tEND
CARDS WITH THE OTHER NAMELIST
CARDS DESCRIBING THE JET GEOMETRY.
Figure I20: ADDITIONAL NAME LtST DA TA CARDS FORREINGESTION PREDICTION PROGRAM TEM-3568
186
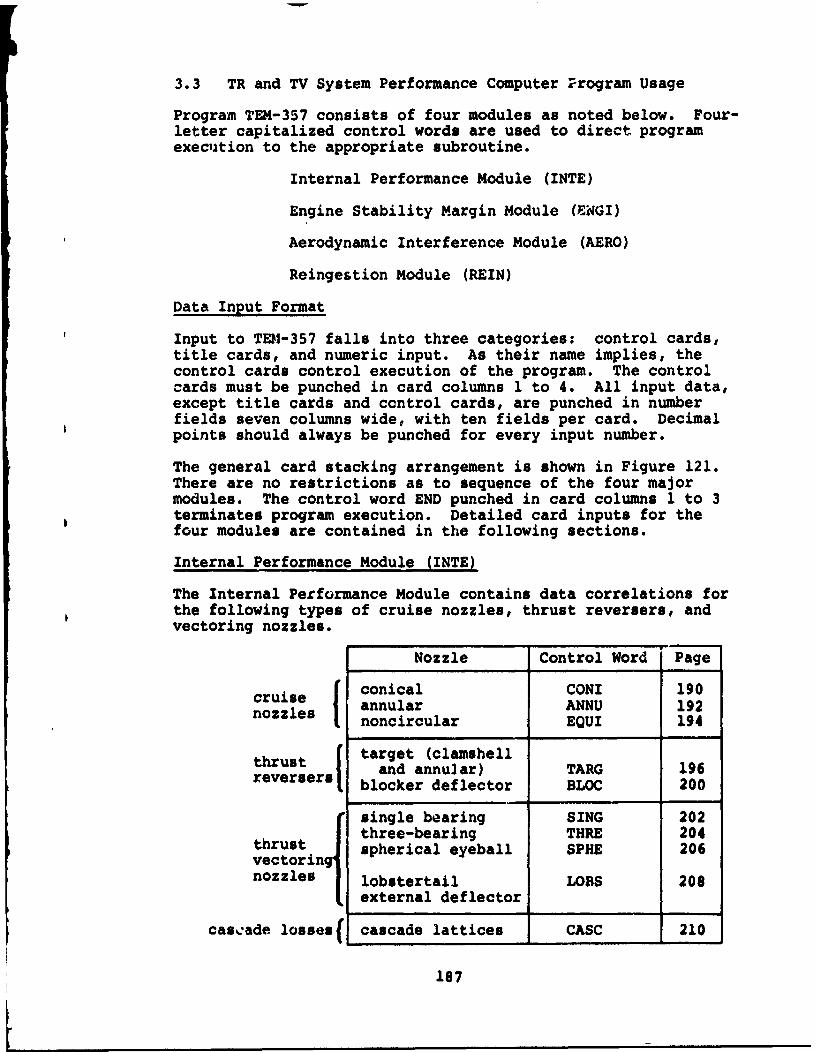
3.3 TR and TV System Performance Computer Program Usage
Program TEM-357 consists of four modules as noted below. Four-letter capitalized control words are used to direct programexecution to the appropriate subroutine.
Internal Performance Module (INTE)
Engine Stability Margin Module (ENGI)
Aerodynamic Interference Module (AERO)
Reingestion Module (REIN)
Data Input Format
Input to TEM-357 falls into three categories: control cards,title cards, and numeric input. As their name implies, thecontrol cards control execution of the program. The controlcards must be punched in card columns 1 to 4. All input data,except title cards and ccntrol cards, are punched in numberfields seven columns wide, with ten fields per card. Decimalpoints should always be punched for every input number.
The general card stacking arrangement is shown in Figure 121.There are no restrictions as to sequence of the four majormodules. The control word END punched in card columns 1 to 3terminates program execution. Detailed card inputs for thefour modules are contained in the following sections.
Internal Performance Module (INTE)
The Internal Performance Module contains data correlations forthe following types of cruise nozzles, thrust reversers, andvectoring nozzles.
Nozzle Control Word Page
c conical CONI 190cruises annular ANNU 192nozzles noncircular EQUI 194
thrust f target (clamshelland annular) TARG 196
reversers blocker deflector BLOC 200
single bearing SING 202three-bearing THRE 204
thrust spherical eyeball SPHE 206
nozzles lobstertail LOBS 208external deflector
cascade losses cascade lattices CASC 210
187

iw
(Blank)
1e

END
II
TITLE CARD
CASE
Figure 121: DATA CARD ARRANGEMENT FOR SEVERAL CASES, PROGRAM TEM-357
189

Detailed card inputs for each type of nozzle are describedon the pages noted in the foregoing table. Several of thesubroutines (CONI, ANNU, EQUI, SING, THRE, SPHE, LOBS) weremodified during Task 3.2 in order to make Reynolds numberscale corrections. The full scale Reynol.s number (calculatedat a reference nozzle pressure ratio of 1.5) is punched in theeighth field (card column 50-56) in the E format and musk beright adjusted. For exam.ple, a full scale Re of 10.4xl0Owould be punched as follows:
Card Columnii iA M
50 5 2 53 54 55 56v 1 0 . 4 E 6
The check mark (v) indicates a blank. Sample Case NumberTwo in Appendix II (page259) illustrates the scale correctioninputs and outputs.
C0NI Input
Figure 122 displays the data card arrangement for conicalcruise nozzles. A description of the card input follows.
Card Column Code Explanation
Card 1 1-4 C$NI Control card - contains theword C0NI
Card 2 1-7 LEVEL - 1. indicates "Level 1" per-formance predictions
a 2. indicates "Level 2" per-formance predictions
8-14 LR/L nozzle offset/duct length15-21 C internal wall angle at nozzle
trailing edge in degreesOmit o( if LEVEL - 1.
22-28 D1/D2 nozzle entrance/exit diameterOmit D1/D 2 if LEVEL -1.
50-56 Refe full scale Reynolds number at areference nozzle pressure ratioof 1.5. Punched in E Formatand right adjusted. See aboveexample.Omit if scale corrections are notdesired.
190
K,

C No
co"
Figure 122: DATA CAHD ARRANGEMENT FOR CONICAL CRUISE NOZZLES
191

ANNU Input
Figure 123 displays the data card arrangement for annularcruise nozzles. A description of the card input follows.
Card Column Code Explanation
Card 1 1-4 ANNU control card - contains the wordANNU
Card 2 1-7 LEVEL - 1. indicates "Level 1" per-formance predictions
- 2. indicates "Level 2" per-formance predictions
8-14 6R/L nozzle offset/duct length
15-21 O( internal wall angle at nozzletrailing edge in degrees. OmitO( if LEVEL -1.
22-28 AD/AE duct entrance/nozzle exit areaOmit A D/AE if LEVEL - i.
2P-35 R0 nozzle exit outer radius
36-42 R. nozzle exit inner radius50-56 Refe full scale Reynolds number at a
reference nozzle pressure ratio
of 1.5. Punched in E format andright adjusted. See example onpage 190. Omit if scale correctionsare not desired.
Card 3 1-7 N a number of pressure ratiosin Card Set 4. 1. a Ns 20.
CardSet 4 1-7 (PT/POO) nozzle pressure ratios at which
8-14 (PT/Po• ) 1 perform•,ice predictions are de-T.O 2 sired. There must be N of these
15-21 (PT/ PW )3 values, ten numbers per card.22-28 (PT/P•)4
29-35 (P /Po)5
36-42 (PT/Poe)43-49 (PT/Poo)6
50-56 (PT/POO)87
57-63 (PT/P. )9
64-70 (PT/POO )
192
4m *

LEVEL Ro R Ref 2
ANNU
Figure 123: DATA CARD ARRANGEMENT FOR ANNULAR CRUISE NOZZLES
193

EQUI Input
Figure 124 displays the data card arrangement for noncircularshaped cruise nozzles. A description of the card inputS~fol lows:
Card Column Code Explanation
Card 1 1-4 EQUI control card - contains theword EQUI
Card 2 1-7 LEVEL - 1. indicates "Level 1" per-formance predictions
= 2. indicates "Level 2" per-
formance predictions
8-14 6R/L nozzle offset/duct length
15-21 0( internal wall angle at nozzletrailing edge in degreesOmit O( if LEVEL = 1.
22-28 D1/D2 nozzle entrance/exit diameterOmit D1 /D 2 if LEVEL - 1.
53-60 Refs full scale Reynolds number ata reference nozzle pressure
ratic of 1.5. Punched in Eforr,,t and right adjusted. Seeexample on page 190. Omit ifscale corrections are not desired.
CardSet 4 1-7 (PT/Po2)1 nozzle pressure ratios at which
8-14 (P I )p performance predictions are de-T-1 '2 sired. There must be N of these
15-21 (PT/Poe)3 values, ten numbers per card.
22-28 (PT/POO)29-35 (P /P")4
36-42 (PT/P00) 643-49 (P T/POO) 750-56 (PT/PO ) a57-63 (P3T/P) 9
64-70 (PT/F,)1
194
Vi mmm
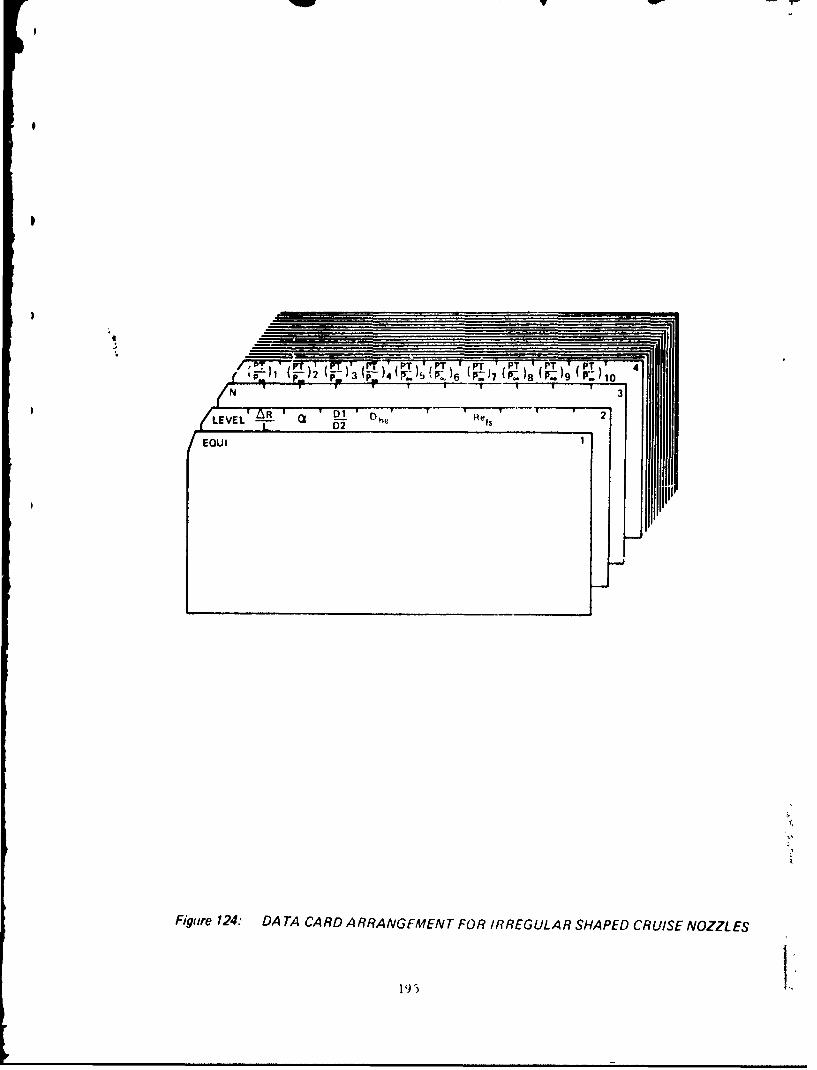
19 T 5 (I 6 P

TARG Input
Figures 125a and 125b display the data card arrangement forannular and clamshell target thrust reversers. A descriptionof the card input follows:
Card Column Code Explanation
Card 1 1-4 TARG control card - contains theword TARG
Card 2 1-7 TAR = 1. indicates clamshell targetthrust reverser
= 2. indicates annular targetreverser
Card 3A* 1-7 0 blockage angle in degrees,see Figure 23
8-14 9 door angle in degrees, seeFigure 23
15-21 C/H throat gap/annulus height, seeFigure 23
22-28 A r/Ac reverser exit area/cruisenozzle exit area
Card 3C** 1-7 L/D door length/nozzle exit diameter8-14 X/D setback distance/nozzle exit
diameter
15-21 LH/D average lip height/nozzle exitdiameter
22-28 ' sweep angle in degrees, see
Figure 13
29-35 e arc angle in degrees, see Figure 13
36-42 0 cone angle in degrees, seeFigure 13
43-49 bevel angle in degrees, seeFigure 13
Note: * Omit card 3A for clamshell target thrust reversers.S* Omit Card 3C for annular target thrust reversers.
196

Card Co !,•mn Code Explanation
Card 4 1-7 N = number of pressure ratios inCard Set 4. 1. E N i 20.
CardSet 5 1-7 (PT/PCýO) ~ nozzle pressure ratios at which
8-14 (PT /P performance predictions are de-PT/P ) 2 sired. There must be N of these
15-21 (PT/Poo)3 values, ten numbers per card.
S22-28 (P T/Poo)4
29-35 PT/PO)
36-42 (P T/Poo)643-49 (P T/Poo )7S750-56 (PT/P 0)
57-63 3 PS9
64-70 P T/Poo)
1-
197

R F
TARG 7
,
| a) ANNULAR TARGET THRUST REVERSER INPUTS
Q- N 2( ' ) 4' W ) 6 ' )8' ( )' )1'o
,• N I: I.. . . .
TAR
TARG i
B
b) CLAMSHELL TARGET THRUST REVERSER INPUTS
Figure 125: DATA CARD A RRANGEMENT FOR TARGET THRUST REVERSERS
Preceding page blank19 "
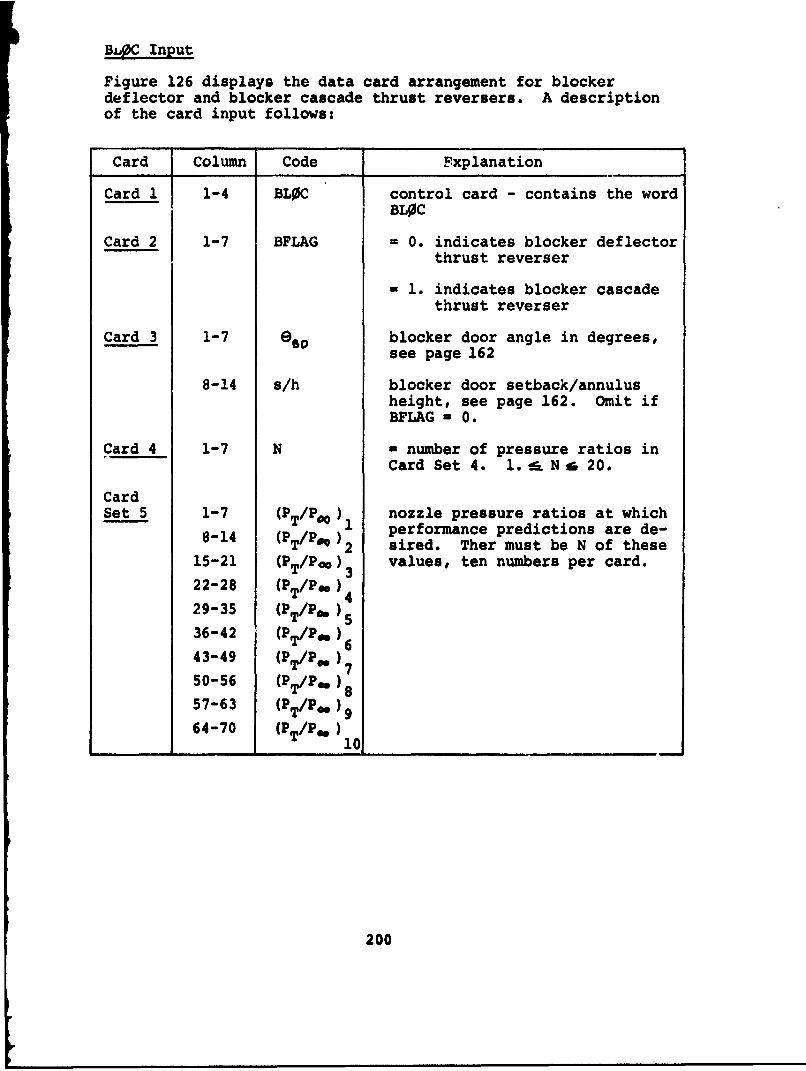
BL0C Input
Figure 126 displays the data card arrangement for blockerdeflector and blocker cascade thrust reversers. A descriptionof the card input follows:
Card Column Code Fxplanation
Card 1 1-4 BLOC control card - contains the wordBLOC
Card 2 1-7 BFLAG = 0. indicates blocker deflectorthrust reverser
= 1. indicates blocker cascadethrust reverser
Card 3 1-7 NO blocker door angle in degrees,see page 162
8-14 s/h blocker door setback/annulusheight, see page 162. Omit ifBFLAG - 0.
Card 4 1-7 N - number of pressure ratios inCard Set 4. 1. --.N 20.
CardSet 5 1-7 (P / l nozzle pressure ratios at which
8-14 (PT/P) performance predictions are de--4 T/ P 2 sired. Ther must be N of these
15-21 (PT/Poo) 3 values, ten numbers per card.22-28 (PT/P48)429-35 (P T/P)536-42 (PT/Pe) 643-49 (P T/Poo)7
50-56 (P T/P)857-63 (PT/Pe 964-70 (PT/Pe)
200
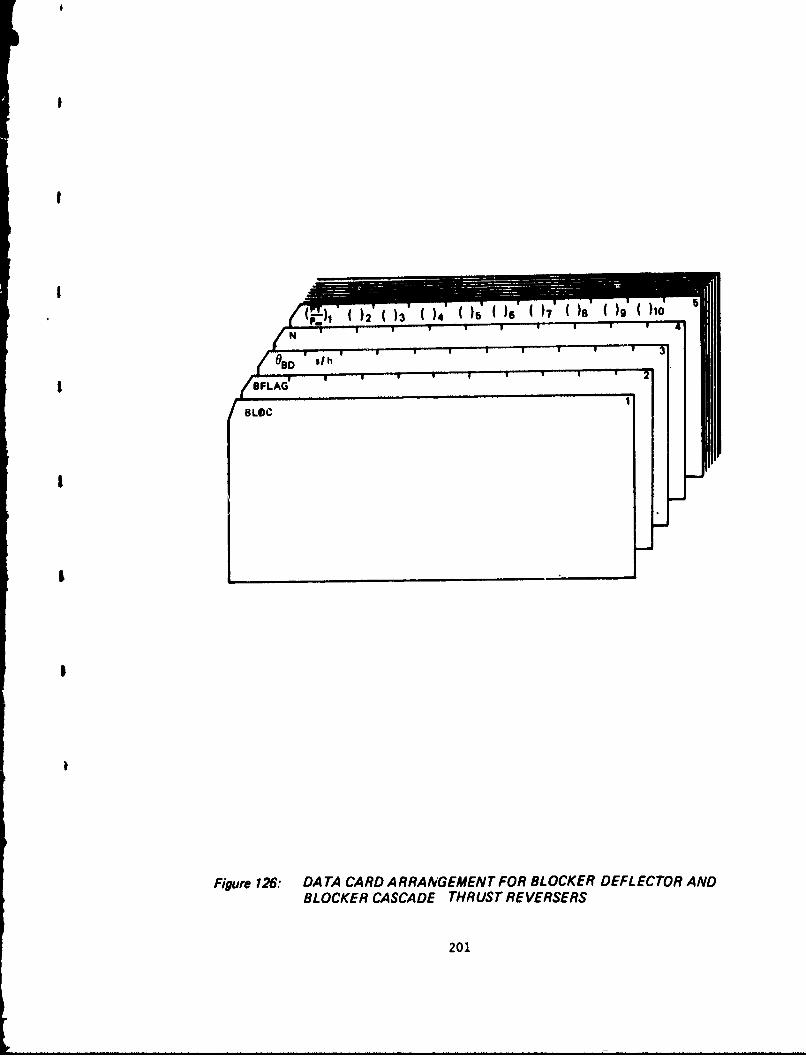
)1 0
BFLAGd
BLOC
Figure 126: DATA CARD ARRANGEMENT FOR BLOCKER DEFLECTOR ANDBLOCKER CASCADE THRUST REVERSERS
201

SING Input
Figure 127 displays the data card arrangement for singlebearing vectoring nozzles. A description of the card inputfollows:
Card Column Code { .xplanation
Card 1 1-4 SING control card - contains the wordSING
Card 2 1-7 0 bearing plane angle in degrees,see Figure 28
8-14 bearing duct angle in degrees,see Figure 28
15-21 bearing rotation angle indegrees, see Figure 28
22-28 it flow turning angle measuredfrom cruise nozzle centerlinein degrees. See page 42.Program automatically calculatesLrL if it is not input.
29-35 ZR/L nozzle offset/duct length
50-56 Refs full scale Reynolds number ata reference nozzle pressureratio at 1.5. Punched in Eformat and right adjusted asshown on page 190. Omit ifscale corrections are not desired.
Card 3 1-7 N= number of pressure ratiosin Card Set 4. 1. z. N A, 20.
CardSet 4 1-7 (PT/PO nozzle pressure ratios at which
8-T1 performance predictions are de-8-14 (P'T/P. 2 sired. There must be N of these15-21 (PT/PoO )3 values, ten numbers per card.
22-28 (PT/Po.)
29-35 (PT/Po.) 5
36-42 (PrT/P') 643-49 (P T/P00) 7
50-56 (PT/Po) 8
57-63 (PT /P)9
64-70 (PT/P O)
202

/. 3
SING
Figure 127" DATA CARD ARRANGEMENT FOR SfhiGLE BEARING NOZZLES
203

THRE Input
Figure 128 displays the data card arrangement for three bearingvectoring nozzles. A description of the card input follows:
Card Column Code Explanation
Card 1 1-4 THRE control card - contains the wordTHRE
Card 2 1-7 bearing plane angle in degrees,
see page 145
8-14 AD/AE duct entrance/nozzle exit area
15-21 (7 vector angle in degrees, seepage 145
22-28 A length of center section
29-35 L total nozzle length
36-42 D duct entrance diameter
50-56 Re I Lull scale Reynolds number ata reference nozzle pressureratio of 1.5. Punched in Eformat and right adjusted asshown on page 190. Omit if scalecorrections are not desired.
CardSet 4 1-7 (P /Poo) Inozzle pressure ratios at which
8-14 (P T/P) 1 performance predictions are de-T 2 sired. There must be N of these
15-21 (PT/Poo)3 values, ten numbers per card.
22-28 (PT/PC,) 4
29-35 (PT/P00 )5
36-42 (PT/P00) 643-49 (P T/PQ0)7 S750-56 (PT/Po) S857-63 (PT/P0a)
64-70 (PT/Pa)10
204

I,
(P ' )' ) ' )4 W )8' )9 4
t N3
WE A L D Refs2
THRE
Yn,'re 728. DATA CARD ARRANGEMENT FOR THREE BEARING NOZZLES
205

SPHE Input
Figure 129 displays the data card arrangement for sphericaleyeball vectoring nozzles. A description of the card inputfollows:
Card Column Code Explanation
Card 1 1-4 SPHE control card - contains the word
SPHE
Card 2 1-7 G mechanical vector angle in degrees
50-56 Refs full scale Reynolds number at areference nozzle pressure ratioof 1.5. Punched in E formatand right adjusted as shown onpage 190. Omit if scale correctionsare not desired.
Card 3 1-7 N number of pressure ratios inCard Set 4. 1. * N !!S 20.
CardSet 4 1-7 (nozzle pressure ratios at which
8-14 (PT/Po) 1 performance predictions are de-8-T/ 2 sired. There must be N of these2
15-21 (PT/Po )3 values, ten numbers per card.
22-28 (PT /P)4
29-35 (PT/P0) 5
36-42 (PT/P..)
43-49 (PT/P 00)
50-56 (P T/P.)8
57-63 (PT/Po.)
64-70 (PT/P .)
206

I,
Figure 129: DATA CARD ARRANGEMENT FOti SPHERICAL EYEBALL NOZZLES
207

LOBS Input
Figure 130 displays the data card arrangement for lobstertailor aft-hood deflector nozzles. A description of the card inputfollows:
Card Column Code Explanation
Card 1 1-4 LOBS control card - contains the wordLOBS
Card 2 1-7 9 mechanical vector angle indegrees
50-56 Refs full scale Reynolds number ata reference nozzle pressureratio of 1.5. Punched in Eformat and right adjusted asshown on page 190. Omit ifscale corrections are not de-sired.
Card 3 1-7 N = number of pressure ratiosin Card Set 4. 1. ! N - 20.
CardSet 4 1-7 1(PTiPOG) nozzle pressure ratios at which
8-14 ( ) performance predictions are de-! 2 sired. Theremust be N of these
15-21 (PT/P2O)3 values, ten numbers per card.
22-28 (PT/POO) 429-35 (PT/PO)
36-42 (PT/P.) 643-49 (PT/Pac) 750-56 (PT/P O) 8
57-63 (PT/PO) 9
64-70 (PT/P .)
208

/I
Am
Figure 130: DATA CARD A RRANGEMENT FOR LOBSTER TAILOR AFT-HOOD DEFLECTOR NOZZLES
209

EXTE Input
Figure 131 displays the data yard arrangement for externaldeflector nozzles. A description of the card input follows:
Card Column Code Explanation
Card 1 1-4 EXTE control card - contains the wordEXTE
Card 2 1-7 CFLAG = 0. indicates flat platedeflector
= 1. indicates curved deflector
= 2. indicates hinged externaldeflector
8-14 e mechanical vector angle in degrees.Omit if CFLAG = 2.
15-21 X/D hinged deflector setback dis-n/ tance/nozzle diameter in TV
mode, see page 266. Omit ifCFLAG = 0. or 1.
22-28 Dn/D nozzle diameter in TV mode/cruisenozzle diameter, see page 266.Omit if CFLAG = 0. or 1.
29-35 deflection anqle defined insketch on page 266. Omit ifCFLAG = 0. or 1.
Card 3 1-7 N = number of pressure ratios inCard Set 4. 1. i N S 20.
CardSet 4 1-7 (PT/Poo) nozzle pressure ratios at which
81-4 (PT/P)_ 1 performance predictions are de-T (T 2 sired. There must be N of these
15-21 (PT/Po )3 values, ten numbers per card.
22-28 (PT/Poo) 4
29-35 (PT/Poo) 5
36-42 (P2T/P)43-49 (P T/POI)7
50-56 (PT/PO.)
57-63 (PT/Poo)
63-70 (PT/P o)
210
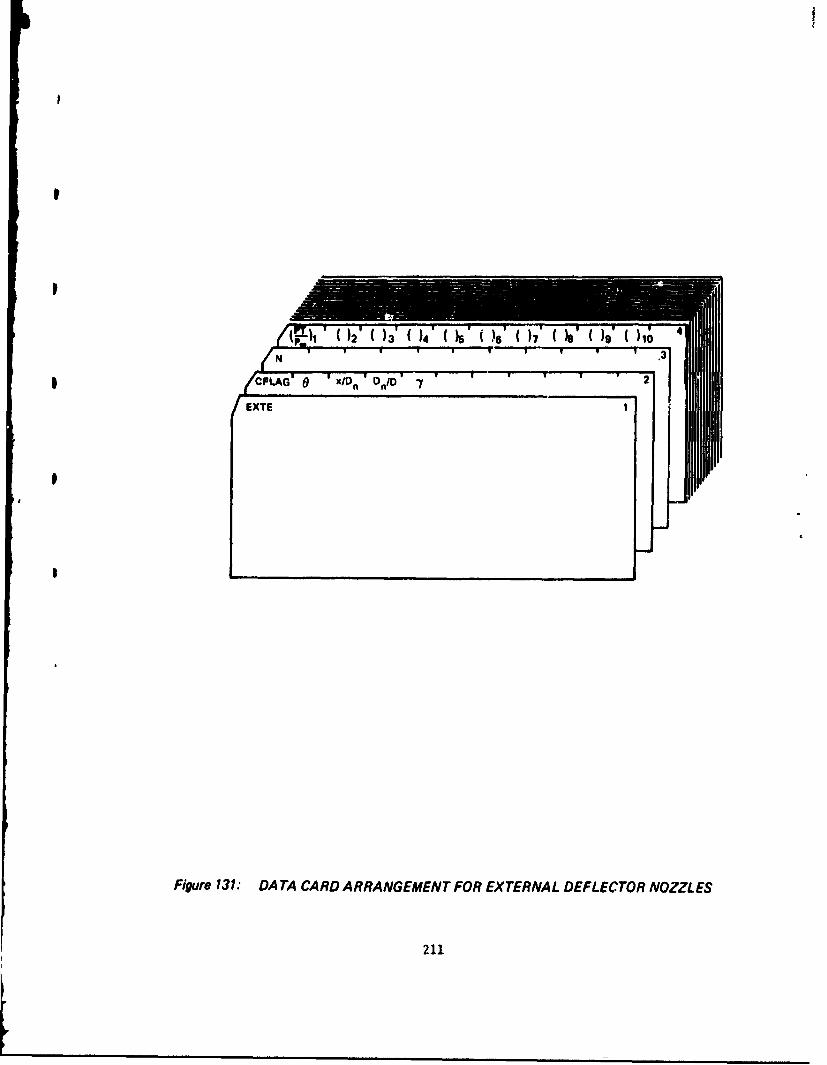
I
N~ 3
EXTEI
Figure 131: DATA CARD ARRANGEMENT FOR EXTERNAL DEFLECTOR NOZZLES
211
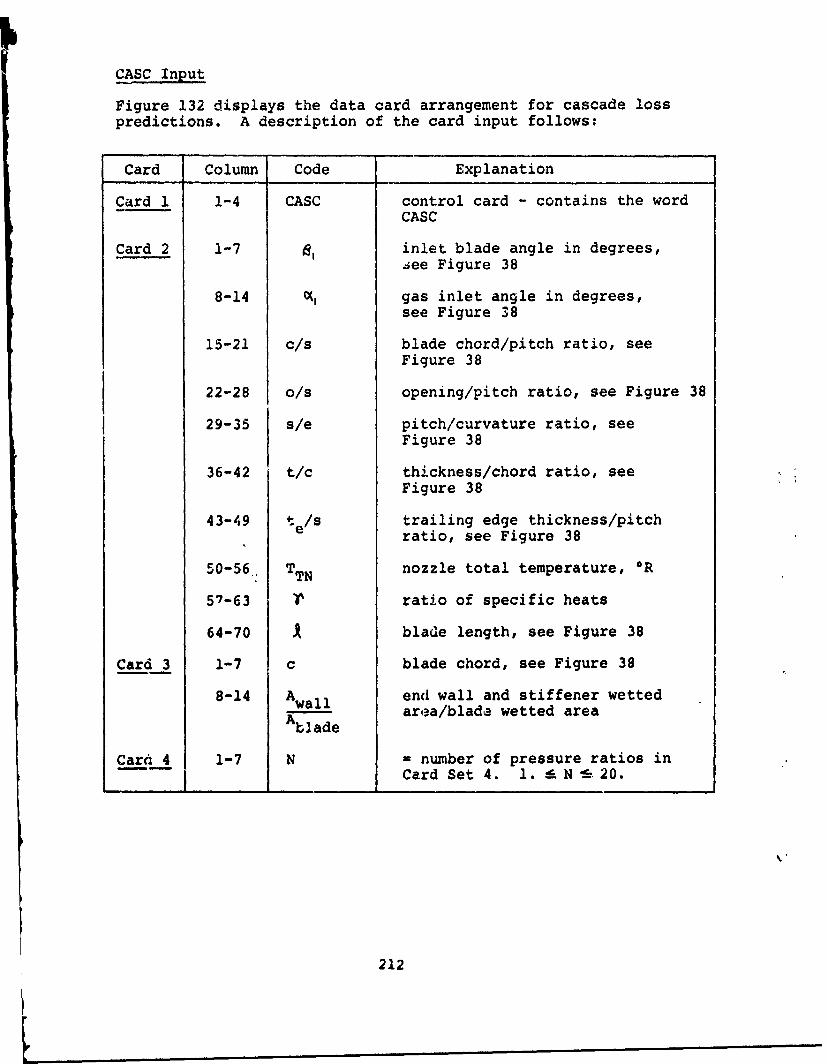
CASC Input
Figure 132 displays the data card arrangement for cascade losspredictions. A description of the card input follows:
Card Column Code Explanation
Card 1 1-4 CASC control card - contains the wordCASC
Card 2 1-7 B1 inlet blade angle in degrees,Lee Figure 38
8-14 0( gas inlet angle in degrees,see Figure 38
15-21 c/s blade chord/pitch ratio, seeFigure 38
22-28 o/s opening/pitch ratio, see Figure 38
29-35 s/e pitch/curvature ratio, seeFigure 38
36-42 t/c thickness/chord ratio, seeFigure 38
43-49 te/S trailing edge thickness/pitch
ratio, see Figure 38
50-56, TTN nozzle total temperature, *R
57-63 ratio of specific heats
64-70 A blade length, see Figure 38
Card 3 1-7 c blade chord, see Figure 38
8-14 Awall end wall and stiffener wetted
Ablade ariea/blade wetted area
Card 4 1-7 N - number of pressure ratios inCard Set 4. 1. E N S 20.
212
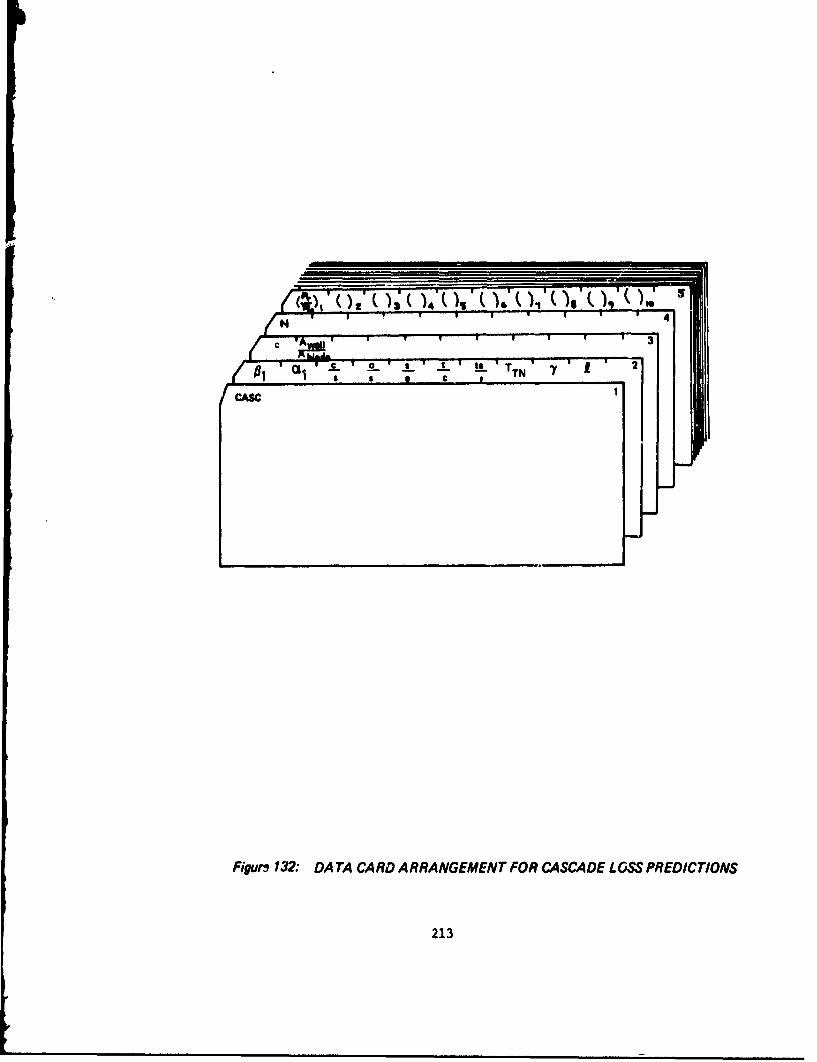
CASC
Figure 32: DATA CARD ARRANGEMENT FOR CASCADE LOSS PREDICTIONS
213

Engine Stability Margin Module (ENGI) Input
Figure 133 displays the data card arrangement for the EngineStability Margin Module. A description of the card inputfollows:
Card Column Code Explanation
Card 1 1-4 ENGI control card - contains the wordENGI
Card 2 1-7 BPR bypass ratio, 2. t BPR i 12.
8-14 TRMIX = 1. indicates mixed flow engine
= 2. indicates non-mi;ed flowengine
15-21 TRAN = -1. indicates engine decel
= •' indicates steady stateoperation
= +1. indicates engine accel
22-28 TTRAN time at which engine accel ordecel is initiated, seconds
29-35 POWER if TRAN = -1., percent enginepower level at end of enginedecel from 100 percent power
if TRAN = 0., percent steadystate power level
if TRAN = +1., percent engine powerlevel at start of engine accelto 100 percent power
Card 3 1-7 N number of times and area matchesto follow in Card Set 4.1. i N i 20.
214

SPR RMIX TRAN TTRAW POWER
ENGI
Figure 133: DATA CARD ARRANGEMENT FOR ENGINE STABILITY MARGIN MODULE
215

APPENDIX I
CHANG'S THEORY FOR THE ROLLUP OF A JLT IN CROSSFLOW
The complex potential for flow around a circular cylinderis given by
W (.)
where w = Uwl is the complex potential for uniform flow,and the second term is a doublet of strength Al= LlrUalocated at the origin with its axis in the -x direction, and"a" is the radius of the cylinder. The complex variablesw and z arc given by
w 0 - A'*(2)
:a= X + =r•
(3)
where y and p are the potential and stream functions. Thecomplex velocity field is given by
d_ tA -AV (4)de
From Equations 1 and 2 the complex potential w is separatedinto its real and imaginary parts g and .
rL"gr.+ t) case (5)
The velocity components are given by
vr,% U.(j - cae(7)
* 9 so IVA (8)
216

The circulation strength for a segment of the circle can bereplaced by a discrete vortex filament, as shown on thefollowing sketch:
AY
N N
The circulation is found by integrating the velocity vectoralong a path from point 1 to point 2.
(9)
S uL4(I+ )sing rde(10)
Integration of Equation 10 gives the vortex strength:
P 41rL~ Uo siii sin~(il~(1
Referring to the following sketch:
Ay.
217
217

the velocity components induced at a point (xp, yp) by a
vortex of strength r' at the point (xn, #y) are given by
P' Yp -Y' (12)L~j .3"0 1 r (X P -n) z+(VP Y,17t
C.O • -(13)
The deformation of the jet cross section, comprised of thevortex filaments, is found by assuming that the filamentsare free to move in space for a finite time period. Theirdirection of travel is in the direction of the velocity vectorinduced by all the other elements. Thus, the lateral dis-placement of each vortex filament is found by:
Ax =At EU (14)n
Ay At. vA i5)
where At is the time interval that is fixed by the jetvelocity and the distance chosen for steps between crosssections, As.
The procedure is similar for finding the deformation of across section other than circular, the difference being thestrength of the vortex filaments must be determined fromsome other source. The three-dimensionzal potential flowprogram TEA-230 (Ref. 7) was used to find the vortex strengthsfor TYPE = 2. rectangular jets. The effect of rectangleaspect ratio on the vortex filament strengths is shown inFigure Al.
Linear interpolation for vortex strengths at aspect ratiosother than a/b = 0.25, 1.0, and 4.0 was found inadequate.This was not unexpected because linear superposition ofsolutions is valid only if the geometry is fixed and flowconditions vary. However, an asymptotic equation for vortexstrength as a function of a/b nrovided an excellent fit tothe data at all intermediate values.
rc+ cC (16)0/b -C2
218

0.6
0.5
0.4
I1-
cnx
I-
o 0.2l1.0
0.1 4
0 10 20 30
VORTEX POSITION NUMBER 19 7
19 7-'--m 251 1 .a/b =1,"o
250 1.-s-25 a/b =0.25
Um 19 7
-- 251 Z/b -4 11
Figure Al: EFFECT OF RECTANGLE ASPECT RATIO ON VORTEX STRENGTH
219

where the constants C1 , C2 , and C3 are solved for by satisfyingequation (16) at a/b = 0.25, 1.0 and 4.0.
C (17)[OAS - C1 i-C• ]
0.25-4K (18)
I-
cO.2 .CZ (19)
where
Zr.o - r4.oK• O.2.S%z, r,.. (20)
The flow direction relative to the cross section has an importanteffect for rectangular-shaped sections. The effect of winddirection is shown in Figure A2. Solutions for any winddirection can be obtained by linearly combining solutions for0 and 90 degrees because the geometry is fixed.
r o ۥ 9""" (21)
The vortex strengths for a/b = 0.25, 1.0, and 4.0 at relativewind directions of 0 and 90 degrees are tabulated in subroutineRCROSS. Vortex strengths for a particular case are found byasymptotic interpolation (equations 16-20) to account forrectangle aspect ratio and by Equation 21 to account forrelative wind direction.
220

000
03%
m Q
LL Q1N~L
221
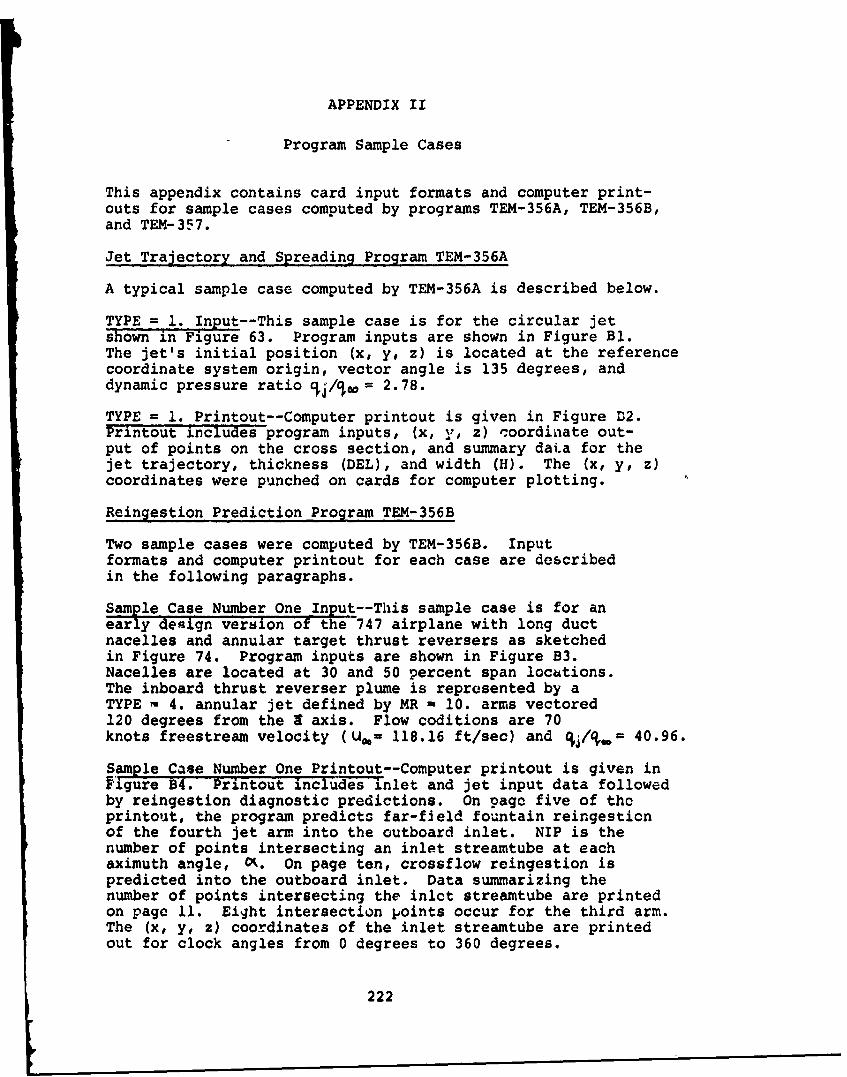
APPENDIX II
Program Sample Cases
This appendix contains card input formats and computer print-outs for sample cases computed by programs TEM-356A, TEM-356B,and TEM-357.
Jet Trajectory and Spreading Program TEM-356A
A typical sample case computed by TEM-356A is described below.
TYPE = 1. Input--This sample case is for the circular jetshown in Figure 63. Program inputs are shown in Figure B1.The jet's initial position (x, y, z) is located at the referencecoordinate system origin, vector angle is 135 degrees, anddynamic pressure ratio %/w = 2.78.
TYPE = 1. Printout--Computer printout is given in Figure D2.Printout includes program inputs, (x, y, z) -.oordinate out-put of points on the cross section, and summary data for thejet trajectory, thickness (DEL), and width (H). The (x, y, z)coordinates were punched on cards for computer plotting.
Reingestion Prediction Program TEM-356B
Two sample cases were computed by TEM-356B. Inputformats and computer printout for each case are describedin the following paragraphs.
Sample Case Number One Input--This sample case is for anearly eReign version of the 747 airplane with long ductnacelles and annular target thrust reversers as sketchedin Figure 74. Program inputs are shown in Figure B3.Nacelles are located at 30 and 50 percent span locations.The inboard thrust reverser plume is represented by aTYPE - 4. annular jet defined by MR = 10. arms vectored120 degrees from the I axis. Flow coditions are 70knots freestream velocity ( U0= 118.16 ft/sec) and %/•.= 40.96.
Sample Case Number One Printout--Computer printout is given inFigure B4. Printout includes inlet and jet input data followedby reingestion diagnostic predictions. On pagc five of thcprintout, the program predicts far-field fountain reingestionof the fourth jet arm into the outboard inlet. NIP is thenumber of points intersecting an inlet streamtube at eachaximuth angle, M. On page ten, crossflow reingestion ispredicted into the outboard inlet. Data summarizing thenumber of points intersecting the inlct streamtube are printedon page 11. Eight intersection points occur for the third arm.The (x, y, z) coordinates of the inlet streamtube are printedout for clock angles from 0 degrees to 360 degrees.
222
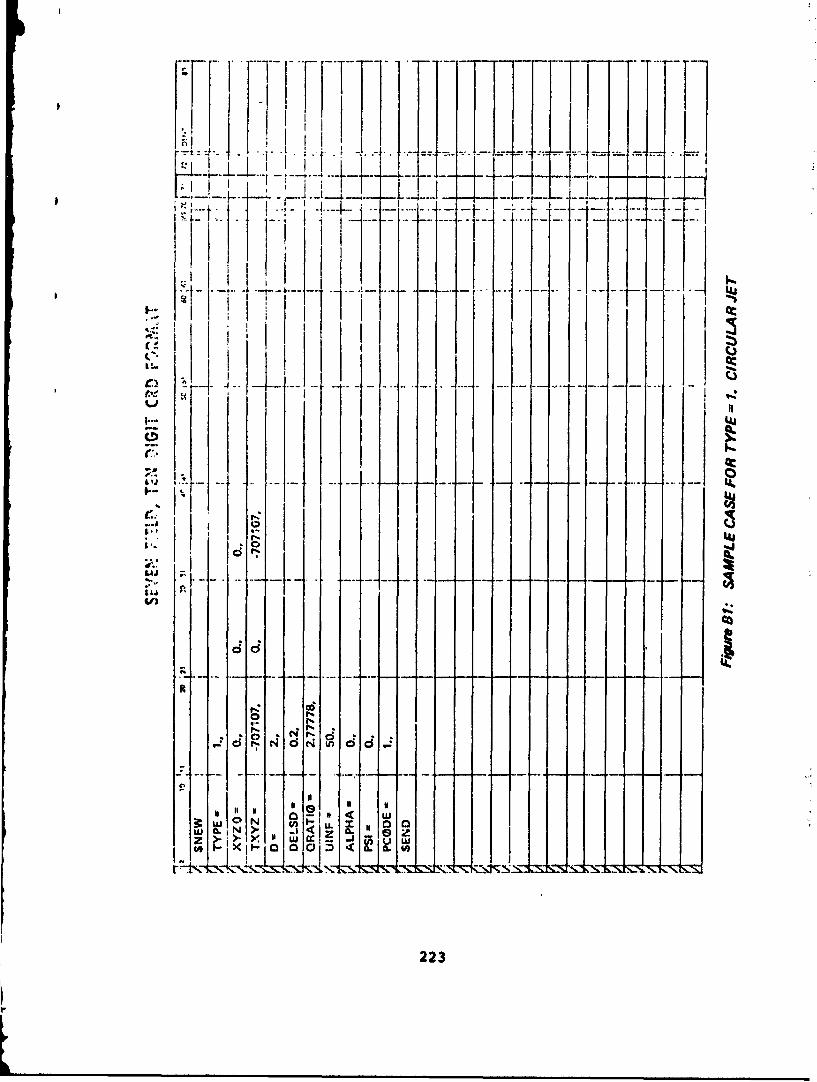
r 4L
44 x
*1 I -- I - -
LL .;7223
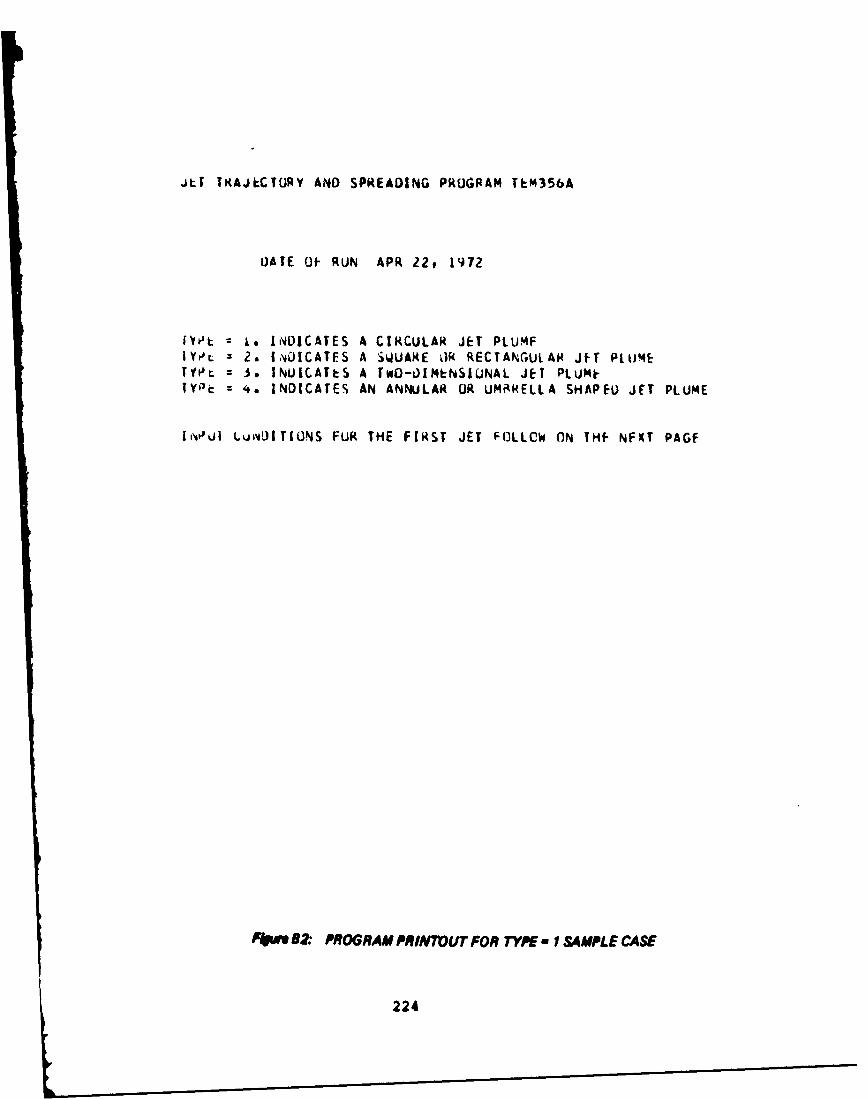
JLi TKAJLCTORY AND SPREADING PROGRAM TtM356A
UATE Of- RUN APR 22t 1972
IYv = .to IDICATES A CIRCULAIR JET PLUMFIY-'L z 2. IVOICATES A $•UARE ORi RECTANGULAH JET PIU!METYPL - ]3. INUICATtS A TWO-,IMENSIUNAL JET PLUMI-
WYk'i z. INDICATES AN ANNULAR (JR UMAWELLA SHAPEU JET PLUME
iNOi LUN,,OITIONS FUR THE FIRST JET FOLLOW ON THf- NFXT PAGE
A" B2: PROGRAM PRINTOUT FOR TYPE -I SAMPLE CASE
224
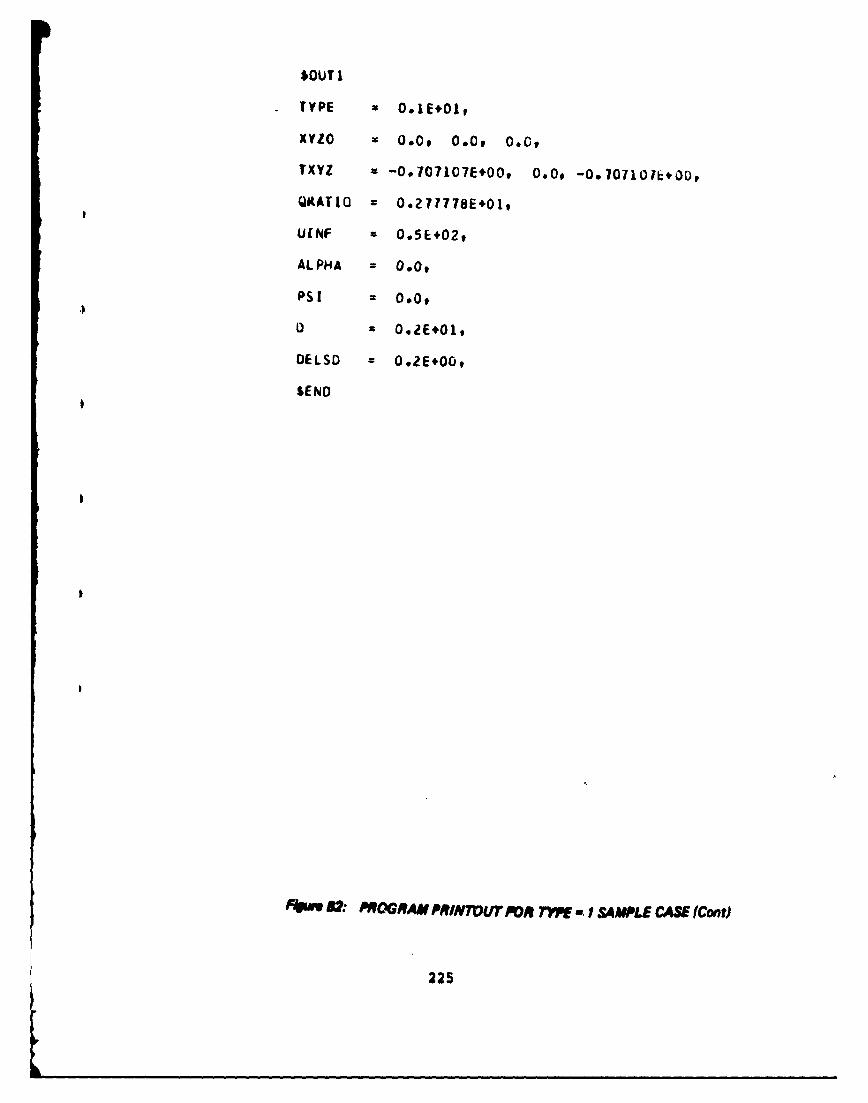
$outI1
TYPE O O~IE+01
XYIO 0.0, 0.0, 0.0,
TXYZ -0*707107E.00, 0.0, -00.1O1L+OUP00
KAT 10 0*271778E+01,
U[NF 0.5E+029
ALPHA =0.0,
PSI 0.0,
0 0.2E+01,
DELSO = Oo2E*00,
SE ND
5~ 2: PROGRAm Ptrif PINOn FRm -W f £44 PIE CASE MCont)
225
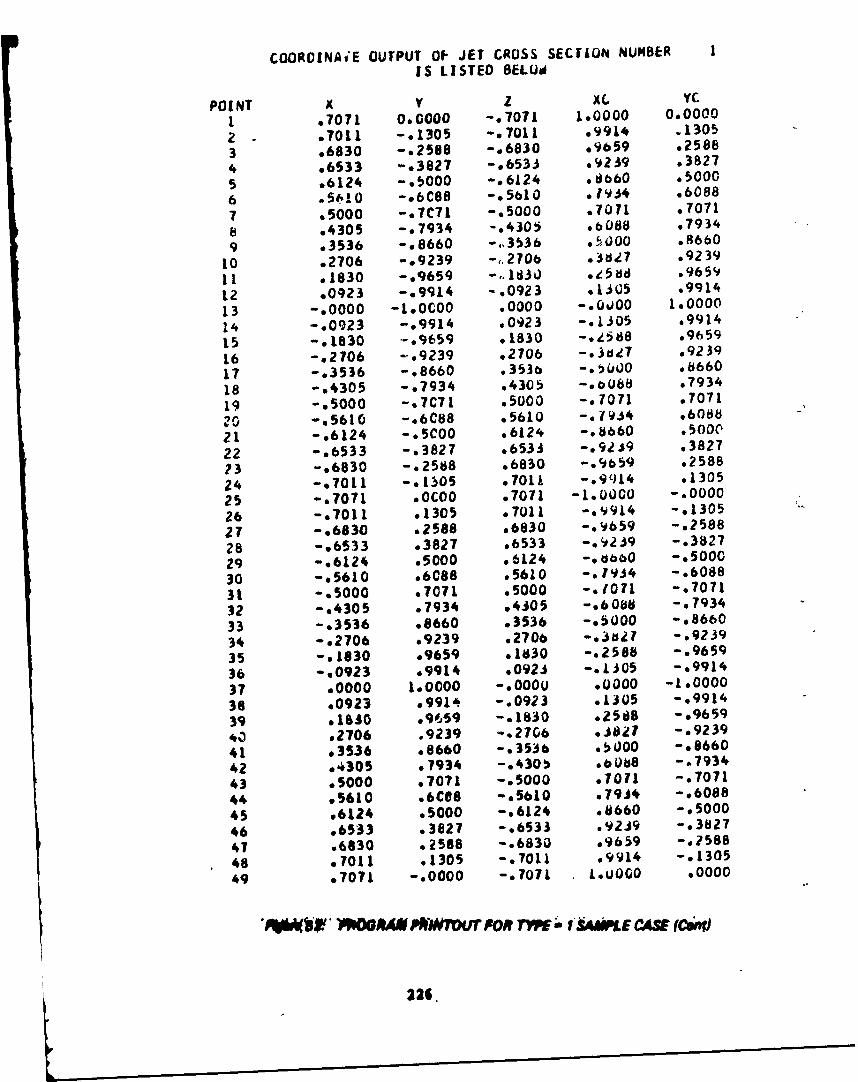
COOROINAiE OUTPUT 01f JET CROSS SECTION NUMBER I
IS LISTED BELUO
POINT x y z CL YC
1 .7071 0.0000 -. 70T1 1.0000 0.0000
2 .7011 -. 1305 -o7011 .9914 .1305
3 .6830 -. 2588 -. 6830 09659 .2588
4 o6533 -. 3827 -. 6533 .92.!39 .3827
5 .6124 -. 5000 -,6124 ,db60 .5000
6 .shiO -s6C88 -.5610 *19A4 .6088
7 .5000 -. 7C71 -. 5000 .7071 .7071
8 .4305 -. 7934 -. 4305 ,6088 .7934
9 .3536 -. 8660 -,,3536 .5000 .8660
10 .2706 -. 9239 -,,2706 .3de7 .9239
11 s1830 -. 9659 -,. ld30 ,.5dd .9659
12 .0923 -. 9914 -. 0923 .*3.05 .9q14
13 -. 0000 -1,OCOO .0000 -. 0.100 1.0000
14 -. 0923 -. 9914 .0923 -01305 o9914
15 -,1830 -. 9659 .1830 -1,488 .9659
16 -. 2706 -. 9239 .2706 -. 3de? .9239
17 -93536 -. 8660 .353c -,5uOO .8660
18 -. 4305 -. 7934 .4305 -. oU0b .7934
19 -. 5000 -. 7C71 .5000 -. 7071 .7071
20 -. 5610 -. 6C88 .5610 -. 14 .6088-
21 -. 6124 -s5000 .6124 -. 8660 5o0o(
22 -. 6533 -. 3827 .6533 -. 92.9 .3827
73 -. 6830 -. 2588 .6830 -.9b59 .2588
24 -07011 -. 1.05 .?01L -,9914 91305
25 -. T701 .OCOO .7071 -1.OOO0 -. 0000
26 -T011 .1305 .7011 -. 9914 -. 1305
27 -. 6830 .2588 .6830 -. 9659 -. 2588
28 -. 6533 .3827 .6533 -.9239 -. 3827
29 -. 6124 .5000 o6124 -. oabO -. 5000
30 -,5610 96C88 .5610 -. I934 -,6088
3t -. 5000 .7011 .5000 -. 1071 -. 7071
32 -. 4305 .7934 .4305 -. 6068 -. 7934
33 -°3536 .8660 .3536 -. 5000 -,8660
34 .2706 .9239 .2706 -.03127 -. 9239
35 :.1830 .9659 .1830 -,2588 -. 9659
36 .0923 .9914 .092-1 -. 1305 -. 9914
37 .0000 1.0000 -. 0000 .0000 -1.0000
38 .0923 .991. -. 0923 .O305 -. 9914
39 ,1830 09659 -. 1830 ,25d8 -,9659
.0 o2706 .9239 -. 2706 .J817 -,9239
41 o3536 .8660 -. 3536 .5000 -o8660
42 o4.305 .7934 -. 430! .o6Ut8 -. 7934
43 .5000 .7071 -. 5000 .7011 -. 7071
44 95610 .6CO8 -. 5610 .79J4 -,6088
45 ,6124 ,5000 -. 6124 .8660 -. 5000
46 ,6533 .3827 -. 6533 .92J9 -. 3827
47 .6830 Z2568 -e6830 .9659 -. 2588
48 .7011 ,1305 -07011 o9914 -. 1305
49 .7071 -. 0000 -.7071 L.uOGO .0000
SWSOG Wivur FOR TM PE a4Ws (Csi,
226.

IS LISTED BELchs-.-
POINT x y Ixc YC1 .4307 .0000 -9060 .8375 .000002. .4265 -.1122 -09b09 0831b .11003 04140 -.2236 -996b6 .8141 .21914 *3930 -.3332 -o9479 *7U46 93265)5 o3635 -.4400 -*9i84 .7433 .43126 .3254 -.5429 -.881.4 .6bV8 .53207 *2786 -.6406 --835J~ .od'e1 .62768 02232 -.7313 -07008 9 ý463 0716b9 .1593 -eb136 --.i17O e156 .797210 0874 -.8856 -.6472 O..5 o8677ii 0081 --9453 -*562 o,941#6 .926212 -.0777 -49909 -.4d48 91,443 9013 -*1688 -1.0206 -.3951 -.0045 1..000014 -.2637 -1.C329 -e.3017 -.. o 1.0120i5 -.3608 -1.0264 -02061 -.2730 1.005716 -.4581 -1.0003 -.1104 -.4095 .980117 -95535 -.9541 -S0L65 -o4j .9349is -.6447 -*Baal .0732 -06712 .870119 --?294 -.8028 .16)66 -.7901 1620-.8056 -.6997 .2315 -. 840O .685571-.8710 -.5806 .2954 -.9dad .568822-.9240 - e44?9 e 34bL -1.uol e4389423 -o9630 -e3C47 e3864 -1.117s .29b624 -.9868 -01542 *4099~ -1.1513 .151125 -.9949 .0000 .0417d -1.1625 -.0000026 -09868 .1542 *40VI -jLj,1,3 -.11511C27 -.9630 *3047 .1d64 -111±70 -,.2986-. _924#0 .4479 *34bL -1.ubij -.438929 -.8110 e5806 .2959 -09tsb -*568830 -.8056 .6997 *231to -06910 -o685531 -.7294 .8028 *15601, -.7901 -.7866a32 -.b6447 08681 .07j2 -.o712 .08?01J3_S3 9541 -.0iL65 --5433 _*934934 -04581 1.0003 -.1104 -.4095 -.98013 AIb 1,0264 -*2061 -*2730 ::05
37-1688 1.0206 -.3951 -&0035 -1.000c36 -.60777 .9909 -.4048 .1243 -.970939 *0081 *9453 -*5692 .2ý446 -9640 00874 488S6 -*6472 .3659 -*867?41 *1593 .8136 -.7179 *46 .797242 oiC32 .7313 _6760d *5463 _e716643 .Z788 .6406 -.835 .6241 -.627644 .3254 .5429 -.8814 e6898 -*53?0(45 *3635 .4400 -.91b9 *7433 -.431246 .3930 .3332 -091079 67646 -.326547 041D .d406 -.,9686 .8141 -.219148 .4265 e1122 -.9809 *8416 -.310049 .4301 -.0000 -09850 0631s .00000
Abw# 2.- AVWOGAa,' A/#NrrjJ WO I~ SAWLE CASE MCont)
227 I
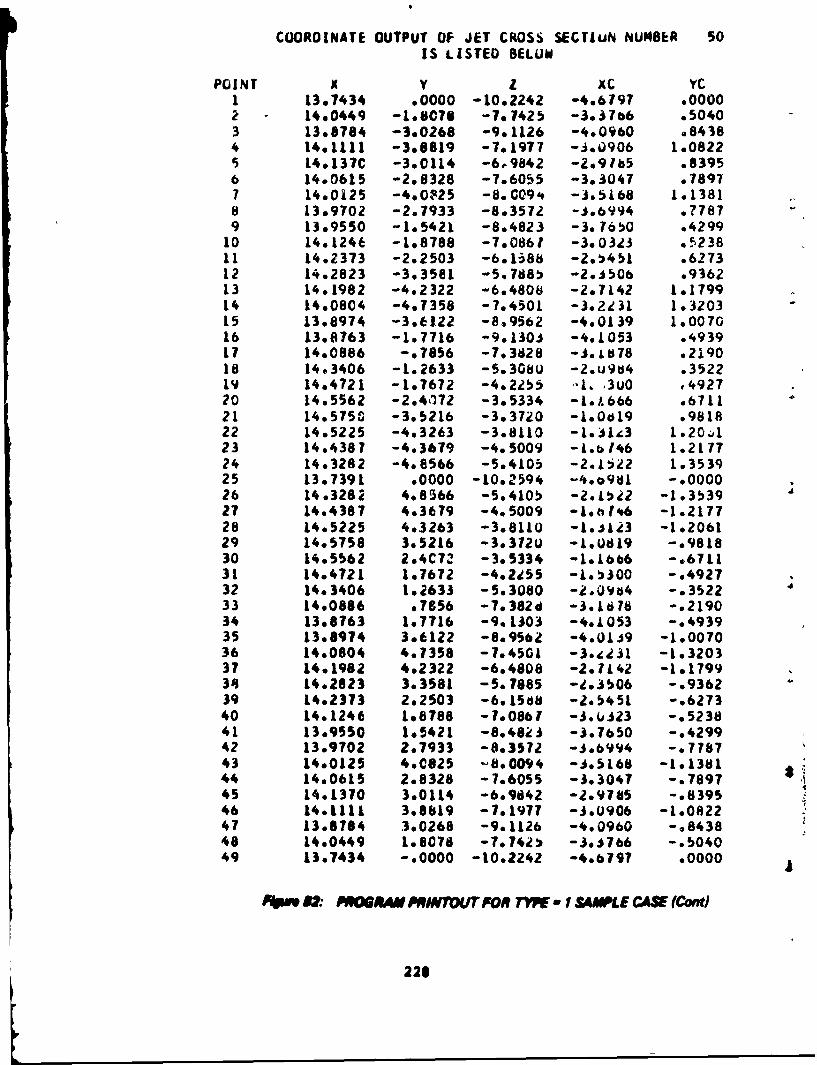
COORDINATE OUTPUT OF JET CROSS SECTIuN NUMBER 50IS LISTED BELUW
POINT x y zxC YC1 1397434 .0000 -10.2242 -4.6797 .000002 - 1440449 -1.807S -7.7425 -3o37b6 .50403 13.8784 -3.0268 -9.1126 -4.0960 s84384 1491111 -3.6819 -7.1971 -.,.0906 l.08225 14.13?C -390114 -6,9842 -2.9165 .83956 14,0615 -2.8328 -7o6055 -3.3047 .18917 1441i25 -490$25 -8.0094 -3o5168 1.1381a 13.9702 -2.7933 -8o3572 -.3.6994 .77879 1309550 -1.5421 -8.4823 -3. 7650 .4299
10 14*1246 -198788 -7.0861 -3eO323 .5~23811 14.2373 -2.2503 -6o1388 -20o451 .627312 14.2823 -3.35e1 -5.7885 -2.3506 .936213 14*1982 -4o2322 -6.4808 -2.7142 1.179914 14*0804 -4.7358 -7.4501 -3o.2,e31 1.320315 13.8974 -3.6122 -8.9562 -490139 1.007016 13.8763 -1.7716 -9.1304 -4.1053 .493917 14.0806 -97856 -703828 -3.Lb78 .219018 14.3406 -1.2633 -5.3080 -2,u964 .352219 14.4721 -1.7672 -492255 --L. 300 e492720 14.5562 -2*44172 -3.5334 -1.1666 .671121 14o5?5u6 -3.5216 -3.3720 -1.0019 .981822 14.5225 -4o3263 -3.8110 -L.$i1.3 1.20.423 14.4387 -4.3679 -4.5009 -L.bP146 1.217724 14.3282 -4o8566 -5.4105 -2.1ti22 1.353925 13.7391 .0000 -1.0.2594 -4009d1 -.0000026 14.3282 4.8566 -5.4105) -2.0152 -1.353927 14.4387 4.3679 -4,.5009 -1.b7f46 -1.217728 14.5225 4.3263 -3.8110 -Los1i3 -1.206129 14.5758 3.,5216 -3.3720 -1o0819 -.981830 14.5562 2o4CZ -3.5334 -1.1666 -o671131 14.4721 1.7672 -4.2d55 -L*5300 -o492732 14.3406 1.2633 -5.3080 -2.0vo4 -.352233 14.0666 .7856 -79.382 d -3.1878 -0219034 13.8763 1.7716 -9. 1303 -4.1053 -.493935 13.8974 3.6122 -8.9562 -4.01.0 -1.007036 14.0804 4.7358 -7.4501 -3.4.231 -1.320337 14.1982 4.2322 -6.4808 -2.7142 -1017993414.2823 3.3581 -5.7885 -99.3506 -.9362
39 14.2373 2.2503 -6o15ob -2.5451 -.627340 14.1246 1.8786 -7.0867 -J*k.L323 -.523841 13.9550 1.5421 -894821 -3.1650 -.429942 13.9702 2.7933 -8.3572 -.3.6994 -.718743 14.0125 4*0825 -8*0094 -3.5168 -1.138144 14.0615 2e8326 -7.6055 -3.3047 -.789745 14.1370 3.0114 -6.9842 -2.9785 -.839546 14.1111 3.8819 -7.1977 -3.0906 -1.082247 13.8784 3.0268 -9.1126 -4.0960 -o843846 1490449 1.8C78 774 -3.3766 -.504049 13.7434 -. 0000 -10.2242 -4.6797 .00000
5fm2.' PWAM PWINTOUT POR TYPE -1 SAMPLE CASE (Cont)
228

SUMMARY CF JET CENTLRL|N: ANO SPREADING COEFFICIENT UATA
CROSS
SECTILN S/C X/D ZID Er 'YT IT DEL H1 0.0000 0.0000 OO00u 0.0000 0.0000 0.0000 2.0000 2.00002 .2000 -. 1410 .1418 -.2621 0.0000 .2821 2.0000 2.06583 .4000 -02797 .2859 -. 55•4 0.0000 .5594 2.0000 2.13154 .6000 -. 4131 .4349 -.u8262 0.0000 .8262 2.0000 2.19735 .8000 -. 5369 .5919 -1.0739 0.0000 1.0739 2.0000 2.26316 1.0000 -. ,440 .?(0o -L.ol81 0.0000 1.2861 2.0COOO 2.32887 1.2000 -. 1213 .944? -1.4426 0.0000 1.4426 2.0000 2.39468 1.4000 -. 74?4 1.1421 -1.4947 000000 1.4947 2.0000 2.46049 1.6000 -. 7040 1.3363 -1,4081 0.0000 1,4081 2.0000 2.526110 1.8000 -. 6005 1.506o -160olo 0.0000 1.2010 '2.0000 2.591911 2.0000 -.4607 1,6492 -09213 0.0000 .9213 2.0000 20657712 2.2000 -e3012 1.1691 -. 6023 0.0000 .6023 2.0000 2.723413 2.4000 -. 130! 1.8736 -.1610 0.0000 .2610 2.0000 2.78V14 2.6COC ,C471 1.9bio WVu41 0.000a -e0941 2.1873 3,062215 2.800C .2x92 2.04b6 .,05a3 O.OOOC -. 450S 2.4174 3.384416 3.0000 .4144 2.123d .Dd9 0.0000 -. 8289 2.6534 3.714717 3.2000 ,Czo 2*.L1v2 1.2u40 0.0000 -1.2043 2.949 4.052918 3,4000 .7.13 2.2570 1.5d27 0.003C -1.527 ? .t41 4,3986IQ 3.60O0C 9P20 2,Jlov 1.li40 0.0000 -1.9640 3.3939 4.7514
ZC J.dOOC 1.1738 2.374c 2.,*45 0.0000 -2.3475 3o6506 5.111121 4.0000 1,3664 2,42b5 2.7$tv 0.0000 -2*73?8 3o9126 5.477722 4.2000 1.559d 2,4795 3.1196 0.O00C -3.1196 4.1790 3.85(b~23 4.4000 1.7M38 2.5262 J.0U75 0.0000 -3.S075 4,4499 6.729824 4.6000 1.9o83 i.574e 3.*965 0.0000 -3.8965 4.7251 6.615125 4.8000 2.1432 2.6195 4.2s64 0.0000 -#.2864 5.0045 7.006326 5,00CO 2.3385 2,6625 4.0711 0.0000 -4.6711 52880 7.403327 5.20CC 2.5342 2.7039 So,0664 0.0000 -5.0684 5.5756 7.0562b 5,40C0 2.7302 2.7439 $.4&03 0.0000 -5.4603 5.6992 7,v-78929 5.60C0 2.9264 2.7826 :1.052U 0.0000 -5.8528 5.1680 A,075330 5.8000 3.1226 2o.201 6.2,*7 0.0000 -6.2457 5.835? 8.169331 6.0000 393195 2.85ob o.63s0 0.0000 -6.6390 5.9009 8.261232 6.2000 3.5163 2.891v yoj7? G.0000 -7.0327 5e9651 8.351133 6.4000 3.7134 2.9261 1.4267 0.0000 -7.4267 6.0279 8.439134 6.6000 3,9105 2.9$'.d 7.o1 0,0000 -7.8211 640694 8.525235 6.8000 4,1C8 2.9995 *.o157 0.0000 -862157 6.1497 8.609636 7.0000 4.3053 3.0243 *,.106 0.0000 -8.6106 6.2088 8.692337 1,2000 4.5S29 3.05S$ 1.0057 0.0000 -9.005? 6.2668 6.773536 7.4000 4.1005 3.05VV 9.4010 040000 -9.4010 6.3237 8.853239 7.600C 4.8983 3.1151 9.7966 0.0000 -9.1966 6.3796 8.931540 7.8000 5.0962 3.1440 10.19V3 0.0000 -10.1923 6.4345 9.008441 8.0000 5.2441 3.1134 10.5682 0.0000 -10.5882 6.4885 9.083942 8.2000 5.4921 3.2014 10.9843 0.0000 -10.9843 6.5416 9.158343 8.4000 5.6402 3.228d 11.0i5(i 0.0000 -11.3605 6.5938 9.231444 8.60CO 5.5664 3.2S51 11,7169 0.0000 -11.7769 6.64S2 9030334S 448000 60.067 3.2*11 &Zi1733 090000 *12.1733 6.6959 9.374246 9.0000 6.2650 3.3062 12.S&99 0.0000 -12.5699 6.7457 9.444047 9.2000 6o4833 3.3331 12.96*7 0.0000 -12.9667 6,7946 9.512748 9.4000 6.6616 3.3584 13.s635 0.0000 -13.363S 6.8432 9.150549 9.6000 6.8602 3$346J! 1.164 4 0.0000 -13.7604 6.6909 9.647350 9.6000 7.0787 3.4079 14.i575 0.0000 -14.1575 6.9360 9.1131
Figre 82.: PROGRAM PRINTOUT FOR TYPE -I SAMPLE CASE (Conduded)
229
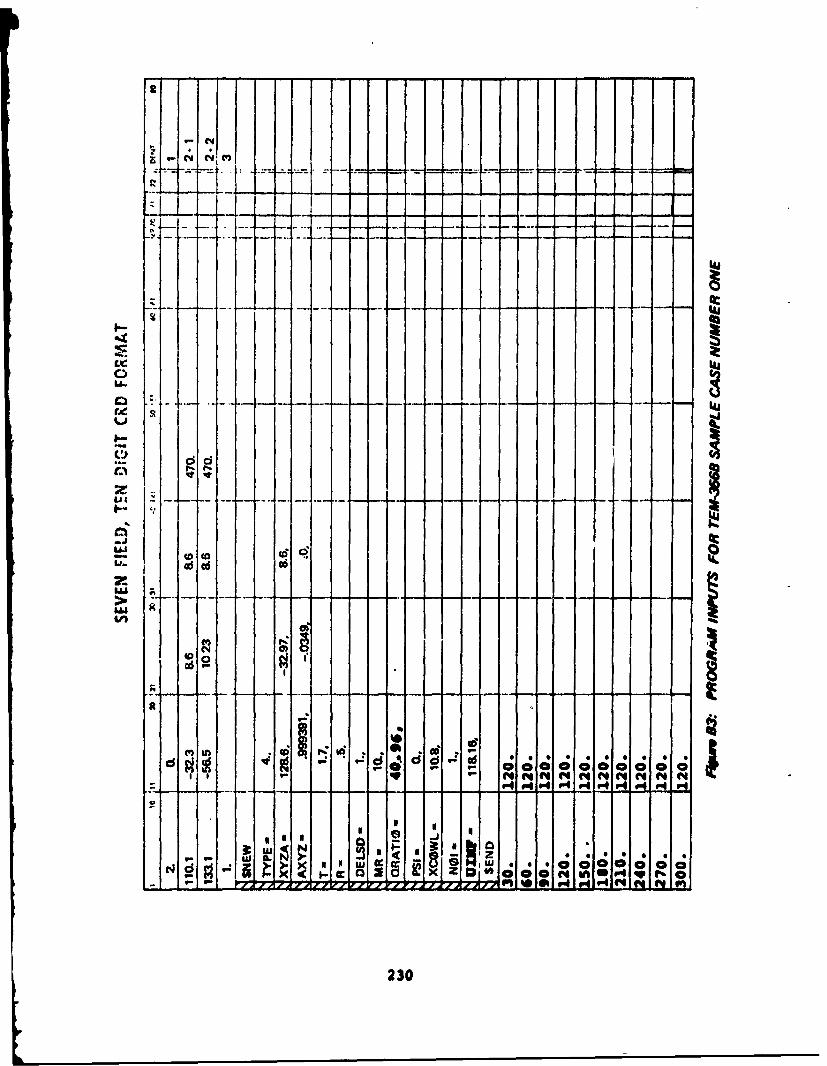
LC aC)LL.
d d
zl A
Lt.
UA
loc0 0 - C; zo So 0
U-U- ~ Z C .C**IC** 0
230
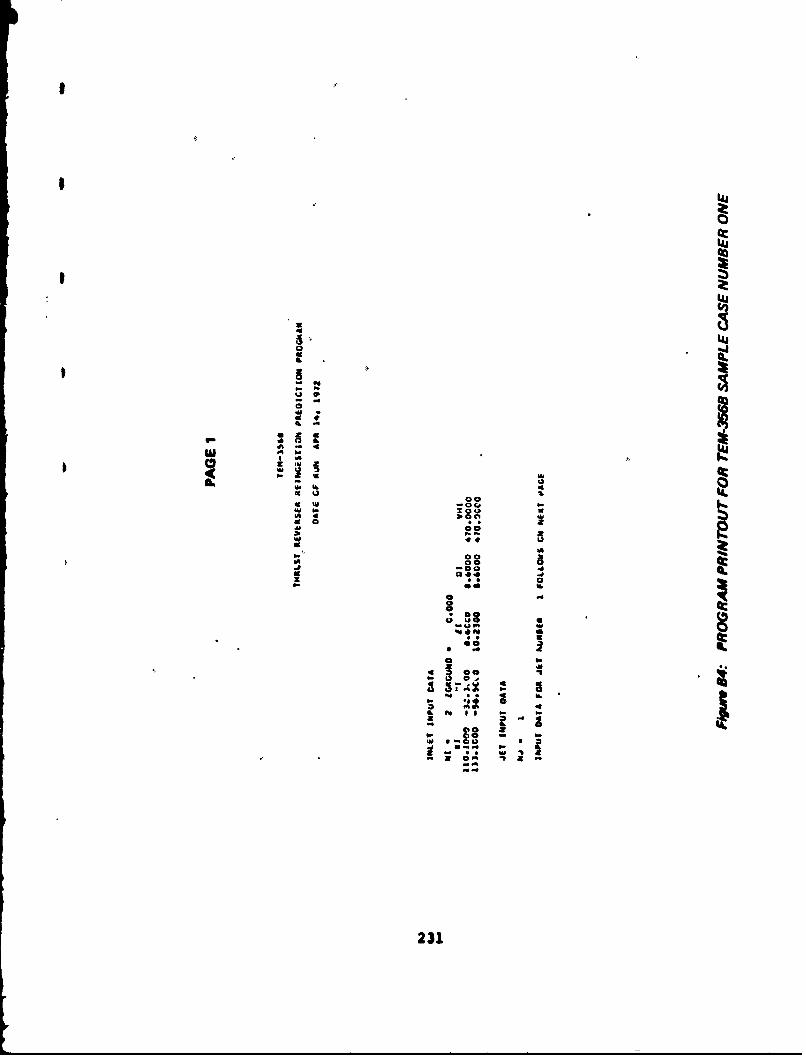
00
o3 .C:1
4 0..
00
. . no
lid III
43 a
231

'1 0
464
000~Coa000
S00000020000
up 0OR'
0 0 000000000
400* 5L
23

0
w wde 4
44 G.A4
*0 03
J. U.0 U
.4.44 c- 4j
4J .4 'aW41.444 -. W. pw=
40 4 :I :w 4 u ,w a
x 0. 0 z o- As 0 a 04 4 0
4m w*1 4 4 1
4' 4
w 4wt
w w a 0 0 6 u~~~)9 a o. W 0 .~~44 0 t 4
S z "Z N4 6 W4
4~~~~: ILI6 4 & ' 40 4
4 4 1£ 0 0233 L 1 ~ t 3

ul0ADI
W a 000 0 5 0IL 6 z 1 0 4L opt
11 IL 4 py ý.
B. b.04 )4
.4 5 W 44 -4 w I - IL 4a a -g A * * - 000 00:000
at4 z. 4,4.4*ovSO 9
a* -. NZ AS 1k 0 2
to C 4,r 0
U. 0. ee ak 0p4,0TdI0I 6. *W a * 1
P 0M 4 Aw D a 2.
M.j k * A -1. Adb.~
t~~~~~~I I&W- ~ 3k I0Z 1
ASw -. 1.g*n k .. d4U M 4- I51k EM '11k MI 4 - t *C SSS S 4z it
4 O~ -~234 ~
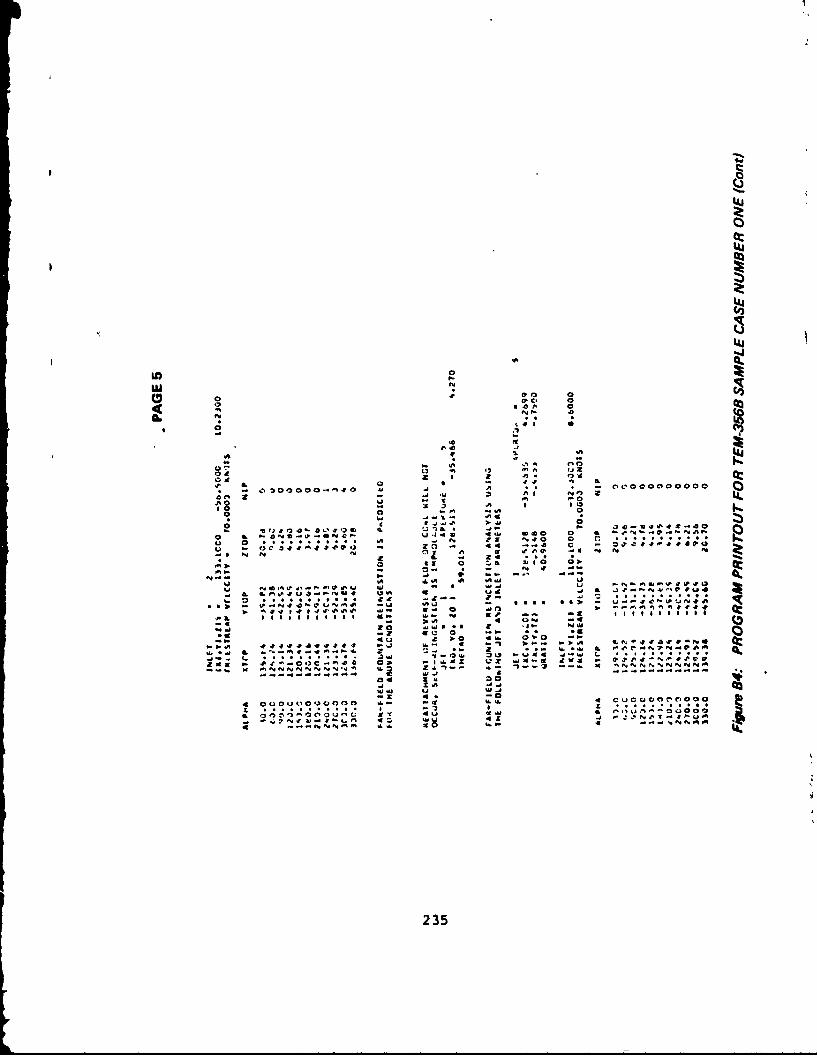
41.
C4
LU
ull
C.)0 ~ LL
.t Il e a 4 - 4 # 106 -0 N4 0Io Nf
IL~N ..0..
:E a,. 0
41
I .A
x -. NA
235 A s

144
goo o
ca 4 bQr o: ~ S.
aleE 0L4
*i *A * sOoz 1.0 40
R3 1- z.a.
... g XC -aCQ4"a.A'd
9P~q 09 cp aU044 9
.9. 0 l0 a. N9.
zS go O9 ft
to 13E K. Vf
- -~ . C - s) 0 4 *.O~I I- I U I I. a. Ow. 9 s
U.S. ~~~~ ~P 0*0.-A U 9fd49 U 98 U 4 - b .I
a ~ " " IO u 2..wh CJ 3. 4 4 M
-, 4l9.
40 42 V4N'E.9 a . 2
236

Iw
.C'
ILa
1; aa J
.. . . j4.
W 04 .10.
C) a,
'Am. C.a013 ,
1 4
o4 4 . 4
00 0 0 ~ o o o o oa ~ l O 0 0023 7

P. ol.a.
00
W _ b. NP N;
0 an
P.03. 04 0 : !a1 1Pop-v.
49 0~ P. Wke- . N.d 44~ PN 4P N .~ d C P
4 4; 0 ~ P~F~PNS.4w P.0 a .e 0 a ....
160 01CO O 1 2: b: '0.. 1. WA U. . 1.
U *~0U~* P.P4 hA. W ~ U *U '0~4Pit
4 PP. m 4 vP N %!4
a NP. N U 5=238

Z5
04
0 . 0O
00 0 0.00
a AI 0
ij2
C. 40 4 'a
.C~E -500000000
w J w 0 X. 0O~- 40 140 UN 001
IL 0 0'4 0 t o
2. - j 0 p-'A
Li a -4 0 14 0. A
'A 044 04b' 0 0 . N . . N 04 0
0 -% 2; - 44 a'.. 0 - -W400OC 44 Od
is 0 I4 I CL *20 7
mI US w N 49 a 4 It0 INN 4' a 4 4 4
49 St . 0.60 )pU f. m 3
-. T= -- -W -z -- -W -N
A IJ. 4 W A
0.~IA 4ý i iM CZ 1: 0 0 .8 0 0 P
IL * . I. ~ . 9 2
Xs w* £*i Ir bA# ILN 0..ý 0.0; ;;; t a40S W5.N 4 - - 66S66 . 1 - -
IL N 44 N -
7 WWS*I 2 NP. N * 7239N

00
w 4.. .
Q -C
I U a 2
w.0 ' w
'A'
w ar at atgtit
-c us at 4L W"UUU ~ ~ ~ ~ ~ ~ ' a 4- * 4q c
0* 1 3 ag MA *Al*w 0* * it
Ca at W 0 &. '-~i C; 4 Naa. '.
6 3 0 IA it C.M0.4 ?U 4 6 g A
1 . '. o . .
~U ot 03M~ U .0-ik it. -
*1W Eg 4.
-PA0 Au
240
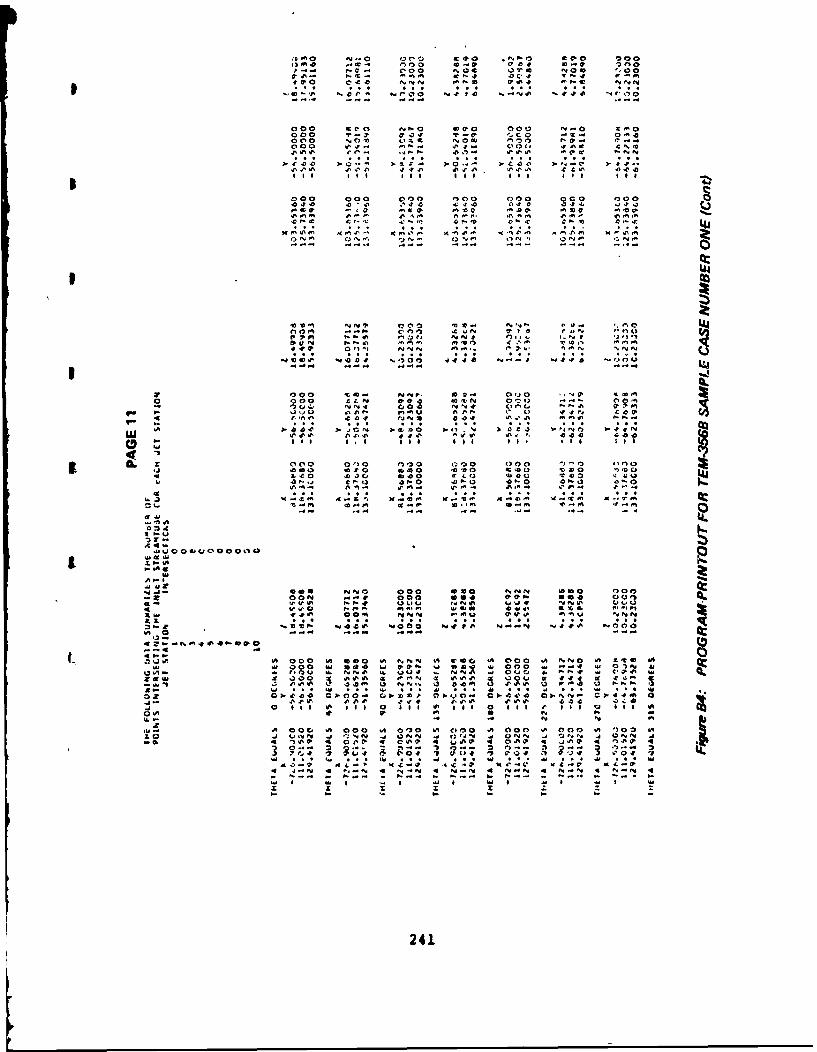
10 Ac 0 - C, 0 0O 13 OS '00e)0 n.. oN 0'r 0' '04 P5 v no
00 .00 NP0 O 0 o00 - A0
000 of,? 0O t- .o . . 0'0
o 00 000 00 000,OC 0
0 f?0 OO '300 .0 0 a .0 s4o og.
47,4
I*e
AO0 .4*C0l .. ' 0P X"N (71~
000 *66 N'. 6. 0'O .o 04
,A 'Do. OiN *a. 4N C-r. '-6N
00c'cl0 0130 0 0 0 0ID0 "00 00 .)no
SM.
1* 4. *S iaO -44 e.ae
viw
Q6 or,4 o0 000 off' co 0.6*1 OO A 0 0 0 000Ax'cov 6-Z 00'. m o o 0uN .4 00 63 Q r09. . 7. m.0
.6. 4. 0 0'.o Q 'v 3-A m1. w.- p 'i NN n a
ti..c.20 r, *.OS vo0130 4 .51 c.~' p 1f40440nA A 1)0P 1
j'.~'. N' .49.N
-4 n v. - ?40 c- 4 U coo . N'. Li 000 a, '.. 4 n LA0-
c4 4. A-o
0 .0 0' i, s. 0' ee 0 ii 241 96 0
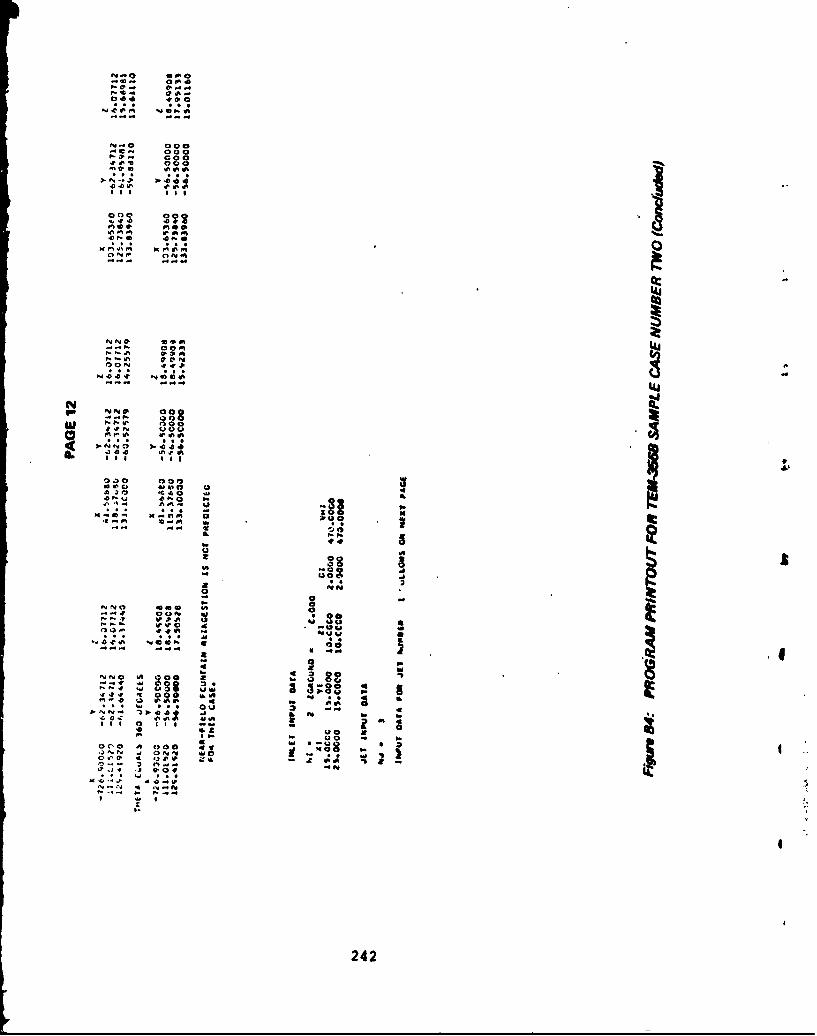
N0 *00
lot *4*
C,. 0 0
tv 00a01L
' I'0 . * **** ** if
3.4..* 0 444
ri 4 M0 w
41j41
4p' o i t 0
ly 14 0 A OO d
~ 00
0 , A L000 4
030. 0 1 t w0 w0 a Q 01if4
x 0 P C0
I24

This case demonstrates the need for good arm definition forTYPE = 4. jets. Because the annular surface is representedby discrete arms, they should be placed strategically pointingdown and between inlets to ensure that potential intersectionpoints are determined for far-field fountain and crossflowreingestion.
Sample Case Number Two Input--This case was designed to testsome of the near-field fountain reingestion criteria. Programinputs are given in Figure B5. Two inlets and three jet. wereinput.
Sample Case Number Two Printout--Computer printout is given inFigurc B6. Near-fiela fountain reingestion is predicted onpages 10 and 11 of the printout.
TR and TV System Performance Program
Thirteen sample cases wore computed by TEM-357. Input formatsand computer printouts for each case are described in thefollowing paragraphs.
Sample Case Number One for ENGI--Program inputs and printoutare shown in Figures B7 and B8. Printout parameters areidentified in the following table.
Parameter Explanation
T time
.WF fan nozzle area match
AMP primary nozzle area match
AMC common nozzle area matchPCF thrust level, percent
PCD duct thrust/total thrust, percent
SMF fan stability margin, percent
SMC compressor stability margin, percent
DSMC compressor stability margin change due toengine acceleration or deceleration, percent
SMCNET net compressor stability margin, percent
DPF allowable fan total pressure distortion, percent
DPC allowable compressor total temperature distor-tion, percent
DPMAX allowable engine total pressure distortion,percent
DT allowable engine total temperature distortion,percent
243

NI
7I cc
--
o wl
2440

-~ 1Th-.4.4
.- 7
I ~ 'I 94
~4J ...
I- I V
.w .j w0 >x~'Al z
t .-.- V7-7,-= 77 -7 ,
P45i
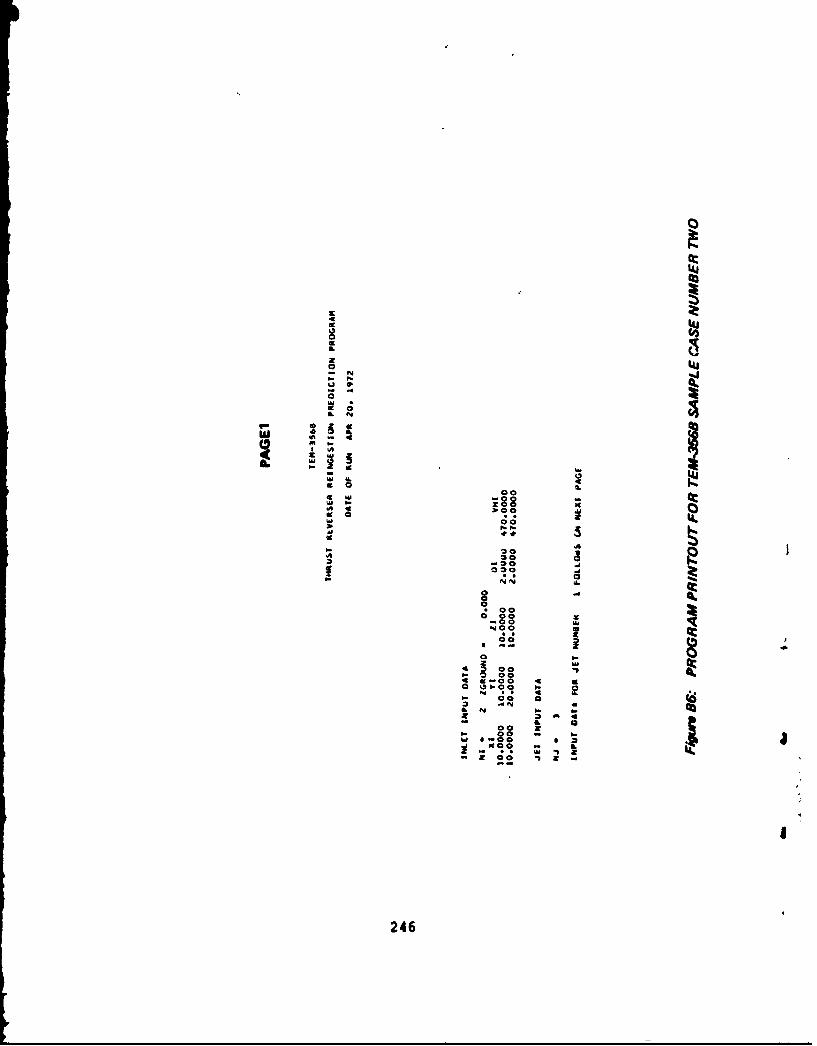
Z0
41
P.
0ao 19 1
~40
a. N
Ic-
W0 MA
£00
IL
cc%
00
09
2460
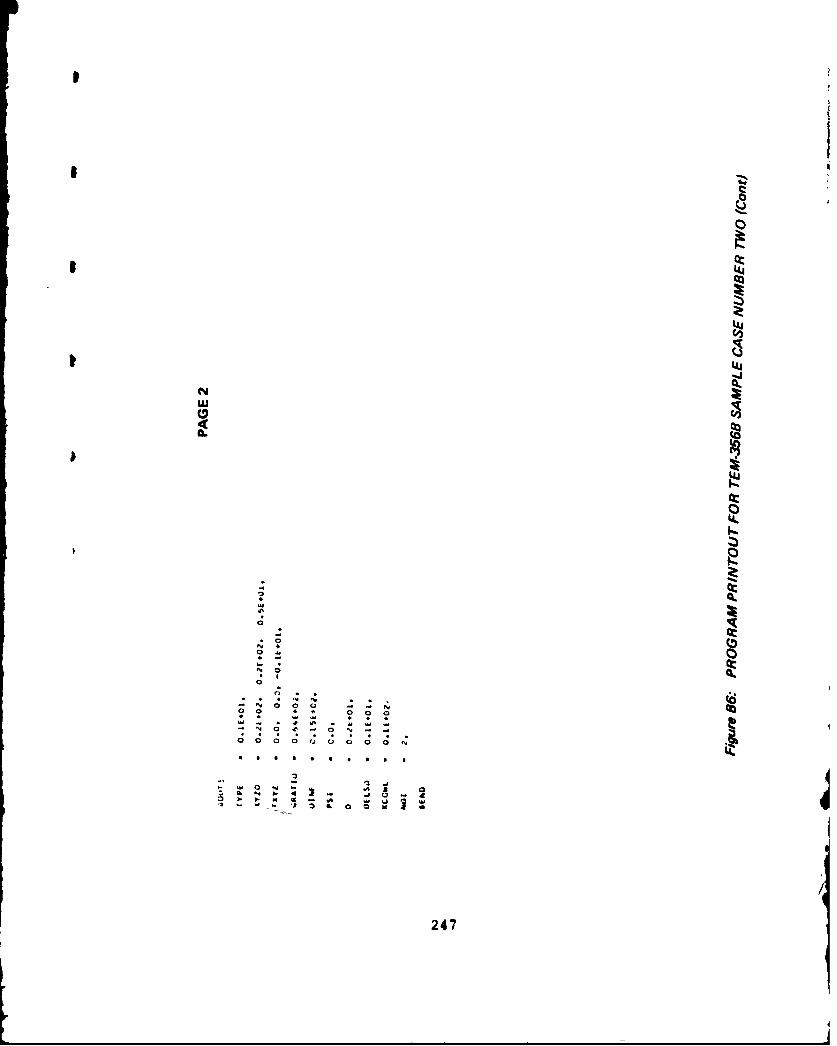
I
I0
I
I�Lj
Cj
-JN
C, C,,
4a.
14Jk
0
0k
0
C;
.0CM 0NO
0
0- . C � N . .- N 0 0 (3 - - N
O 0 4 * 0 0 0* . - .s 4 * .- . * he hhe - e- -� 0 � - 0 � - -
00 0 0 '� 0 0 0 0 N
* . . C C * C C C C
0- heW 0 N - 'hi 3 0
N 4. 4 ) - .e o aO * � - - 0 w'3 0� 0 0 N *
/
247
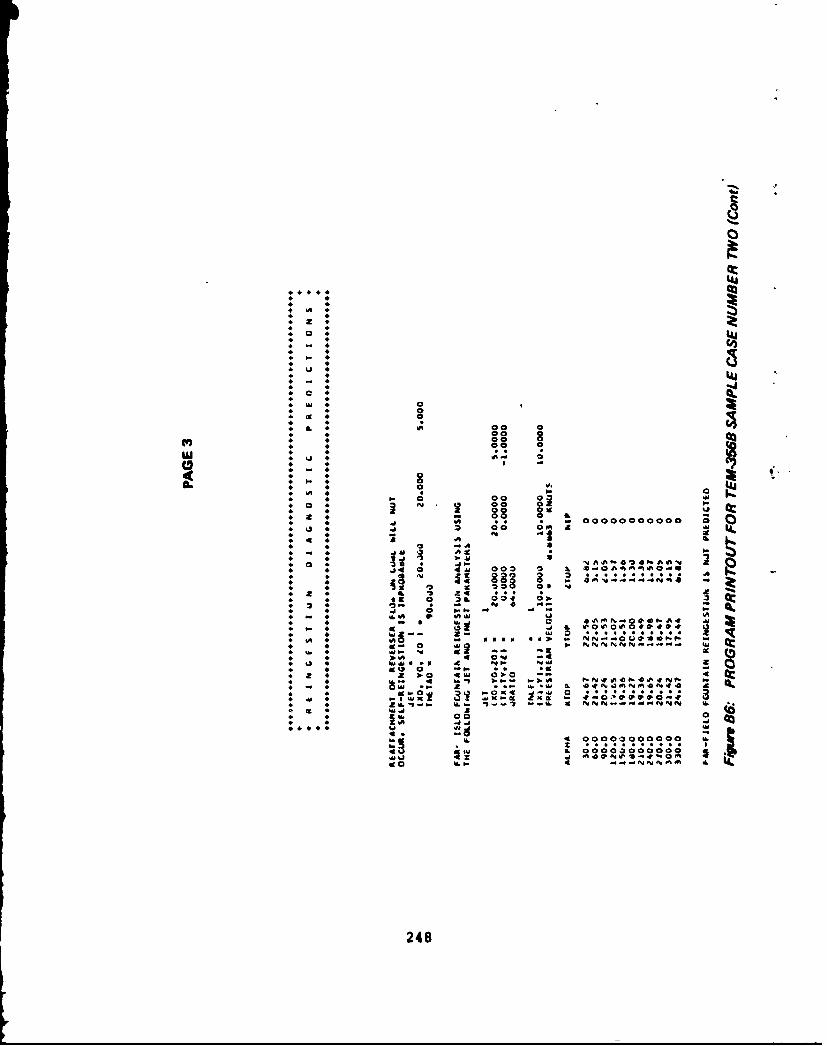
04)
cc 0
U(3
ILa
0* Ng 44t
0 4 U co
4, -4 - . 4
*' s
*4 4 44 04-
to: IL 4p 00
4M 4V- 00 3 v Nc 4f
4 4 000004a 00 %LA0m 4
4 U 448

00
000ro c~o 0
. 00 00W0lc
Ca 0.2 - 000 000000 A V2
Acp N W%0
2249

C)
Z
(3
00
IL
0L
0'
o o3
250U
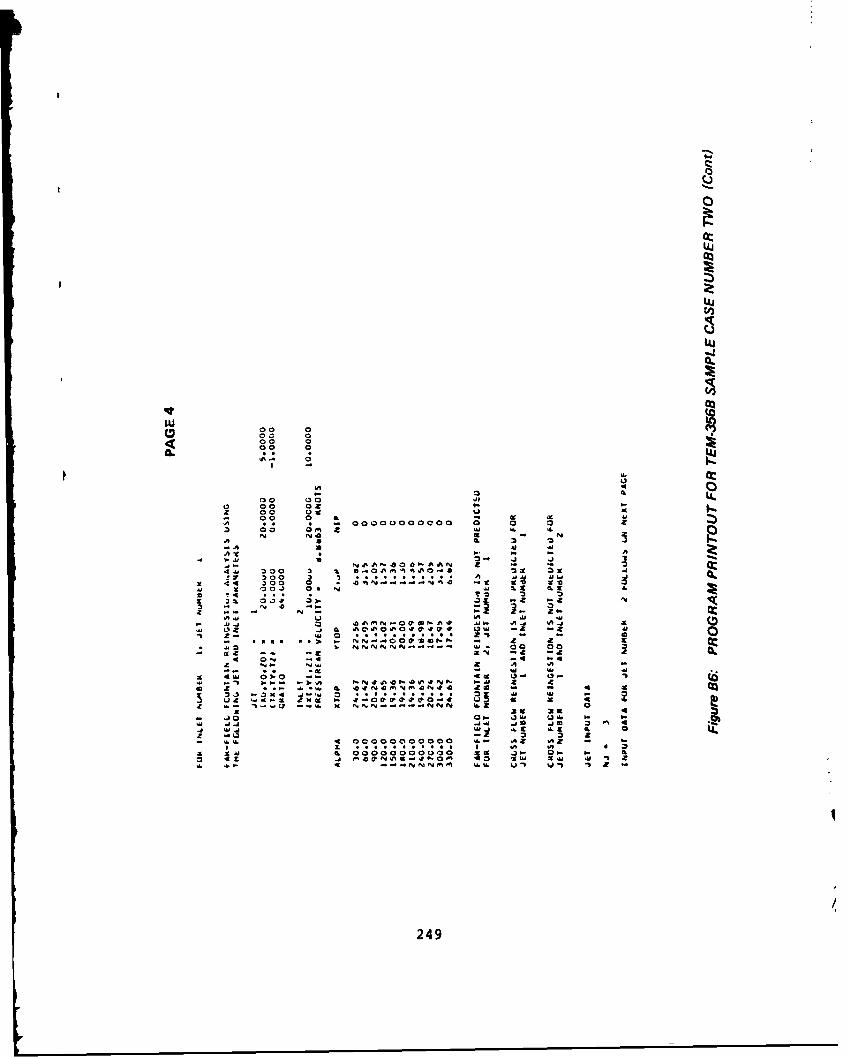
cc0
0i
L4
a.
w 000 000 0
0 0~ 0 X-
0 o0 00 02 zz 00 0'
- 00 0 MA * -000000000 0 0
r ý00 Qe w .
N~~- N'I- 3I-::. 3.L CILj
2 4 031 0-- ~ N- d~ .4 0-., 4
t ':: .** ", 'aa le .3 .) .2 .. -a . N
a~~ *.. - 4 4 .-~ ~~~~~ j40 C O . * M. A .
J~ 0 %L - -
0. g0 00 00 0 NN N N. - 0 0 CL
2 ~~ N.0 wo 2 A f-- ~N .* %J-U- U
z 4W ).0 - 44 249

C-)
t~l
U,
Qd)
U)q
InO
C,,
a K:a 0
a a%
25
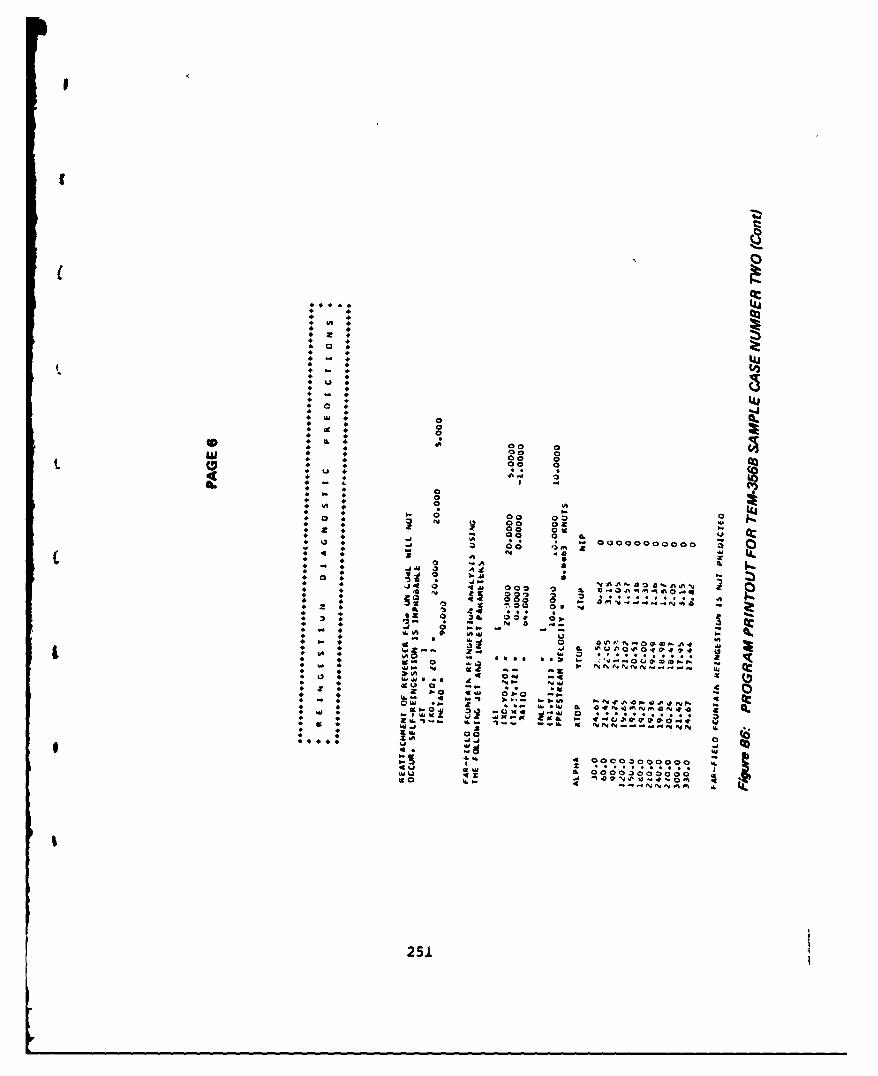
II
000
00444. 1 100 0 00 0
a. 4400 ýo
44 ,j C 3
Z" 4 ," I
at 0 ., 0p
4251

uJ
C4
010 00O. 0Cal ac: 0 0
M,
0 N
In
.4 .. -f 0 4 4At
21 00 1, at I ~ N . . 0 g .4 ; - - - - - m bN
-1 f" 0 m m f a c
3 A,4- 14: 14.6 M. A, 0 0 0 0 0 0 0 a z '3. IA0N3.NO. I6 I3 41a 00 -- 43c1-9 ~ ~ 4 N.1 N-.I f"6fr. 1 U.1 kL A
~ 3~j ~ a * ... . . ..52

U
44
0
Lij
I
U
L
I0
4: 44�
0o.4
kN N* 000* 9w.- .
*001
* UN00
Mi- **8
00*Mi a a* a � N N a a- N ft 0 0 - - N00... * * 000
* 4 � .4 Mi 4 4 44 .4 � 11% * Mi .4 .4- � - 4 - 0 N - .4OOOOooooo
* . . . . a . * * * .1P S S U 5 0 S U S S
0- - 0 .J- .4 0 N - .5.
44M 4 & 00 �-3
253

00
-Aj
a*3 0 a 4
a 4 2 0 fJaW.44
*j 4. 1.
4 04u 0r 01
9 4t4
* 0 0 fi.1
4 4 n 0 lo
41a 4 0
43 4 00
4~9 IU 4%6 .
* 00000004 - 4 j
4 0
254t
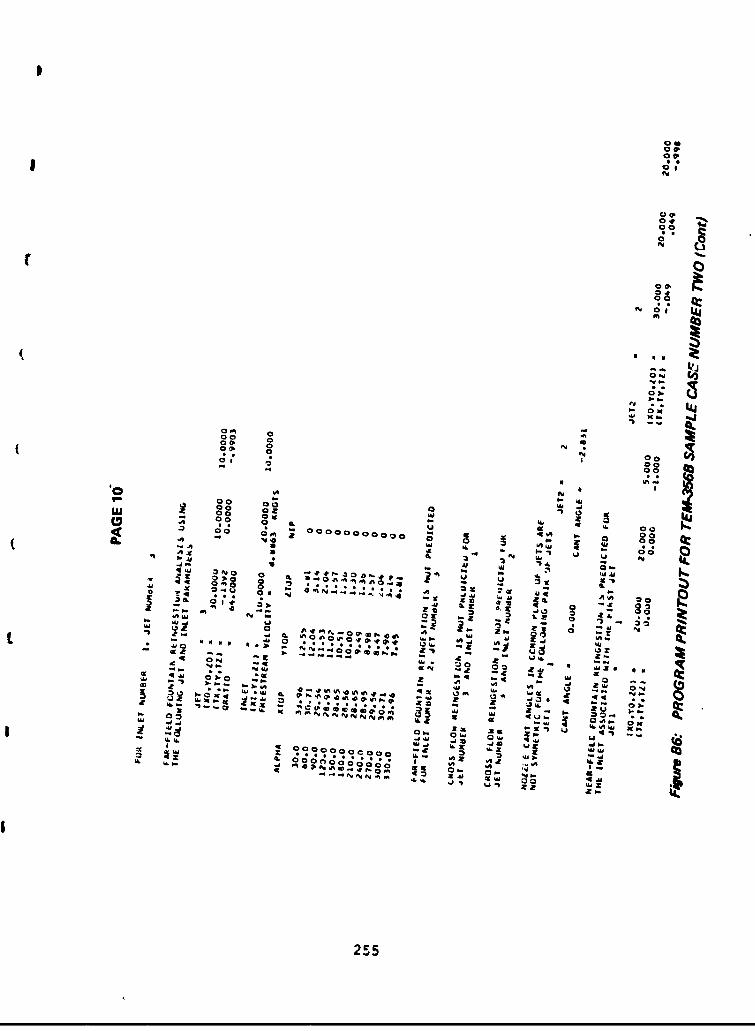
0 0,
0g3
cc
0300
o Co000
IL W"
00o -900 N 0. aO
IL old
046 *40
b- IA 4
N.~~ 0n de~£ ~ ~ 0
00 L 00000 ao .4 6
N~ ey AN
'3~ So 5 0
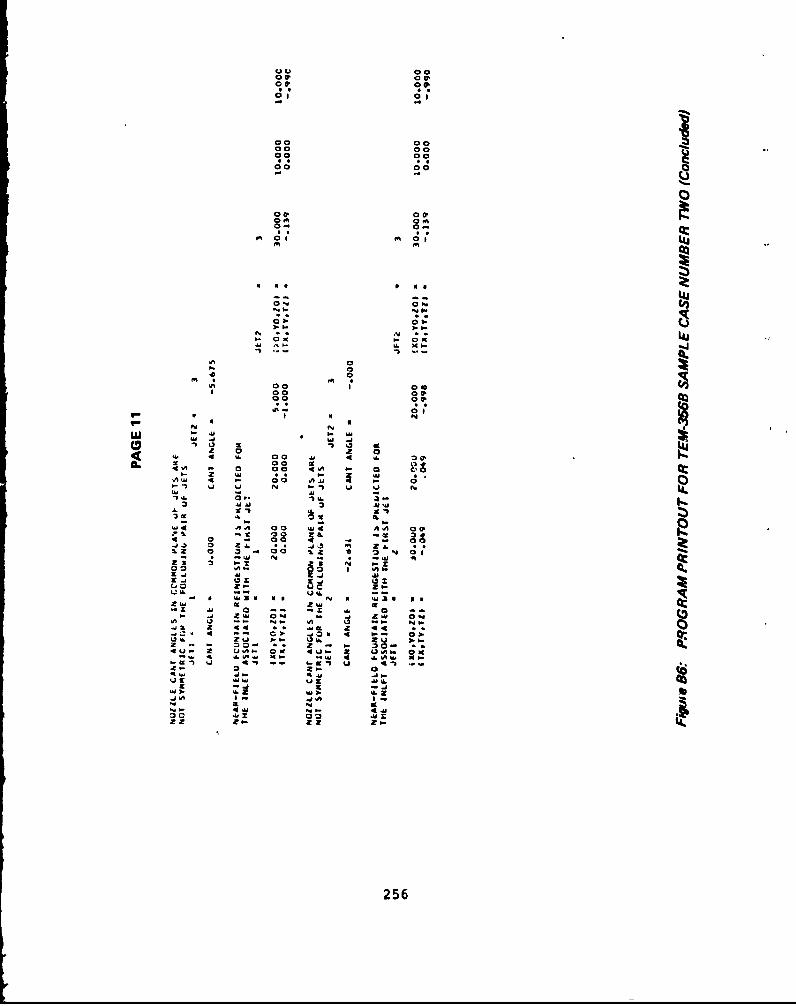
co 0000 00
9 C,
0 o 0 (02 0-
9 . 9 *
S41
In - 0~ 5. O
9. 900 00
00LAI U. 0
-. 4 A A 00 40 ia ccI
~~ 00 . 0 S
-~ ! 2WN NOf ~I
6- 40.- .. a -
b, 4 - 03.
So tt zw' * 2 - so-0 *
0ý Zs- 0
.j 'A l .9.
256

2 1 T T
10- - cv m'a C1741_ -;_77 ---- ~ -~-
ro
L P4 IM Q 1 4Jri u
c4V
w I
257

x C. V -w
* * *9 .0. 5Z
a- ~ a- . p p. . N .0 . cc
0 * * * * * .
.0 . 0 a0 N0 C-1
.0 040 . 0 .0 0 a 0 .
Y N ly 'l' N. NN-
~~~b~ 0o .
3 C-
025
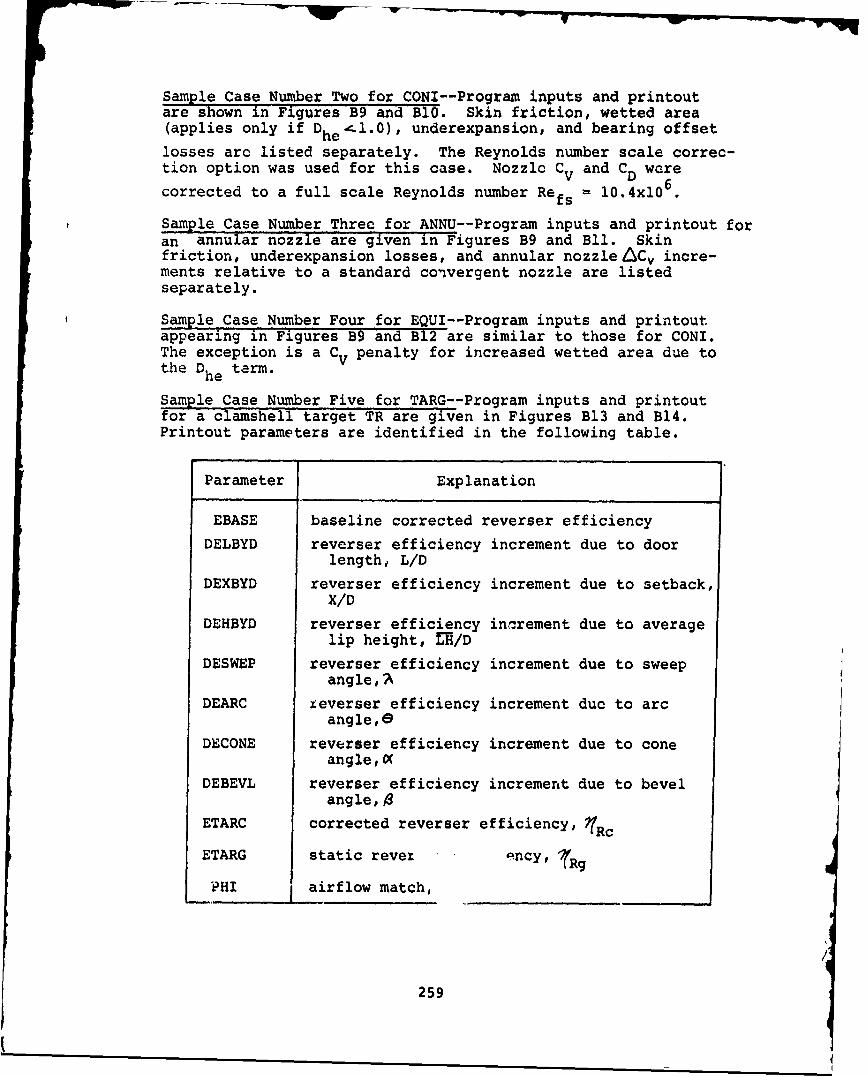
Sample Case Number Two for CONI--Program inputs and printoutare shown in Figures B9 and BIO. Skin friction, wetted area(applies only if Dhe '1.0), underexpansion, and bearing offsetlosses arc listed separately. The Reynolds number scale correc-tion option was used for this case. Nozzlc C V and CD worecorrected to a full scale Reynolds number Refs = 10.4x10 6 .
Sample Case Number Three for ANNU--Program inputs and printout foran annular nozzle are given in Figures B9 and Bli. Skinfriction, underexpansion losses, and annular nozzle /Cv incre-ments relative to a standard convergent nozzle are listedseparately.
Sample Case Number Four for EQUI--Program inputs and printoutappearing in Figures B9 and B12 are similar to those for CONI.The exception is a CV penalty for increased wetted area due tothe Dhe term.
Sample Case Number Five for TARG--Program inputs and printoutfor a clamshell target TR are given in Figures B13 and B14.Printout parameters are identified in the following table.
Parameter Explanation
EBASE baseline corrected reverser efficiencyDELBYD reverser efficiency increment due to door
length, L/DDEXBYD reverser efficiency increment due to setback,
X/DDEHBYD reverser efficiency increment due to average
lip height, ER/DDESWEP reverser efficiency increment due to sweep
angle,ADEARC xeverser efficiency increment due to arc
angle,eDECONE reverser efficiency increment due to cone
angle,aDEBEVL reverser efficiency increment due to bevel
angle, 0ETARC corrected reverser efficiency, '?Rc
ETARG static revex :.ncy, TRg
PHI airflow match,
259

L, V
o I *1
PI c
, I J I L
CI
1"41
W , d I
(II
4 N
8 uI
JI CI4
I.c i [
260

ag
94 0 * 4 6 4 9
o c'o 0 ~ ccs 0e - % )mIf uo
0 43 0. U V 0 00 co 000 ,gof
IN4I
im o 'go cl we'C0a o
a clCo
94C 414f mNNA
c I 4 0 C.
me ow
MAw w m
U b. W
lb ~ft
261 I

C,
C•
C NO- -'t 00-PN %
0e:0eIF , ft
ccccc~ ~ ~ P.-p N0 a a
aoo 0.oaee~e j
. 00*P500O0
a
00 0 400400~00Got
4 4A
426

Ile 0e
sit "08a
1 2-
. . . . . . . .
*i •!!!!!!I!!!!!oo@
!11
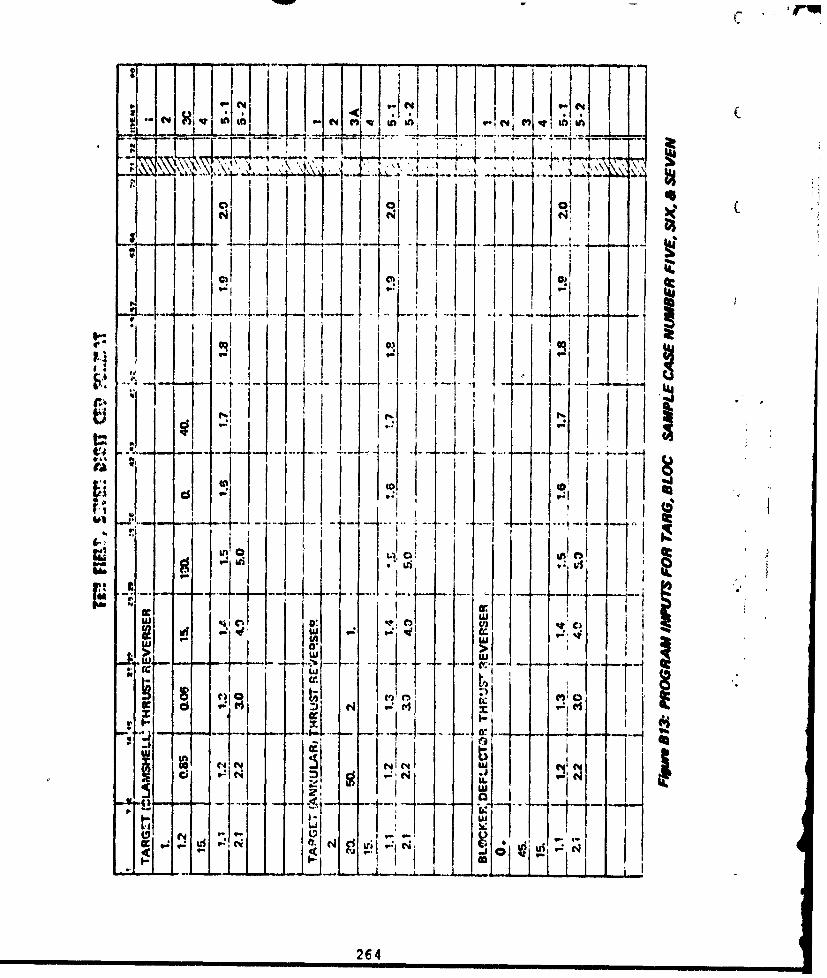
07 '71 I4
I t -I
i
bi U i) W.
-t.->
C...
0 0
I .L9 w
cc C4
264
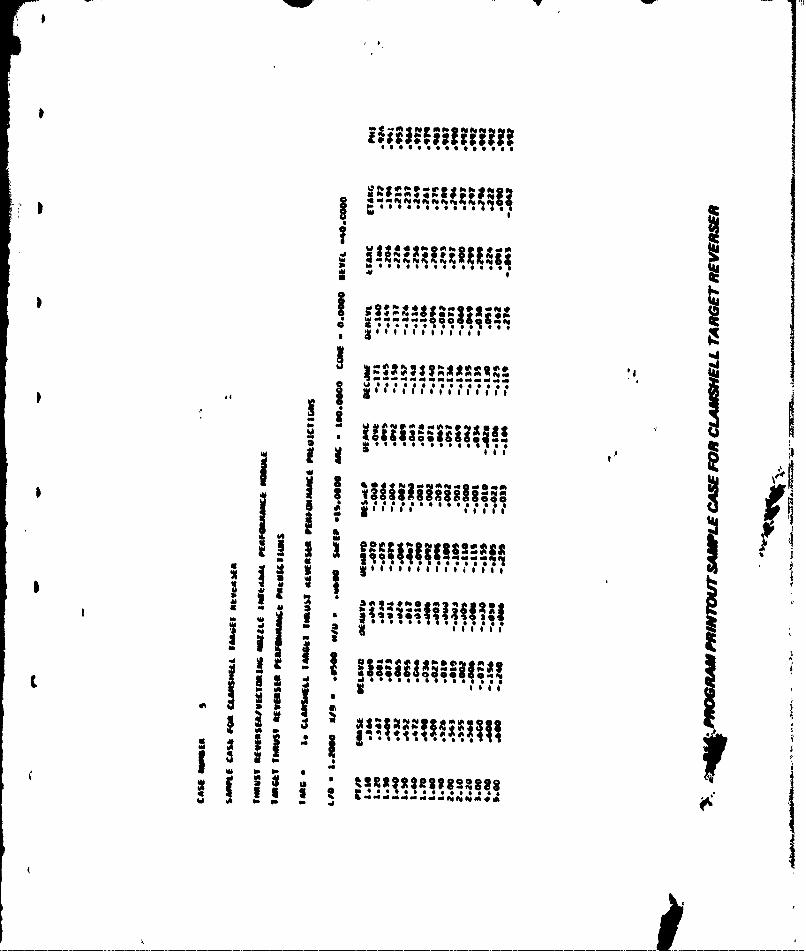
w0 to - V
b* .4 0
I 0000006000600
do.
a" of
a di. * S
ko so
04 14. , . .0#

Sample Case Number Six for TARG-- Program inputs and printoutfor an annular target TR are given in Figures B13 and Bl5.
Sample Case Number Seven for BLOC--Program inputs and printoutfor a blocker external deflector TR are given in Figures B13and B16. Printout parameters are identified in the fcllowingtable.
Parameter Explanation
ERBASE baseline static reverser efficiency
DERBASE increment due to lj:2ckcr door angleETARG stati'- revorser efficiency, ?IRg
LTARC corrected reverser efficiency, nRc
PHIBASE baseline airflow match
DPFI increment due to blocker door angle
PIII airflow match, i
Sample Case Number Eight for SING--Pronra' inputs and printoutfor a single bearing nozzle are given in Figlires B17 and BI1.Theoretical thrust components for this nozzle were given inFigure 29.
Sample Case Number Nine ror THRE--Program inputs and printoutfor thrie bearing nozzle conli-guration number eight are con-tained in Figures B17 and B19.
Sample Ca.;e Number Ten for SPIIE--P..ogram inputs and printoutfor a spherical eyeball nozzle arc given in Figures B17 andB20.
Sample Case Number Eleven for LOBS--Program inputs and printoutare given in Figures B2] end B22 for a lobstertai: nozzle.
Sample Case Number Twelve for EXTE--Program inputs and printoutare given in Figures B21 and B23 for a hinged external deflector.Correlations for hinged deflectors were developed during PartIC and are discussed in Volume II of this report. Specialgeometric inputs required are X/D , D n/D, and "P as defined inthe following sketch:
266
266

IW
f4Jcc,
ccJ
cc
0.0
w 19
st w
' o- b 0
'. 4, - "
z ki
'j 4A
44 z .0 0
9- , ~ * 9-*N0~0N~~267 A~
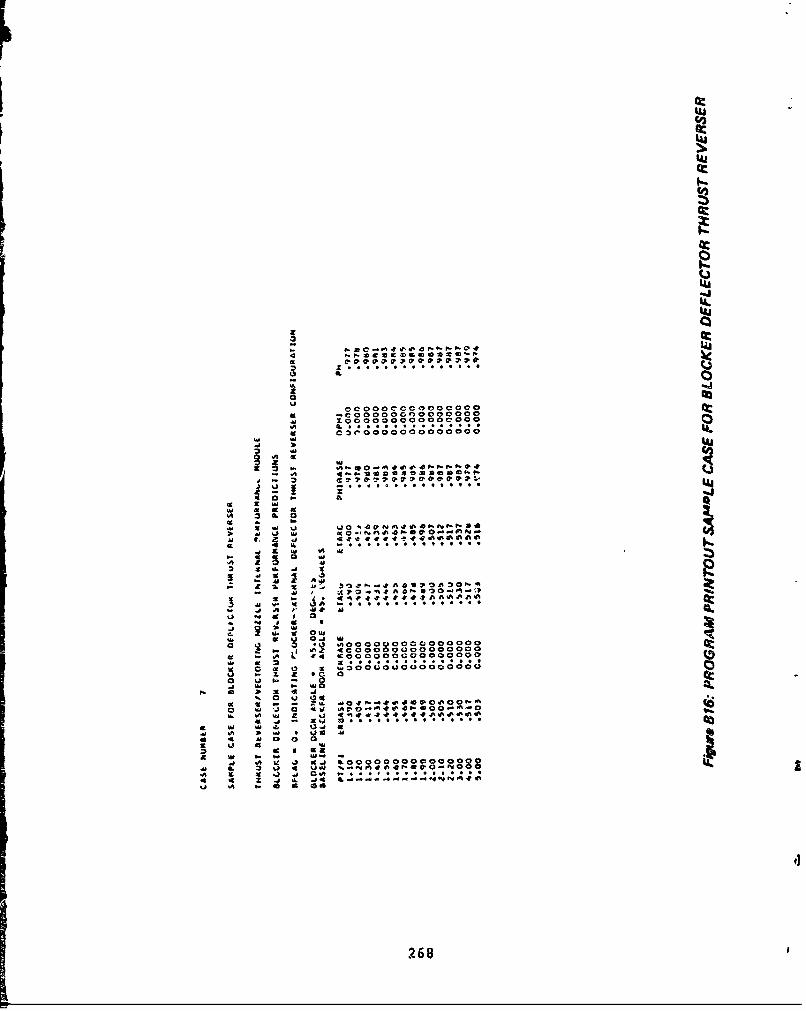
c'S
C4
200
.101
.j.
V 0 -0
4CO0000C0000C0:0
1 0 0000000000C000 0
w w 23 0
19 0 a
6 .4 0.
268

0 4 - 41. , co N to fe l#
111
V'..I d I d~
~apt
!111
- o ,-
J - i269II
* .... e
- Vi!
9- ~ .daag*~ii
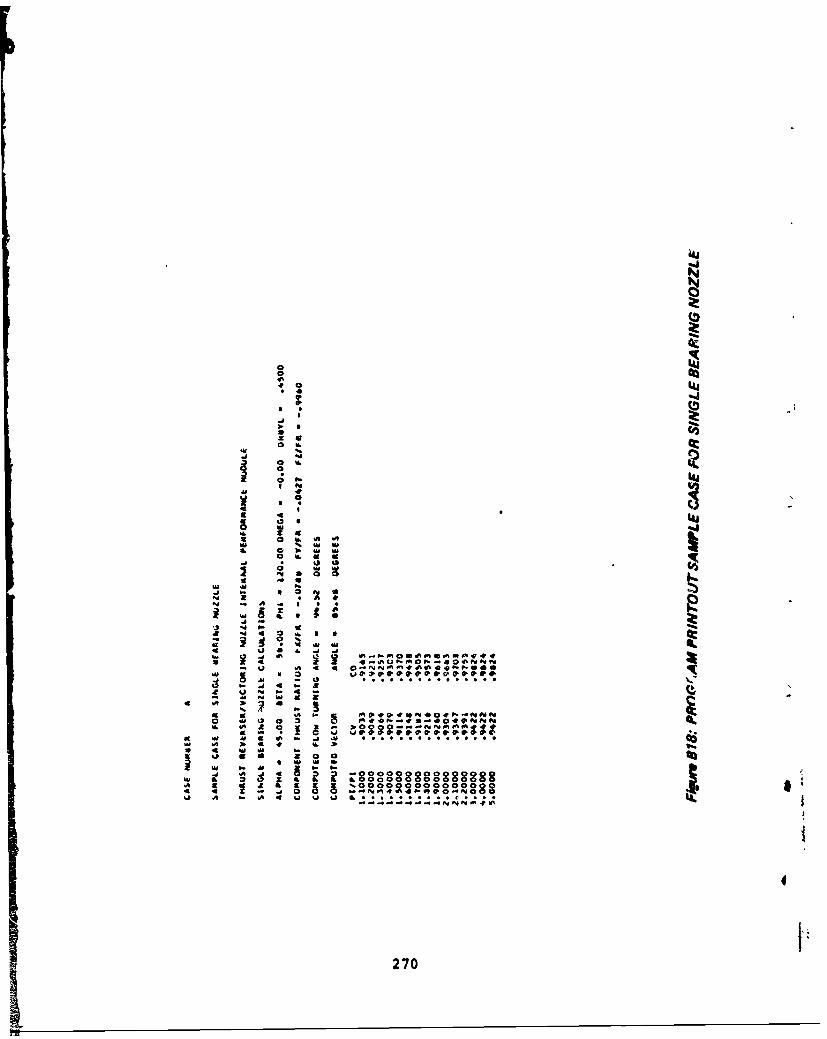
NN-
00 0
*0
3- 9
vi
.0 4
IL~ ~ 44. c
4)S w
27

N0-oo
4L'
a IL,
N4Pvo
oA^do o c o r.PV # *P oo vCý ,P. ,F-ý0d rv I
2711
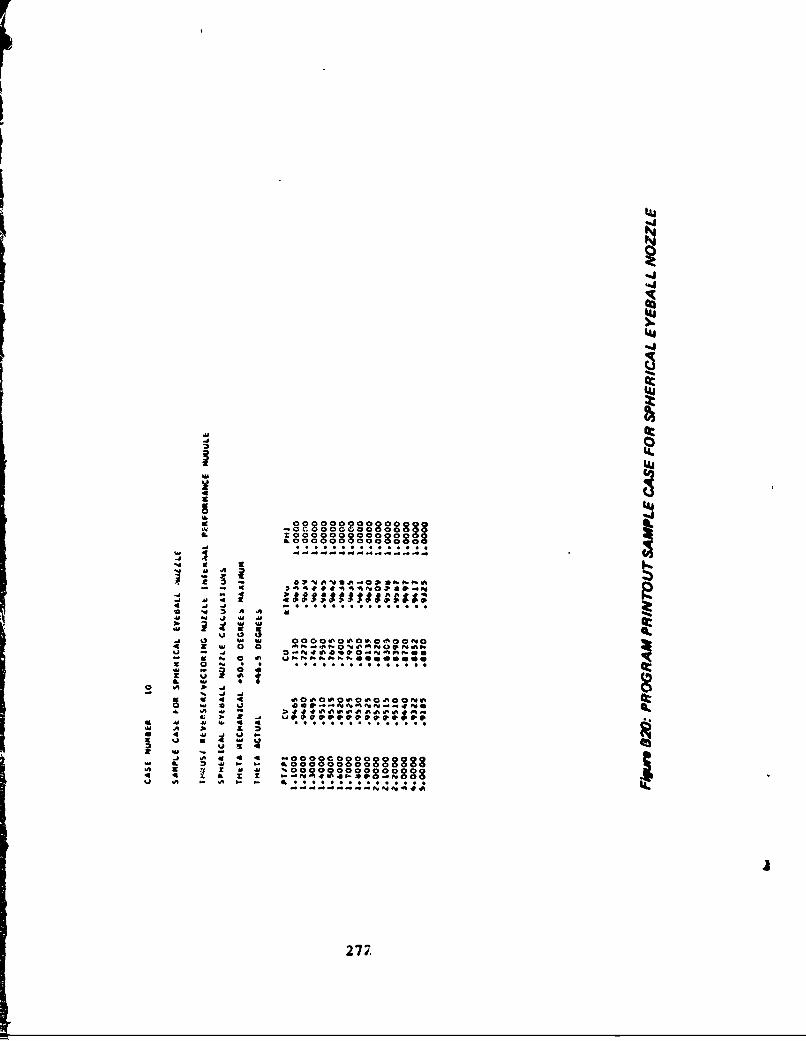
ap.. .....1Z00 000000 88888
han
427
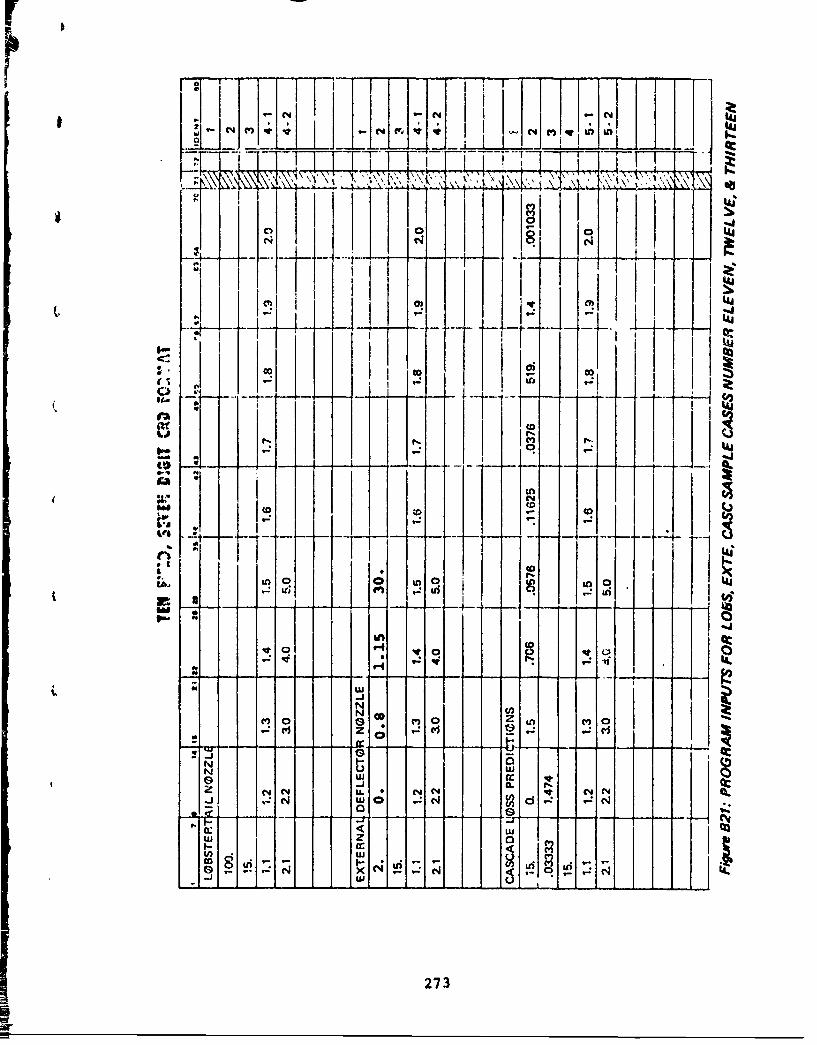
LE\\ -AL
CV)
0L ~
I- I In
40
CV) 0 l
ý9-sN
C4 N4 '4.-4N
UL
*i ze Q ~
273
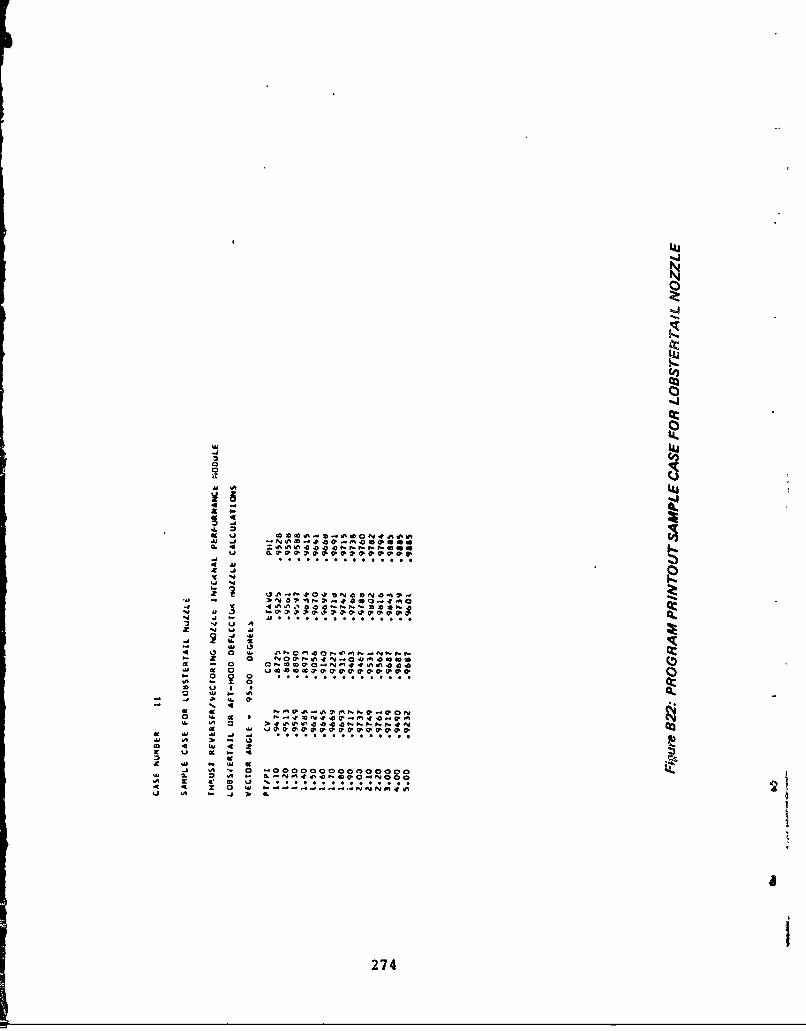
Ns
N'
40 'A
%AJ
C6'
oo
. . t.
4 4ApZ 4
k, 4W a. v a
-A 0
W 4
"A 47

It
:R.
;LI
-OZ
C) of
c"I L C, > 441 7.- ^9L r r eoo0ar . %o
N. I. A)40 0.D
0j uj00 00 9c
4.. 9 - 1.
-i LUO u. * 9 *
r2 a' 0
i C3 L, 7 -,2- U) C Li
C, U JC,'0
LA U. -a'
7L > C' 0
U. CK u , al V
JA w "I U. 0,- ) .
Lu LU >O C - w
V% 0 cA 0 0. U A*
v ev 6- -j A - 0 A-4
w. ui LL. C. 41
Au iRU- roduAe from
lb eA :s.J~t a; :I I c ap y

Sample -Case-Number thirteen for k C-rga inpu~ts And, printoutare given 'in Fgrs n B24 for a -cab'cad "lattice with,bla'de enitrance Angle. of, 15 -degr-ees--and solid~ity c/s - 1.5.Ou~tput.parameters iniclu'de- exit Maich 'number M2 --outlet flow
~ C...and Cb.1nl O2tota pressure l'Ioss- &P/P0 *v-
2
276

'4Wac
0 x
? -
IA L
U I 3
0 0 . 0 a 0 cW0, Ci 0
.j
44 0 -N. C; 4ji0'~~- -'N
LuUQ0 0. 0 C
. * o - Z ICle A (IZ-
cc Ul V. .w A >- D ~ 4 4. -. 0 0 -0
.j A -
In N- a -IA I O Qc .UN Li Li A4 - ~I IIIIIIII INO
- U > 4 N-7
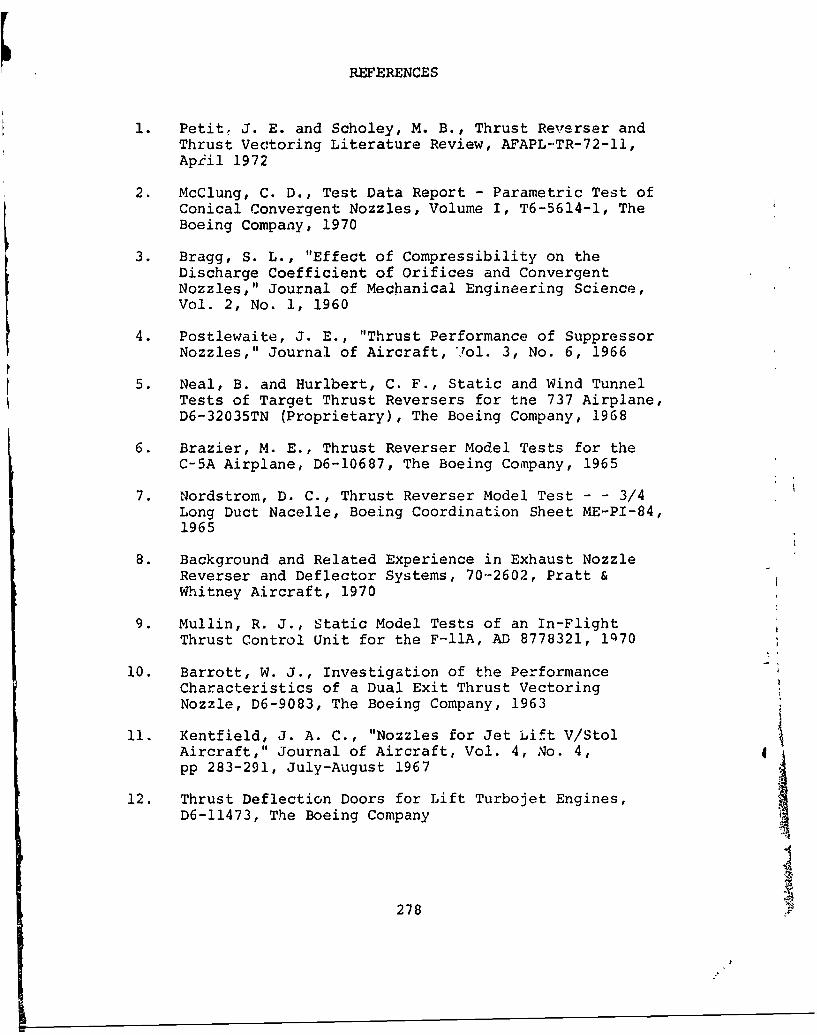
REFERENCES
1. Petit, J. E. and Scholey, M. B., Thrust Reverser andThrust Vectoring Literature Review, AFAPL-.TR-72-11,Apiil 1972
2. McClung, C. D., Test Data Report - Parametric Test ofConical Convergent Nozzles, Volume I, T6-5614-1, TheBoeing Company, 1970
3. Bragg, S. L., "Effect of Compressibility on theDischarge Coefficient of Orifices and ConvergentNozzles," Journal of Mechanical Engineering Science,Vol. 2, No. 1, 1960
4. Postlewaite, J. E., "Thrust Performance of SuppressorNozzles," Journal of Aircraft, Yol. 3, No. 6, 1966
5. Neal, B. and Hurlbert, C. F., Static and Wind TunnelTests of Target Thrust Reversers for tne 737 Airplane,D6-32035TN (Proprietary), The Boeing Company, 1968
6. Brazier, M. E., Thrust Reverser Model Tests for theC-5A Airplane, D6-10687, The Boeing Company, 1965
7. Nordstrom, D. C., Thrust Reverser Model Test - - 3/4Long Duct Nacelle, Boeing Coordination Sheet ME-PI-84,1965
8. Background and Related Experience in Exhaust NozzleReverser and Deflector Systems, 70-2602, Pratt &Whitney Aircraft, 1970
9. Mullin, R. J., Static Model Tests of an In-FlightThrust Control Unit for the F-lIA, AD 8778321, lq70
10. Barrott, W. J., Investigation of the PerformanceCharacteristics of a Dual Exit Thrust VectoringNozzle, D6-9083, The Boeing Company, 1963
11. Kentfield, J. A. C., "Nozzles for Jet Lift V/StolAircraft," Journal of Aircraft, Vol. 4, No. 4,pp 283-291, July-August 1967
12. Thrust Deflection Doors for Lift Turbojet Engines,D6-11473, The Boeing Company
278 a

!
REFERENCES (Cont.)
13. Siao, T. T. and Hubbard, P. G., "Deflection of Jets,I. Symmetrically Placed V-Shaped Obstacles"
14. Ambrose, H. H., "Head Losses in Mitre Bends"
15. 'inley, D. G. and Mathieson, G. C. R., An Examinationor the Flow and Pressure Losses Blade Rows of AxialFlow Turbines, R and M No. 2891, 1951
16. Stewart, W. L. et al, "A Study of Boundary LayerCharacteristics of Turbomachine Blade Rows and TheirRelation to Over-All Blade Loss," Journal of BasicEngineering, 1960
17. Abramovich, G. N., The Theory of Turbulent Jets, MITPress, Cambridge, Mass., 1963
18. Shandorov, G. J., Calculation of a Jet Axis in aDrifting Flow, NASA TT-F-10, 638, 1966
19. Callaghan, E. E. and Ruggeri, R. S., Investigation ofthe Penetration of Air Jet Directed Perpendicularlyto an Air Stream, NACA TN 1615, 1948
20. Jordinson, R., Flow in a Jet Directed Normal to theWind, ARCR&M No. 3074, 1956
21. Storms, K. R., Low-opeed Wind Tunnel Investigation ofa Jet Directed Nornr-l to the Wind, University ofWashington Aeronautical Lab Report 885, 1965
22. Pratte, B. D. and Baines, W. D., "Profiles of theRound Turbulent Jet in a Crossflow," ASCE, Journalof the Hydraulics Division, 1967
S23. Vizel, Ya. M. and Mostinskii, I. L., "Deflection of aJet Injected into a Stream," J. Eng. Physics, Vol. 8,Nov. 2, 1965
24. Margason, R. J., The Path of a Jet Directed at LargeAngles to a Subsonic Freestream, NASA TN D-4919, 1968
25. Filler, L., Survey and Study of the Penetration andDeflection of a Jet Injected at an Angle into aUniform Stream, D6-20380TN, The Boeing Company, 1968
279

FREFERENCES (Cont.)
26. Cooper, M. A., Temperature Field of the Two DimensionalTransverse Hot Air Jet in a Freestream Flow, VanderbiltUniversity Department of Mechanical Engineering, 1971
27. Platten, J. L. and Keffer, J. F., Entrainment inDeflected Axisymmetric Jets at Various Angles to theStream, University of Toronto Mechanical EngineeringReport UTME-TP6808, 1968
28. Gerend, R. P., Penetration of a Jet into a NonuniformStream, M. S. Thesis, School of Mech. Eng., SeattleUniversity, 1968
29. Wooler, P. T., "Development of an Analytical Model forthe Flow of a Jet Into a Subsonic Crosseind," NASASP-218, 1969
30. Chang-Lu, Hsiu-Chen, Aufrollung eines zylindrischenstrahles Darch Querwind (Rollup of a Cylindrical Jetin a Crosswind), Doctorial Dissertation, Universityof Gottingen, 1942
31. Soukup, S. M., Potential Flow Aspects of the Cross-Sectional Deformation of Jet Configurations in Cross-Flow, Masters Thesis, University of Tennessee, 1968
32. Braun, G. W. and McAllister, J. D., "Cross Wind Effectson Trajectory and Cross Section of Turbulent Jets,"NASA SP-218, pp 141-164, 1969
33. Hackett, J. E. and Miller, H. R., "The Aerodynamicsof the Lifting Jet in a Cross Flowing Stream," NASASP-218, pp 37-48, 1969
34. Colehour, J. L. and Gilbert, R. F., A RElaxation Solutionfor Two-Dimensional and Axisymmetric CompressiblePotential Flow Problems, D6-20364, Volume I, The BoeingCompany, 1963
35. Tatom, J. W., A Study of Jet Impingement on CurvedSurfaces Followed by Oblique Introduction Into aFreestream Flow, Vanderbilt University Depa, oment ofMechanical Engineering, 1971
36. McClung, C. D., 747 Reverser Exhaust Flow Field Test,T6-336, The Boeing Company, 1967
280
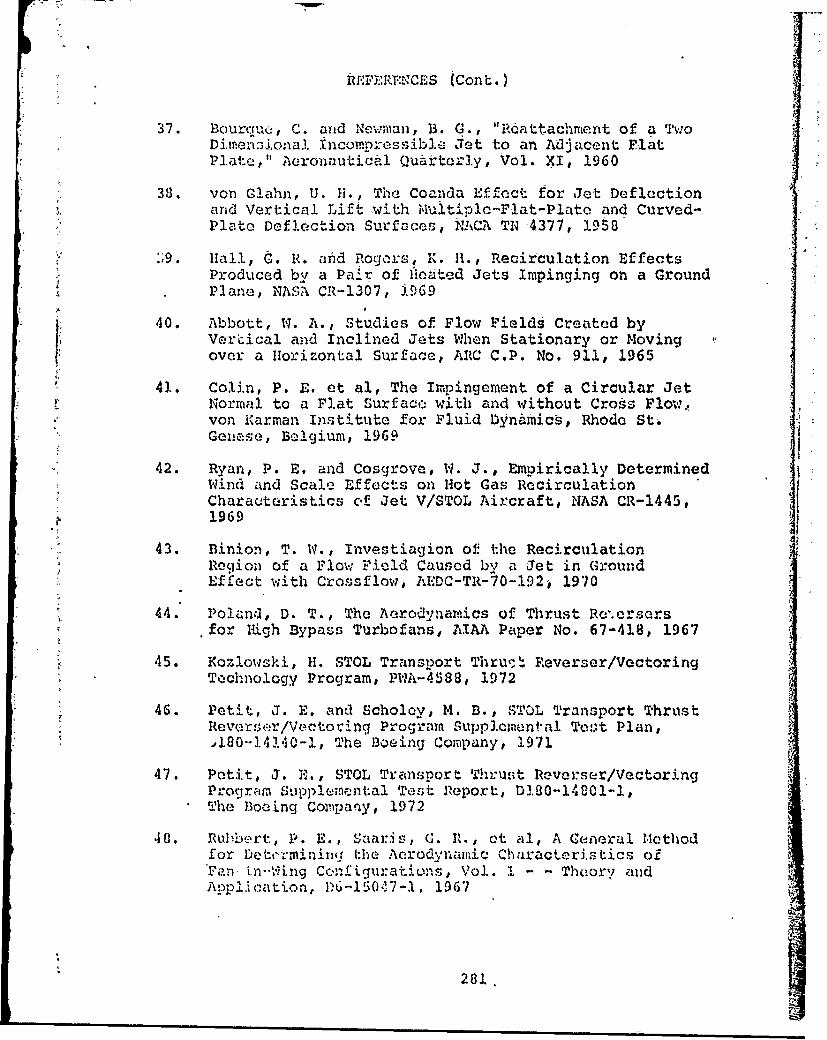
RpF F.', t S... (Con t.
37. llourcrtuw, C. aind Newman, 3. C., "Rdattachnitent of a TwoDimer3ional Incompressi!Abe Jet to an Adjacent FlatPlate," Aeronautical Quarterly, Vol. XI, 1960
38. von Glahn, U. H., The Coanda Effect for Jet Deflectionarid Vertical Lift with Multiple-Flat-Plate and Curved-Plate Deflection Surfaces, NACA T1N 4377, 1958
S.9. Hall, d. R. ahd ogers, X.1 H., Recirculation EffectsProduced by a Pa'r of flolated Jets Impinging on a GroundPlane, NASA CR-1307, 1969
40. Abbott, W. A., Studies of Flow Fields Created byVeriical and Inclined Jets When Stationary or Movingover a IIorizontal Surface, ARC C.P. No. 911, 1965
41. Colin, P. E. et al, The Impingement of a Circular JetNormal to a Flat Surface: with and without Cross Flowt,von Karman Institute for Fluid Dyn&mics, Rhode St.Genese, Belgium, 1969
42. Ryan, P. E. and Cosgrove, 1. J., Empirically DeterminedWind and Scal_ Effects on Hot Gas RecirculationCharacteristics o'f Jet V/STOL Aircraft, NASA CR-1445,1969
43, Binion, T. W., Investiagion of the RecirculationRegion of a Flow Field Caused by a Jet in GroundEffect with Crossflow, AEDC-TR-70-192, 1970
44. Poland, D. T., The Aerodynamics of Thrust Re.crsers*for High Bypass Turbofans, AIAA Paper No. 67-418, 1967
45. Kozlowski, 11. STOL Transport Thru, . Reverser/VoctoringTochnolGgy Program, PWA-4588, 1972
46. Petit, J. E. and Scholey, M. B., STOL Transport ThrustReveersor/Vector-ing Progaram Supplemental Toe.t Plan,
,180-14140-1, The Boeing Company, 1971
47. Petit, J. E., STOL Transport Thruust Revarser/VectoringProgram Supplemental Test Report, D180-14801-1,The Boeing Compaqy, 1972
M8. Ru)xbert, P. E., Saair's, G. R., ot al, A Ceneral Methodfor Detb-Cmining, the Aerodynamic ,haracteris tlcs ofFan- iLn-1.ing cngfivurations, Vol. 1 - - Theor,! andAppl.ication, D6-150-17-1, 1967
281