multispectral image alignment using a three channel ... · multispectral image alignment using a...
TRANSCRIPT
Multispectral image alignment using a three channel endoscope in vivo during minimally
invasive surgery Neil T. Clancy,1,2* Danail Stoyanov,3 David R. C. James,1,2 Aimee Di Marco,1,2 Vincent
Sauvage,1,2 James Clark,1,2 Guang-Zhong Yang,1,4 and Daniel S. Elson1,2 1Hamlyn Centre for Robotic Surgery, Institute of Global Health Innovation, Imperial College London, SW7 2AZ, UK
2Department of Surgery and Cancer, Imperial College London, SW7 2AZ, UK 3Centre for Medical Image Computing, Department of Computer Science, University College London, WC1E 6BT,
UK 4Department of Computing, Imperial College London, SW7 2AZ, UK
Abstract: Sequential multispectral imaging is an acquisition technique that involves collecting images of a target at different wavelengths, to compile a spectrum for each pixel. In surgical applications it suffers from low illumination levels and motion artefacts. A three-channel rigid endoscope system has been developed that allows simultaneous recording of stereoscopic and multispectral images. Salient features on the tissue surface may be tracked during the acquisition in the stereo cameras and, using multiple camera triangulation techniques, this information used to align the multispectral images automatically even though the tissue or camera is moving. This paper describes a detailed validation of the set-up in a controlled experiment before presenting the first in vivo use of the device in a porcine minimally invasive surgical procedure. Multispectral images of the large bowel were acquired and used to extract the relative concentration of haemoglobin in the tissue despite motion due to breathing during the acquisition. Using the stereoscopic information it was also possible to overlay the multispectral information on the reconstructed 3D surface. This experiment demonstrates the ability of this system for measuring blood perfusion changes in the tissue during surgery and its potential use as a platform for other sequential imaging modalities. © 2012 Optical Society of America OCIS codes: (170.2150) Endoscopic imaging; (170.3010) Image reconstruction techniques; (170.6510) Spectroscopy, tissue diagnostics.
References and links 1. M. A. Ilias, E. Häggblad, C. Anderson, and E. G. Salerud, “Visible, hyperspectral imaging evaluating the
cutaneous response to ultraviolet radiation,” Proc. SPIE 6441, 644103 (2007). 2. B. S. Sorg, B. J. Moeller, O. Donovan, Y. Cao, and M. W. Dewhirst, “Hyperspectral imaging of hemoglobin
saturation in tumor microvasculature and tumor hypoxia development,” J. Biomed. Opt. 10(4), 044004 (2005). 3. S. P. Nighswander-Rempel, R. Anthony Shaw, J. R. Mansfield, M. Hewko, V. V. Kupriyanov, and H. H.
Mantsch, “Regional variations in myocardial tissue oxygenation mapped by near-infrared spectroscopic imaging,” J. Mol. Cell. Cardiol. 34(9), 1195–1203 (2002).
4. M. G. Sowa, J. R. Payette, M. D. Hewko, and H. H. Mantsch, “Visible-near infrared multispectral imaging of the rat dorsal skin flap,” J. Biomed. Opt. 4(4), 474–481 (1999).
5. R. T. Bryan, L. J. Billingham, and D. M. A. Wallace, “Narrow-band imaging flexible cystoscopy in the detection of recurrent urothelial cancer of the bladder,” BJU Int. 101(6), 702–706 (2008).
6. J. H. Takano, T. Yakushiji, I. Kamiyama, T. Nomura, A. Katakura, N. Takano, and T. Shibahara, “Detecting early oral cancer: narrowband imaging system observation of the oral mucosa microvasculature,” Int. J. Oral Maxillofac. Surg. 39(3), 208–213 (2010).
7. H. C. Wolfsen, J. E. Crook, M. Krishna, S. R. Achem, K. R. Devault, E. P. Bouras, D. S. Loeb, M. E. Stark, T. A. Woodward, L. L. Hemminger, F. K. Cayer, and M. B. Wallace, “Prospective, controlled tandem endoscopy study of narrow band imaging for dysplasia detection in Barrett’s Esophagus,” Gastroenterology 135(1), 24–31 (2008).
(C) 2012 OSA 1 October 2012 / Vol. 3, No. 10 / BIOMEDICAL OPTICS EXPRESS 2567#170747 - $15.00 USD Received 18 Jun 2012; rev. 7 Sep 2012; accepted 11 Sep 2012; published 14 Sep 2012

8. V. X. D. Yang, P. J. Muller, P. Herman, and B. C. Wilson, “A multispectral fluorescence imaging system: design and initial clinical tests in intra-operative Photofrin-photodynamic therapy of brain tumors,” Lasers Surg. Med. 32(3), 224–232 (2003).
9. L. Zhou and W. S. El-Deiry, “Multispectral fluorescence imaging,” J. Nucl. Med. 50(10), 1563–1566 (2009). 10. J. Qi, C. Barrière, T. C. Wood, and D. S. Elson, “Polarized multispectral imaging in a rigid endoscope based on
elastic light scattering spectroscopy,” Biomed. Opt. Express 3(9), 2087–2099 (2012). 11. P. K. Frykman, E. H. Lindsley, M. Gaon, and D. L. Farkas, “Spectral imaging for precise surgical intervention in
Hirschsprung’s disease,” J Biophotonics 1(2), 97–103 (2008). 12. N. T. Clancy, V. Sauvage, S. Saso, D. Stoyanov, D. J. Corless, M. Boyd, D. E. Noakes, G.-Z. Yang, S. Ghaem-
Maghami, J. R. Smith, and D. S. Elson, “Registration and analysis of multispectral images acquired during uterine transplantation surgery,” in Biomedical Optics and 3D Imaging, Technical Digest (CD) (Optical Society of America, 2012), paper BSu3A.73.
13. S. L. Best, A. Thapa, M. J. Holzer, N. Jackson, S. A. Mir, J. A. Cadeddu, and K. J. Zuzak, “Minimal arterial in-flow protects renal oxygenation and function during porcine partial nephrectomy: confirmation by hyperspectral imaging,” Urology 78(4), 961–966 (2011).
14. K. J. Zuzak, S. C. Naik, G. Alexandrakis, D. Hawkins, K. Behbehani, and E. H. Livingston, “Intraoperative bile duct visualization using near-infrared hyperspectral video imaging,” Am. J. Surg. 195(4), 491–497 (2008).
15. S. P. Nighswander-Rempel, R. A. Shaw, V. V. Kupriyanov, J. Rendell, B. Xiang, and H. H. Mantsch, “Mapping tissue oxygenation in the beating heart with near-infrared spectroscopic imaging,” Vib. Spectrosc. 32(1), 85–94 (2003).
16. L. Gao, R. T. Kester, N. Hagen, and T. S. Tkaczyk, “Snapshot Image Mapping Spectrometer (IMS) with high sampling density for hyperspectral microscopy,” Opt. Express 18(14), 14330–14344 (2010).
17A. Gorman, D. W. Fletcher-Holmes, and A. R. Harvey, “Generalization of the Lyot filter and its application to snapshot spectral imaging,” Opt. Express 18(6), 5602–5608 (2010).
18. R. Leitner, M. De Biasio, T. Arnold, C. Viet Dinh, M. Loog, and R. P. W. Duin, “Multi-spectral video endoscopy system for the detection of cancerous tissue,” Pattern Recognit. Lett. (to be published).
19. G. N. Stamatas, M. Southall, and N. Kollias, “In vivo monitoring of cutaneous edema using spectral imaging in the visible and near infrared,” J. Invest. Dermatol. 126(8), 1753–1760 (2006).
20. D. Stoyanov, A. Rayshubskiy, and E. Hillman, “Robust registration of multispectral images of the cortical surface in neurosurgery,” in Proceedings of 9th IEEE International Symposium on Biomedical Imaging (Institute of Electrical and Electronic Engineers, Barcelona, 2012), pp. 1643–1646.
21. K. J. Zuzak, S. C. Naik, G. Alexandrakis, D. Hawkins, K. Behbehani, and E. H. Livingston, “Characterization of a near-infrared laparoscopic hyperspectral imaging system for minimally invasive surgery,” Anal. Chem. 79(12), 4709–4715 (2007).
22. N. T. Clancy, D. Stoyanov, V. Sauvage, D. R. C. James, G.-Z. Yang, and D. S. Elson, “A Triple Endoscope System for Alignment of Multispectral Images of Moving Tissue,” in Biomedical Optics, Technical Digest (CD) (Optical Society of America, 2010), paper BTuD27.
23. D. Stoyanov, A. Darzi, and G.-Z. Yang, “Dense 3D depth recovery for soft tissue deformation during robotically assisted laparoscopic surgery,” in MICCAI, C. Barillot, D. R. Haynor, and P. Hellier, eds. (Springer-Verlag, Rennes/Saint-Malo, France, 2004), pp. 41–48.
24. D. Stoyanov, G. P. Mylonas, F. Deligianni, A. Darzi, and G.-Z. Yang, “Soft-tissue motion tracking and structure estimation for robotic assisted MIS procedures,” in MICCAI, J. Duncan, and G. Gerig, eds. (Springer-Verlag, Palm Springs, USA, 2005), pp. 139–146.
25. D. Stoyanov and G.-Z. Yang, “Stabilization of image motion for robotic assisted beating heart surgery,” in MICCAI'07 Proceedings of the 10th international conference on Medical image computing and computer-assisted intervention, N. Ayache, S. Ourselin, and A. Maeder, eds. (Springer-Verlag, Brisbane, Australia, 2007), Vol. 1, Part I, pp. 417–424.
26. R. Hartley and A. Zisserman, Multiple View Geometry in Computer Vision (Cambridge University Press, 2000). 27. Z. Zhang, “A flexible new technique for camera calibration,” IEEE Trans. Pattern Anal. 22(11), 1330–1334
(2000). 28. D. Scharstein and R. Szeliski, “A taxonomy and evaluation of dense two-frame stereo correspondence
algorithms,” Int. J. Comput. Vis. 47(1/3), 7–42 (2002). 29. S. A. Prahl, “Tabulated molar extinction coefficient for hemoglobin in water” (Oregon Medical Laser Center,
2009), http://omlc.ogi.edu/spectra/hemoglobin/summary.html 30. K. J. Zuzak, M. D. Schaeberle, M. T. Gladwin, R. O. I. Cannon 3rd, and I. W. Levin, “Noninvasive
determination of spatially resolved and time-resolved tissue perfusion in humans during nitric oxide inhibition and inhalation by use of a visible-reflectance hyperspectral imaging technique,” Circulation 104(24), 2905–2910 (2001).
31. D. R. C. James, V. Sauvage, N. T. Clancy, J. Clark, A. W. Darzi, G.-Z. Yang, and D. S. Elson, “Towards intra operative diagnosis of mesenteric oxygenation with hyperspectral imaging,” presented at the Society of American Gastrointestinal and Endoscopic Surgeons (SAGES) 12th World Congress of Endoscopic Surgery, National Harbour, Maryland, USA. 2010.
32. V. Sauvage, D. James, K. Koh, T. Wood, and D. S. Elson, “Development of a hyperspectral laparoscope system for intraoperative diagnosis of intestinal ischemia,” Proc. SPIE 7555, 7555-8 (2010).
33. D. Yudovsky, A. Nouvong, and L. Pilon, “Hyperspectral imaging in diabetic foot wound care,” J. Diabetes Sci. Tech. 4(5), 1099–1113 (2010).
(C) 2012 OSA 1 October 2012 / Vol. 3, No. 10 / BIOMEDICAL OPTICS EXPRESS 2568#170747 - $15.00 USD Received 18 Jun 2012; rev. 7 Sep 2012; accepted 11 Sep 2012; published 14 Sep 2012
34. J. R. Payette, E. Kohlenberg, L. Leonardi, A. Pabbies, P. Kerr, K.-Z. Liu, and M. G. Sowa, “Assessment of skin flaps using optically based methods for measuring blood flow and oxygenation,” Plast. Reconstr. Surg. 115(2), 539–546 (2005).
35. C. R. Tracy, J. D. Terrell, R. P. Francis, E. F. Wehner, J. Smith, M. Litorja, D. L. Hawkins, M. S. Pearle, J. A. Cadeddu, and K. J. Zuzak, “Characterization of renal ischemia using DLP hyperspectral imaging: a pilot study comparing artery-only occlusion versus artery and vein occlusion,” J. Endourol. 24(3), 321–325 (2010).
36. J. M. Bland and D. G. Altman, “Statistical methods for assessing agreement between two methods of clinical measurement,” Lancet 327 (8476), 307–310 (1986).
37. M. B. Bouchard, B. R. Chen, S. A. Burgess, and E. M. C. Hillman, “Ultra-fast multispectral optical imaging of cortical oxygenation, blood flow, and intracellular calcium dynamics,” Opt. Express 17(18), 15670–15678 (2009).
38. H. Akbari, L. V. Halig, D. M. Schuster, A. Osunkoya, V. Master, P. T. Nieh, G. Z. Chen, and B. Fei, “Hyperspectral imaging and quantitative analysis for prostate cancer detection,” J. Biomed. Opt. 17(7), 076005 (2012).
1. Introduction
Sequential imaging techniques are commonly used to detect changes in the spatial distribution of various molecules and biological materials. For example, chromophores such as haemoglobin [1–3], melanin and water [4] may be detected using multispectral imaging, the closely related technique of narrowband imaging can also allow cancer detection in flexible endoscopy [5–7], multispectral fluorescence imaging can indicate molecular targeting [8,9], and areas of differing cell density can be identified using polarisation imaging [10]. These techniques are based on the acquisition of multiple images of a sample at different wavelengths and/or polarisation states so that a complete spectrum can be built up for each pixel. The changing spectral features of interest can then be followed using a suitable mathematical model of light interaction with the tissue and chromophores of interest. These techniques have potential surgical applications in real-time determination of tissue oxygenation, aiding the diagnosis of mesenteric ischaemia. Alternatively, they may also prove useful in other applications of multispectral imaging, such as detection of Hirschsprung’s disease [11], transplanted organ viability [12,13], or visualisation of the bile duct [14].
The acquisition of a stack of multispectral images may take several hundred milliseconds or longer, depending on the exposure time of the camera, the number of wavelengths required and the switching time of the filter. During endoscopic investigation or surgery the camera and tissue may also change position, orientation and shape during the acquisition, since the surgeon holds the endoscope, the patient breathes and peristalsis occurs. This poses a problem for this technique, as the multispectral image stack must be aligned in order to extract information on the spatial variation in chromophore concentration. To deal with the motion problem, a number of solutions have been proposed including gating of image acquisition to the cardiac cycle using ECG [15]. However, this approach is not suitable for tissues where the dominant source of motion may be a less predictable source such as those mentioned earlier. Alternatively, ‘snapshot’ systems exist which aim to capture all the wavelength data simultaneously using a Wollaston prism or image slicer, and a large format CCD [16,17]. While these systems overcome the motion problem, they do so at the expense of spatial resolution and are incompatible with some sequential imaging modalities such as polarisation imaging.
As a result of movement, motion blur, featureless tissue sites and low brightness in certain spectral ranges, accurate registration of the multispectral images becomes a challenging and time-consuming task. Previous work on the registration of hyperspectral images has involved the use of information contained in the stack itself to perform the alignment. Affine transformation methods such as the scale-invariant feature transform (SIFT) work by randomly choosing a set of feature points in an image and looking for correspondences within a reference image [18]. In an iterative process, false correspondences are eliminated and a suitable transform estimated assuming that there is no deformation. Other rigid transformation methods have detected differences between images in shift, rotation and scaling in the Fourier domain which could then be mapped to movement in a polar coordinate system [19]. To account for non-affine transformations that are more likely in a surgical scene, nonlinear methods such as those based on optical flow (Lucas-Kanade algorithm) have also been used,
(C) 2012 OSA 1 October 2012 / Vol. 3, No. 10 / BIOMEDICAL OPTICS EXPRESS 2569#170747 - $15.00 USD Received 18 Jun 2012; rev. 7 Sep 2012; accepted 11 Sep 2012; published 14 Sep 2012

which assume that motion of the tissue is homogenous in the local neighbourhood of a pixel of interest. Thus, patches rather than points are tracked between the test image and the reference to create a deformation field which can be used to correct the non-rigid transformation [18]. However, these methods do not take into account the wavelength-dependent reflectivity of biological tissue and that features, such as blood vessels, detected in the blue end of the spectrum, may be invisible at the red end. Also, while good results were demonstrated for non-biological test objects, a truly laparoscopic in vivo demonstration was not shown. Other recent progress in multispectral image registration techniques during in vivo surgical procedures have shown that it is possible to align a stack of images by tracking sparse salient features and reduce the problem of wavelength-dependent features by propagating the solution from image to image [12,20]. However, this still finds limitations when applied across the entire visible spectrum (400-700 nm), for far red wavelengths where blood vessels are no longer visible, or for short blue wavelengths, where optical throughput is low and images may be noisy.
Current multispectral systems designed for laparoscopic use are either based on a single image channel laparoscope [21] with the white light imaging that the surgeon uses for navigation in a separate scope, or alternatively, a single endoscope may be used and the modality switched between white light and multispectral imaging. However, locating a particular tissue site and maintaining the position of the multispectral laparoscope becomes a challenge due to the lower acquisition speeds of multispectral systems and the lack of spatial/colour cues that would normally be observed in the white light images.
In this paper, a new trinocular system is described in detail, building on initial results presented recently [22], that combines colour stereoscopic viewing and multispectral imaging in a single rigid endoscope and simplifies navigation and identification of tissues of interest during a porcine laparoscopic procedure. The stereo views are used to reconstruct the surface structure of the tissue, track features as they move, and use this information to automatically align the multispectral images via back-projection in 3D space. The calibration procedure for the endoscope’s three channels is outlined, so that the mathematical relationships between the three channels in 3D can be defined. The reconstruction, alignment and ability to extract multispectral data are validated in an experiment using a phantom target (standard colour checker card). Data acquired with the system, during a minimally invasive surgical (MIS) procedure to examine the porcine large bowel, is presented in an initial clinical experiment to examine the possibility of following mesenteric perfusion in vivo with a view to detecting ischaemia. This is a significant medical problem due to the ambiguity of associated clinical signs and the lack of a suitable modality capable of immediate intra-operative diagnosis (the current ‘gold standards’ are mucosal biopsy and tissue histology, which may take several days to become available). Specific clinical scenarios in which a quantitative knowledge of mesenteric oxygenation would be beneficial include the assessment of the bowel at the site of anastomosis following colonic resection. Reduced blood supply to the anastomosis is a risk factor for anastomotic dehiscence (breakdown) which is associated with high morbidity and mortality. Also, during emergency surgery for bowel ischaemia knowledge of the tissue oxygenation could aid assessments of viability and therefore decision-making on how much bowel to resect and whether to perform a primary anastomosis or a stoma. The results of the first in vivo test of the trinocular system show that multispectral processing techniques are applied to gather information on mesenteric haemoglobin concentration despite the hurdles of motion artefacts and low light transmission.
2. Materials and methods
The imaging system is built on a customised trinocular (three channel) rigid endoscope (Intuitive Surgical, Inc., Sunnyvale, USA) with computer vision techniques developed for image alignment.
(C) 2012 OSA 1 October 2012 / Vol. 3, No. 10 / BIOMEDICAL OPTICS EXPRESS 2570#170747 - $15.00 USD Received 18 Jun 2012; rev. 7 Sep 2012; accepted 11 Sep 2012; published 14 Sep 2012
2.1. Three channel endoscope
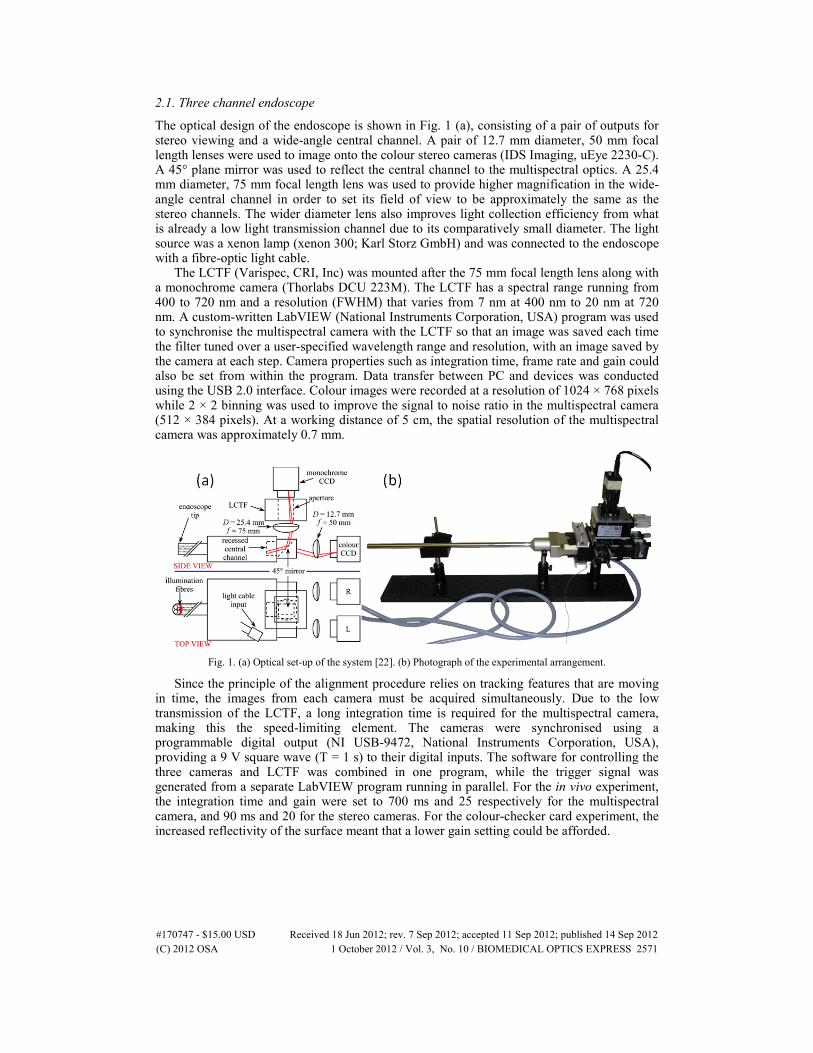
The optical design of the endoscope is shown in Fig. 1 (a), consisting of a pair of outputs for stereo viewing and a wide-angle central channel. A pair of 12.7 mm diameter, 50 mm focal length lenses were used to image onto the colour stereo cameras (IDS Imaging, uEye 2230-C). A 45° plane mirror was used to reflect the central channel to the multispectral optics. A 25.4 mm diameter, 75 mm focal length lens was used to provide higher magnification in the wide-angle central channel in order to set its field of view to be approximately the same as the stereo channels. The wider diameter lens also improves light collection efficiency from what is already a low light transmission channel due to its comparatively small diameter. The light source was a xenon lamp (xenon 300; Karl Storz GmbH) and was connected to the endoscope with a fibre-optic light cable.
The LCTF (Varispec, CRI, Inc) was mounted after the 75 mm focal length lens along with a monochrome camera (Thorlabs DCU 223M). The LCTF has a spectral range running from 400 to 720 nm and a resolution (FWHM) that varies from 7 nm at 400 nm to 20 nm at 720 nm. A custom-written LabVIEW (National Instruments Corporation, USA) program was used to synchronise the multispectral camera with the LCTF so that an image was saved each time the filter tuned over a user-specified wavelength range and resolution, with an image saved by the camera at each step. Camera properties such as integration time, frame rate and gain could also be set from within the program. Data transfer between PC and devices was conducted using the USB 2.0 interface. Colour images were recorded at a resolution of 1024 × 768 pixels while 2 × 2 binning was used to improve the signal to noise ratio in the multispectral camera (512 × 384 pixels). At a working distance of 5 cm, the spatial resolution of the multispectral camera was approximately 0.7 mm.
Fig. 1. (a) Optical set-up of the system [22]. (b) Photograph of the experimental arrangement.
Since the principle of the alignment procedure relies on tracking features that are moving in time, the images from each camera must be acquired simultaneously. Due to the low transmission of the LCTF, a long integration time is required for the multispectral camera, making this the speed-limiting element. The cameras were synchronised using a programmable digital output (NI USB-9472, National Instruments Corporation, USA), providing a 9 V square wave (T = 1 s) to their digital inputs. The software for controlling the three cameras and LCTF was combined in one program, while the trigger signal was generated from a separate LabVIEW program running in parallel. For the in vivo experiment, the integration time and gain were set to 700 ms and 25 respectively for the multispectral camera, and 90 ms and 20 for the stereo cameras. For the colour-checker card experiment, the increased reflectivity of the surface meant that a lower gain setting could be afforded.
(C) 2012 OSA 1 October 2012 / Vol. 3, No. 10 / BIOMEDICAL OPTICS EXPRESS 2571#170747 - $15.00 USD Received 18 Jun 2012; rev. 7 Sep 2012; accepted 11 Sep 2012; published 14 Sep 2012

2.2. Stereo reconstruction and multispectral projection
In this paper, a number of computer vision techniques developed for 3D reconstruction using stereoscopic cameras [23] and tracking the motion of tissue in vivo [24,25] are combined to aid alignment of the multispectral images and visualisation of the processed data [22].
Each camera was geometrically modelled using the pinhole projection model [26], mapping points in 3D space, M = [X Y Z] onto each image plane in pixel coordinates m = [x y] as a matrix multiplication:
[ | ] , [ | ] , [ | ] .L L R R R R M M M Mt t t t t t= = =m K I 0 M m K R t M m K R t M (1)
The intrinsic camera model parameters, K, for each camera were determined with a photogrammetry-based technique using multiple views of a planar calibration object of known dimensions [27]. The pose of each camera, described by a rotation matrix R and translation vector t, with respect to a reference coordinate system (taken as the left camera) could also be computed during the calibration process. Thus, with a fully calibrated system, the mathematical relationship between common features in each camera is characterised and the projection of 3D tissue surface points onto the 2D image planes of the cameras can be readily performed using the derived matrix multiplication factors. An illustration of this geometric relationship is shown in Fig. 2.
Fig. 2. Illustration of trinocular endoscope imaging geometry. Geometric calibration of the system means that image points in the left and right white light images can be used to triangulate the 3D position of points on the tissue surface. These can then be reprojected into multispectral image coordinates. We track the motion of points in the white light images as these have consistent light appearance and we use the reprojection capability of the calibrated system to maintain a track of the respective region in the multispectral image.
By matching image primitives across the multiple views acquired with the system, it was possible to quantitatively recover the 3D structure of the subject by triangulating line-of-sight rays, q, from the two white light channels as shown in Fig. 2 [28]. The triangulation process involves a least squares solution by rearranging the equations for the left and right projection from Eq. (1). For soft-tissue undergoing deformation, the 3D motion of the surface could be determined by tracking surface points [23] or a geometric surface parameterisation [24].
2.2.1 Feature tracking and image alignment
The main processing steps for each image triplet are summarised in Fig. 3. After the cameras have been calibrated, the surface shape of the object (phantom, in vivo tissue) under investigation is reconstructed by triangulating corresponding features in each of the stereo
(C) 2012 OSA 1 October 2012 / Vol. 3, No. 10 / BIOMEDICAL OPTICS EXPRESS 2572#170747 - $15.00 USD Received 18 Jun 2012; rev. 7 Sep 2012; accepted 11 Sep 2012; published 14 Sep 2012

views using the geometry shown in Fig. 2. Once this is done, the position of these features, which are selected based on intensity gradient information, can be tracked in time over the full set of images by employing stereo-temporal constraints using a stereoscopic variant of the Lucas-Kanade algorithm [25].
Fig. 3. Image processing algorithm schematic. The raw image stacks are acquired simultaneously using the synchronised endoscope cameras. Features are identified and tracked in 3D throughout the image stack. The transformations needed to align these features are derived and implemented. Each feature is then projected through 3D space onto the multispectral camera using the calibration relations, so that they are automatically aligned in the multispectral 2D images. These can then be processed to extract the reflectance spectrum at each pixel location over the stack and compute relative concentrations of chromophores of interest. The processed image may then be reprojected onto 3D space to aid visualisation.
Once the location of corresponding 3D features are identified over the full set of images (across time and the stereo pair), a function may be derived that maps each point onto a reference image (the first image acquired in the series) by using the calibration information with Eq. (1) and the temporal correspondence of the points. Using the calibration matrix multiplications, these features can then be back-projected from 3D space to the multispectral image plane, aligning each of these images automatically. The chief advantage of this procedure is that the algorithm only requires the feature information from the sharp, full colour stereo images for the alignment. The multispectral images, which can suffer from low light transmission, wavelength-dependent features and motion blur due to the longer integration times required, are automatically aligned using the data from the controlled calibration. Of course, there are limitations and feature tracking can fail in the presence of occlusions due to specular highlights, surgical instruments or dynamic effects such as bleeding. These can potentially be overcome by more complex matching strategies and motion modelling predicting physiological tissue motions, however, this was beyond the scope of our current study.
Furthermore, for subjects with a known geometric structure, such as planes, the multispectral images can also be warped using projective transformations such as homographies [26] in order to fully align a stack of images. This technique is first used in a proof-of-concept experiment, where a planar object is moving with respect to the endoscope. Subsequent to this, the first in vivo results obtained with the system are presented, in which an arbitrary tissue surface was imaged.
2.3. Multispectral processing
Once the images from the multispectral channel are aligned, it is possible to process them and extract the reflectance spectra of the tissue of interest. The absorbance spectrum at each pixel is calculated by taking the logarithm of the ratio of reflected intensity from the sample (IS) to
(C) 2012 OSA 1 October 2012 / Vol. 3, No. 10 / BIOMEDICAL OPTICS EXPRESS 2573#170747 - $15.00 USD Received 18 Jun 2012; rev. 7 Sep 2012; accepted 11 Sep 2012; published 14 Sep 2012
that from a reflectance standard (Specralon; Labsphere, Inc., USA) (IR):
log ,S D
R D
I IA
I I −
= − − (2)
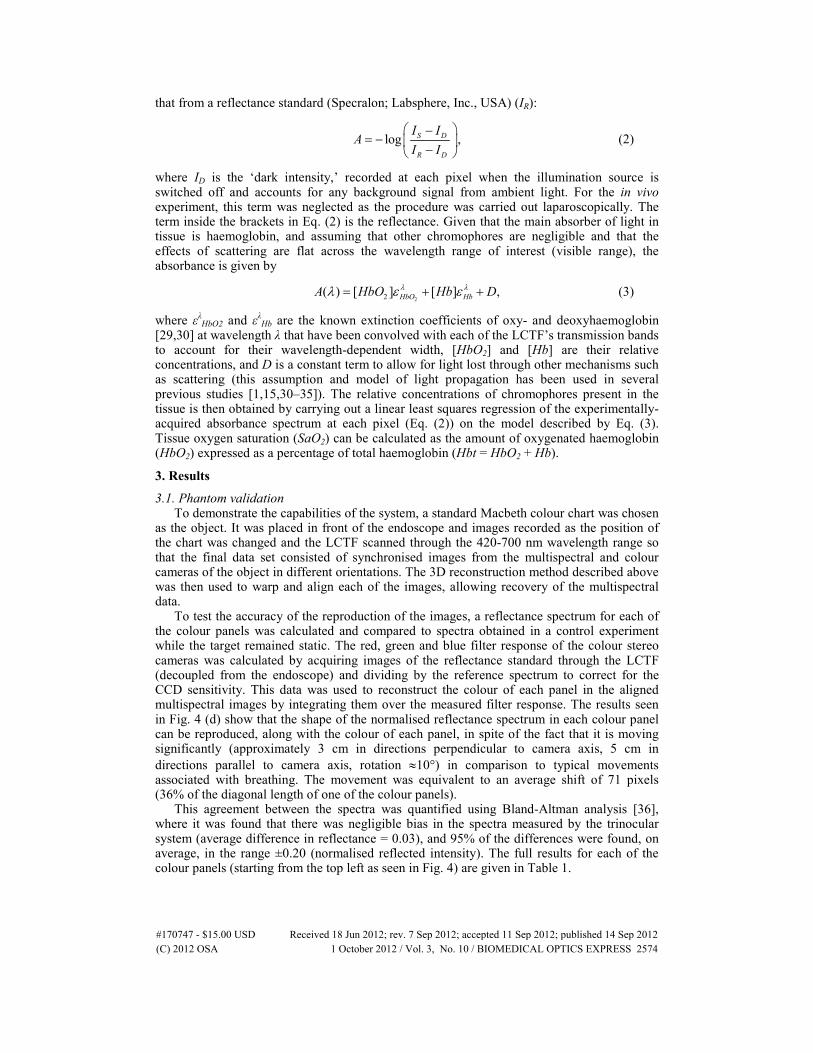
where ID is the ‘dark intensity,’ recorded at each pixel when the illumination source is switched off and accounts for any background signal from ambient light. For the in vivo experiment, this term was neglected as the procedure was carried out laparoscopically. The term inside the brackets in Eq. (2) is the reflectance. Given that the main absorber of light in tissue is haemoglobin, and assuming that other chromophores are negligible and that the effects of scattering are flat across the wavelength range of interest (visible range), the absorbance is given by
22( ) [ ] [ ] ,HbO HbA HbO Hb Dλ λλ ε ε= + + (3)
where ελHbO2 and ελHb are the known extinction coefficients of oxy- and deoxyhaemoglobin [29,30] at wavelength λ that have been convolved with each of the LCTF’s transmission bands to account for their wavelength-dependent width, [HbO2] and [Hb] are their relative concentrations, and D is a constant term to allow for light lost through other mechanisms such as scattering (this assumption and model of light propagation has been used in several previous studies [1,15,30–35]). The relative concentrations of chromophores present in the tissue is then obtained by carrying out a linear least squares regression of the experimentally-acquired absorbance spectrum at each pixel (Eq. (2)) on the model described by Eq. (3). Tissue oxygen saturation (SaO2) can be calculated as the amount of oxygenated haemoglobin (HbO2) expressed as a percentage of total haemoglobin (Hbt = HbO2 + Hb).
3. Results
3.1. Phantom validation To demonstrate the capabilities of the system, a standard Macbeth colour chart was chosen
as the object. It was placed in front of the endoscope and images recorded as the position of the chart was changed and the LCTF scanned through the 420-700 nm wavelength range so that the final data set consisted of synchronised images from the multispectral and colour cameras of the object in different orientations. The 3D reconstruction method described above was then used to warp and align each of the images, allowing recovery of the multispectral data.
To test the accuracy of the reproduction of the images, a reflectance spectrum for each of the colour panels was calculated and compared to spectra obtained in a control experiment while the target remained static. The red, green and blue filter response of the colour stereo cameras was calculated by acquiring images of the reflectance standard through the LCTF (decoupled from the endoscope) and dividing by the reference spectrum to correct for the CCD sensitivity. This data was used to reconstruct the colour of each panel in the aligned multispectral images by integrating them over the measured filter response. The results seen in Fig. 4 (d) show that the shape of the normalised reflectance spectrum in each colour panel can be reproduced, along with the colour of each panel, in spite of the fact that it is moving significantly (approximately 3 cm in directions perpendicular to camera axis, 5 cm in directions parallel to camera axis, rotation ≈10°) in comparison to typical movements associated with breathing. The movement was equivalent to an average shift of 71 pixels (36% of the diagonal length of one of the colour panels).
This agreement between the spectra was quantified using Bland-Altman analysis [36], where it was found that there was negligible bias in the spectra measured by the trinocular system (average difference in reflectance = 0.03), and 95% of the differences were found, on average, in the range ±0.20 (normalised reflected intensity). The full results for each of the colour panels (starting from the top left as seen in Fig. 4) are given in Table 1.
(C) 2012 OSA 1 October 2012 / Vol. 3, No. 10 / BIOMEDICAL OPTICS EXPRESS 2574#170747 - $15.00 USD Received 18 Jun 2012; rev. 7 Sep 2012; accepted 11 Sep 2012; published 14 Sep 2012
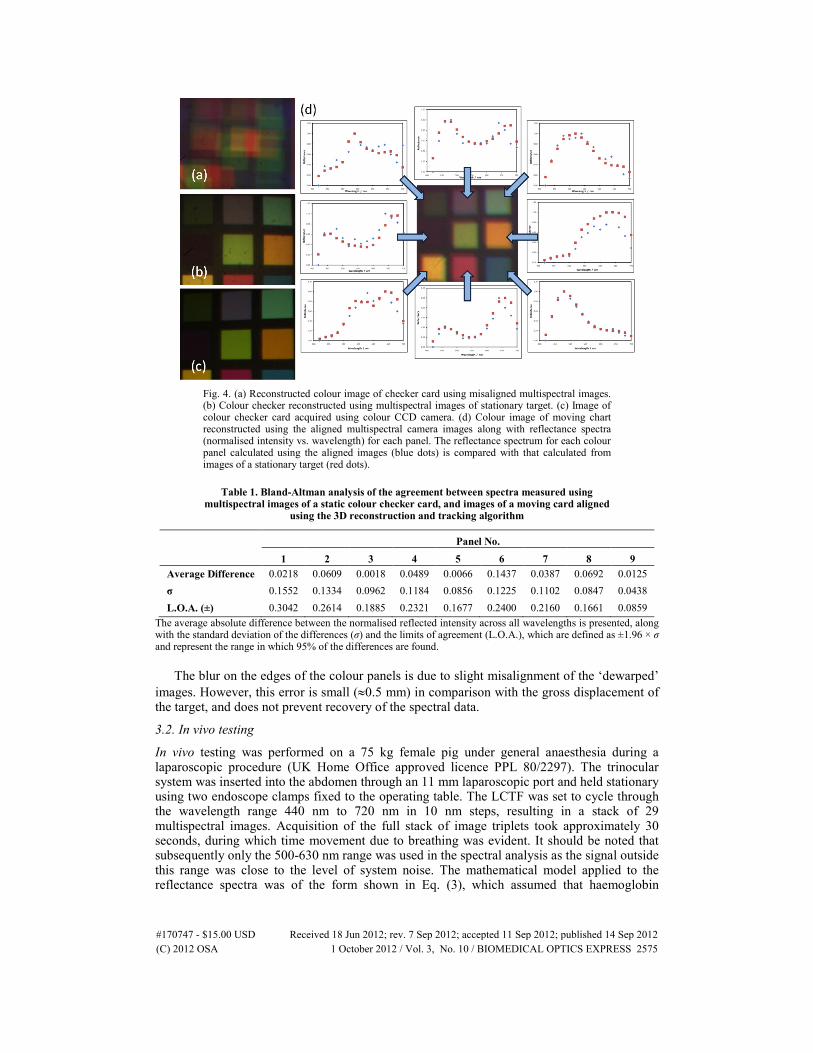
Fig. 4. (a) Reconstructed colour image of checker card using misaligned multispectral images. (b) Colour checker reconstructed using multispectral images of stationary target. (c) Image of colour checker card acquired using colour CCD camera. (d) Colour image of moving chart reconstructed using the aligned multispectral camera images along with reflectance spectra (normalised intensity vs. wavelength) for each panel. The reflectance spectrum for each colour panel calculated using the aligned images (blue dots) is compared with that calculated from images of a stationary target (red dots).
Table 1. Bland-Altman analysis of the agreement between spectra measured using multispectral images of a static colour checker card, and images of a moving card aligned
using the 3D reconstruction and tracking algorithm
Panel No.
1 2 3 4 5 6 7 8 9 Average Difference 0.0218 0.0609 0.0018 0.0489 0.0066 0.1437 0.0387 0.0692 0.0125 σ 0.1552 0.1334 0.0962 0.1184 0.0856 0.1225 0.1102 0.0847 0.0438 L.O.A. (±) 0.3042 0.2614 0.1885 0.2321 0.1677 0.2400 0.2160 0.1661 0.0859
The average absolute difference between the normalised reflected intensity across all wavelengths is presented, along with the standard deviation of the differences (σ) and the limits of agreement (L.O.A.), which are defined as ±1.96 × σ and represent the range in which 95% of the differences are found.
The blur on the edges of the colour panels is due to slight misalignment of the ‘dewarped’ images. However, this error is small (≈0.5 mm) in comparison with the gross displacement of the target, and does not prevent recovery of the spectral data.
3.2. In vivo testing
In vivo testing was performed on a 75 kg female pig under general anaesthesia during a laparoscopic procedure (UK Home Office approved licence PPL 80/2297). The trinocular system was inserted into the abdomen through an 11 mm laparoscopic port and held stationary using two endoscope clamps fixed to the operating table. The LCTF was set to cycle through the wavelength range 440 nm to 720 nm in 10 nm steps, resulting in a stack of 29 multispectral images. Acquisition of the full stack of image triplets took approximately 30 seconds, during which time movement due to breathing was evident. It should be noted that subsequently only the 500-630 nm range was used in the spectral analysis as the signal outside this range was close to the level of system noise. The mathematical model applied to the reflectance spectra was of the form shown in Eq. (3), which assumed that haemoglobin
(C) 2012 OSA 1 October 2012 / Vol. 3, No. 10 / BIOMEDICAL OPTICS EXPRESS 2575#170747 - $15.00 USD Received 18 Jun 2012; rev. 7 Sep 2012; accepted 11 Sep 2012; published 14 Sep 2012

absorption was the only significant attenuator of light. For processing the images and testing the alignment algorithm, small sections or ‘patches’ of an image were assessed individually, each centred on a corresponding feature.
Breathing was the main source of motion during the experiment, but other irregular movements to be compensated for included peristalsis and small variations in the endoscope’s position in its mechanical holder or minor motion of the surgeon’s hand, which was also supporting the device. The movement of a sample patch tracked using the system is shown in Fig. 5. In this case, the factors mentioned above caused displacements of 15-20 mm in the x-y plane. This is illustrated in the attached video files that show tracking of a feature in one of the stereo cameras, for three different patches, alongside multispectral data acquisition (intensity equalised for clarity) before and after alignment (Media 1, Media 2, Media 3). The back-projected locations of the same feature in the raw multispectral images show that the algorithm can track the tissue without depending on salient features. Once this tracking has been accomplished, a simple transformation aligns the image patches so that the tracked feature is matched in the full image series.
Fig. 5. Motion tracking in vivo. The location of the patch is tracked in the colour stereo cameras (right camera; top row). The feature is back-projected onto the multispectral camera (middle row). Multispectral images are aligned using the back-projected feature (bottom row). See Media 1, Media 2, and Media 3.
Once each patch was aligned across all the acquisitions in a particular experiment, the multispectral images were processed by fitting the absorbance at each pixel to the model described by Eq. (3). This resulted in a concentration value for the haemoglobins and the offset value D. Colour images of the tissue in each patch were also reconstructed using the same technique as that used in the phantom validation (Section 3.1). These colour images are shown in Fig. 6 along with maps of Hbt, before and after alignment.
In the raw images (before alignment), the largest blood vessel in the field of view is still visible but is blurred due to motion artefacts. However, after alignment these vessels are more defined and have higher contrast with the surrounding tissue. Smaller blood vessels branching off the side of the large vessel are clearly visible in the aligned images of several patches but are completely averaged out in the raw images. This is further supported by the Hbt maps, which show that the areas of highest blood content correspond to the locations of the vessels after alignment. In the raw images, erroneously high Hbt values are seen in the areas around the large blood vessel and low values in the regions corresponding to the locations of smaller vessels.
(C) 2012 OSA 1 October 2012 / Vol. 3, No. 10 / BIOMEDICAL OPTICS EXPRESS 2576#170747 - $15.00 USD Received 18 Jun 2012; rev. 7 Sep 2012; accepted 11 Sep 2012; published 14 Sep 2012
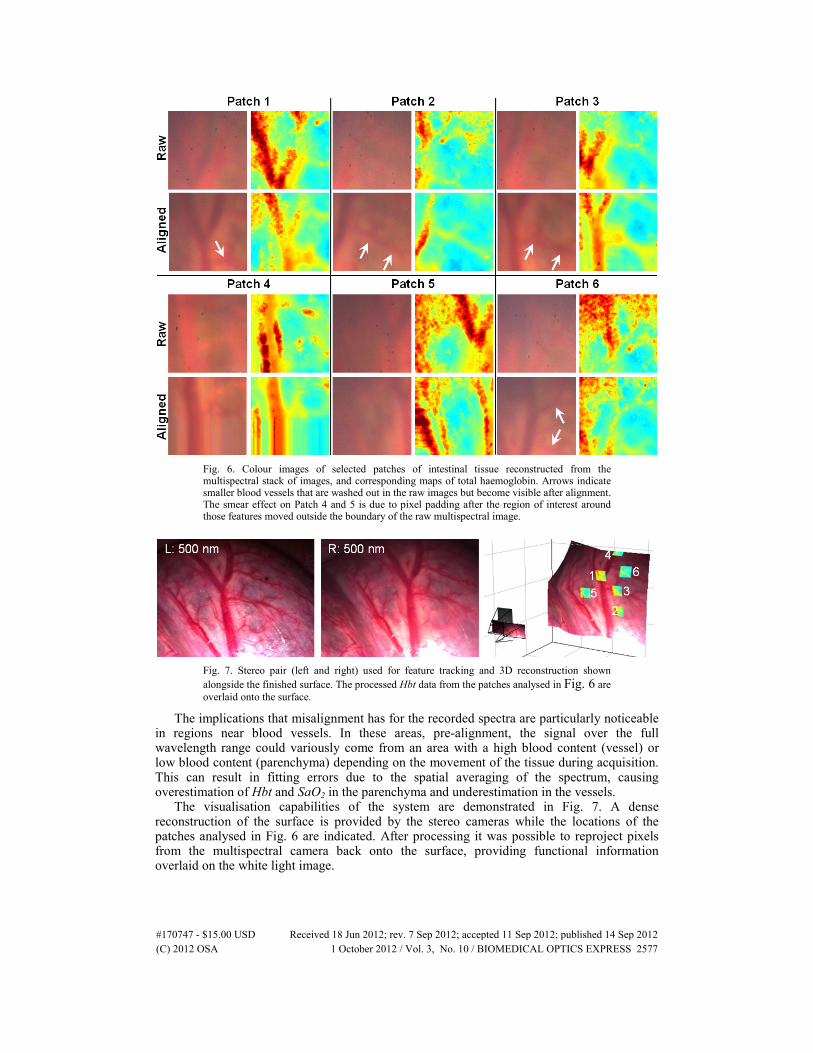
Fig. 6. Colour images of selected patches of intestinal tissue reconstructed from the multispectral stack of images, and corresponding maps of total haemoglobin. Arrows indicate smaller blood vessels that are washed out in the raw images but become visible after alignment. The smear effect on Patch 4 and 5 is due to pixel padding after the region of interest around those features moved outside the boundary of the raw multispectral image.
Fig. 7. Stereo pair (left and right) used for feature tracking and 3D reconstruction shown alongside the finished surface. The processed Hbt data from the patches analysed in Fig. 6 are overlaid onto the surface.
The implications that misalignment has for the recorded spectra are particularly noticeable in regions near blood vessels. In these areas, pre-alignment, the signal over the full wavelength range could variously come from an area with a high blood content (vessel) or low blood content (parenchyma) depending on the movement of the tissue during acquisition. This can result in fitting errors due to the spatial averaging of the spectrum, causing overestimation of Hbt and SaO2 in the parenchyma and underestimation in the vessels.
The visualisation capabilities of the system are demonstrated in Fig. 7. A dense reconstruction of the surface is provided by the stereo cameras while the locations of the patches analysed in Fig. 6 are indicated. After processing it was possible to reproject pixels from the multispectral camera back onto the surface, providing functional information overlaid on the white light image.
(C) 2012 OSA 1 October 2012 / Vol. 3, No. 10 / BIOMEDICAL OPTICS EXPRESS 2577#170747 - $15.00 USD Received 18 Jun 2012; rev. 7 Sep 2012; accepted 11 Sep 2012; published 14 Sep 2012

4. Discussion and conclusions
A trinocular channel endoscope for obtaining simultaneous stereoscopic and multispectral images has been tested on a phantom test object and in vivo during a laparoscopic surgical procedure. The normal white light view of the surgeon is not disrupted as the colour stereo cameras allow navigation to sites of interest while the multispectral camera acquires data simultaneously through the third channel. The results of the phantom experiment showed that by using the calibrated system to track surface features in 3D, the multispectral image stack could be aligned automatically despite significant movement of the subject during the acquisition process and varying visibility of salient features in the multispectral channel. Once aligned, qualitative and quantitative results could be obtained from the spectral information contained within.
The results of the in vivo experiment showed that when applied in this complex surgical environment, the system was capable of following the arbitrary shape of intestinal tissue and compensating for the motion associated with breathing and peristalsis. Using the aligned images, it was possible to extract the absorbance spectrum at each point in the field of view and calculate the relative blood content and oxygen saturation. After processing, it was possible to project this information back onto the colour view. The main limitation of the current system is the acquisition time for a single stack of multispectral images which is close to 30 s for 30 different wavelengths. This is due to the LCTF: its switching time was of the order of 50 ms, but its poor optical throughput (5-50%) meant that long integration times also had to be used for each wavelength. With a faster filter such as an acousto-optic tuneable filter (AOTF), a more sensitive camera such as an EMCCD [18] and real-time 3D reconstruction and tracking algorithms [25], this system could achieve real-time operation suitable for use in the clinic. Furthermore, the light propagation model used will be updated to improve the fit to the experimental results by accounting for differential pathlength variations across the spectrum [37]. Other multivariate analysis techniques such as support vector machines [38] will be implemented to classify tissue according to oxygenation or disease-status.
The three-dimensional tracking and alignment algorithm has been shown to be successful in aligning multispectral images in the presence of a range of different motions, independent of varying light levels in the multispectral channel. Future work on the robustness of this routine will involve incorporation of specular highlight elimination and tool segmentation. This will prevent loss of a feature of interest due to the presence of a highly reflective foreign material in the search region. A further development could also incorporate ‘de-blurring’ of images in the multispectral channel using knowledge of the camera integration time and the relative motion of the endoscope and tissue. Finally, we intend to optimise the reprojected feature stack in order to remove small motion artefacts which can appear with feature drift in the colour images. This final optimisation step could potentially include cross image-modality metrics such as mutual information in an attempt to combine measurements across all the cameras.
Although applied to multispectral imaging here, this technique could be applied to any of the sequential image acquisition modalities previously mentioned (multispectral fluorescence, narrowband or polarisation-resolved imaging) as well as in dynamic small animal imaging and microscopy. The system may be integrated into robotic-assisted minimally invasive surgical systems such as the da Vinci, to provide morphological and functional feedback to the surgeon, since the stereo view of the tissue is a standard feature of this console.
Acknowledgements
We gratefully acknowledge the loan of the laparoscope by Intuitive Surgical, Inc and the assistance of Northwick Park Institute for Medical Research (NPIMR) for trial arrangements. Funding for this project was provided by ERC grant 242991, and UK EPSRC and Technology Strategy Board grants EP/E06342X/1 and DT/E011101/1. Danail Stoyanov would like to acknowledge the financial support of a Royal Academy of Engineering/EPSRC Fellowship.
(C) 2012 OSA 1 October 2012 / Vol. 3, No. 10 / BIOMEDICAL OPTICS EXPRESS 2578#170747 - $15.00 USD Received 18 Jun 2012; rev. 7 Sep 2012; accepted 11 Sep 2012; published 14 Sep 2012