multiscale characterization of heart failurebiomechanics.stanford.edu/paper/actabm19.pdf ·...
TRANSCRIPT

Acta Biomaterialia 86 (2019) 66–76
Contents lists available at ScienceDirect
Acta Biomaterialia
journal homepage: www.elsevier .com/locate /ac tabiomat
Full length article
Multiscale characterization of heart failure
https://doi.org/10.1016/j.actbio.2018.12.0531742-7061/� 2019 Acta Materialia Inc. Published by Elsevier Ltd. All rights reserved.
⇑ Corresponding author.E-mail address: [email protected] (E. Kuhl).
F. Sahli Costabal a, J.S. Choy b, K.L. Sack c, J.M. Guccione d, G.S. Kassab b, E. Kuhl a,⇑aDepartments of Mechanical Engineering & Bioengineering, Stanford University, CA, USAbCalifornia Medical Innovations Institute, Inc., San Diego, CA, USAcDepartment of Human Biology, University of Cape Town, Cape Town, South AfricadDepartment of Surgery, University of California at San Francisco, San Francisco, CA, USA
a r t i c l e i n f o a b s t r a c t
Article history:Received 18 September 2018Received in revised form 28 December 2018Accepted 31 December 2018Available online 7 January 2019
Keywords:Heart failureGrowth and remodelingMyocyteSarcomereMultiscale modelingMachine learningBayesian inferenceUncertainty quantification
Dilated cardiomyopathy is a progressive irreversible disease associated with contractile dysfunction andheart failure. During dilated cardiomyopathy, elevated diastolic wall strains trigger mechanotransductionpathways that initiate the addition of sarcomeres in series and an overall increase in myocyte length. Atthe whole organ level, this results in a chronic dilation of the ventricles, an increase in end diastolic andend systolic volumes, and a decrease in ejection fraction. However, how exactly changes in sarcomerenumber translate into changes inmyocytemorphology, and how these cellular changes translate into ven-tricular dilation remains incompletely understood. Here we combined a chronic animal study, continuumgrowth modeling, and machine learning to quantify correlations between sarcomere dynamics, myocytemorphology, and ventricular dilation. In an eight-week long volume overload study of six pigs, we foundthat the average sarcomere number increased by +3.8%/week, from 47 to 62, resulting in amyocyte length-ening of +3.3%/week, from 85 to 108 lm, while the sarcomere length and myocyte width remainedunchanged. At the same time, the average end diastolic volume increased by +6.0%/week. Using contin-uum growth modeling and Bayesian inference, we correlated alterations on the subcellular, cellular,and organ scales and found that the serial sarcomere number explained 88% of myocyte lengthening,which, in turn, explained 54% of cardiac dilation. Our results demonstrate that sarcomere number andmyocyte length are closely correlated and constitute the major determinants of dilated heart failure.We anticipate our study to be a starting point for more sophisticated multiscale models of heart failure.Our study suggests that altering sarcomere turnover-and with it myocyte morphology and ventriculardimensions-could be a potential therapeutic target to attenuate or reverse the progression of heart failure.
Statement of Significance
Heart failure is a significant global health problem that affects more than 25 million people worldwideand increases in prevalence as the population ages. Heart failure has been studied excessively at variousscales; yet, there is no compelling concept to connect knowledge from the subcellular, cellular, and organlevel across the scales. Here we combined a chronic animal study, continuum growth modeling, andmachine learning to quantify correlations between sarcomere dynamics, myocyte morphology, and ven-tricular dilation. We found that the serial sarcomere number explained 88% of myocyte lengthening,which, in turn, explained 54% of cardiac dilation. Our results show that sarcomere number and myocytelength are closely correlated and constitute the major determinants of dilated heart failure. This suggeststhat altering the sarcomere turnover—and with it myocyte morphology and ventricular dimensions–could be a potential therapeutic target to attenuate or reverse heart failure.
� 2019 Acta Materialia Inc. Published by Elsevier Ltd. All rights reserved.
1. Introduction million Americans suffer from heart failure associated with a very
Heart disease is the leading cause of death and disability world-wide, accounting for 40% of all human mortality. More than six
high mortality and poor quality of life [44]. With one million newcases diagnosed each year, heart failure generates an annual healthcare cost in excess of 30 billion [1]. Cardiac dilation in heart failurehas been the subject of extensive research at different scalesthroughout the past decades [53]; yet, to date, there is no

Fig. 1. Bridging the subcellular, cellular, and tissue levels using a multiscale continuum growth model. We characterize sarcomere numbers and length, myocyte widths andlengths, and end diastolic and systolic volumes in a longitudinal study of volume overload using histology and echocardiography. We quantify the agreement betweensimulation and experiment in terms of myocyte lengths and end diastolic volumes recorded in six animals throughout a period of eight weeks.
F. Sahli Costabal et al. / Acta Biomaterialia 86 (2019) 66–76 67
compelling concept to connect knowledge from the subcellular,cellular, and organ level across the scales.
Unlike many other cell types in the human body, adult heartmuscle cells, cardiomyocytes, do not multiply by cell division. Itis a widely accepted paradigm that the total number of cardiomy-ocytes – about 6 billion at birth-does not increase throughout anindividual’s life time [31]. However, cardiomyocytes can grow insize. They do so through sarcomerogenesis, the creation anddeposition of new sarcomere units [29]. Sarcomeres, the functionalcontractile units of cardiac cells, are characterized through a 1.7–2.1 lm long parallel arrangement of thick filaments of myosin thatslide along thin filaments of actin [3]. Approximately 50 sarcom-eres in series make up a myofibril; about 50–100 myofibrils in par-allel make up a cardiomyocyte [50]. Healthy cardiomyocytes havea cylindrical shape with a length of approximately 80–100 lm anda diameter of 10–25 lm [36].
Cardiomyocyte morphology exhibits distinct variations undervarious pathological conditions [33]. In response to a chronic vol-ume overload, elevated diastolic wall strains on the whole heartscale translate into a stretching of cardiomyocytes on the cellularscale which results in an increase in sarcomere length on the sub-cellular scale [45]. Sarcomeres are known to operate at a tightlyregulated optimal length [34], an observation that is known asthe Frank-Starling mechanism [9,52]. Any deviation away from thislength is associated with a loss of function [21]. Elevated diastolicwall strains trigger mechanotransduction pathways that initiatethe addition of sarcomeres in series [19] and an overall increasein cardiomyocyte length [37]. At the whole organ level, this resultsin a chronic dilation of the ventricle, an increase in end diastolicand end systolic volumes, and a decrease in ejection fraction[12]. However, how exactly changes in sarcomere number trans-late into changes in cardiomyocyte morphology, and how thesecellular changes translate into ventricular dilation is insufficientlyunderstood.
Multiscale modeling provides a powerful concept to integrateknowledge from different scales and correlate molecular and cellu-lar structure to whole organ function. The objective of this studywas to synthesize the information from three biological scalesand establish mechanistic links between them using a chronicanimal study, continuum growth modeling, and machine learning.
We tested the hypothesis that chronic overstretch induces theaddition of sarcomeres on the subcellular scale, which translatesinto progressive cell lengthening on the cellular scale, and resultsin cardiac dilation on the organ scale. Specifically, we performedan eight-week long volume overload study in pigs to quantifyexactly to which extent changes in myocyte morphology canexplain ventricular dilation in heart failure.
2. Materials and methods
Fig. 1 outlines the methods used in this study. We correlate thesubcellular, cellular, and tissue levels using a multiscale continuumgrowth model. We characterize sarcomere numbers and length,myocyte widths and lengths, and end diastolic and systolic vol-umes in a longitudinal study of volume overload using histologyand echocardiography. We quantify the agreement between simu-lation and experiment in terms of myocyte lengths and end dias-tolic volumes recorded in six animals throughout a period ofeight weeks.
2.1. Volume overload model
All animal experiments were performed in accordance withnational and local ethical guidelines, including the Guide for theCare and Use of Laboratory Animals, the Public Health ServicePolicy on Humane Care and Use of Laboratory Animals, and theAnimal Welfare Act, and an approved California Medical Innova-tions Institute IACUC protocol. As previously described [6], we usedsix Yorkshire domestic pig of either sex with a body weight of46.3 ± 8.0 kg and housed the animals at the California MedicalInnovations Institute animal care facilities. At the day of surgery,we performed sedation with telazol-ketamine-xylazine and main-tained anesthesia with isoflurane. Under sterile conditions, we per-cutaneously inserted sheaths into the jugular vein to administerfluids and drugs and into the right femoral artery, to monitor thepressure, and to provide access to the left ventricle for mitral valvechordae disruption. Under fluoroscopic guidance, we advanced ashapeable biopsy forceps towards the anterolateral wall of the leftventricle near the base of the heart. Using transesophageal

68 F. Sahli Costabal et al. / Acta Biomaterialia 86 (2019) 66–76
echocardiography guidance, we created moderate to severeregurgitation by disrupting one or more chordae. Using echocar-diography, we confirmed that the degree of mitral regurgitationwas similar in all the animals. At the end of the eight-week longstudy, we deeply anesthetized the animal, arrested the heart indiastole with potassium chloride, and excised it. Finally, we col-lected transmural punch biopsy samples from the apex and freewall.
2.2. Cell level characterization – histology
For the cell level characterization, we collected endomyocardialbiopsy samples at baseline at the day of mitral valve chordae dis-ruption and at bi-weekly follow-up for a total of eight weeks.Under fluoroscopic guidance, we advanced a shapeable biopsy for-ceps into the left ventricle where we collected four to six endomy-ocardial samples from the apical region and from the free wall. Tominimize variations in the state of contraction, we incubated thesamples in cardioplegic solution at 37 �C before routine histologi-cal processing. We aligned the plane of the samples parallel tothe longitudinal axis of the myocardial fiber and embedded themin tissue freezing medium. We prepared 7-lm-thick slices andmounted them on glass slides. We incubated them with WheatGerm Agglutinin, Alexa Fluor 488 Conjugate, Thermo Fisher Scien-tific to characterize myocyte dimensions and with Anti-SarcomericAlpha Actinin to identify the individual sarcomeres. Under fluores-cence microscopy, we merged the images using ImageJ to identifythe sarcomere numbers within each myocyte. We surveyed non-repeating fields for myocytes in their longitudinal axis, with notears or sectioning artifacts, and excluded myocytes that did notmeet these criteria from our analysis. In this study, we focus onquantifying myocyte dimensions; in the future, we will also quan-tify the percentage of fibrotic tissue in the tissue sections. Fig. 2illustrates our cell level characterization of healthy myocytes atbaseline and of volume overloaded myocytes at week 8. Table 6in the Appendix provides an overview of the number of sarcomerenumbers, sarcomere lengths, myocyte lengths, and myocytewidths we recorded for each animal at each time point.
Fig. 2. Changes in histology in response to left ventricular volume overload.Healthy myocytes, top, at baseline were 85.45 ± 22.30 lm long and 13.67 ± 3.73 lmwide, made up of 47.50 ± 11.67 sarcomeres with a length of 1.75 ± 0.15 lm. Volumeoverloaded myocytes at week 8, bottom, were 107.75 ± 26.57 lm long and12.98 ± 3.01 lm wide, made up of 62.07 ± 16.35 sarcomeres with a length of1.77 ± 0.11 lm.
2.3. Organ level characterization – echocardiography
For the organ level characterization, we recorded transthoracicand transesophageal echocardiograms at baseline at the day ofmitral valve chordae disruption and at bi-weekly follow-up for atotal of eight weeks. We acquired all echocardiographic images,two- and three-dimensional in short and long axis views, withthe animal placed in the supine and left lateral decubitus positions.From these images, we calculated the left ventricular end-diastolicvolumes, end-systolic volumes, stroke volumes, ejection fractions,and wall thicknesses. We performed an offline three-dimensionalvolumetric analysis using the TomTec 4D LV-Function, Version4.6, Build 4.6.3.9, Unterschleissheim, Germany. Briefly, we markedthe positions of the mitral valve and the apex in each of the apicalplanes and manually delineated the endocardial borders at end-diastole. The software then automatically traced the contoursdynamically throughout the cardiac cycle. If necessary, we per-formed manual corrections in both end-diastolic and end-systolicframes to include the papillary muscles and trabeculae. From theautomatically constructed dynamic surface models of the left ven-tricle, we extracted end diastolic and systolic volumes and ejectionfractions.
2.4. Data analysis
To analyze the changes in both microscopic and macroscopicvariables in all subjects, we employed Bayesian inference. For allrecorded samples, we postulated that our measurements aredrawn from distributions that evolve over time. Specifically, weassumed that the measurements of sarcomere number and length,myocyte length and width, and end diastolic and systolic volumesare log-normally distributed at any point in time. We chose thisparticular distribution to ensure that all samples generated fromthese distributions are strictly positive. For the myocyte lengthand width, we further postulated that these two quantities are cor-related, and assumed a bivariate log-normal likelihood,
logðyi;jmlÞlogðyi;jmwÞ
" #� N li
mlðtjÞli
mwðtjÞ
" #;R
!; ð1Þ
where yi;jml and yi;jmw represent the measurement j of subject i of myo-cyte length ml and myocyte width mw;li
mlðtjÞ and limwðtjÞ are the
means of their distributions at the time of measurement j, and Ris the co-variance matrix between these quantities. For the remain-ing quantities, we assumed a simple log-normal likelihood,
logðyi;jk Þ � NðlikðtjÞ;rkÞ with k ¼ fsn; sl; edg; ð2Þ
where yi;jk is the measurement j of subject i of quantity k, either sar-comere number sn, sarcomere length sl, or end diastolic volumeed;li
kðtjÞ is the mean of its distribution at time of measurement jfor the quantity k and, rk is the standard deviation for the quantityk. We adopted the simplest relationship between the mean andtime,
likðtÞ ¼ aik þ bi
kt with k ¼ fml;mw; sn; sl; edg: ð3Þ
Here aik and bi
k represent the intercept and slope of the line lðtÞ forsubject i and quantity k. To take into account the variabilitybetween subjects and, at the same time, take advantage of theentire acquired dataset, we postulated a hierarchical model [11].Specifically, we assumed that the different parameters of the model
in Eq. (3) aik � Nðla
k;rakÞ and bi
k � Nðlbk;rb
kÞ for each subject i aredrawn from normal distributions. With this approach, we intro-duced four hyper-parameters for each quantity k;la
k;lbk;ra
k andrb
k, which control the variability between the parameters aik and

F. Sahli Costabal et al. / Acta Biomaterialia 86 (2019) 66–76 69
bik for each subject i. This allowed us to estimate the individual
responses for each subject in view of the totality of the cohort.The last step to completely specify the statistical model in a Baye-sian setting was to set the prior distributions. These encode our pre-vious knowledge about the parameters. In our case, we used weaklyinformative priors to ensure a small influence in the posterior distri-butions. For the hyper-parameters we chose la
k;lbk � Nð0;1002Þ
and rak;rb
k � Half � Cauchyðc ¼ 10Þ [10], and the prior distributionsof the remaining parameters as rk � Half � Cauchyðc ¼ 100Þ, fork ¼ fsn; sl; edg and R � LKJðg ¼ 2Þ, where LKJ denotes theLewandowski-Kurowicka-Joe distribution [32]. This distribution isparticularly suitable for multi-variate normal co-variance matrices[49]. Finally, we computed the posterior distributions for theparameters using Bayes’ theorem. We performed the statisticalinference using a Hamiltonian Monte Carlo method implementedin PyMC3 [49]. We then computed new samples of our quantitiesof interest yk from a predictive posterior distribution at differenttime points and plotted the discrete measurement points, theirmedians, their 95% confidence intervals, and their inferredprobability density functions throughout our study interval of eightweeks.
2.5. Correlating the subcellular, cellular, and organ levels
To correlate the subcellular and cellular scales, we assumed alinear relation between relative changes in the longitudinal sar-comere number and relative changes in myocyte length [59]. Wecorrelated changes in myocyte morphology to the overall changein end diastolic volume using a transversely isotropic growthmodel [16,17] based on a second-order growth tensor,
Fg ¼ #kn� nþ #?½I � n� n�; ð4Þthat directly correlates the scalar longitudinal and transversegrowth multipliers #k and #? to the relative changes in myocytelength and myocyte width along the fiber direction n [59].
Fig. 3 illustrates the kinematics of our multiscale growth model,with the deformation u, the deformation gradientF ¼ ru ¼ Fe � Fg, the elastic tensor Fe, and the growth tensor Fg,which is a direct result of the changes in myocyte length #k andwidth #?. From the echocardiography images of each animal, wecreated finite element models of the left ventricle at the minimum
Fig. 3. Correlating cellular and organ levels. Illustration of the deformation u,deformation gradient F ¼ ru ¼ Fe � Fg, elastic tensor Fe, and growth tensor Fg tocorrelate changes in end diastolic volume to changes in myocyte length #k andwidth #? .
cavity volume of the cardiac cycle and assumed that this is thestress free state. Fig. 3 illustrates our left ventricular models thatconsist of 3456 linear hexahedral elements, 4152 nodes, and12,456 degrees of freedom. We assigned each element a discretefiber orientation n using a rule-based approach [30] in which thefiber angles vary from þ60o in the endocardium to �60o in theepicardium, measured with respect to the horizontal plane [56].For the baseline elastic material response, we adopted the classicalHolzapfel-Ogden model [18,22],
w ¼ a2b
expðb½Ie1 � 3�Þ þ af2bf
½expðbf Ie4f � 1� �2Þ � 1�
þ as2bs
expðbs½Ie4s � 1�2Þ � 1h i
þ afs2bfs
expðbfs Ie8fs� �2Þ � 1
h i; ð5Þ
where Ie1; Ie4f ; I
e4s, and Ie8fs are the invariants that characterize the trace
of the right elastic Cauchy Green deformation tensor, the elasticfiber stretch, sheet stretch, and coupled fiber-sheet stretch. We cal-ibrated the eight Holzapfel-Ogden material parametersa; b; af ; bf ; as; bs; afs; bfs individually for each animal [46] using therecorded end diastolic pressure and the Klotz curve [27]. We usedthe Abaqus explicit solver [7] and created the end diastolic stateby inflating the ventricle with the end diastolic pressure. Then wegradually increased the growth tensor of Eq. (4) up to the prescribedlongitudinal and transverse growth multipliers #k and #?. From thesimulations, we extracted the progression of the cavity volume forvarying growth multipliers.
2.6. Uncertainty propagation
To correlate the subcellular and cellular levels and the cellularand organ levels, we propagated the uncertainty of our experimen-tal measurements through our computational models. To quantifythe agreement, we compared the simulated and experimentalmyocyte lengths and end diastolic volumes using the overlap coef-ficient, which represents the percentage agreement between thehistograms of simulated and experimental characteristics.
To propagate the uncertainty from the subcellular to the cellu-lar level, for each subject, we took 500 samples of the posterior dis-tribution for our sarcomere numbers at week 8, applied our linearmodel to these samples, and obtained a simulated distribution,which we compared to the posterior distribution of our experi-mental myocyte lengths at week 8. To quantify the agreementbetween the simulated and experimental myocyte lengths, weused the overlap coefficient [24], i.e., the percentage agreement
between both histograms,Pnbins
i minðf simi ; f expi Þ=nsmp, where
nbins ¼ 31 is the number of bins, f simi and f expi are the simulatedand experimental frequencies of the i-th bin, and nsmp ¼ 500 isthe total number of samples, i.e., the collective sum of frequenciesacross all bins.
To account for the uncertainty in our cellular measurements, wecorrelated the longitudinal and transverse growth multipliers,#k ¼ expðbml tÞ and #? ¼ expðbmw tÞ, to the parameters bml andbmw from the experimentally measured histology from Eq. (3).These expressions arise naturally from normalizing the myocytelength and width, mlðtÞ ¼ expðamlÞ expðbmltÞ and mwðtÞ ¼expðamwÞ expðbmwtÞ, from Eq. (1) by their initial values, expðamlÞand expðamwÞ.
To propagate the uncertainty from the cellular to the organlevel, for each subject, we took the last 500 samples of bml andbmw from the Hamiltonian Monte Carlo chain. Instead of perform-ing a single simulation for each of the 500 samples, we trained aGaussian process regression [39,40] to predict the end diastolicvolume of the simulation [38]. For each subject, in the expectedrange of uncertainty, we performed n = 10 simulations for trainingand an additional n = 5 simulations for validation. Since intermedi-
w0 w8w6w4w2
no
rm’d
ed
vo
lum
e [-
]g
row
th in
len
gth
[-]
gro
wth
in w
idth
[-]
0.8
2.0simulation
1.5
no
rm’d
ed
vo
lum
e [-
]
0.8
2.0experiment
w0 w8w6w4w2
+3.6% / week -0.8% / week
pig #4 pig #4
pig #4 pig #4
+5.2% / week +5.1% / week
experiment experiment1.5
0.50.5
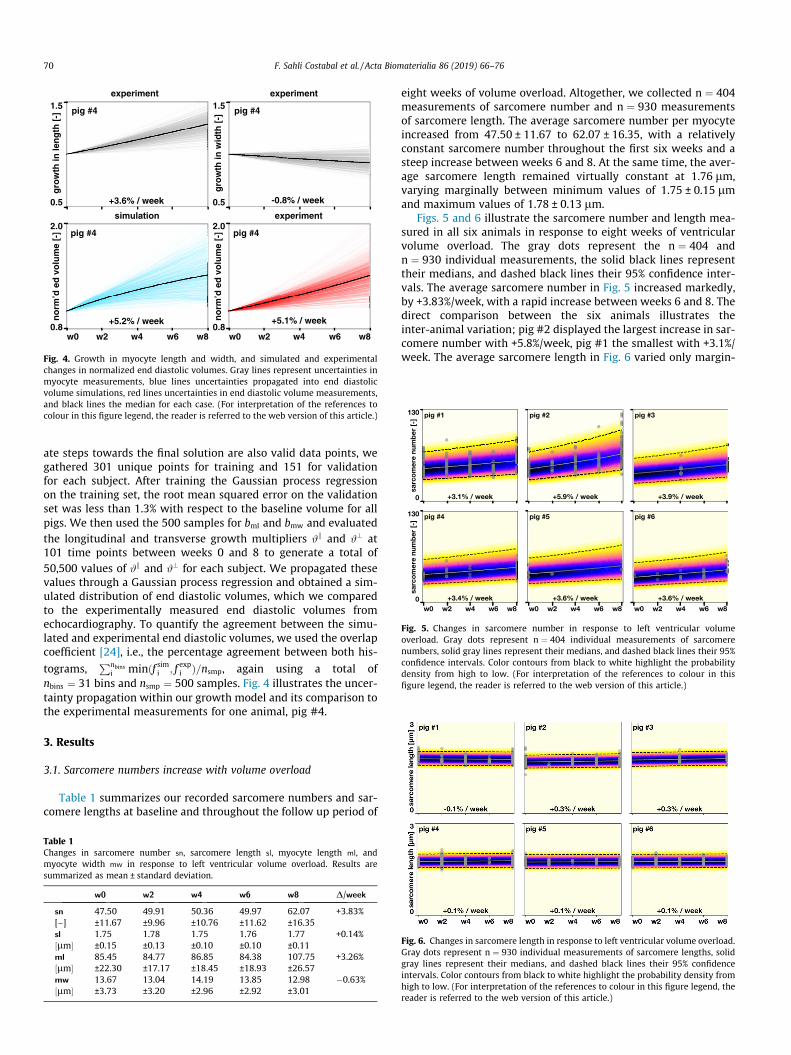
Fig. 4. Growth in myocyte length and width, and simulated and experimentalchanges in normalized end diastolic volumes. Gray lines represent uncertainties inmyocyte measurements, blue lines uncertainties propagated into end diastolicvolume simulations, red lines uncertainties in end diastolic volume measurements,and black lines the median for each case. (For interpretation of the references tocolour in this figure legend, the reader is referred to the web version of this article.)
Fig. 5. Changes in sarcomere number in response to left ventricular volumeoverload. Gray dots represent n ¼ 404 individual measurements of sarcomerenumbers, solid gray lines represent their medians, and dashed black lines their 95%confidence intervals. Color contours from black to white highlight the probabilitydensity from high to low. (For interpretation of the references to colour in thisfigure legend, the reader is referred to the web version of this article.)
70 F. Sahli Costabal et al. / Acta Biomaterialia 86 (2019) 66–76
ate steps towards the final solution are also valid data points, wegathered 301 unique points for training and 151 for validationfor each subject. After training the Gaussian process regressionon the training set, the root mean squared error on the validationset was less than 1.3% with respect to the baseline volume for allpigs. We then used the 500 samples for bml and bmw and evaluatedthe longitudinal and transverse growth multipliers #k and #? at101 time points between weeks 0 and 8 to generate a total of50,500 values of #k and #? for each subject. We propagated thesevalues through a Gaussian process regression and obtained a sim-ulated distribution of end diastolic volumes, which we comparedto the experimentally measured end diastolic volumes fromechocardiography. To quantify the agreement between the simu-lated and experimental end diastolic volumes, we used the overlapcoefficient [24], i.e., the percentage agreement between both his-
tograms,Pnbins
i minðf simi ; f expi Þ=nsmp, again using a total ofnbins ¼ 31 bins and nsmp ¼ 500 samples. Fig. 4 illustrates the uncer-tainty propagation within our growth model and its comparison tothe experimental measurements for one animal, pig #4.
3. Results
3.1. Sarcomere numbers increase with volume overload
Table 1 summarizes our recorded sarcomere numbers and sar-comere lengths at baseline and throughout the follow up period of
Table 1Changes in sarcomere number sn, sarcomere length sl, myocyte length ml, andmyocyte width mw in response to left ventricular volume overload. Results aresummarized as mean ± standard deviation.
w0 w2 w4 w6 w8 D/week
sn 47.50 49.91 50.36 49.97 62.07 +3.83%[–] ±11.67 ±9.96 ±10.76 ±11.62 ±16.35sl 1.75 1.78 1.75 1.76 1.77 +0.14%½lm� ±0.15 ±0.13 ±0.10 ±0.10 ±0.11ml 85.45 84.77 86.85 84.38 107.75 +3.26%½lm� ±22.30 ±17.17 ±18.45 ±18.93 ±26.57mw 13.67 13.04 14.19 13.85 12.98 �0.63%½lm� ±3.73 ±3.20 ±2.96 ±2.92 ±3.01
eight weeks of volume overload. Altogether, we collected n ¼ 404measurements of sarcomere number and n ¼ 930 measurementsof sarcomere length. The average sarcomere number per myocyteincreased from 47.50 ± 11.67 to 62.07 ± 16.35, with a relativelyconstant sarcomere number throughout the first six weeks and asteep increase between weeks 6 and 8. At the same time, the aver-age sarcomere length remained virtually constant at 1.76 lm,varying marginally between minimum values of 1.75 ± 0.15 lmand maximum values of 1.78 ± 0.13 lm.
Figs. 5 and 6 illustrate the sarcomere number and length mea-sured in all six animals in response to eight weeks of ventricularvolume overload. The gray dots represent the n ¼ 404 andn ¼ 930 individual measurements, the solid black lines representtheir medians, and dashed black lines their 95% confidence inter-vals. The average sarcomere number in Fig. 5 increased markedly,by +3.83%/week, with a rapid increase between weeks 6 and 8. Thedirect comparison between the six animals illustrates theinter-animal variation; pig #2 displayed the largest increase in sar-comere number with +5.8%/week, pig #1 the smallest with +3.1%/week. The average sarcomere length in Fig. 6 varied only margin-
Fig. 6. Changes in sarcomere length in response to left ventricular volume overload.Gray dots represent n ¼ 930 individual measurements of sarcomere lengths, solidgray lines represent their medians, and dashed black lines their 95% confidenceintervals. Color contours from black to white highlight the probability density fromhigh to low. (For interpretation of the references to colour in this figure legend, thereader is referred to the web version of this article.)

F. Sahli Costabal et al. / Acta Biomaterialia 86 (2019) 66–76 71
ally, by +0.14%/week, and, as the small 95% confidence intervalsindicate, remained tightly regulated within its physiological rangedespite ventricular overload. Pigs #2 and #3 displayed the largestincrease in sarcomere length with +0.3%/week, pig #1 displayed asmall decrease with �0.2%/week.
Fig. 8. Changes in myocyte width in response to left ventricular volume overload.Gray dots represent n ¼ 460 individual measurements of myocyte width, solid graylines represent their medians, and dashed black lines their 95% confidence intervals.Color contours from black to white highlight the probability density from high tolow. (For interpretation of the references to colour in this figure legend, the reader isreferred to the web version of this article.)
Table 2Changes in end diastolic volume ed, end systolic volume es, ejection fraction ef, andleft ventricular mass m in response to left ventricular volume overload. Results aresummarized as mean ± standard deviation.
w0 w2 w4 w6 w8 D/week
ed 67.9 71.3 77.7 86.8 100.2 +5.95%½ml� ±20.6 ±11.0 ±9.5 ±13.4 ±17.9es 30.2 34.4 40.1 44.6 51.3 +8.73%½ml� ±9.5 ±7.2 ±7.8 ±5.7 ±9.0ef 55.6 52.0 48.4 47.8 47.7 �1.78%½%� ±4.9 ±6.4 ±7.3 ±7.7 ±9.5
3.2. Myocyte lengths increase with volume overload
Table 1 summarizes the results of our recorded myocyte mor-phologies throughout the follow up period of eight weeks of vol-ume overload. Altogether, we collected n ¼ 460 measurements ofmyocyte length and width. The average myocyte length increased,from 85.45 ± 22.30 lm to 107.75 ± 26.57 lm, with a relatively con-stant myocyte length throughout the first six weeks and a steepincrease between weeks 6 and 8. At the same time, the averagemyocyte width remained virtually constant at 13.55 lm, varyingmarginally between minimum values of 12.98 ± 3.01 lm and max-imum values of 14.19 ± 2.92 lm.
Figs. 7 and 8 illustrate the myocyte length and width measuredin all six animals in response to eight weeks of ventricular volumeoverload. The gray dots represent the n ¼ 460 individual measure-ments, the solid black lines represent their medians, and dashedblack lines their 95% confidence intervals. The average myocytelength in Fig. 7 increased markedly, by +3.26%/week, with a rapidincrease between weeks 6 and 8. The direct comparison betweenthe six animals illustrates the inter-animal variation; pig #2 dis-played the largest increase in myocyte length with +6.8%/week,pig #5 the smallest with +2.3%/week. The average myocyte widthin Fig. 8 varied only marginally, by �0.63%/week. Pig #2 displayedthe largest increase in myocyte width with +0.7%/week, pig #6 dis-played the largest decrease with �0.9%/week.
m 59.6 71.8 78.7 92.1 106.7 +9.88%½g� ±12.2 ±13.6 ±16.8 ±21.7 ±26.9
3.3. End-diastolic volumes increase with volume overload
Table 2 summarizes the results of our echocardiography analy-sis at baseline and throughout the follow up period of eight weeksof volume overload. Altogether, we collected n ¼ 28 measurementsof end diastolic and end systolic volume, ejection fraction, and leftventricular mass. The average end diastolic and end systolic vol-umes increased from 67.9 ± 20.6 ml and 30.2 ± 9.5 ml at baselineto 100.2 ± 17.9 ml and 51.3 ± 9.0 ml at week eight. This resultedin a decrease in ejection fraction from 55.6 ± 4.9% to 47.7 ± 9.5%.
Fig. 7. Changes in myocyte length in response to left ventricular volume overload.Gray dots represent n ¼ 460 individual measurements of myocyte lengths, solidgray lines represent their medians, and dashed black lines their 95% confidenceintervals. Color contours from black to white highlight the probability density fromhigh to low. (For interpretation of the references to colour in this figure legend, thereader is referred to the web version of this article.)
At the same time, the mass almost doubled from 59.6 ± 12.2 g to106.7 ± 26.9 g.
Fig. 9 illustrates the end diastolic volume in all six animals inresponse to eight weeks of ventricular volume overload. The graydots represent the n ¼ 28 individual measurements, the solid blacklines represent their medians, and dashed black lines their 95%confidence intervals. The average end diastolic volume increasedby +5.95%/week, with a rapid increase between weeks 6 and 8.The direct comparison between the six animals illustrates theinter-animal variation; pig #3 displayed the largest increase inend diastolic volume with +12.3%/week, pig #1 the smallest with+2.5%/week. Since the end systolic volume increased by +8.73%/week, more rapidly that the end diastolic volume, the overall ejec-tion fraction decreased, by �1.78%/week. Most notably, the leftventricular mass increased by 9.88%/week.
3.4. Sarcomere numbers are predictors of myocyte length
For each pig, we successfully propagated uncertainties ofn = 500 sarcomere numbers from the histological measurementsthrough our linear model and obtained simulated myocyte lengths,which we compared against our experimentally measured myo-cyte lengths from our biopsy histology.
Fig. 10 compares our simulated myocyte lengths from the Gaus-sian process regression and our experimentally measured myocytelengths after eight weeks of left ventricular volume overload. Theblue histograms represent the simulation, the red histograms theexperiment. The overlap between both is a quantitative measurebetween the agreement of the model prediction and the experi-ment. The six histograms are a qualitative and quantitative illustra-
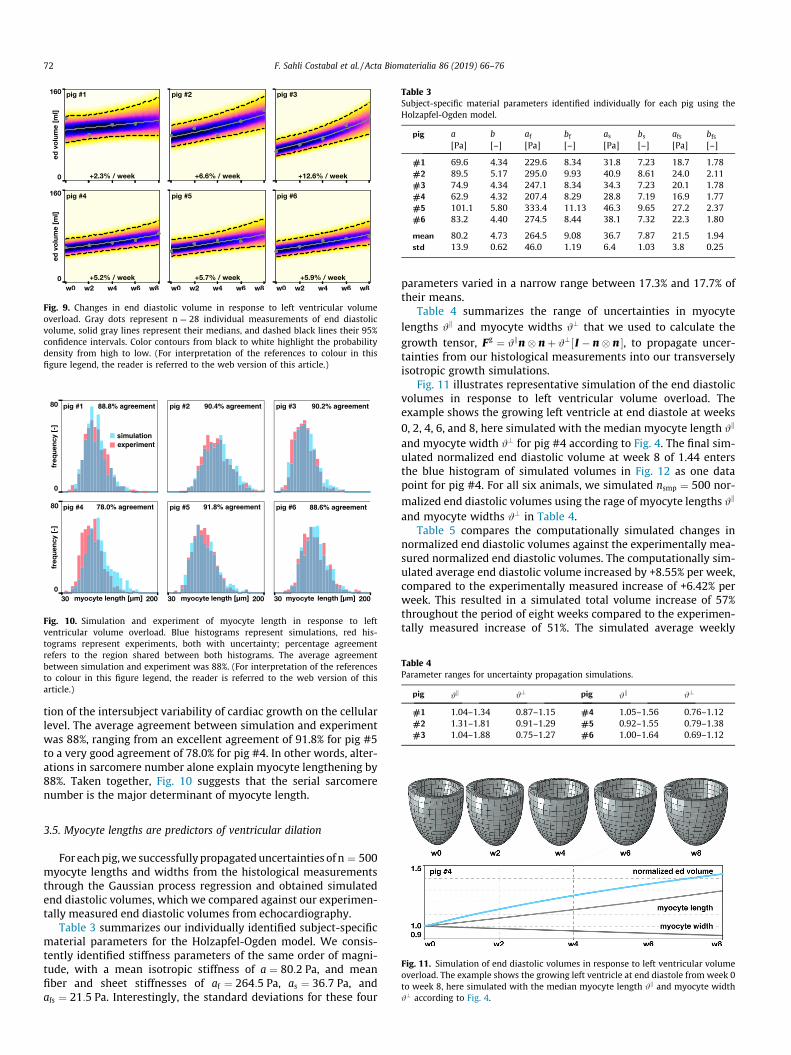
Fig. 9. Changes in end diastolic volume in response to left ventricular volumeoverload. Gray dots represent n ¼ 28 individual measurements of end diastolicvolume, solid gray lines represent their medians, and dashed black lines their 95%confidence intervals. Color contours from black to white highlight the probabilitydensity from high to low. (For interpretation of the references to colour in thisfigure legend, the reader is referred to the web version of this article.)
91.8% agreement78.0% agreement 88.6% agreement
88.8% agreement 90.4% agreement 90.2% agreement
experimentsimulation
Fig. 10. Simulation and experiment of myocyte length in response to leftventricular volume overload. Blue histograms represent simulations, red his-tograms represent experiments, both with uncertainty; percentage agreementrefers to the region shared between both histograms. The average agreementbetween simulation and experiment was 88%. (For interpretation of the referencesto colour in this figure legend, the reader is referred to the web version of thisarticle.)
Table 3Subject-specific material parameters identified individually for each pig using theHolzapfel-Ogden model.
pig a b af bf as bs afs bfs[Pa] [–] [Pa] [–] [Pa] [–] [Pa] [–]
#1 69.6 4.34 229.6 8.34 31.8 7.23 18.7 1.78#2 89.5 5.17 295.0 9.93 40.9 8.61 24.0 2.11#3 74.9 4.34 247.1 8.34 34.3 7.23 20.1 1.78#4 62.9 4.32 207.4 8.29 28.8 7.19 16.9 1.77#5 101.1 5.80 333.4 11.13 46.3 9.65 27.2 2.37#6 83.2 4.40 274.5 8.44 38.1 7.32 22.3 1.80
mean 80.2 4.73 264.5 9.08 36.7 7.87 21.5 1.94std 13.9 0.62 46.0 1.19 6.4 1.03 3.8 0.25
Table 4Parameter ranges for uncertainty propagation simulations.
pig #k #? pig #k #?
#1 1.04–1.34 0.87–1.15 #4 1.05–1.56 0.76–1.12#2 1.31–1.81 0.91–1.29 #5 0.92–1.55 0.79–1.38#3 1.04–1.88 0.75–1.27 #6 1.00–1.64 0.69–1.12
72 F. Sahli Costabal et al. / Acta Biomaterialia 86 (2019) 66–76
tion of the intersubject variability of cardiac growth on the cellularlevel. The average agreement between simulation and experimentwas 88%, ranging from an excellent agreement of 91.8% for pig #5to a very good agreement of 78.0% for pig #4. In other words, alter-ations in sarcomere number alone explain myocyte lengthening by88%. Taken together, Fig. 10 suggests that the serial sarcomerenumber is the major determinant of myocyte length.
Fig. 11. Simulation of end diastolic volumes in response to left ventricular volumeoverload. The example shows the growing left ventricle at end diastole from week 0to week 8, here simulated with the median myocyte length #k and myocyte width#? according to Fig. 4.
3.5. Myocyte lengths are predictors of ventricular dilation
For eachpig,we successfullypropagateduncertainties of n ¼ 500myocyte lengths and widths from the histological measurementsthrough the Gaussian process regression and obtained simulatedend diastolic volumes, which we compared against our experimen-tally measured end diastolic volumes from echocardiography.
Table 3 summarizes our individually identified subject-specificmaterial parameters for the Holzapfel-Ogden model. We consis-tently identified stiffness parameters of the same order of magni-tude, with a mean isotropic stiffness of a ¼ 80:2 Pa, and meanfiber and sheet stiffnesses of af ¼ 264:5 Pa, as ¼ 36:7 Pa, andafs ¼ 21:5 Pa. Interestingly, the standard deviations for these four
parameters varied in a narrow range between 17.3% and 17.7% oftheir means.
Table 4 summarizes the range of uncertainties in myocytelengths #k and myocyte widths #? that we used to calculate thegrowth tensor, Fg ¼ #kn� nþ #?½ I � n� n �, to propagate uncer-tainties from our histological measurements into our transverselyisotropic growth simulations.
Fig. 11 illustrates representative simulation of the end diastolicvolumes in response to left ventricular volume overload. Theexample shows the growing left ventricle at end diastole at weeks0, 2, 4, 6, and 8, here simulated with the median myocyte length #k
and myocyte width #? for pig #4 according to Fig. 4. The final sim-ulated normalized end diastolic volume at week 8 of 1.44 entersthe blue histogram of simulated volumes in Fig. 12 as one datapoint for pig #4. For all six animals, we simulated nsmp ¼ 500 nor-malized end diastolic volumes using the rage of myocyte lengths #k
and myocyte widths #? in Table 4.Table 5 compares the computationally simulated changes in
normalized end diastolic volumes against the experimentally mea-sured normalized end diastolic volumes. The computationally sim-ulated average end diastolic volume increased by +8.55% per week,compared to the experimentally measured increase of +6.42% perweek. This resulted in a simulated total volume increase of 57%throughout the period of eight weeks compared to the experimen-tally measured increase of 51%. The simulated average weekly

norm’d ed volume [-]
10.2% agreement48.4% agreement
experimentsimulation
39.0% agreement
77.2% agreement83.4% agreement 65.8% agreement
norm’d ed volume [-] norm’d ed volume [-]
Fig. 12. Simulation and experiment of normalized end diastolic volume in responseto left ventricular volume overload. Blue histograms represent simulations, redhistograms represent experiments, both with uncertainty; percentage agreementrefers to the region shared between both histograms. The average agreementbetween simulation and experiment was 54%. (For interpretation of the referencesto colour in this figure legend, the reader is referred to the web version of thisarticle.)
Table 5Changes in normalized end diastolic volumes from simulation and experiment.Results are summarized as mean values.
pig Ded w0 w2 w4 w6 w8 D/week
#1 sim 1.00 1.11 1.21 1.31 1.41 +5.13%exp 1.00 1.04 1.09 1.15 1.20 +2.54%
#2 sim 1.00 1.28 1.58 1.91 2.26 +15.71%exp 1.00 1.11 1.23 1.37 1.52 +6.56%
#3 sim 1.00 1.15 1.29 1.44 1.58 +7.24%exp 1.00 1.19 1.41 1.67 1.99 +12.38%
#4 sim 1.00 1.14 1.25 1.35 1.44 +5.51%exp 1.00 1.09 1.19 1.30 1.42 +5.24%
#5 sim 1.00 1.09 1.18 1.27 1.35 +4.37%exp 1.00 1.10 1.20 1.32 1.46 +5.70%
#6 sim 1.00 1.12 1.22 1.31 1.38 +4.78%exp 1.00 1.10 1.22 1.35 1.49 +6.09%
overall sim 1.00 1.15 1.29 1.43 1.57 +8.55%exp 1.00 1.11 1.22 1.36 1.51 +6.42%
F. Sahli Costabal et al. / Acta Biomaterialia 86 (2019) 66–76 73
increase ranged from +4.37% for pig #5 to +15.71% for pig #2. Theexperimental average weekly increase ranged from +2.54% for pig#1 to +12.38% for pig #3.
Fig. 12 compares our simulated end diastolic volumes from theGaussian process regression and our experimentally measurednormalized end diastolic volumes after eight weeks of left ventric-ular volume overload. The blue histograms represent the simula-tion, the red histograms the experiment. The overlap betweenboth is a quantitative measure between the agreement of themodel prediction and the experiment. The six histograms are aqualitative and quantitative illustration of the intersubject vari-ability of cardiac growth. The average agreement between simula-tion and experiment was 54%, ranging from an excellentagreement of 83.4% for pig #4 to a poor agreement of 10.2% forpig #2, which was the largest pig of the study with an initialweight of 56.1kg. Assuming pig #2 is an outlier, the agreementfor the remaining five pigs is 62.7%. In other words, for pigs #1,#3, #4, #5, and #6, alterations in myocyte morphology aloneexplain the dilation of the ventricle by 62.7%. Taken together,Fig. 12 suggests that myocyte morphology is the major determi-nant of ventricular dilation.
4. Discussion
It has long been recognized that heart failure through dilatedcardiomyopathy is associated with an increase in sarcomeres on
the subcellular scale, myocyte lengthening on the cellular scale,and ventricular dilation on the whole organ scale. The objectiveof this study was to quantify the correlation between these threecharacteristics on more mechanistic grounds and specify to whichextent alterations on the smaller scale can explain observations onthe larger scale. With this in mind, we designed a longitudinalstudy of heart failure that combines a chronic volume overloadmodel, continuum growth modeling, and machine learning to sys-tematically correlate the subcellular, cellular, and organ scales.Unique to our study is the fact that we collected biopsy samplesof one and the same heart at five consecutive points in time. Werecorded a total of n = 404 sarcomere numbers, n = 930 of sarcom-ere lengths, n = 460 of myocyte lengths and widths, and n = 28 ofend diastolic and systolic volumes across five points in time andobserved a substantial inter-animal variability. We thereforedecided to consult machine learning tools to overlay uncertaintyto our measurements, and propagate this uncertainty from thesubcellular to the cellular and from the cellular to the whole organlevels. This allowed us to interpret individual intra-animal alter-ations in view of all other animals, and solidly quantify the agree-ment between our computational growth model and ourexperimental measurements. As such, our proposed method ofprobing cell-organ level correlations by combining multiscalemodeling and machine learning is of general interest to a broadrange of living systems and even could help characterize the influ-ence of biomaterial-based devices, injectable hydrogels, or stentson the living heart.
4.1. Volume overload triggers an increase in sarcomere number,myocyte length, and end diastolic volume
Our study revealed that chronic volume overload triggered anincrease in the serial sarcomere number, myocyte length, andend diastolic volume. On the subcellular level, we observed aver-age changes in sarcomere number of +3.83% in Table 1 illustratedin detail in Fig. 5. These ultrastructural alterations translatedalmost directly into altered myocyte morphologies with averagechronic myocyte lengthening of +3.26% in Table 1 illustrated indetail in Fig. 7. At the same time, the length of the individual sar-comeres in Fig. 6 was tightly regulated at 1.8 lm and the myocytethickness in Fig. 8 remained virtually unchanged at 14 lm. Whilethis agrees well with constant sarcomere lengths reported in theliterature [57], several studies report a slightly larger sarcomerelength of 2.0 lm andmyocyte width of 18 lm [13]. However, thosevalues were measured in isolated cells [5], which could be less con-straining than recording dimensions in intact biopsy samples as weproposed here. Notably, our rates of both sarcomere addition andmyocyte lengthening were nonlinear in time with a more pro-nounced increase towards the end of the study as detailed inTable 1. During the last two weeks of our study, we recorded anaverage sarcomere increase of 12, which agrees well with experi-mental findings in volume overloaded rabbit hearts that reporteda maximum sarcomere deposition rate of one sarcomere per myo-cyte per day [57]. Our myocyte lengthening of 26% within onlyeight weeks compares well with myocytes from failing hearts ofpatients with ischemic cardiomyopathy that were 40% longer thanmyocytes of healthy controls [13]. We recorded a myocyte length-to-width ratio of 6.3 at baseline and of 8.3 after eight weeks ofchronic volume overload. These values lie well within the rangeof reported healthy and failing myocyte length-to-width ratios of7.5 [3] and 11.5 [15].
On the whole organ level, our study confirmed the commonunderstanding that a chronic volume overload induces an increasein end diastolic and systolic volumes [36], as we showed in Fig. 9.Collectively, these structural alterations resulted in a decrease ofejection fraction and a drastic increase in mass as summarized in

74 F. Sahli Costabal et al. / Acta Biomaterialia 86 (2019) 66–76
Table 2. Specifically, the changes in end diastolic volume and leftventricular mass were +5.95%/ week and 9.88%/ week, whichresulted in a 48% increase in end diastolic volume and a 79%increase in left ventricular mass after only eight weeks. This agreeswell with clinical observations [29], although the values of oureight-week long study are generally lower than those of end-stage heart failure patients [13]. In contrast, our longitudinalgrowth factor of #k ¼ 1:20 was markedly higher than the longitudi-nal growth factor of #k ¼ 1:05 reported in a similar continuumgrowth analysis over a period of seven weeks in sheep [55]. How-ever, in that study, growth was triggered by infarct-induced ven-tricular dilation and the overall degree of left ventricular dilationwas significantly smaller than in our current study.
4.2. Sarcomere numbers and myocyte lengths are predictors for heartfailure
To systematically correlate changes in sarcomere number andmyocyte morphology to cardiac dilation, we adopted a standardcontinuum growth model and evaluated its predictions with thehelp of machine learning tools. Specifically, our goal was to answerto which extent changes in the serial sarcomere number canexplain chronic myocyte lengthening and, similarly, to whichextent changes in myocyte length can explain ventricular dilation.To answer both questions, we used a multiscale modelingapproach and fed the small scale measurements into our multi-scale model to derive a large scale prediction, which we then com-pared to the large scale measurements [17,47,48,58].
For the elastic part of our model, our parameter identificationwas robust and solid as Table 3 confirms. We identified a mean iso-tropic stiffness of a ¼ 80:2 Pa, and mean fiber and sheet stiffnessesof af ¼ 264:5 Pa, as ¼ 36:7 Pa, and afs ¼ 21:5 Pa, all with standarddeviations of less than 20%. This confirms our intuition that heartmuscle tissue is strongest along the fiber direction, and agrees wellwith reported trends. Strikingly, these four stiffness values identi-fied for six living pig hearts are 6, 57, 89, and 31 times softer thanthe original Holzapfel-Ogden parameters [22], a ¼ 496 Pa,af ¼ 15193 Pa, as ¼ 3283 Pa, and afs ¼ 662 Pa from shear tests of3 mm-sized cubic samples of six explanted pig hearts [8], a trendthat has been confirmed by several other in vivo studies in the liter-ature [12,46].
For the growth part of our model, a major challenge was thestrong inter-animal variability with one clear outlier, animal #2.For all other animals we observed a strong agreement betweensimulation and experiment as Table 5 confirms. Our study revealedthat changes in the serial sarcomere number explain myocytelengthening by 88% as we illustrate in detail for each animal inFig. 10. Similarly, changes in myocyte length explain ventriculardilation by 54% as we show in Fig. 12. On average, the simulationpredicted a weekly increase in end diastolic volume of +8.55%/week, which agrees well with the experimentally observedincrease of +6.42%/week.
While various studies have analyzed the effects of volume over-load on sarcomere number, myocyte length, and ventricular vol-ume [14,19,20,35], only a small number of studies have madeattempts to quantify correlations between them [13]. In fact, therelative contributions of myocyte remodeling and myocyte slip-page to the dilation of the ventricle remain an ongoing controversyin the quest for successful therapies to treat heart failure [14].Probably the most quantitative correlation to date is a linear rela-tion between chamber circumference and myocyte length in pro-gressive heart failure in rats [54]. This study concluded thatmyocyte lengthening alone can account for chamber dilation inthe progression to heart failure [51]. In directly correlating cham-ber circumference to myocyte length, however, this study ignored
the structural arrangement of myocardial fibers across the ventric-ular wall and implicitly assumed that myocytes elongate onlyalong the circumferential direction. Kinematically, this model pro-vides only an upper limit of ventricular dilation. To explain poten-tial discrepancies between myocyte lengthening and ventriculardilation, a recent study suggested that extracellular matrix remod-eling could be a significant contributor to volume overload-induced heart failure [23].
Recent reviews have begun to acknowledge the importance ofcomputational modeling in providing additional insight into thepathological alterations of heart failure across the scales [4,51].The very first approach to characterize growth of the heart waspurely theoretical, but introduced the multiplicative decomposi-tion of the deformation gradient into an elastic part and a growthpart according to Fig. 3 [43]. Throughout the past decade, numer-ous groups have used and refined this approach to model eccentricand concentric cardiac growth, either through separate stretch-and stress-driven models [16,26,41] or through a single strain-based model [25]. In contrast to the simplified myocyte length ver-sus chamber diameter model, computational models allow us todirectly account for discrete fiber directions in the left ventricle[28] or across the entire heart [12], either derived from a rule-based approach [56] or registered on the geometry from diffusiontensor magnetic resonance imaging [46]. Here we have systemati-cally included fiber heterogeneity across the ventricular wallthrough discrete, regionally varying fiber directions n in Eq. (4).Our histogram representations of the animal-specific correlationsbetween sarcomere number and myocyte length in Fig. 10 andbetween myocyte length and ventricular dilation in Fig. 12 revealthat sarcomere numbers are an excellent predictor for myocytelengthening, which, in turn, is a good predictor for ventricular dila-tion. While myocyte lengthening alone indeed explains 54% of thestructural alterations associated with ventricular dilation, ourstudy also supports the emerging view that extracellular matrixremodeling could play a relevant-although overall lessimportant-role in heart failure. Further studies will be needed toelucidate to which extent the remaining cardiac dilation andincrease in ventricular mass can be explained by myocyte hyper-plasia or extracellular matrix deposition. A better understandingof the contributing factors to heart failure could have potentialimplications on tissue engineering functional heart muscle for car-diac repair [2] or testing of novel biomaterial-based devices forcombating heart failure [42].
4.3. Limitations
This manuscript provides our first attempts to quantitativelycorrelate sarcomere lengths and numbers, myocyte lengths andwidths, and ventricular volumes in individual animals throughouta longitudinal heart failure study. Our study has a few limitations:First, we have only monitored our animals throughout a period ofeight weeks during which structural changes were initially moder-ate but increased more rapidly towards the end of the study. Aunique aspect of our study is that we know about this temporalvariation in growth because we have collected biopsy samples ofthe same heart at five points in time. In retrospect, we should prob-ably have continued the study for an additional two or even fourweeks. However, the hearts had already almost doubled their masswithin only eight weeks which indicates a rather rapid growth.Second, while the mass of the hearts almost doubled, the animalsthemselves grew to a final body weight of 60.7 ± 10.7 kg andincreased their mass by 31.1%. Here we focused exclusively onhow changes in sarcomere number translate into changes in myo-cyte length and changes in end diastolic volume. In a follow upstudy, we are currently characterizing the naturally-induced andstretch-induced addition of sarcomeres to shed light on the relative

F. Sahli Costabal et al. / Acta Biomaterialia 86 (2019) 66–76 75
influence of these two phenomena. Third, in our initial cohort, wehave only studied six animals. Given the relatively large inter-animal variation, the number of animals seems rather low, andwe should probably increase the number of subjects in the futureto explore how robustly our findings extent to a larger group.Specifically, our proposed method is sensitive to the inherentinter-animal variations in natural growth, regurgitation, andoverload-induced growth. While the cell-level responses inFig. 10 seem to be tightly regulated and less sensitive to these vari-ations, the organ-level responses in Fig. 12 display much largerinter-animal variations, which manifest themselves in an excellentagreement for pigs #4, #5, and #6, a good agreement for pigs #1and #3, and a poor agreement for pig #2. Including additional ani-mals would help us to better explain the discrepancies for pig #2,and likely make our overall finding more robust. For now, to ana-lyze and interpret our relatively sparse data, we have applied novelmachine learning techniques. This allows us, for example, to inter-pret the individual behavior of each animal in view of the collectivebehavior of all animals. This technology is novel and could in itselfbe useful for other studies that are based on interpreting sparsedata. Fourth, our study induced left ventricular volume overloadin pigs through controlled regurgitation as a surrogate model forheart failure in humans. While sarcomere lengths and numbers,myocyte lengths and widths, and ventricular volumes are rela-tively comparable between pigs and humans, it remains to beshown how the timeline of cellular and ventricular adaptation involume overloaded pigs translates into the timeline of heart failurein humans.
5. Conclusion
Sarcomere units within individual myocytes undergo a contin-uous turnover through removal and renewal. Since their turnoverrate is sensitive to environmental factors, the dimensions ofindividual myocytes are highly plastic. Altering sarcomere turn-over – and with it myocyte morphology and ventricular dimen-sions – could be a potential therapeutic target to attenuate orreverse the progression of heart failure. Our study provides a betterquantitative understanding of the correlations between sarcomerenumber, myocyte length, and ventricular dilation and is animportant first step in this direction.
Acknowledgments
This work was supported by the Becas Chile-FulbrightFellowship to Francisco Sahli Costabal and by the National Insti-tutes of Health grant U01 HL119578 to Julius M. Guccione, GhassanS. Kassab, and Ellen Kuhl.
Appendix A. Supplementary data
Table 6 summarizes the number of sarcomere numbers, sar-comere lengths, myocyte lengths, and myocyte widths werecorded for each subject at each time point. In total, we measuredn = 404 sarcomere lengths, n = 930 sarcomere lengths, n = 460myocyte lengths, and n = 460myocyte widths. Supplementary dataassociated with this article can be found, in the online version, athttps://doi.org/10.1016/j.actbio.2018.12.053.
References
[1] E.J. Benjamin, S.V. Salim, W.C. Clifton, A.R. Chang, S. Cheng, et al., Heart diseaseand stroke statistics–2018 update: a report from the American HeartAssociation, Circulation 137 (2018) e67–e492.
[2] O.J. Abilez, E. Tzatzalos, H. Yang, M.T. Zhao, G. Jung, A.M. Zöllner, M. Tiburcy, J.Riegler, E. Matsa, P. Shukla, Y. Zhuge, T. Chour, V.C. Chen, P.W. Burridge, I.Karakides, E. Kuhl, D. Bernstein, L.A. Couture, J.D. Gold, W.H. Zimmermann, J.C.Wu, Passive stretch induces structural and functional maturation ofengineered heart muscle as predicted by computational modeling, StemCells 36 (2018) 265–277.
[3] M.A. Bray, S.P. Sheehy, K.K. Parker, Sarcomere alignment is regulated bymyocyte shape, Cell Motililty Cytoskel. 65 (2008) 641–651.
[4] R. Chabiniok, V. Wang, M. Hadjicharalambous, L. Asner, J. Lee, M. Sermesant, E.Kuhl, A. Young, P. Moireau, M. Nash, D. Chapelle, D.A. Nordsletten,Multiphysics and multiscale modeling, data-model fusion and integration oforgan physiology in the clinic: ventricular cardiac mechanics, Interface Focus 6(2016) 20150083.
[5] Y.F. Chen, S. Said, S.E. Campbell, A.M. Gerdes, A method to collect isolatedmyocytes and whole tissue from the same heart, Am. J. Physiol. Heart Circ.Physiol. 293 (2007) 2004–2006.
[6] J.S. Choy, S. Leng, Y. Awakeem, K.L. Sack, Y. Dabiri, L. Zhong, J.M. Guccione, G.S.Kassab. Mechanical stretch as stimulus for growth and remodeling in mitralregurgitation (submitted for publication).
[7] Dassault Systémes, SIMULIA. 2017. Abaqus 2017, Documentation. DassaultSystémes, Rhode Island.
[8] S. Dokos, B.H. Smaill, A.A. Young, I.J. LeGrice, Shear properties of passiveventricular myocardium, Am. J. Physiol. Heart Circ. Physiol. 283 (2002) H2650–H2659.
[9] O. Frank, Zur Dynamik des Herzmuskels, J. Biol. 32 (1895) 370–447.Translation from German: Chapman CP, Wasserman EB. On the dynamics ofcardiac muscle. Am. Heart J. 58 (1959) 282–317.
[10] A. Gelman, Prior distributions for variance parameters in hierarchical models,Bayesian Anal. 1 (2006) 515–534.
[11] A. Gelman, J. Hill, Data Analysis Using Regression and Multilevel/HierarchicalModels, Cambridge University Press, Cambridge, 2006.
[12] M. Genet, L.C. Lee, B. Baillargeon, J.M. Guccione, E. Kuhl, Modeling pathologiesof systolic and diastolic heart failure, Ann. Biomed. Eng. 44 (2016) 112–127.
[13] A.M. Gerdes, S.E. Kellerman, J.A. Moore, K.E. Muffly, L.C. Clark, P.Y. Reaves, K.B.Malec, P.P. Mc Keown, D.D. Schocken, Structural remodeling of cardiacmyocytes in patients with ischemic cardiomyopathy, Circulation 86 (1992)426–430.
[14] A.M. Gerdes, The use of isolated myocytes to evaluate myocardial remodeling,Trends Cardiovasc. Med. 2 (1992) 152–155.
[15] A.M. Gerdes, J.M. Capasso, Structural remodeling and mechanical dysfunctionof cardiac myocytes in heart failure, J. Mol. Cell Cardiol. 27 (1995) 849–856.
[16] S. Göktepe, O.J. Abilez, E. Kuhl, A generic approach towards finite growth withexamples of athlete’s heart, cardiac dilation, and cardiac wall thickening, J.Mech. Phys. Solids 58 (2010) 1661–1680.
[17] S. Göktepe, O.J. Abilez, K.K. Parker, E. Kuhl, A multiscale model for eccentricand concentric cardiac growth through sarcomerogenesis, J. Theor. Biol. 265(2010) 433–442.
[18] S. Göktepe, S.N.S. Acharya, J. Wong, E. Kuhl, Computational modeling ofpassive myocardium, Int. J. Num. Meth. Biomed. Eng. 27 (2011) 1–12.
[19] W. Grossman, Cardiac hypertrophy: useful adaptation or pathologic process?,Am J. Med. 69 (1980) 576–584.
[20] J.W. Holmes, Candidate mechanical stimuli for hypertrophy during volumeoverload, J. Appl. Physiol. 97 (2004) 1453–1460.
[21] C. Holubarsch, T. Ruf, D.J. Goldstein, R.C. Ashton, W. Nickl, B. Pieske, K. Burkert,J. Ludemann, S. Wiesner, G. Hasenfuss, H. Posival, H. Just, D. Burkhoff,Ventricular hypertrophy/CHF: existence of the Frank-Starling mechanism inthe failing human heart: Investigations on the organ, tissue, and sarcomerelevels, Circulation 94 (1996) 683–689.
[22] G.A. Holzapfel, R.W. Ogden, Constitutive modelling of passive myocardium: astructurally based framework for material characterization, Philos. Trans. A.Math. Phys. Eng. Sci. 367 (2009) 3445–3475.
[23] K.R. Hutchinson, J.A. Stewart, P.A. Lucchesi, Extracellular matrix remodelingduring the progression of volume overload-induced heart failure, J. Mol. CellCardiol. 48 (2010) 564–569.
[24] H.F. Inman, E.L. Bradley Jr, The overlapping coefficient as a measure ofagreement between probability distributions and point estimation of theoverlap of two normal densities, Commun. Stat. Methods. 18 (1989) 3851–3874.
[25] R.C.P. Kerckhoffs, J.H. Omens, A.D. McCulloch, A single strain-based growth lawpredicts concentric and eccentric cardiac growth during pressure and volumeoverload, Mech. Res. Commun. 42 (2012) 40–50.
[26] D. Klepach, L.C. Lee, J.F. Wenk, M.B. Ratcliffe, T.I. Zohdi, J.A. Navia, G.S. Kassab,E. Kuhl, J.M. Guccione, Growth and remodeling of the left ventricle: a casestudy of myocardial infarction and surgical ventricular restoration, Mech. Res.Comm. 42 (2012) 134–141.
[27] S. Klotz, I. Hay, M.L. Dickstein, G.-H. Yi, J. Wang, M.S. Maurer, D.A. Kass, D.Burkhoff, Single-beat estimation of end-diastolic pressure-volumerelationship: a novel method with potential for noninvasive application, Am.J. Physiol. Circ. Physiol. 291 (2006) H403–H412.
[28] W. Kroon, T. Delhaas, T. Arts, P. Bovendeerd, Computational modeling ofvolumetric soft tissue growth: application to the cardiac left ventricle,Biomech. Model. Mechanobiol. 8 (2009) 301–309.
[29] V. Kumar, A.K. Abbas, N. Fausto, Robbins and Cotran Pathologic Basis ofDisease, Elsevier Saunders, 2005.

76 F. Sahli Costabal et al. / Acta Biomaterialia 86 (2019) 66–76
[30] I.J. Legrice, P.J. Hunter, B.H. Smaill, Laminar structure of the heart: amathematical model, Am. J. Physiol. 272 (1997) H2466–H2476.
[31] A. Leri, M. Rota, F.S. Pasqualini, P. Goichberg, P. Anversa, Origin ofcardiomyocytes in the adult heart, Circ. Res. 116 (2015) 150–166.
[32] D. Lewandowski, D. Kurowicka, H. Joe, Generating random correlationmatrices based on vines and extended onion method, J. Multivar. Anal. 100(2009) 1989–2001.
[33] F. Li, X. Wang, X.P. Yi, A.M. Gerdes, Structural basis of ventricular remodeling:Role of the myocyte, Current Heart Failure Reports 1 (2004) 5–8.
[34] H. Mansour, P.P. de Tombe, A.M. Samarel, B. Russel, Restoration of restingsarcomere length after uniaxial static strain is regulated by protein kinase Cand focal adhesion kinase, Circ Res. 94 (2004) 642–649.
[35] J.H. Omens, Stress and strain as regulators of myocardial growth, Prog.Biophys. Mol. Biol. 69 (1998) 559–572.
[36] L.H. Opie, Heart Physiology: From Cell to Circulation, Lippincott Williams &Wilkins, 2003.
[37] L.H. Opie, P.J. Commerford, B.J. Gersh, M.A. Pfeffer, Controversies in ventricularremodelling, Lancet 367 (2006) 356–367.
[38] P. Perdikaris. Gaussian processess. A hands-on tutorial.https://github.com/paraklas/GPTutorial, 2017.
[39] M. Raissi, P. Perdikaris, G. Karniadakis, Machine learning of lineardifferential equations using Gaussian processes, J. Comp. Phys. 348 (2017)683–693.
[40] M. Raissi, P. Perdikaris, G. Karniadakis, Numerical Gaussian processes for time-dependent and nonlinear partial differential equations, SIAM J. Sci. Comp. 40(2018) A172–A198.
[41] M.K. Rausch, A. Dam, S. Göktepe, O.J. Abilez, E. Kuhl, Computational modelingof growth: systemic and pulmonary hypertension in the heart, Biomech.Model. Mechanobiol. 10 (2011) 799–811.
[42] M.K. Rausch, A.M. Zöllner, M. Genet, B. Baillargeon, W. Bothe, E. Kuhl, A virtualsizing tool for mitral valve annuloplasty, Int. J. Numer. Meth. Biomed. Eng. 33(2017) e02788.
[43] E. Rodriguez, A. Hoger, A.D. McCulloch, Stress-dependent finite growth in softelastic tissues, J. Biomech. 27 (1994) 455–467.
[44] V.L. Roger, Epidemiology of heart failure, Circ. Res. 113 (2013) 6446–6659.[45] B. Russel, M.W. Curtis, Y.E. Koschman, A.M. Samarel, Mechanical stress-
induced sarcomere assembly for cardiac muscle growth in length and width, J.Mol. Cell. Cardiol. 48 (2010) 817–823.
[46] K.L. Sack, E. Aliotta, D.B. Ennis, J.S. Choy, G.S. Kassab, J.M. Guccione, T. Franz,Construction and validation of subject-specific biventricular finite-elementmodels of healthy and failing swine hearts from high-resolution DT-MRI,Front. Physiol. 9 (2018) 539.
[47] F. Sahli Costabal, J. Yao, E. Kuhl, Predicting the cardiac toxicity of drugs using anovel multiscale exposure-response simulator, Comp. Meth. Biomech. Biomed.Eng. 21 (2018) 232–246.
[48] F. Sahli Costabal, J. Yao, E. Kuhl, Predicting drug-induced arrhythmias bymultiscale modeling, Int. J. Numer. Meth. Biomed. Eng. 34 (2018) e2964.
[49] J. Salvatier, T.V. Wiecki, C. Fonnesbeck, Probabilistic programming in Pythonusing PyMC3, Peer J. Comput. Sci. 2 (2016) e55.
[50] J.W. Sanger, J.C. Ayoob, P. Chowrashi, D. Zurawski, J.M. Sanger, Assembly ofmyofibrils in cardiac muscle cells, Adv. Exp. Med. Biol. 481 (2000) 89–105.
[51] O.V. Savinova, A.M. Gerdes, Myocyte changes in heart failure, Heart Fail. Clin. 8(2012) 1–6.
[52] E.H. Starling, Linacre Lecture on the Law of the Heart, Longmans, London,England, 1918.
[53] J.A. Spudich, Hypertrophic and dilated cardiomyopathy: four decades of basicresearch on muscle lead to potential therapeutic approaches to thesedevastating genetic diseases, Biophys. J. 106 (2014) 1236–1249.
[54] T. Tamura, T. Onodera, S. Said, M.A. Gerdes, Correlation of myocytelengthening to chamber dilation in the spontaneouslly hypertensive heartfailure rat, J. Mol. Cell. Cardiol. 30 (1998) 2175–2181.
[55] A. Tsamis, A. Cheng, T.C. Nguyen, F. Langer, D.C. Miller, E. Kuhl, Kinematics ofcardiac growth – in vivo characterization of growth tensors and strains, J.Mech. Behavior Biomed. Mat. 8 (2012) 165–177.
[56] J. Wong, E. Kuhl, Generating fiber orientation maps in human heart modelsusing Poisson interpolation, Comp. Meth. Biomech. Biomed. Eng. 17 (2014)1217–1226.
[57] M. Yoshida, E. Sho, H. Nanjo, M. Takahashi, M. Koboyashi, K. Kawamura, M.Honma, M. Komatsu, A. Sugita, M. Yamauchi, T. Hosoi, Y. Ito, H. Matsuda,Weaving hypothesis of cardiomyocyte sarcomeres, Am. J. Pathol. 176 (2010)660–678.
[58] K.M. Wisdom, S.L. Delp, E. Kuhl, Use it or lose it: multiscale skeletal muscleadaptation to mechanical stimuli, Biomech. Model. Mechanobiol. 14 (2015)195–215.
[59] A.M. Zöllner, O.J. Abilez, M. Böl, E. Kuhl, Stretching skeletal muscle – Chronicmuscle lengthening through sarcomerogenesis, PLoS ONE 7 (2012) e45661.