multiple phase behavior of carbon dioxide …baervan.nmt.edu/publications/media/pdf/thesis/mangone,...
TRANSCRIPT

MULTIPLE PHASE BEHAVIOR OF CARBON DIOXIDE AND
HYDROCARBON SYSTEMS INCLUDING THE EFFECTS OF WATER
by
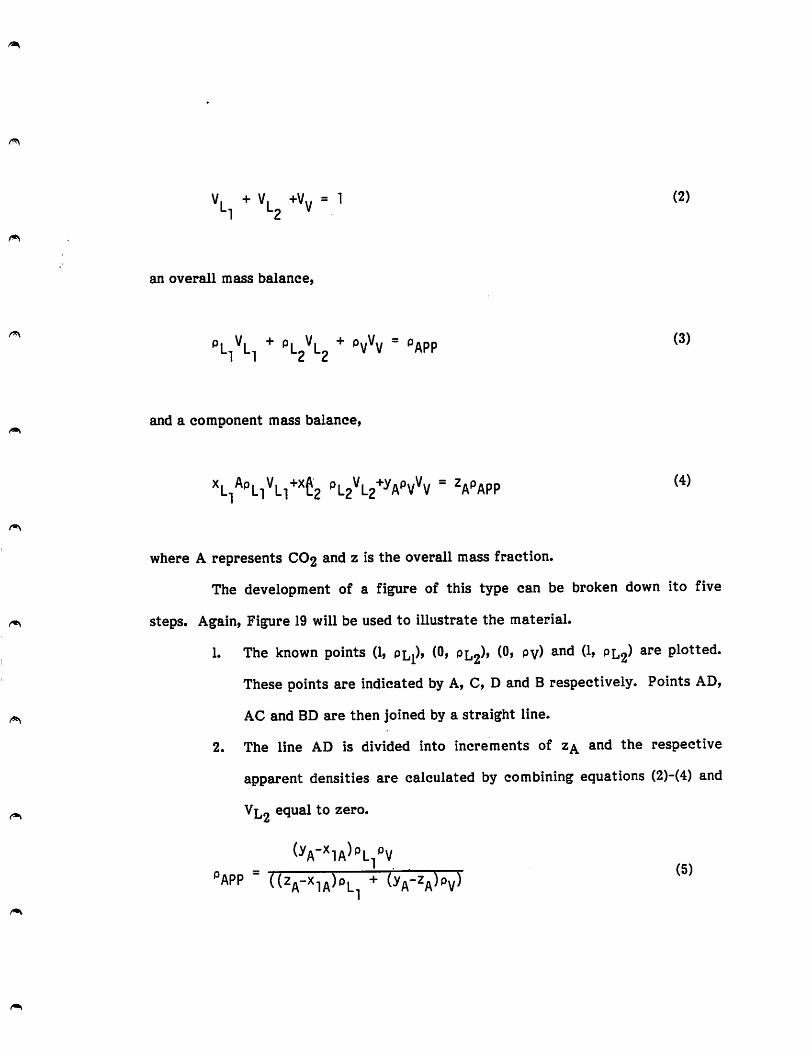
Dean Joseph Mangone
B.S. in Ch.E., University of Pittsburgh, 1984
Submitted to the Graduate Faculty
of the School of Engineering
in partial fulfillment of
the requirements for the degree of
Master of Science
in
Chemical and Petroleum Engineering
University of Pittsburgh
1985
The author grants permissionto reproduce copies.
Signed
ACKNOWLEDGMENTS
I would like to thank my co-advisors, Professor G. D. Holder and Professor
B. I. Morsi for their time and assistance over the past year. I would especially like
to thank Professor R. M. Enick for his significant contribution to this work.
I would also like to thank all of the graduate students who I shared an
office with, D. Dempsey, R. Enick, R. Foster, S. Klara and R. Mohamed for putting
up with me.
I would also like to thank Jocie Glasser for typing this otherwise it would
have taken another month to complete.
Finally, I would like to thank my family for their support and constant
encouragement.

ABSTRACT
Signature
MULTIPLE PHASE BEHAVIOR OF CARBON DIOIXIDE AND
HYDROCARBON SYSTEMS
INCLUDING THE EFFECTS OF WATER
Dean Josepii Mangone, M.S.
University of Pittsburgh
An experimental study for characterizing the effect of water on binary
and ternary carbon dioxide and hydrocarbon systems has been completed.
Specifically, the multiple phase behavior of the carbon dioxide and normal
tetradecane system has been compared with the carbon dioxide, normal tetradecane
and water system. The carbon dioxide, methane and normal tetradecane system
was also compared ot the carbon dioxide, methane, normal tetradecane and water
system.
Pressure-temperature-volume (PVT) data has been collected for these
systems at various compositions at temperatures of 305.5 and 343.3 K. Pressure-
composition (Px) diagrams are presented for each case. It has been determined that
the effect of water on the dew and bubble points is due to the solubility of carbon

dioxide in water.
A study of the three phase region for the binary system of carbon dioxide
and normal tetradecane and the four phase region for the ternary system of carbon
dioxide, normal tetradecane and water at 305.5 K is also presented. Numerical
methods for determining the multiple phase densities and compositions from only
volumetric behavior data are presented, and a new method for predicting the
volumetric behavior in the three and four phase region is also outlined.
DESCRIPTORS
Carbon dioxide High pressure volumetric behavior
Minimum miscibility pressure Multiple phase behavior
Normal alkanes PVT data

TABLE OF CONTENTS
Page
ACKNOWLEDGMENTS
ABSTRACT
LIST OF FIGURES
LIST OF TABLES
NOMENCLATURE
LO INTRODUCTION
1.1 Overview of Conventional Oil-Recovery Methods
1.2 Carbon Dioxide Flooding
L3 Review of Previous Work
2.0 STATEMENT OF THE PROBLEM
3.0 EXPERIMENTAL
3.1 Experimental Apparatus
3.2 Experimental Procedure
4.0 RAW DATA
4.1 PVT Data for C02/nCi4H3o
4.2 PVT Data for C02/nCi4H3o/H20
4.3 PVT Data for C02/CH4/nCi4H3o
4.4 PVT Data for C02/CH4/nCi4H3o/H20
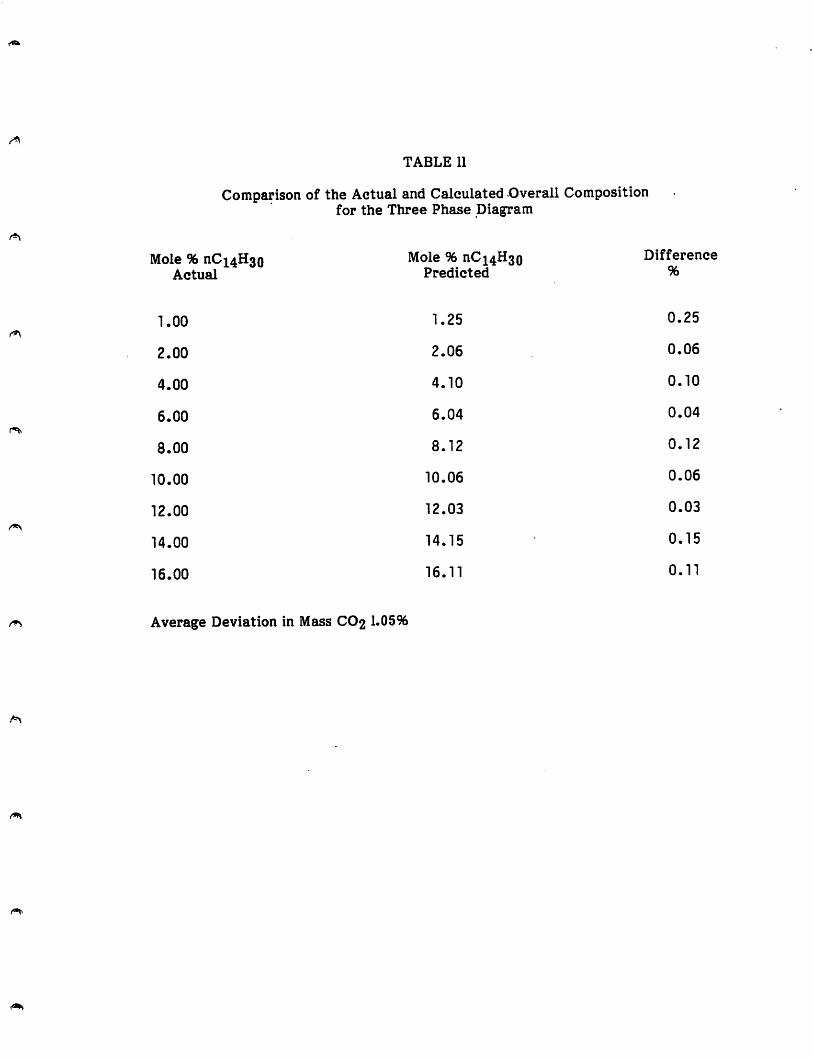
5.0 RESULTS AND DISCUSSION
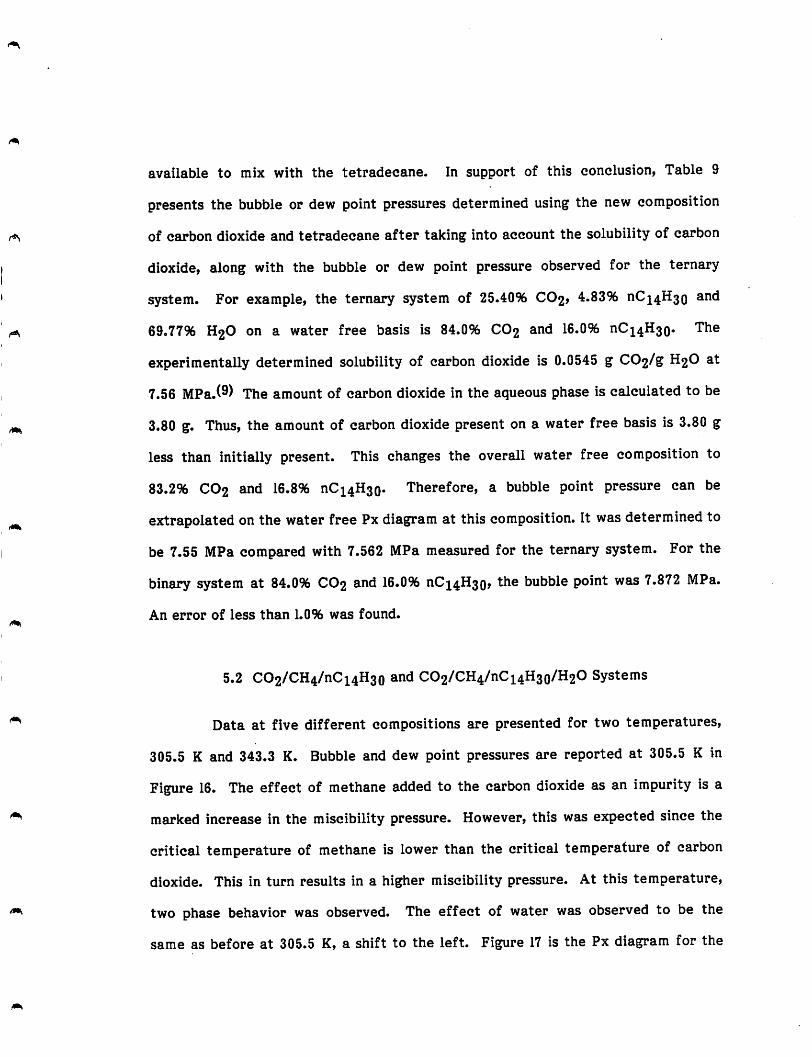
5.1 CO2/nCi4H30 and C02/nCi4H3o/H20 Systems
5.2 C02/CH4/nCi4H3o and C02/CH4/nCi4H3oH20Systems
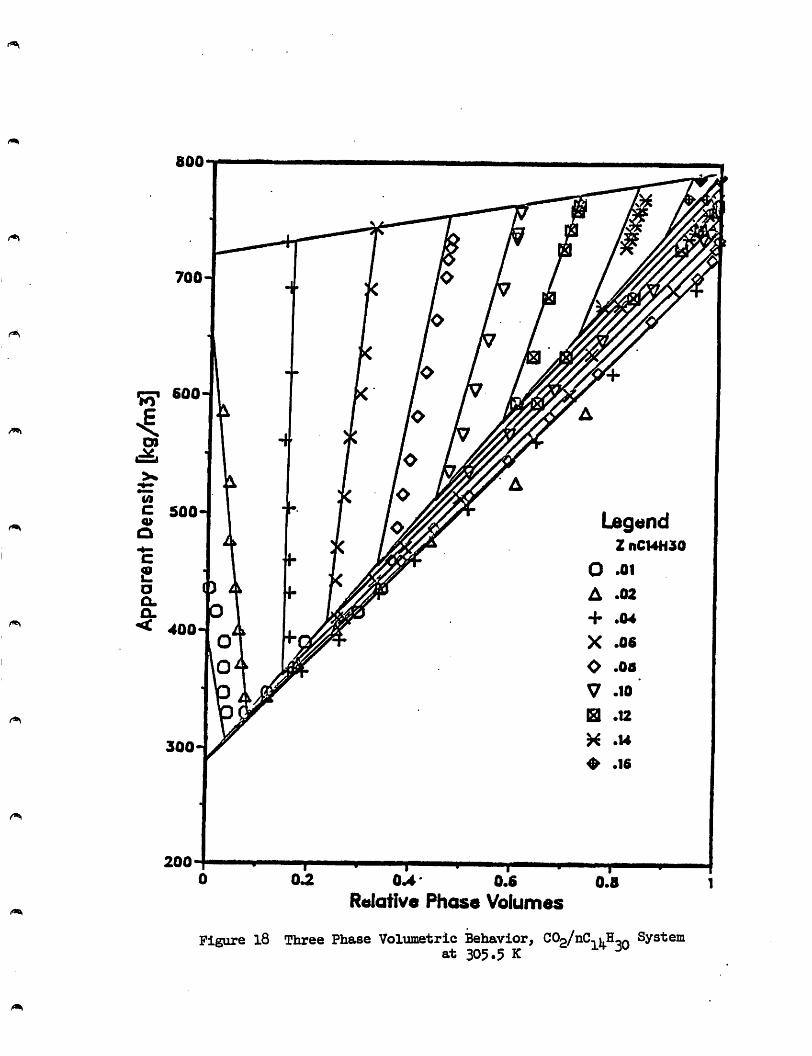
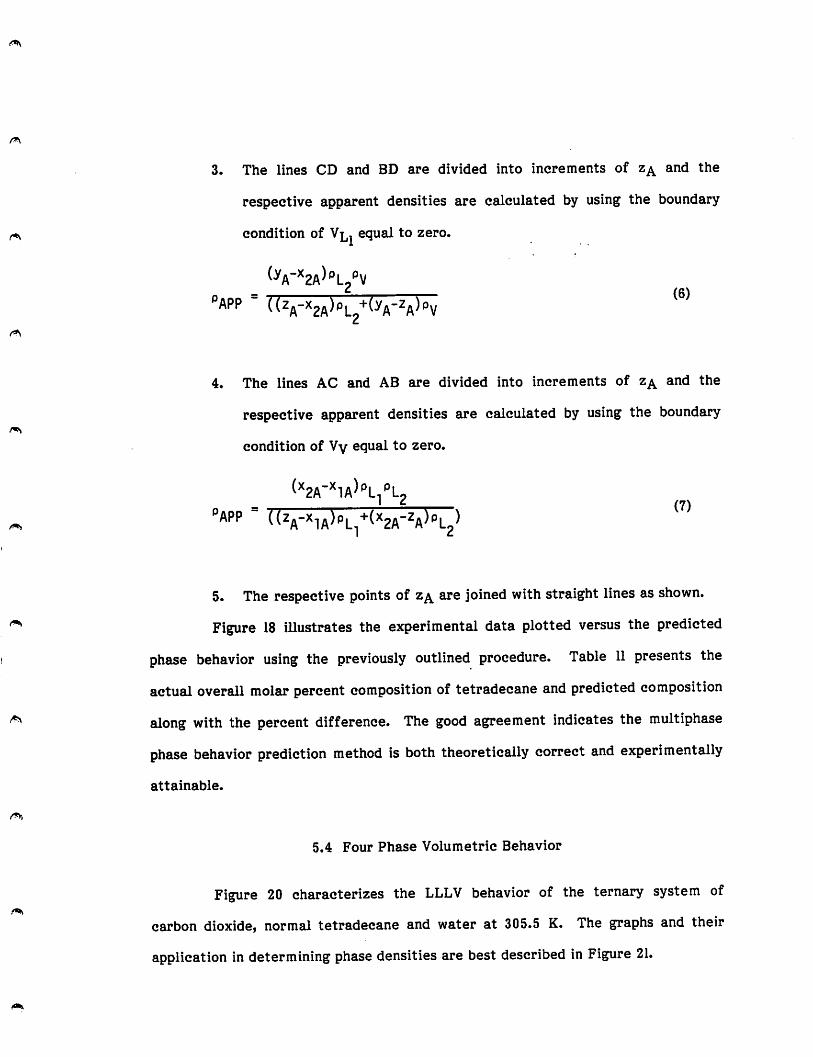
5.3 Three Phase Volumetric Behavior
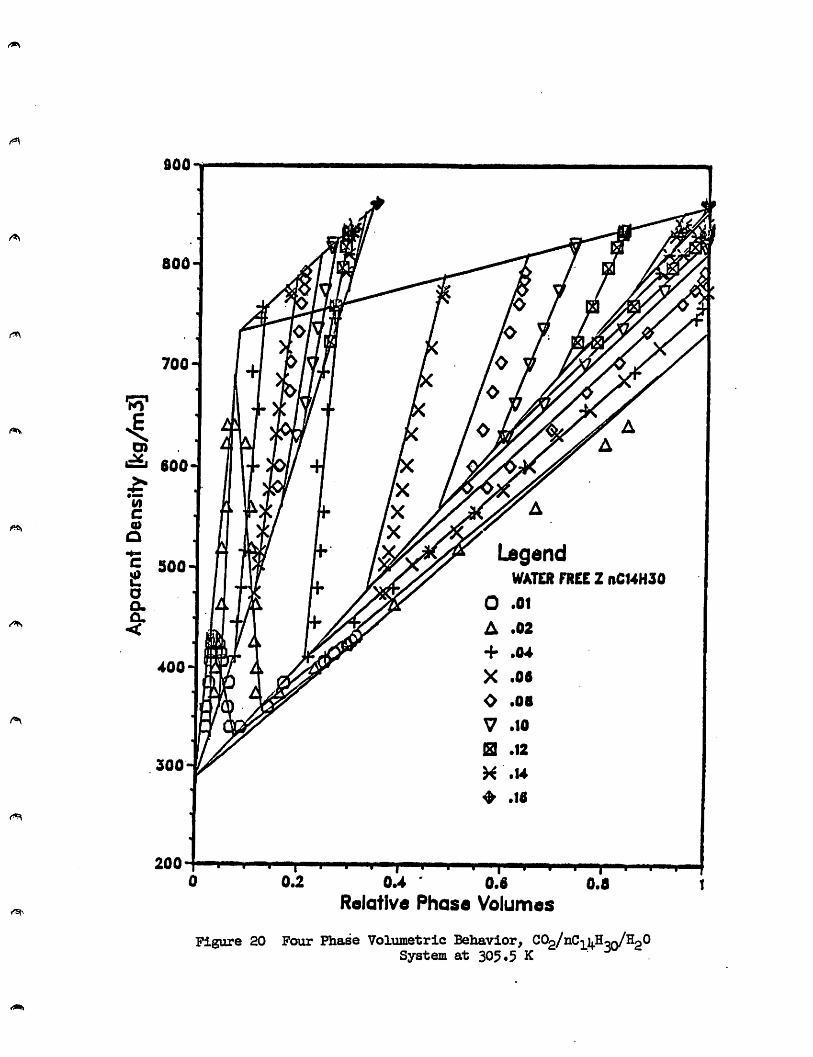
5.4 Four Phase Volumetric Behavior
/»>
(*.
TABLE OF CONTENTS
(Continued)
Page
5.5 Effects of Water
6.0 CONCLUSIONS
7.0 RECOMMENDATION
BIBLIOGRAPHY

LIST OF FIGURES
Figure No. Page
1 Critical Loci of C02/Alkane Systems
2 Experimental Apparatus
3 Volumetric Behavior at Various Pressures for90.0% CO2 and 10.0% nCi4H3o
4 Volumetric Behavior at Various Pressures for36.83% CO2, 4.08% nCi4H3o and 59.09% H2O
5 Pressure-Phase Volume Fraction Diagram,90.0% CO2 and 10.0% nCi4H3o at 305.5 K
6 Pressure-Phase Volume Fraction Diagram,86.0% CO2 and 14.0% nCi4H3o at 343.3 K
7 Pressure-Phase Volume Fraction Diagram,36.83% CO2, 4.08% nCi4H3o and 59.09% H2Oat 305.5 K
8 Pressure-Phase Volume Fraction Diagram,28.45% CO2, 4.62% nCi4H3o and 66.93%H2O at 343.3 K
9 Pressure-Phase Volume Fraction Diagram,82.34% CO2, 9.66% CH4 and 8.00%nCi4H3o at 305.5 K
10 Pressure-Phase Volume Fraction Diagram,85.92% CO2, 10.08% CH4 and 4.00%nCi4H3o at 343.3 K
11 Pressure-Phase Volume Fraction Diagram,38.20% CO2, 4.48% CH4, 3.71%nCi4H3o and 53.61% H2O at 305.5 K
12 Pressure-Phase Volume Fraction Diagram,54.46% CO2, 6.38% CH4, 2.54%nCi4H3o and 36.63% H2O at 343.3 K
13 Pressure-Composition Diagram, C02/nCi4H3oSystem at 305.5 K
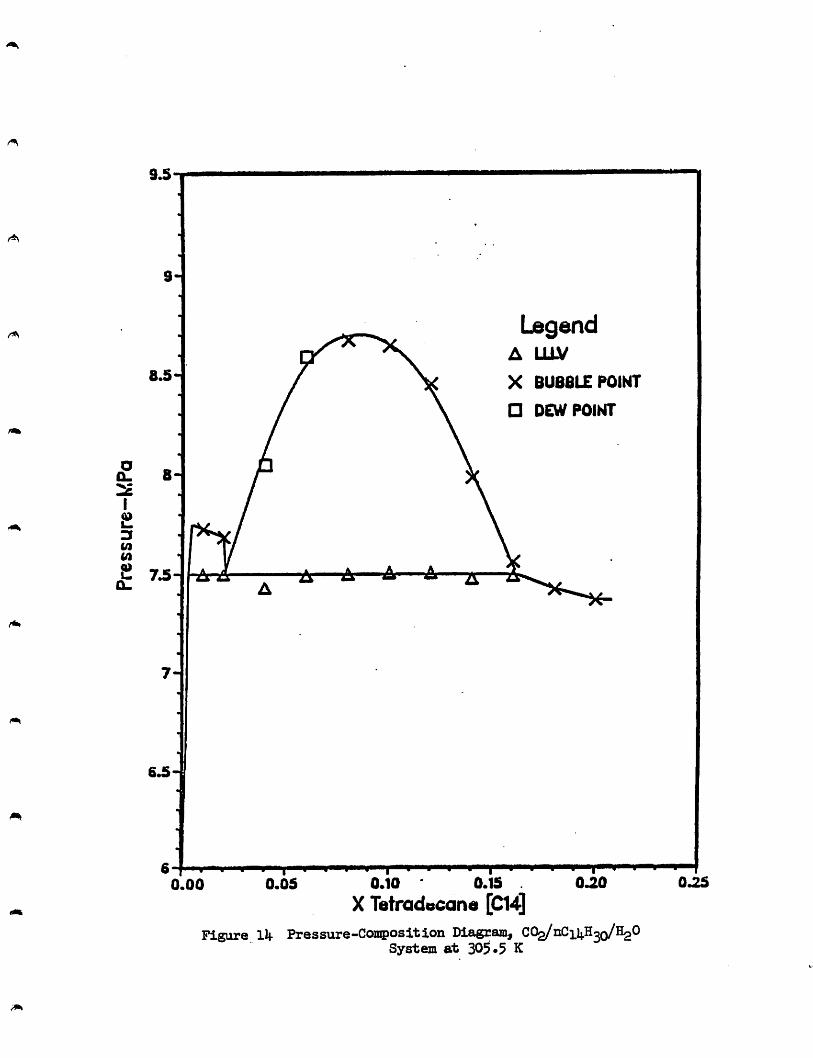
14 Pressure-Composition Diagram, C02/nCi4H3o/H2O System at 305.5 K
LIST OF FIGURES
(Continued)
Figure No.
15 Pressure-Composition Diagram, Comparisonof C02/nCi4H3o and C02/nCi4H3o/H20Systems at 343.3 K
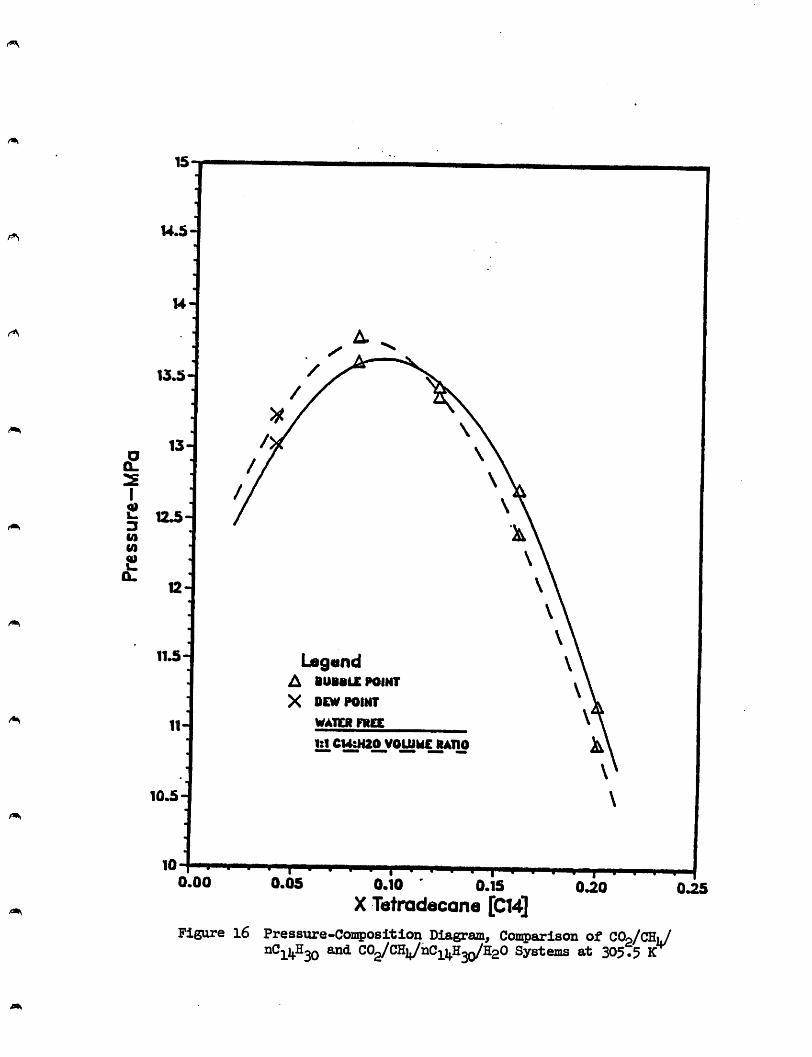
16 Pressure-Composition Diagram, Comparisonof C02/CH4/nCi4H3o and CO2/CH4/nCi4H3o/H20 Systems at 305.5 K
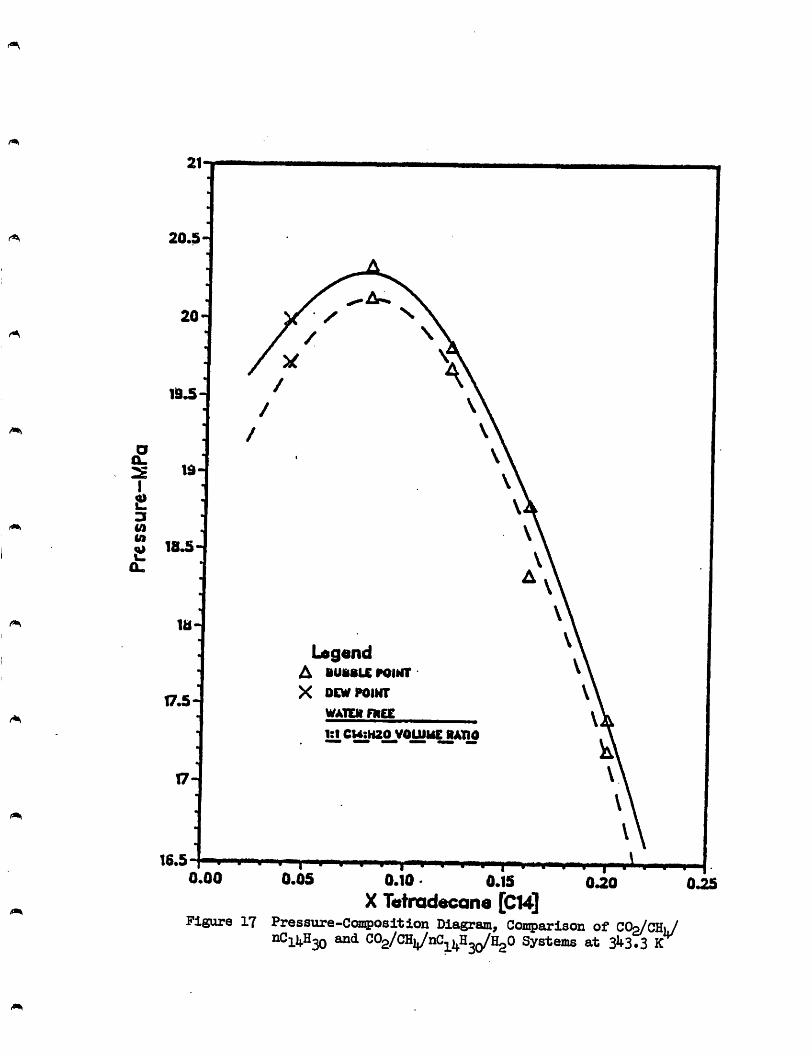
17 Pressure-Composition Diagram, Comparisonof C02/CH4/nCi4H3o and CO2/CH4/nCi4H3o/H20 Systems at 343.3 K
18 Three Phase Volumetric Behavior, C02/nCi4H3oSystem at 305.5 K
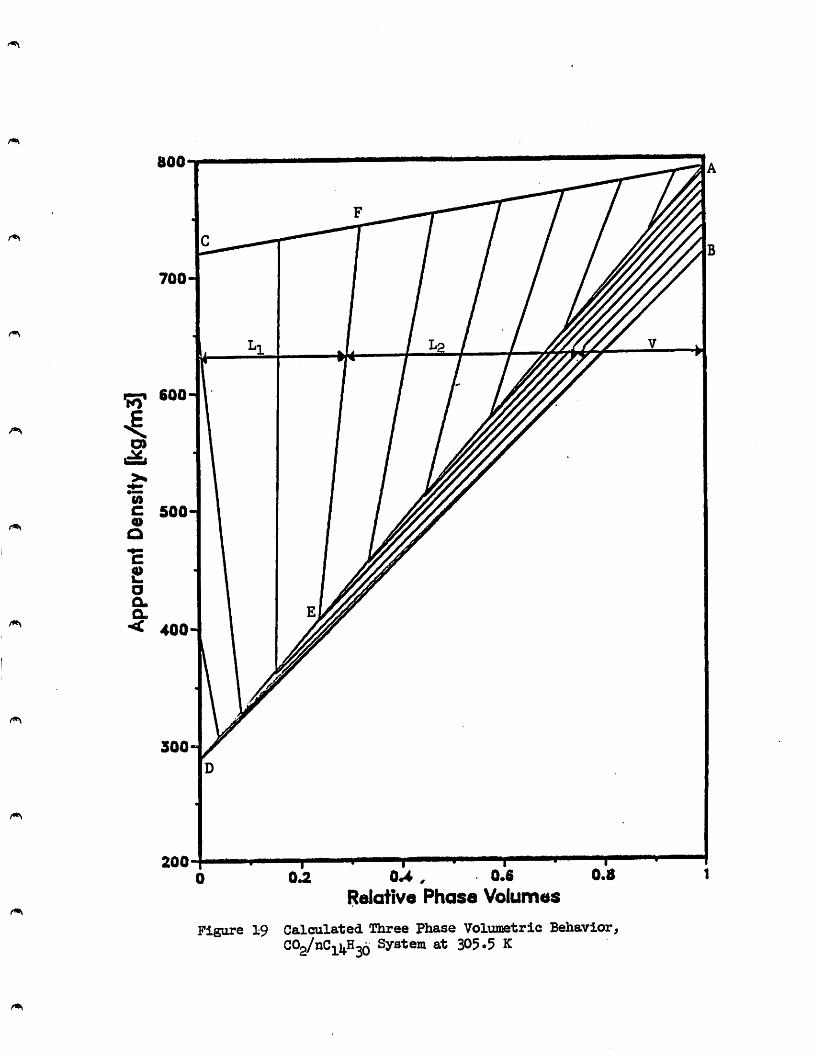
19 Calculated Three Phase Volumetric Behavior,CO2MC14H30 System at 305.5 K
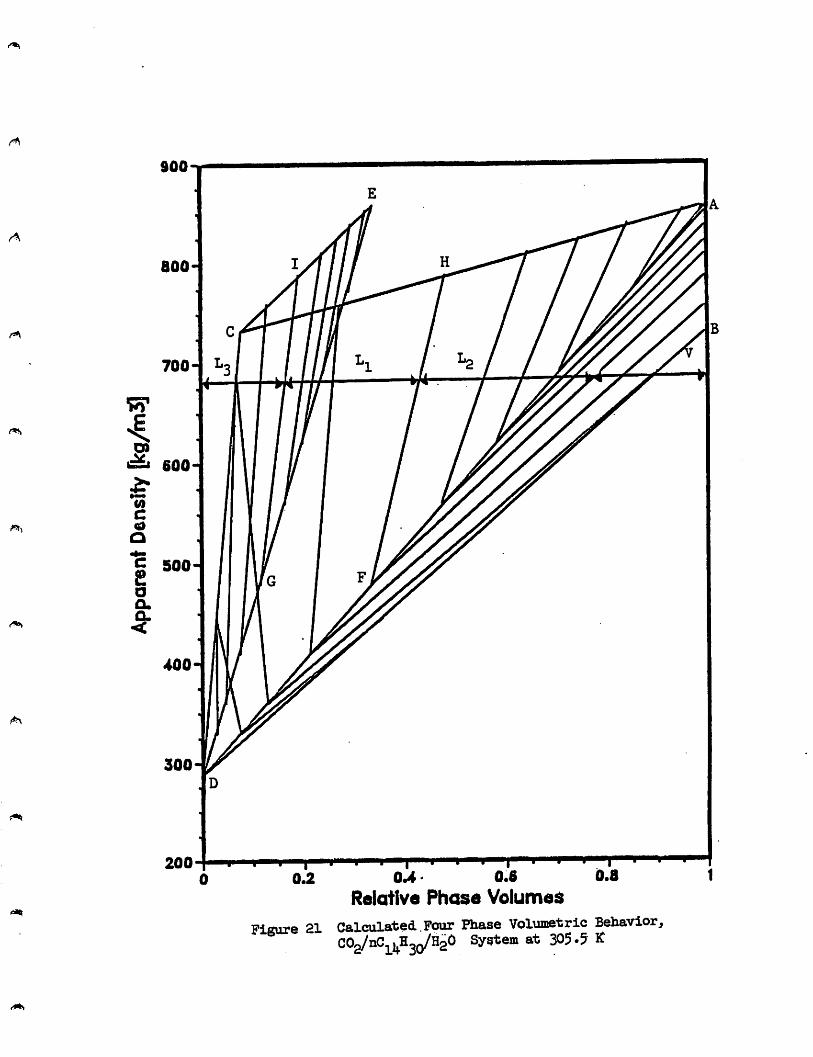
20 Four Phase Volumetric Behavior, CO2/11C14H30/H2O System at 305.5 K
21 Calculated Four Phase Volumetric Behavior,C02/nCi4H3o/H20 System at 305.5 K
LIST OF TABLES
Table No. Page
1 Volumetric Data for CO2/nCi4H30 Systemat 305.5 K
2 Volumetric Data for C02/nCi4H3o/H20 Systemat 305.5 K
3 Volumetric Data for C02/nCi4H3o Systemat 343.3 K
4 Volumetric Data for C02/nCi4H3o/H20 Systemat 343.3 K
5 Volumetric Data for C02/CH4/nCi4H3o Systemat 305.5 K
6 Volumetric Data for C02/CH4/nCi4H3o/H20System at 305.5 K
7 Volumetric Data for C02/CH4/nCi4H3o Systemat 343.3 K
8 Volumetric Data for C02/CH4/nCi4H3o/H20System at 343.3 K
9 Comparison of Bubble and Dew Points Calculatedand Measured for C02/nCi4H3o/H20 Systems at305.5 and 343.3 K
10 Three Phase Densities and Compositions
11 Comparison of the Actual and Calculated OverallComposition for the Three Phase Region
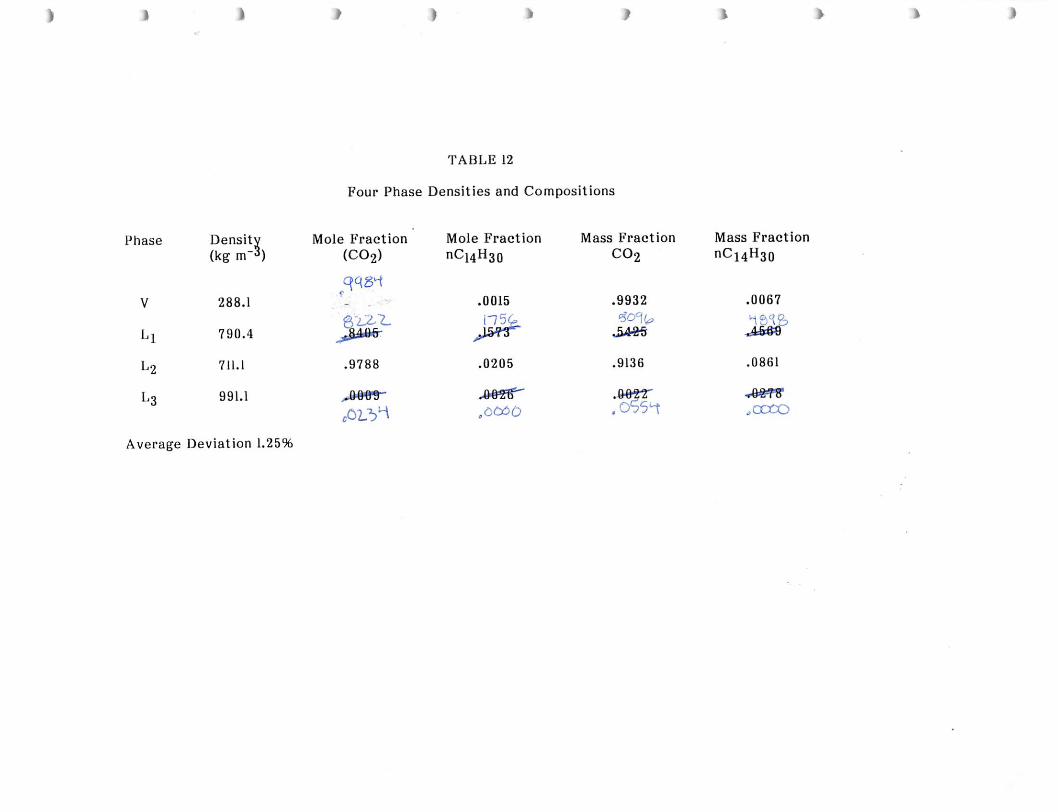
12 Four Phase Densities and Compositions
13 Comparison of the Actual and Calculated OverallComposition for the Four Phase Region

NOMENCLATURE
BPP bubble point pressure
CP critical point
DPP dew point pressure
F degrees Fahrenheit
K degrees Kelvin
L liquid
Ll hydrocarbon rich liquid
L2 carbon dioxide rich liquid
L3 water rich liquid
LL liquid-liquid
LLL liquid-liquid-liquid
LLV liquid-liquid-liquid-vapor
LLV liquid-liquid-vapor
LV liquid-vapor
MMP minimum miscibility pressure
MPa pascals X10®
MW molecular weight
P pressure
Psia pounds per square inch, absolute
PVT pressure-volume-temperature
T temperature
V vapor, m^
W weight, kg
X liquid mole fraction

y vapor mole fraction
z overall mole fraction
p density, kg m~3
NOMENCLATURE
(Continued)
1.0 INTRODUCTION
1.1 Overview of Conventional Oil-Recovery Methods
After discovery, most oil reservoirs typically undergo a period of
production called primary recovery in which natural energy associated with a
reservoir is used to recover a portion of the oil in place. Mechanisms which utilize
the initial pressure energy such as liquid expansion and rock compaction help drive
reservoir fluid into wellbores as the pressure declines. When the pressure of the
reservoir drops far enough, additional recovery is obtained from gas expansion and
liberation. In some reservoirs additional oil is recovered from water encroachment
from an aquifer. Water displaces oil and oil production is sustained. When this
energy has been depleted and the rate of oil recovery becomes uneconomical, oil
production can only be increased through the injection of secondary energy into the
reservoir.
A secondary method for recovery is often justified due to the fact that
typical values for primary recovery are only five to twenty percent of the original oil
in place. Direct fluid injection into the reservoir has become the acceptable
method for both maintaining reservoir pressure and displacing oil. The two methods
most widely employed utilized primary recovery mechanisms. Water is injected to
enhance the recovery by water encroachment and gas is injected, at a pressure
where the gas is immiscible with the oil, to enhance gas cap expansion. These
techniques have become known as secondary recovery. However, the ultimate
recovery achievable by waterflooding or immiscible gas injection is somewhat
limited primarily because of low volumetric sweepout efficiency of the injection
fluid, poor displacement efficiency of the injection fluid in rock that is swept, and
oil displaced from the swept reservoir volume is not all captured by the producing
wellbore but goes to resaturate unswept rock which may have been depleted during
primary recovery.
Even though significant amounts of oil are recovered from primary and
secondary recovery methods, ultimate oil recovery generally is only in the range of
twenty to forty percent of the original oil in place. Therefore, tertiary recovery
methods have been developed to recover the remaining oil in place. The tertiary
methods include such techniques as miscible fluid displacement, microemulsion
flooding, thermal methods, and other chemical flooding methods. These methods
target mobilization of residual oil, interfacial tension reduction between the oil and
rock and oil and water, viscosity reduction, and increased volumetric sweep
efficiency respectively.
However, application of tertiary processes usually entails substantial risk
because of their technological sophistication and front loaded financial
requirement. Operational problems such as the corrosion of equipment, high heat
losses, and high material costs lead to the unattractiveness of these methods.
Therefore, extensive planning and design along with careful operation are required
when a method is applied in the field.
1.2 Carbon Dioxide Flooding
Recent activity in miscible flooding has focused on the C02-miscible
process. Carbon dioxide flooding has been studied since the 1950's(^"^)* but
♦Parenthetical references placed superior to the line of text refer to thebibliography.
currently this process is of most interest with respect to the other tertiary
recovery processes.^^) The attractiveness of carbon dioxide as a component for the
supercritical extraction process is that carbon dioxides critical temperature, Sl^C,
is at the lower end of a relatively narrow range of reservoir temperatures (30-
120OC).(®) Even though carbon dioxide has a low viscosity, thus reducing the
volumetric sweepout efficiency, carbon dioxides high density and strong solvent
properties above the critical temperature minimized C02/oil segregation. This
allows for greater mixing and relatively low pressures for miscibility. Other
mechanisms involved during CO2 floods, other than miscibility, are oil swelling,
viscosity reduction, interfacial tension reduction, solution gas drive, and
immiscibilty drive. All of these factors will increase the overall recovery of oil
from the reservoir. The major drawbacks are mobility control, asphaltene
decompostion, and cost.
Carbon dioxide flooding may be applied in the field as a secondary or, in
most cases, a tertiary process. It can be carried out in any of the following
manners:
1. Continuous injection of CO2
2. Carbon dioxide followed by less expensive gas
3. Carbon dioxide followed by water
4. Simultaneous/alternate injection of CO2 and water
5. Combination C02/solvent injection
6. Combination C02/heat injection(7)
The choice between these modes of application will depend on a great number of
factors. Nevertheless, as a general guide, in reservoirs in which the displacement is
horizontal or nearly so, the CO2 flooding process will involve alternating injection
of CO2 and water to attempt to control the mobility of the fluids, whereas in
vertical floods the various fluids will be injected sequentially.
In the evaluation of whether a field is appropriate for carbon dioxide
flooding^! several types of experiments are performed on the oil from the field.(®)
The test includes high pressure volumetric (PVT) and vapor-liquid equilibrium (VLE)
studies, slim tube displacement (STD) studies, core displacements and continuous
multiple contact experiments. Along with the results of these tests, for a miscible
flood to be a competitive process in a given reservoir, an adequate volume of CO2
must be available at a rate and cost that will allow favorable economics, the
reservoir pressure required for miscibility must be attainable and the incremental
oil recovery must be sufficiently large and timely for project economics to
withstand the added costs.^®) The primary concern of this study is the PVT and
VLE studies.
1.3 Review of Previous Work
Multiple phase behavior may be experienced during the carbon dioxide
miscible flooding of petroleum reservoirs. In water-free carbon dioxide/crude oil
systems, three phases often exist in equilibrium at low temperatures.^^^) However,
since water is almost universally present, either interstitially or because it is
injected for mobility control,^^) its presence should also be considered in phase
behavior studies. Due to the relatively low miscibility of water with both carbon
dioxide and hydrocarbons at reservoir conditions, an aqueous phase will almost
always exist, resulting in the possibility of a fourth phase being present.
Alkanes constitute a large portion of a typical crude oil, and therefore
many carbon dioxide-normal alkane binary systems have been studied. Liqid-liquid-
vapor (LLV) immiscibility has been observed in CO2 + n-paraffin binary systems
ranging from n-heptane(^2) to n-ercosane.^^^) Schneider et performed the
earliest studies showing the LLV immiscibility with n-octane, n-undecane, n-
tridecane and n-hexadeeane. Kulkarni et al.^^*^) studied the CO2 + n-decane system
along with its multiple phase loci, including LLV while Hbttory et al.(^^) detailed
the LLV behavior of the binary systems containing n-dodecane to n-pentadecane.
Luks et al.(19) performed studied to determine the LLV immiscibility limits for
CO2 +n-nonadecane and CO2 +n-heneicosane. Orr et al.(20) presented data on the
three phase pressure for O2 + n-tetradecane at various temperatures. Enick et
al.(21) presented extensive equilibria data on the multiple phase behavior of the
CO2 + n-tridecane binary system.
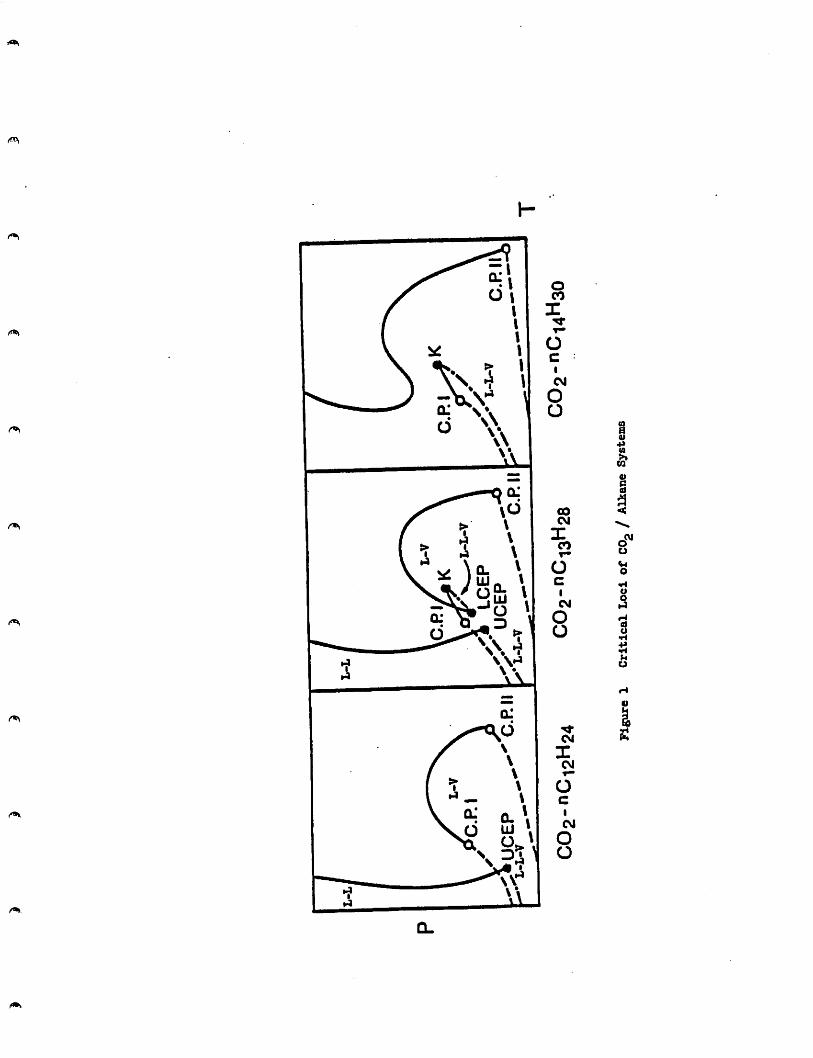
It was learned from the Enick, Holder and Morsi study that there is a
transition in the nature of the LLV loci (see Figure 1). As the length of the
hydrocarbon chain increases up to nCi2H26> the steep liquid-liquid (LL) critical
branch joins the critical points of the two pure components. The liquid-liquid-
vapor (LLV) locus extends from the quadrupole point (Q) to the upper critical end
point (UCEP). A transition occurs in the nCi3H28 system. The critical branch
which originates at the critical point of CO2 terminates at the K point, point
where L2 and V phases become critical. An LLV locus joins the K point and the
lower critical end point (LCEP) where the Lj and L2 phases become critical.
Another critical branch extends from the LCEP to the critical point of nCi3H28»
These two liquid-vapor (LV) loci cross near the LCEP.^^^^ For the nCi4H28 system,
the LL branch does merge with the LV branch. This critical locus continues to
shift to high temperatures as the carbon number of the normal alkane increases. In
each of these systems, a second critical branch extends from the critical point of
carbon dioxide to the K point. The LLV locus lies just beneath the vapor pressure
curve of carbon dioxide and is bounded by the Q and K points. The temperature
.-:;
*u
cE
P--
•'X
-L-V)C
EP
C.R
II'V C0
2-"
Ci2
H2
4
UC
EP
XL
-L-V
C.R
II
C02
-^C
-j3H
28
✓O*
L-L
-V
CO
2-n
Ci4
H3
0
FiB
ure
1C
riti
cal
Loc
iof
CO^
/A
lkan
eSy
stem
s
range of the LLV locus is greatest with n-tetradecane, which has an LLV locus
extending from a Kpoint at 311.15 Kto a Q point at 269.10 K.(20) For this reason,
normal tetradecane was chosen for this study in hopes that multiple phase behavior
would be observed in the systems containing methane, an impurity which would
lower the temperature range of multiple phase behavior. Furthermore, no critical
point data is available for this particular C02/alkane binary system.
In this study, the primary concern is the PVT and VLE of a normal alkane
and carbon dioxide along with the effects water has on the system. Although many
ions are present in the brine actually found in fields, pure water will be used in this
study. This will probably yield the maximum changes in phase behavior since the
main effects of the ions is to decrease solubilities of gases such as CO2 in the
water. Specifically, phase equilibria data are presented for the liquid-vapor (LV)
and the LLV region for the binary system of carbon dioxide and tetradecane. In
addition to the binary data, phase equilibria data are presented for the LLV and
liquid-liquid-liquid-vapor (LLLV) region for the same binary system with addition of
water. LV equilibria data are also presented for the carbon
dioxide/methane/tetradecane system along with LLV equilibria data for water
added to the system. Although several numerical and graphical methods of
determining the properties of each of the three phases have been proposed, new
techniques for determining phase densities and compositions using volumetric
behavior of a system of a known constant overall composition for three and four
phases will be presented. Also, a technique using volume, mass and component
balances will be presented which enables the multiple phase behavior to be
predicted.

2.0 STATEMENT OF THE PROBLEM
Recently, specific attention has been directed toward the liquid-vapor and
liquid-liquid-vapor pahse equilibria behavior of binary carbon dioxide-hydrocarbon
mixtures, specifically the carbon dioxide-normal alkane series. These binary
mixtures are important constituent pairs in carbon dioxide-crude oil systems as
encountered in the carbon dioxide miscible displacement of crude oil from a
petroleum reservoir. However, it is apparent that the effects of water, which is
present in all petroleum reservoirs, on the multiple phase behavior should also be
investigated.
Due to its relatively low solubility with both compounds, the effects of
water have often been assumed to be negligible. Another common approach has
been to simply account for the CO2 solubility in water. This study will determine
if either of these assumptions are justified and, if not, will establish a need for a
more thermodynamically sound model.
The primary goal of this study was to gain an understanding of the effects
of water. One, two and three phase equilibrium data for the binary system of
carbon dioxide and n-tetradecane are measured at various compositions,
temperatures and pressures. Two, three and four phase equilibrium data for the
same system is measured after the addition of water at the same temperatures. In
addition, 10.5 mole percent methane was added as an impurity to the carbn dioxide.
The change in phase behavior was measured at the same temperatures for systems
with and without water. The secondary goal of this work is to present a systematic
analysis of three phase volumetric behavior of binary systems and four phae
volumetric behavior of ternary systems.
3.0 EXPERIMENTAL
3.1 Experimental Apparature
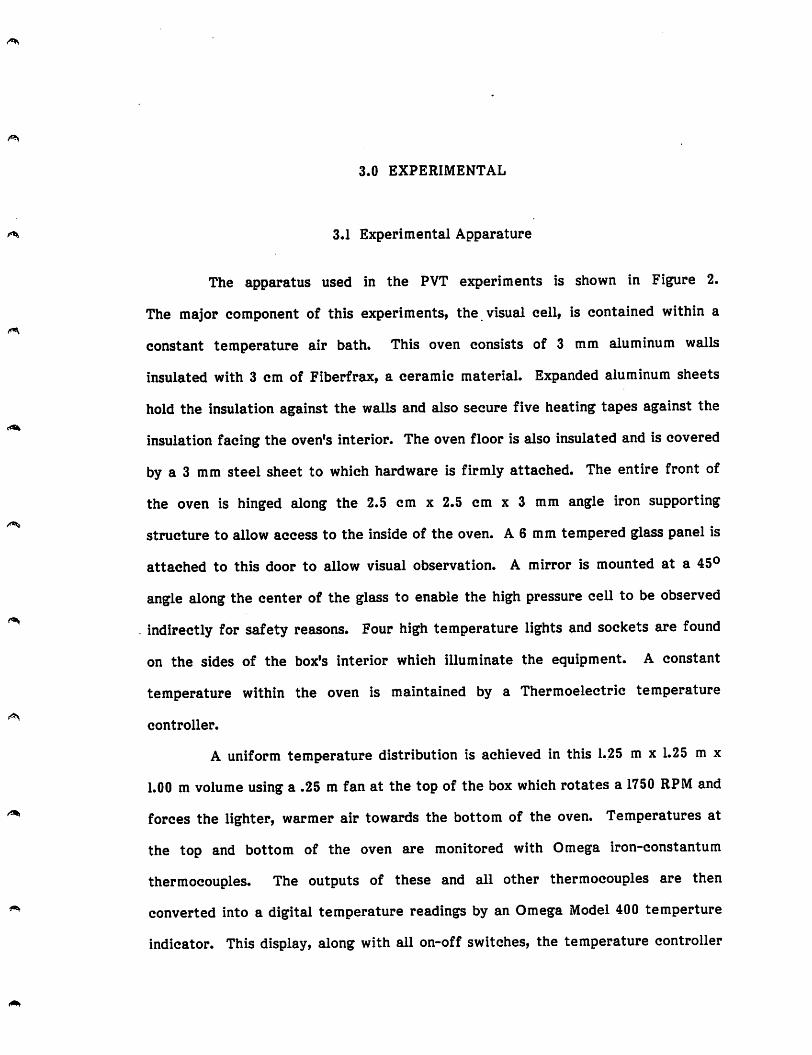
The apparatus used in the PVT experiments is shown in Figure 2.
The major component of this experiments, the visual cell, is contained within a
constant temperature air bath. This oven consists of 3 mm aluminum walls
insulated with 3 cm of Fiberfrax, a ceramic material. Expanded aluminum sheets
hold the insulation against the walls and also secure five heating tapes against the
insulation facing the oven's interior. The oven floor is also insulated and is covered
by a 3 mm steel sheet to which hardware is firmly attached. The entire front of
the oven is hinged along the 2.5 cm x 2.5 cm x 3 mm angle iron supporting
structure to allow access to the inside of the oven. A 6 mm tempered glass panel is
attached to this door to allow visual observation. A mirror is mounted at a 45<^
angle along the center of the glass to enable the high pressure cell to be observed
indirectly for safety reasons. Four high temperature lights and sockets are found
on the sides of the box's interior which illuminate the equipment. A constant
temperature within the oven is maintained by a Thermoelectric temperature
controller.
A uniform temperature distribution is achieved in this 1.25 m x 1.25 m x
1.00 m volume using a .25 m fan at the top of the box which rotates a 1750 RPM and
forces the lighter, warmer air towards the bottom of the oven. Temperatures at
the top and bottom of the oven are monitored with Omega iron-constantum
thermocouples. The outputs of these and all other thermocouples are then
converted into a digital temperature readings by an Omega Model 400 temperture
indicator. This display, along with all on-off switches, the temperature controller

Hxh
>
(sn)
hN"
1 Nitrogen Tank 5 Water Cell
2 Solvent Cell 6 Oil Cell
3 Ruska Windowed Condensate Cell 7 Carbon Dioxide Tank
Direction of Rotation Indicated8 Mercury Reservoir
Colled Tubing9 Ruska Proportionating Pump
Figure 2 Experimental Apparatus
3

and pressure guages are mounted on two 3 mm aluminum side panels which flank the
oven.
The tetradecane and carbon dioxide are charged into a 400 cm^ Ruska
windowed) volatile oil cell) which is rated to 150®C and 70 MPa. The entire volume
of the ceil may be viewed, allowing visualdetermination of bubble points. This cell
is supported by a 3.0 cm x 3.0 cm x 0.5 cm angle iron frame upon which two pillow
blocks are bolted. The pillow blocks hold a 2.5 em 304 stainless steel rod which is
welded to a 304 stainless steel plate which in turn is bolted to the cell. The rod
passes through the back wall and is bolted into a 8.0 cm x 2.5 cm x 10 cm 304
stainless steel bar. This bar may be rotated manually in order to invert the cell in
the event that an interface is hidden by the two steel supports in front of the
wondows. The levels of all interfaces are measured with an Eberbach 40 cm
cathetometer. The cell is designed such that if an interface is hidden, it must be
visible when the cell is inverted. The cell may be rocked in order to mix the
components by a Scotch yoke assembly powered by a variable speed D.C. motor.
All tubing which leads to the cell is coiled about the supporting rod to permit
rotation without removal of any fittings or connections.
Thermocouples are inserted into the cell's thermowells to accurately
monitor the temperature in the cell's walls. Omega retractable sensor cables were
employed to facilitate the rotation of the cell.
All mercury displacement is achieved with a Ruska double cylinder
proportioning pump. A two liter Ruska mercury reservoir is used to safely store
mercury which is not in use.
Pressure is measured on the mercury injection line to + 12 kPA on a 35
MPa Heise gauge along with a Viatran, Model 701-115, transmitter to + 0.25%.
Pressure readings are read and recorded with a Kaye Digistrip II recorder.

The system is evacuated with a Cence Hyvac 14 vacuum pump.
Tetradecane is added to the cell using a 500 cm^ Ruska high pressure oil
storage cell by mercury displacement. Water is also added to the cell by mercury
displacement but it is stored in a one liter Whitey high pressure sample cylinder.
Upon completion of an experiment, vapor was discharged to a hood and
liquids to a waste container. In order to clean the visual cell, a 300 cm^ cylinder
was charged with solvent. Nitrogen from an Air Products A cylinder, regulated to
low pressure, forced solvent from the cylinder into the Ruska cell, removing all
residuals. The nitrogen then followed the solvent, dry the interior of the cell.
3.2 Experimental Procedure
The Ruska condensate cell is evacuated and carbon dioxide at a 99.99
percent purity is allowed to fill the cell at the vapor pressure of carbon dioxide at
25®C. The carbon dioxide is compressed by mercury injection to three supercritical
pressures, approximately 2000, 2500 and 3000 psia, where experimentally
determined compressibility factor are known.(^) The temperature and volume is
recorded and the number of moles of carbon dioxide is calculated using the gas law
to an average accuracy of + 0.005 moles. Mercury is then slowly drawn out of cell
until the desired experimental starting pressure is reached. The mass and volume of
the required normal tetradecane is calculated to obtain the desired composition.
The specific volume of the tetradecane, 99% purity, is displaced from its storage
cell using mercury, which is immimscible with other fluids, to displace it with an
accuracy of + 0.05 cm^.
The temperature controller is set at the desired temperature controller is
set at the desired temperature and the heaters turned on. The cell is kept at a

constant temperature, + 0.25 K, in the thermostated air bath. Mercury is then
injected directly into the cell to the compress the contents. After rocking the cell
for five to ten minutes to promote equilbrium, the cell is placed in the verticle
position for several minutes to promote drainage of the liquids from the wall of the
cell. The interface levels are then measured with the cathetometer whose height
readings were previously calibrated. The pressure is then read and recorded on the
digistrip recorder. Small volumes, 5-20 cm^, of mercury are then repeatedly
injected and new volume and pressure readings are taken after each injection. This
activity is continued until only one phase is present. The mercury is then slowly
withdrawn until the saturation pressure is reached, which is indicated by the first
bubble of vapor. Retrograde dewpoints, as indicated by the formation of a more
dense fluid, liquid, upon pressure reduction, may also occur. Mercury is then slowly
drawn out until the original pressure is attained.
Water, at a one to one volume ratio of water to tetradecane, is added by
mercury displacement into the cell. The same method previously outlined is
conducted. After completion, the mercury is drawn out and the cell is emptied and
cleaned.

4.0 RAW DATA
In this section, the experimental data will be presented. Data has been
taken for the carbon dioxide and normal tetradecane binary system at 305.5 K and
343.3 K and various compositions. For the same binary system, data was also taken
with water added to the system. Water was added at a one to to one volume ratio
between water and tetradecane. In addition, data was taken for the ternary system
of carbon dioxide, methane and normal tetradecane. Methane at 10.5 mole percent
was added to the carbon dioxide as an impurity.
Figure 3 and 4 are a visual representative of the experiments conducted
and the data obtained. Figure 3 shows the sequence of the volumetric behavior of
each phase for a typical run for the C02/nCi4H28 system at 305.5 K. At this
temperature and composition, two and three phase behavior are exhibited. Figure 4
shows the sequence of the volumetric behavior of each phase for the same system
shown in Figure 3 but with water added. At this temperature and composition,
three and four phase behavior are exhibited.
4.1 PVT Data for C02/nCi4H3o
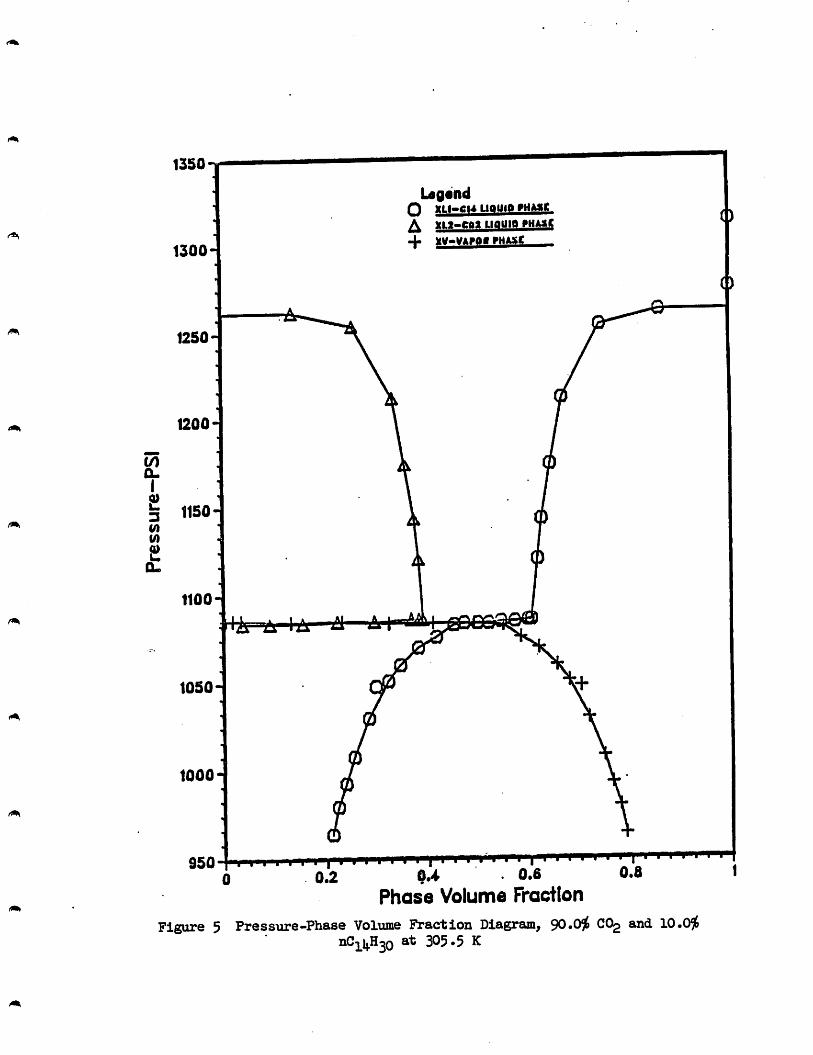
Figure 5 exhibits the volumetric data for 90.0% CO2 and 10.0% nCi4H3o
at 305.5 K. At low pressures, a clear liquid and a clear vapor were observed. As
pressure was increased a second clear liquid formed. By increasing the amount of
mercury in the cell, the vapor phase disappeared leaving the two liquid phases.
Finally, as pressure was increased, the lower density, CO2 rich liquid disappeared at
the bubble point of the mixture. Table 1 presents the data for the system at 305.5
K. Figure 6 shows the volumetric data for 86.0%C02 and 14.0% nCi4H3o at 343.3
K. At this temperature, only two phase behavior was observed as pressure increased.

U
i'f-
ilfel
Ki;
i-:
10
70
VV
apo
rP
hase
.-.
f••?
•.,'•
SI
10
80
••"'
;f-.
.
Bf.
&V
/i
mm
i
X0
80
Li
Ci^H
^oR
ich
Liq
uid
Phas
e
li2CO
^R
ich
Liq
uid
Pha
se
Merc
ury
10
80
5?''i*
•':
*•
11
20
m(
^.V
feii
12
62
5'V-
<'••
y.;
:r'
12
75
Fig
ure
3V
olu
met
ric
beh
avio
rat
vari
ou
s
pres
sure
sfo
r$0
*0'f>
CO2
an<i
10.0
i
®^lU
®30
-PJ
^sss
ures
inps
iaar
ein
dica
ted
belo
weach
fig
ure
.T
=3
05
«5
K

?'"
V
WM
s9
90
10
55
10
88
10
88
VV
apo
rP
hase
Ll
Liq
uid
Phas
e
COg
Ric
hL
iqui
dPh
ase
L3
HgO
Ric
hL
iqu
idPh
ase
Merc
ury
•itm
i
m'ij
-
••••
10
38
10
99
12
W1
29
6
Fig
ure
^V
olum
etri
cb
ehav
ior
at
var
iou
s
pre
ssu
res
for
36.8
3i>
CO2,
*f.0
3^
and
59.0
9^
H2O
.P
ress
ures
inp
sia
are
ind
icate
db
elo
weach
fig
ure
,T
s=3
05
.5K
1s3
U)
i
1350
1300-
1250-
1200
1150
1100
lA A lA
1050
1000
UfliindO UOUitt »HMtC
»L»«.CIil UQUIB i»HA«C
-f fHilXC
950 I I I I I I I0 0.2 0»4 • 0.6
Phase Voluma Fraction
Figure 5 Pressure-Phase Volume Fraction Diagram, 90.0^ CO2 and 10.0^nCiij.H3o at 305.5 K

/•n
P(psi)
TABLE 1
Volumeteric Data for CO /nC H Systems at 305.5 K2 14 30
Composition (molar): 99.00 %CO^ 1.00
V (cm)Ll
V (cm)L2
nC H14 30
V (cm)V
962. 8.80 0.00 350.01
985. 8.80 0.00 330.61
997. 8.90 0.00 319.31
1012. 9.10 0.00 306.01
1025. 9.50 0.00 292.21
1038. 9.90 0.00 278.81
1047. 10.20 0.00 266.41
1057. 10.50 0.00 255.41
1068. 10.70 0.00 241.91
1076. 10.90 0.00 231.01
1079. 9.50 8.40 210.91
1079. 7.50 18.60 191.21
1080. 7.00 28.30 170.01
1080. 6.60 30.70 156.41
1080. 3.10 50.70 127.71
1081. 0.50 58.70 113.81
1093. 0.00 66.40 99.81
1101. 0.00 74.60 82.11
1113. 0.00 84.30 61.71
1124. 0.00 94.05 39.96
1128. 0.00 97.06 27.85
1133. 0.00 113.50 0.21
1150. 0.00 112.41 0.00
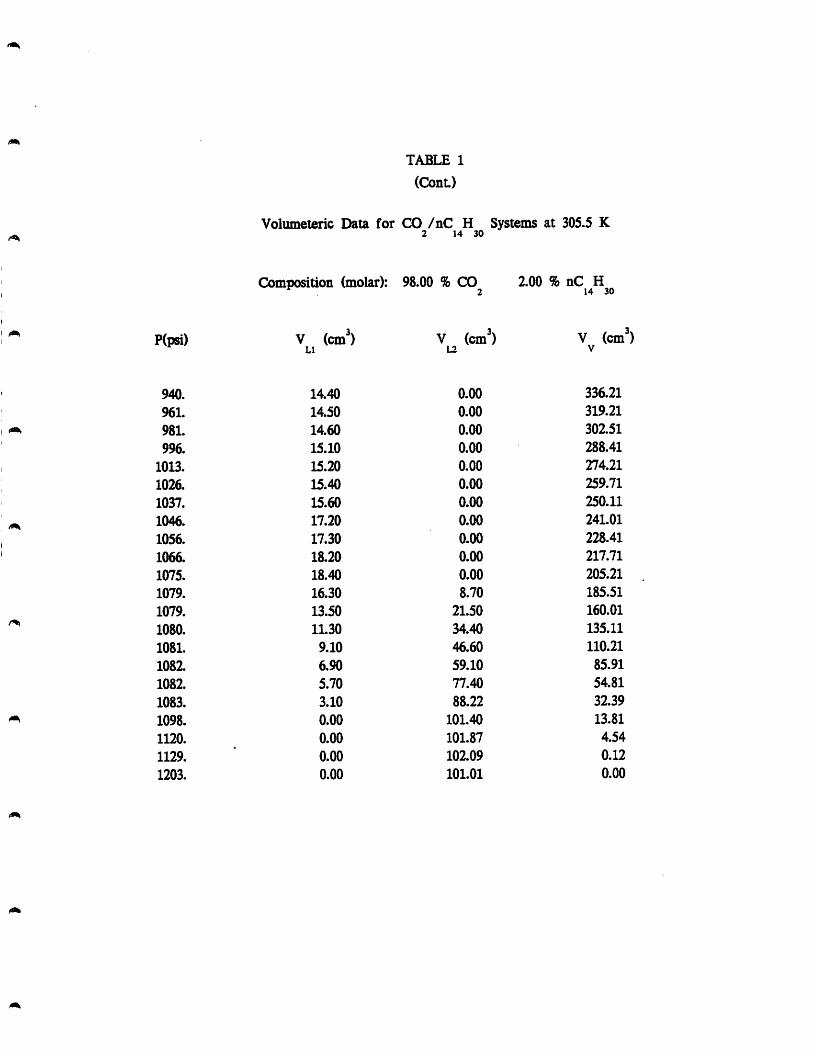
TABLE 1
(CitonL)
Volumeteric Data for CO /nC H Systems at 305.5 K2 14 30
Composition (molar): 98.00 % CO2
2.00 % nC H14 30
P(psi) V (cm^)Ll
V (cmL2
') V (cm'V
940. 14.40 0.00 336.21
961. 14.50 0.00 319.21
981. 14.60 0.00 302.51
996. 15.10 0.00 288.41
1013. 15.20 0.00 274.21
1026. 15.40 0.00 259.71
1037. 15.60 0.00 250.11
1046. 17.20 0.00 241.01
1056. 17.30 0.00 228.41
1066. 18.20 0.00 217.71
1075. 18.40 0.00 205.21
1079. 16.30 8.70 185.51
1079. 13.50 21.50 160.01
1080. 11.30 34.40 135.11
1081. 9.10 46.60 110.21
1082. 6.90 59.10 85.91
1082. 5.70 77.40 54.81
1083. 3.10 88.22 32.39
1098. 0.00 101.40 13.81
1120. 0.00 101.87 4.54
1129. 0.00 102.09 0.12
1203. 0.00 101.01 0.00

TABLE 1
(Cont)
Volumeteric Data for CO /nC H Systems at 305.5 K2 14 30
Composition (molar): 96.00 %CO^ 4.00 %
P(psi) V (cm^) V (cm^) V (cm^)Ll L2 V
946. 27.40 0.00 325.61
964. 27.60 0.00 308.21
981. 28.90 0.00 291.01
999. 30.60 0.00 272.81
1013. 30.90 0.00 258.51
1028. 31.50 0.00 240.51
1045. 33.10 0.00 220.01
1056. 35.80 0.00 200.81
1065. 35.20 6.20 179.01
1065. 33.10 19.90 151.30
1066. 30.00 32.80 123.41
1068. 27.90 43.00 103.71
1069. 25.20 56.10 78.11
1070. 21.20 70.90 51.31
1071 20.50 82.00 27.31
1073. 18.00 92.88 5.33
1074. 16.00 93.72 0.29
1122. 11.50 97.01 0.00
1139. 7.90 99.81 0.00
1142. 1.70 105.70 0.00
1153. 0.00 107.21 0.00

TABLE 1
(ConL)
Volumeieric Data for CO /nC H Systems at 305.5 K2 14 30
Composition (molar): 94.00 %CO^ 6.00 %
Kpsi) V (cm') V (cm') (cm')ILl ^*2
932. 30.70 0.00 289.41
950. 35.40 0.00 270.71
970. 36.60 0.00 254.51
991. 36.90 0.00 236.61
1008. 37.60 0.00 221.71
1030. 39.20 0.00 201.51
1051. 39.90 0.00 182.31
1063. 43.20 0.00 167.21
1071. 44.40 0.00 155.91
1076. 46.00 0.00 148.51
1080. 47.60 2.60 136.51
1081. 43.60 13.40 116.41
1083. 41.50 21.60 100.11
1084. 39.70 33.70 75.91
1085. 37.50 49.08 49.63
1085. 37.60 52.66 37.55
1085. 36.40 53.90 30.51
1084. 34.60 66.53 10.08
1082. 33.10 69.50 0.71
1194. 25.00 74.01 0.00
1198. 23.40 75.31 0.00
1205. 20.00 78.21 0.00
1215. 18.70 79.21 0.00
1237. 10.60 87.01 0.00
1247. 0.00 97.51 0.00

TABLE 1
(Cont)
Volumeteric Data for CO /nC H Systems at 305.5 K2 14 30
Composition (molar): 92.00 %CO^ 8.00 %
p(psi) (cm^) (cm^) (cm)
974. 45.90 0.00 223.51
992. 46.50 0.00 209.01
1009. 47.50 0.00 193.81
1026. 49.00 0.00 178.71
1041. 50.80 0.00 163.61
1055. 53.60 0.00 148.21
1065. 55.70 0.00 136.81
1072. 58.30 0.00 125.11
1078. 60.40 0.00 117.01
1081. 61.20 3.10 105.41
1081. 59.40 11.60 89.31
1082. 57.80 19.60 74.31
1082. 56.40 27.90 59.01
1081 54.60 35.15 44.56
1083. 53.40 42.60 30.11
1082. 52.00 49.90 15.71
1081. 51.10 55.45 4.86
1081. 50.40 57.10 1.61
1080. 50.20 56.50 0.91
1081. 50.10 56.24 0.27
1090. 49.90 55.81 0.00
1116. 49.20 55.31 0.00
1138. 48.40 55.21 0.00
1168. 47.50 55.21 0.00
1203. 46.20 55.71 0.00
1242. 42.30 58.71 0.00
1255. 39.60 60.81 0.00
1266. 0.00 100.31 0.00
1309. 0.00 99.91 0.00

TABLE 1
(ConL)
Volumeteric Data for CO /nC H Systems at 305.5 K2 14 30
Composition (molar): 90.00 % CO 10.00 % nC H2 14 30
P(psi) V (cm^)Ll
V (cm^)L2
V (cm^]V
964. 74.40 0.00 278.51
980. 75.70 0.00 264.91
993. 77.40 0.00 248.71
1008. 79.10 0.00 233.01
1030. 82.20 0.00 207.71
1048. 82.80 0.00 195.01
1051. 84.80 0.00 178.61
1060. 87.40 0.00 165.41
1070. 91.10 0.00 147.81
1076. 94.70 0.00 132.51
1083. 97.20 0.00 118.11
1084. 96.60 7.80 100.51
1084. %.20 17.70 79.41
1084. 94.20 28.30 58.71
1085. 92.10 37.90 39.31
1085. 90.60 46.95 20.96
1086. 89.00 54.98 5.23
1086. 87.60 56.20 2.71
1086. 87.60 56.65 0.76
1120. 88.51 54.90 0.00
1143. 89.05 53.36 0.00
1174. 90.93 50.58 0.00
1212. 93.61 46.90 0.00
1254. 103.66 35.85 0.00
1262. 119.45 19.26 0.00
1275. 138.51 0.00 0.00
1313. 138.31 0.00 0.00
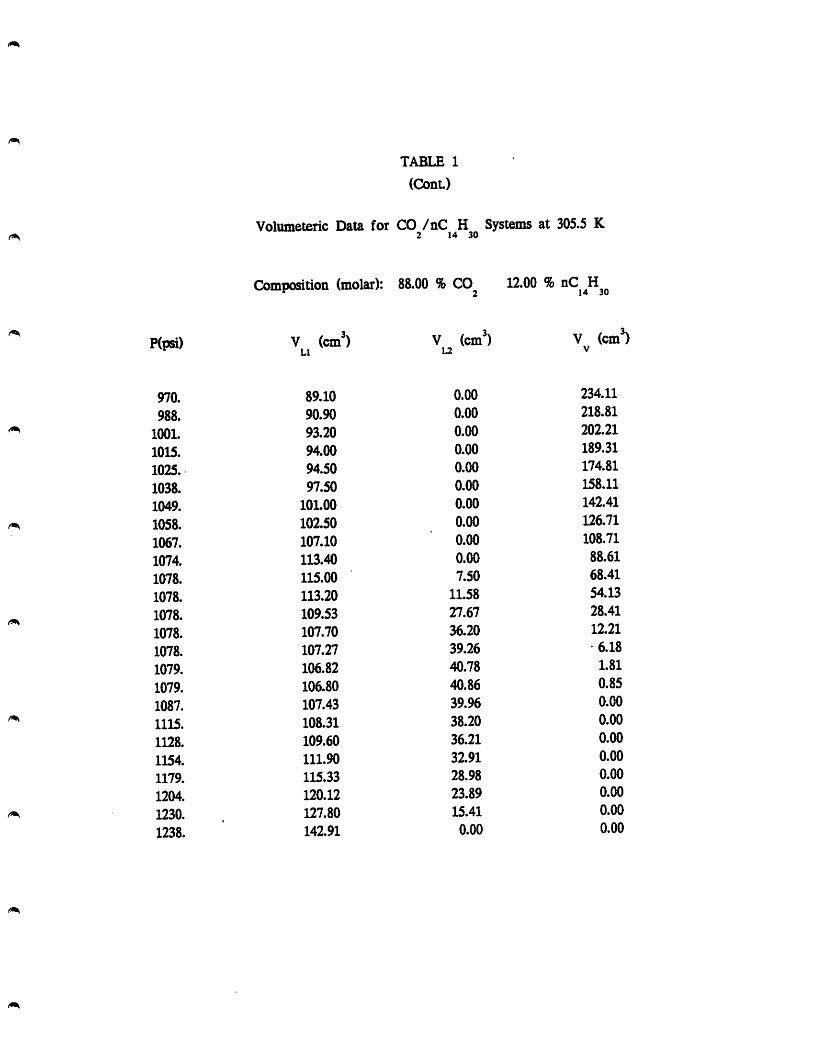
TABLE 1
(ConL)
Volumeteric Data for CO /nC H Systems at 305.5 K2 14 30
Composition (molar): 88.00 %CO^ 12.00 %
Wpsi) V (cm') V (cm') (cm')Ll
970. 89.10 0.00 234.11
988. 90.90 0.00 218.81
1001. 93.20 0.00 202.21
1015. 94.00 0.00 189.31
1025. 94.50 0.00 174.81
1038. 97.50 0.00 158.11
1049. 101.00 0.00 142.41
1058. 102.50 0.00 126.71
1067. 107.10 0.00 108.71
1074. 113.40 0.00 88.61
1078. 115.00 7.50 68.41
1078. 113.20 11.58 54.13
1078. 109.53 27.67 28.41
1078. 107.70 36.20 12.21
1078. 107.27 39.26 •6.18
1079. 106.82 40.78 1.81
1079. 106.80 40.86 0.85
1087. 107.43 39.96 0.00
1115. 108.31 38.20 0.00
1128. 109.60 36.21 0.00
1154. 111.90 32.91 0.00
1179. 115.33 28.98 0.00
1204. 120.12 23.89 0.00
1230. 127.80 15.41 0.00
1238. 142.91 0.00 0.00

TABLE 1
(Cont)
Volumeteric Data for CO /nC H Systems at 305.5 K2 14 30
Composition (molar): 86.00 % CO 14.00 % nC H2 14 30
Wpsi) V (cm') V (cm') V (cm')LI L2 V
900. 88.10 0.00 237.71
914. 89.20 0.00 223.41
935. 90.70 0.00 205.81
955. 92.40 0.00 188.51
973. 92.90 0.00 170.81
993. 93.70 0.00 153.51
1012. 97.80 0.00 131.91
1029. 100.50 0.00 115.11
1043. 105.10 0.00 96.21
1051 109.10 0.00 82.11
1061. 113.30 0.00 66.71
1072. 117.82 0.00 48.79
1076. 119.36 5.47 30.68
1076. 117.54 15.76 11.51
1075. 117.43 16.86 9.12
1075. 117.09 17.94 7.48
1075. 116.80 18.75 5.56
1075. 116.31 19.75 3.45
1076. 116.33 20.77 1.41
1076. 116.24 20.00 0.77
1095. 116.77 19.64 0.00
1124. 117.87 17.94 0.00
1140. 120.40 14.61 0.00
1159. 124.43 10.08 0.00
1174. 126.90 6.91 0.00
1180. 133.51 0.00 0.00
1212. 133.31 0.00 0.00

TABLE 1
(Cont)
Volumeteric Data for CO /nC H Systems at 305.5 K2 14 30
Composition (molar): 84.00 %CO^ 16.00 %
Kpsi) V^^(cm^ V^(cm') (cm')
942. 105.50 0.00 187.31
961. 106.20 0.00 171.31
977. 108.00 0.00 153.21
993. 110.90 0.00 137.41
1009. 111.80 0.00 121.11
1026. 115.60 0.00 101.61
1041. 121.20 0.00 81.51
1053. 125.90 0.00 63.71
1066. 131.14 0.00 43.87
1074. 136.90 0.00 25.61
1080. 138.72 5.30 4.39
1080. 138.95 5.78 0.48
1080. 138.78 6.02 0.01
1104. 140.74 3.37 0.00
1122. 140.85 3.06 0.00
1140. 141.12 2.59 0.00
1148. 143.51 0.00 0.00

/*N
TABLE 1
(ConL)
^ Volumeteric Data for CO /nC H Systems at 305.5 K^ 2 14 30
Composition (molar): 82.00 % CO 18.00 % nC H2 14 30
Kpsi) V (cm') V (cm') V (cm')LI L2 V
892. 116.60 0.00 240.61
909. 117.50 0.00 225.31
926. 119.30 0.00 209.01
944. 120.70 0.00 192.71
960. 123.50 0.00 176.51
978. 125.70 0.00 158.41
995. 127.30 0.00 139.41
1012. 128.60 0.00 123.01
1030. 132.50 ✓ 0.00 103.41
1043. 136.30 0.00 86.51
1058. 141.80 0.00 66.11
1065. 145.48 0.00 49.73
1070. 150.58 0.00 33.93
1075. 155.02 0.00 18.89
1080. 159.98 0.00 3.53
1081. 160.36 0.00 0.25
1133. 159.81 0.00 0.00
1207. 159.01 0.00 0.00
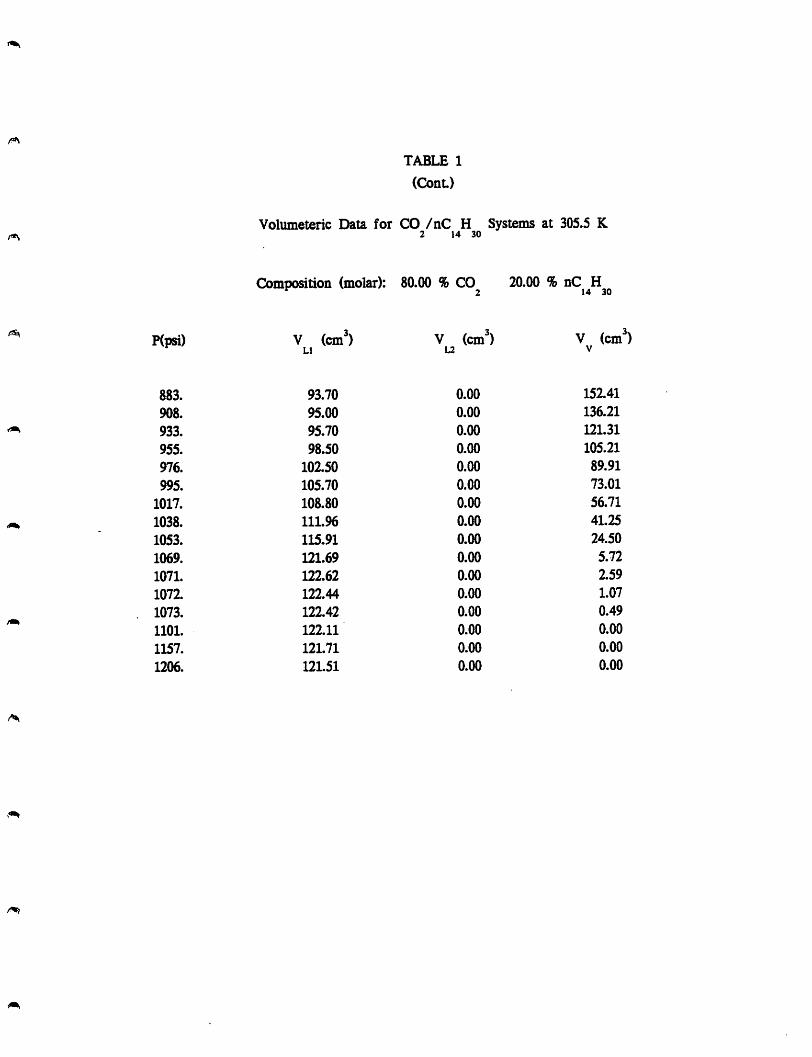
TABLE 1
(ConL)
Volumeteric Data for CO /nC H Systems at 305.5 K2 14 30
Composition (molar): 80.00 % CO 20.00 % nC H^ 2 14 30
^ P(psi) V (cm^) V (cm^) V (cm^)Ll L2 V
/Wf
883. 93.70 0.00 152.41
908. 95.00 0.00 136.21
933. 95.70 0.00 121.31
955. 98.50 0.00 105.21
976. 102.50 0.00 89.91
995. 105.70 0.00 73.01
1017. 108.80 0.00 56.71
1038. 111.96 0.00 41.25
1053. 115.91 0.00 24.50
1069. 121.69 0.00 5.72
1071. 122.62 0.00 2.59
1072. 122.44 0.00 1.07
1073. 122.42 0.00 0.49
1101. 122.11 0.00 0.00
1157. 121.71 0.00 0.00
1206. 121.51 0.00 0.00

1
e3uM
3000-
2O00-
2600-
2400
2200
2000
laOO
1600
UOO
UOO
10000 0^
ImQmndO XU-6W uauiBnuu^ kv-VAFOi riM»c
I I I I"
OU 0.6
Phoso Volume Fraction
I I i i-i"!-!
0.8
Figure 6 Pressiire-Pbase Volume Fraction Diagram, 86.0 i COg andllf.O i> nCj^i^Hp a* 3^3-3 K

Table 2 presents the data for this system at 343.3 K.
4.2 PVT Data for C02/nCi4H3o/H20
Figure 7 illustrates the volumetric data for the same system shown in
Figure 5 but with water added. The same type of phase behavior was observed but
with the addition of a third clear liquid, the aqueous phase. Table 3 presents the
data for this system at 305.5 K. Figure 8 shows the volumetric data for the same
system shown in Figure 6 but with water added. Again, the same type of phase
behavior was observed but with the addition of an aqueous liquid phase. Table 4
presents the data for the system at 343.3 K.
4.3 PVT Data for CO2/CH4/nCi4H30
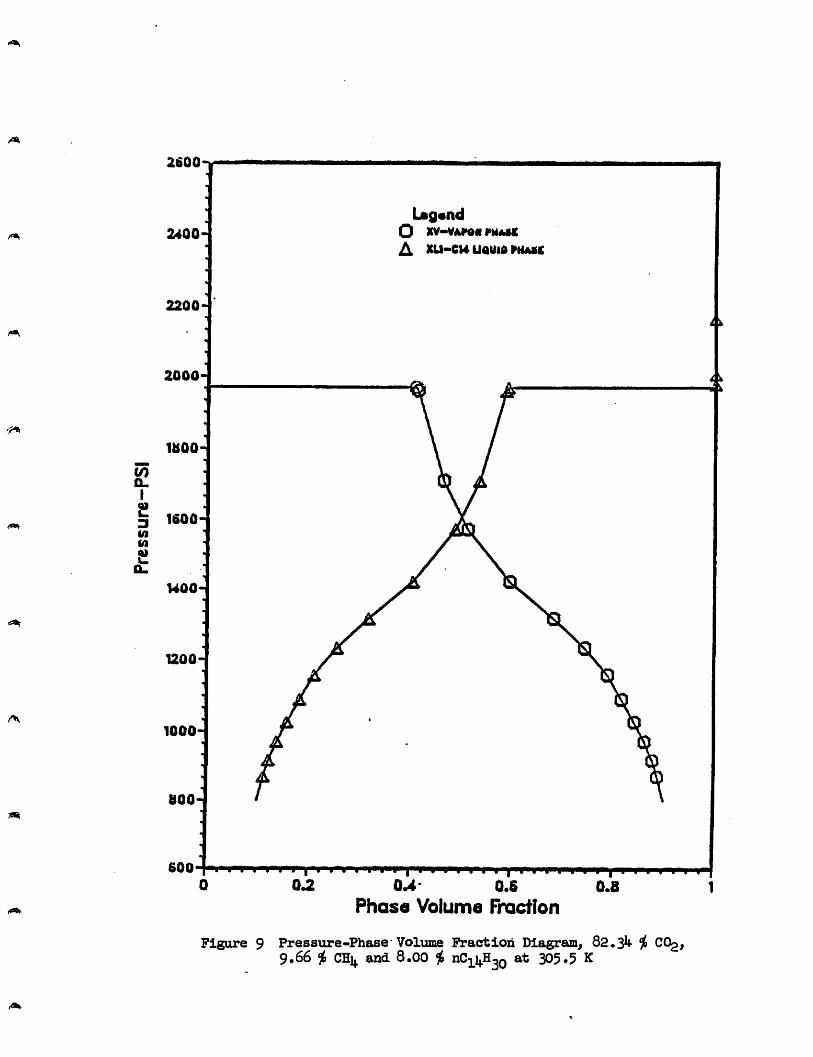
Figure 9 exhibits the volumetric data for 82.34%C02> 9.66% CH4 and
8.00% nCi4H3o at 305.5 K. Two phases were observed over the pressure range
ending at a bubble point. Table 5 presents the data for the system at 305.5 K.
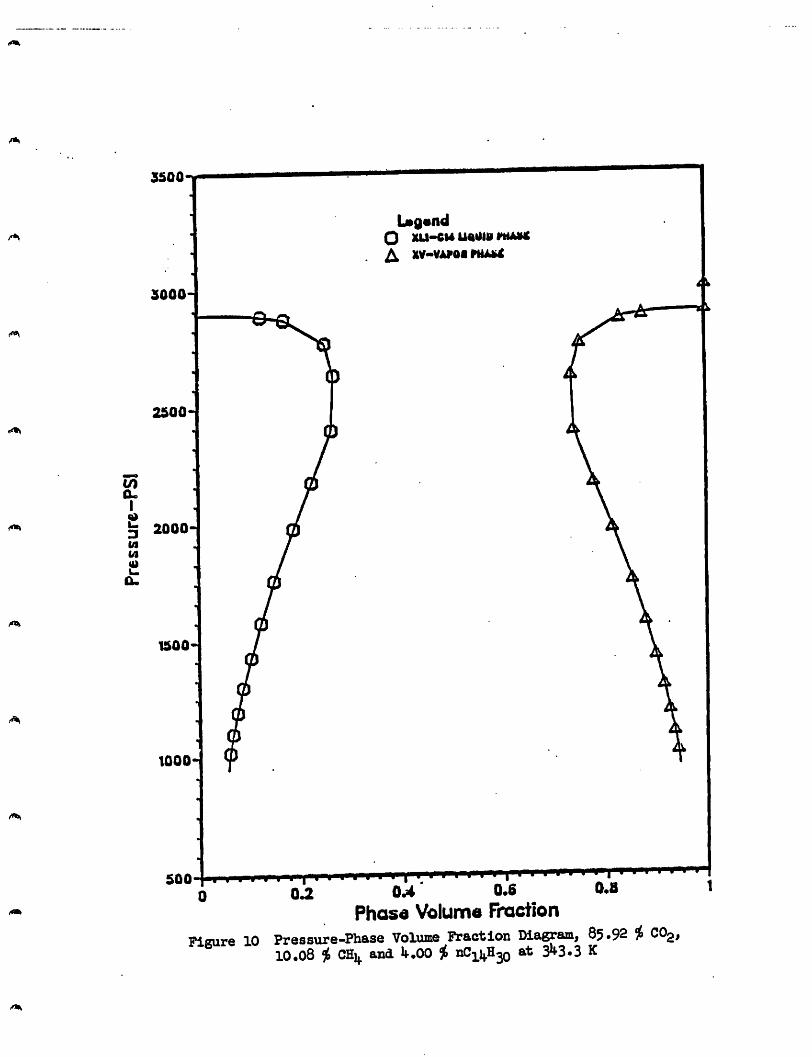
Figure 10 exhibits the volumetric data for 85.92% C02> 10.08% CH4 and 4.00%
nCi4H3o at 343.3 K. At this temperature and composition, two phase behavior was
observed over the pressure range ending at a dew point. Table 6 presents the data
for this system at 343.3 K.
4.4 PVT Data for C02/CH4/nCi4H3o/H20
Figure 11 illustrates the volumetric data for the same system shown in
Figure 9 but with the addition of water. The same type of phase behavior was
observed except for the addition of a second liquid phase. Table 7 presents the data

TABLE 2
Volumeteric Data for CO /nC H /H O Systems at 305.5 K2 14 30 2
Composition (molar): 86.50 % CO 0.88 % nC H 12.62 % H 02 14 30 2
WpsO V (cm^ V (cm') V (cm') V (cm')^ L3 LI L2 V
975. 4.30 9.80 0.00 344.01
992. 4.40 9.80 0.00 328.31
1006. 4.40 9.90 0.00 315.21
1020. 4.50 9.90 0.00 301.91
1034. 4.70 10.10 0.00 288.61
1045. 4.70 10.30 0.00 275.61
1059. 4.60 10.50 0.00 261.11
1071. 4.50 10.70 0.00 246.21
1081 4.40 12.10 0.00 231.21
1087. 4.40 11.30 4.80 214.31
1087. 4.40 9.20 17.60 190.21
1087. 5.20 8.00 22.50 171.51
1088. 5.30 4.70 39.20 147.21
1088. 5.50 3.70 42.80 140.31
1088. 5.50 2.80 47.30 132.41
1088. 5.60 1.90 49.00 130.01
1089. 5.60 1.00 51.00 127.31
1099. 4.80 0.00 61.10 108.71
1105. 4.10 0.00 70.10 88.91
1111. 3.90 0.00 79.90 68.31
1116. 4.00 0.00 89.20 48.41
1118. 4.10 0.00 101.23 24.68
1119. 4.10 0.00 111.59 5.72
1121. 4.20 0.00 111.71 0.10
1129. 4.30 0.00 111.61 0.00
1148. 4.40 0.00 111.21 0.00

TABLE 2
(Cont)
Volumeteric Data for CO /nC H /H O Systems at 305.5 K2 14 30 2
Composition (molar): 76.02 % CO 1.55 % nC H 22.43 % H O2 14 30 2
PCpsi) V (cm^) V (cm^) V (cm^) V (cm^)L3 LI Li2 V
951. 8.30 14.20 0.00 330.11
968. 7.30 14.90 0.00 315.31
989. 8.00 14.90 0.00 297.41
1008. 7.80 15.70 0.00 280.61
1025. 8.00 15.80 0.00 264.21
1038. 7.90 16.20 0.00 250.81
1051. 7.50 17.20 0.00 237.51
1061. 7.20 18.20 0.00 226.61
1072. 7.50 19.20 0.00 214.61
1081. 7.00 20.10 0.00 200.61
1083. 7.80 17.60 9.50 180.01
1086. 7.60 16.30 22.90 154.51
1086. 7.20 14.30 34.40 132.71
1088. 8.50 11.60 47.10 106.11
1091. 7.40 9.00 63.10 75.71
1092. 8.10 6.90 80.17 48.54
1093. 7.20 4.70 91.25 26.16
1093. 7.10 2.10 96.58 19.73
1102. 6.50 0.00 105.82 4.39
1113. 6.70 0.00 106.13 0.58
1115. 6.50 0.00 105.66 0.15
1145. 8.20 0.00 101.91 0.00
11%. 7.00 0.00 101.61 0.00
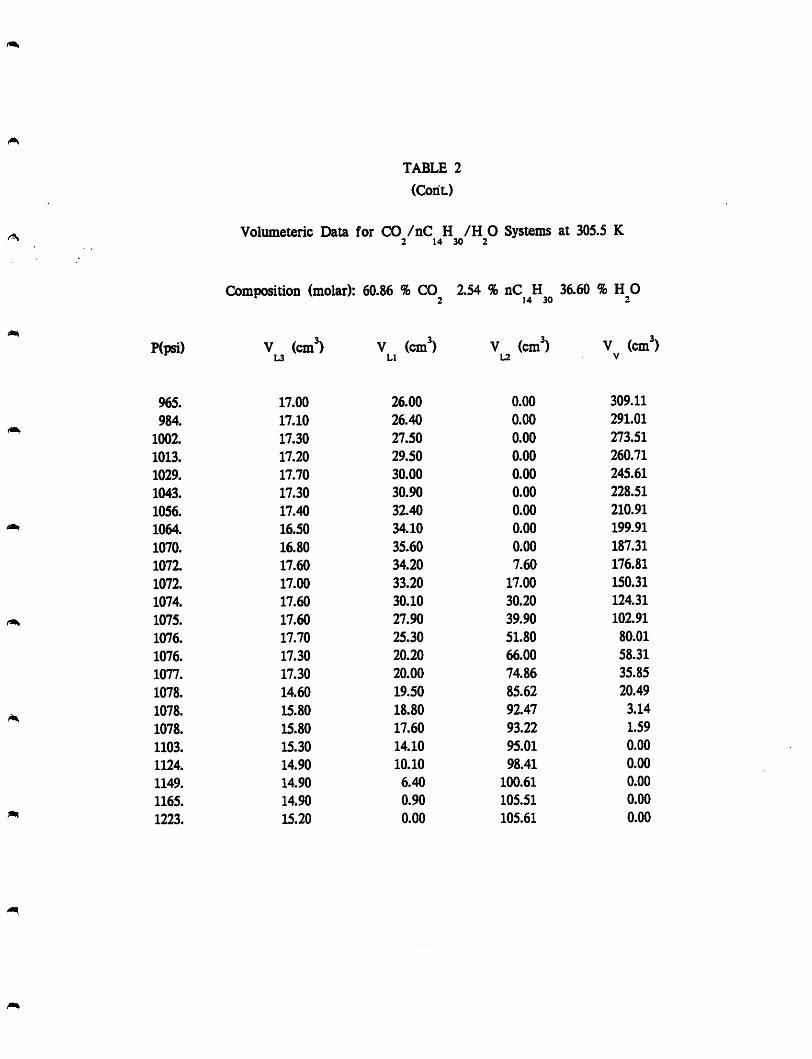
TABLE 2
(CoriL)
Volumeteric Data for CO /nC H /H O Systems at 305.5 K2 14 30 2
Composition (molar): 60.86 % CO 2.54 % nC H 36.60 % H 02 14 30 2
P(psi) V (cm^) V (cm^) V (cm^) V (cm^)L3 LI L2 V
965. 17.00 26.00 0.00 309.11
984. 17.10 26.40 0.00 291.01
1002. 17.30 27.50 0.00 273.51
1013. 17.20 29.50 0.00 260.71
1029. 17.70 30.00 0.00 245.61
1043. 17.30 30.90 0.00 228.51
1056. 17.40 32.40 0.00 210.91
1064. 16.50 34.10 0.00 199.91
1070. 16.80 35.60 0.00 187.31
1072. 17.60 34.20 7.60 176.81
1072. 17.00 33.20 17.00 150.31
1074. 17.60 30.10 30.20 124.31
1075. 17.60 27.90 39.90 102.91
1076. 17.70 25.30 51.80 80.01
1076. 17.30 20.20 66.00 58.31
1077. 17.30 20.00 74.86 35.85
1078. 14.60 19.50 85.62 20.49
1078. 15.80 18.80 92.47 3.14
1078. 15.80 17.60 93.22 1.59
1103. 15.30 14.10 95.01 0.00
1124. 14.90 10.10 98.41 0.00
1149. 14.90 6.40 100.61 0.00
1165. 14.90 0.90 105.51 0.00
1223. 15.20 0.00 105.61 0.00
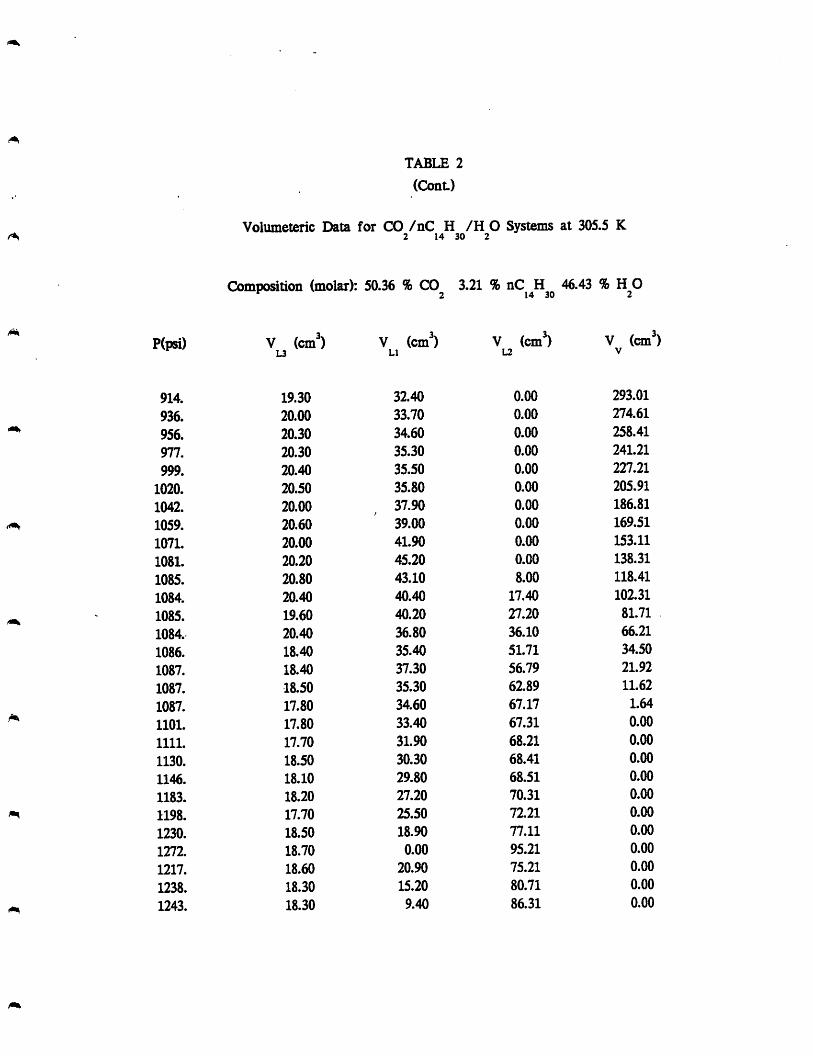
TABLE 2
(ConL)
Volumeteric Data for CO /nC H /H O Systems at 305.5 K2 14 30 2
Composition (molar): 50.36 % CO 3.21 % nC H 46.43 % H O2 14 30 2
P(psi) V (cm^) V (cm^) V (cm^) V (cm^)L3 LI *
914. 19.30 32.40 0.00 293.01
936. 20.00 33.70 0.00 274.61
956. 20.30 34.60 0.00 258.41
977. 20.30 35.30 0.00 241.21
999. 20.40 35.50 0.00 227.21
1020. 20.50 35.80 0.00 205.91
1042. 20.00 37.90 0.00 186.81
1059. 20.60 39.00 0.00 169.51
1071. 20.00 41.90 0.00 153.11
1081. 20.20 45.20 0.00 138.31
1085. 20.80 43.10 8.00 118.41
1084. 20.40 40.40 17.40 102.31
1085. 19.60 40.20 27.20 81.71
1084. 20.40 36.80 36.10 66.21
1086. 18.40 35.40 51.71 34.50
1087. 18.40 37.30 56.79 21.92
1087. 18.50 35.30 62.89 11.62
1087. 17.80 34.60 67.17 1.64
1101. 17.80 33.40 67.31 0.00
1111. 17.70 31.90 68.21 0.00
1130. 18.50 30.30 68.41 0.00
1146. 18.10 29.80 68.51 0.00
1183. 18.20 27.20 70.31 0.00
1198. 17.70 25.50 72.21 0.00
1230. 18.50 18.90 77.11 0.00
1272. 18.70 0.00 95.21 0.00
1217. 18.60 20.90 75.21 0.00
1238. 18.30 15.20 80.71 0.00
1243. 18.30 9.40 86.31 0.00

TABLE 2
(Cont)
Volumeteric Data for CO /nC H /H O Systems at 305.5 K2 14 30 2
Compoatioii (molar): 42.69 %CO 3.71 %nC 53.60 %H^O
P(psi) V (cm^)u
988. 29.40
1003. 28.60
1018. 28.50
1033. 28.10
1047. 27.70
1055. 27.60
1064. 28.00
1077. 28.10
1087. 28.80
1087. 28.50
1088. 28.60
1088. 28.30
1089. 28.80
1088. 28.50
1088. 28.00
1089. 28.10
1089. 28.00
1088. 28.00
1104. 28.00
1140. 27.60
1176. 27.30
1210. 27.10
1231. 27.10
1252. 27.10
1265. 27.10
1306. 27.10
^ V <cm^ (cm') (cm') (cm)
50.90 0.00 199.21
52.00 0.00 186.01
53.90 0.00 172.01
56.10 0.00 157.01
59.40 0.00 140.91
61.10 0.00 129.51
64.70 0.00 117.31
68.80 0.00 101.11
68.50 7.30 80.21
67.50 13.00 69.31
64.90 22.80 51.71
63.00 29.50 38.01
61.20 35.41 26.90
60.30 39.66 17.75
59.90 45.42 7.39
58.90 47.35 3.76
58.70 48.20 1.61
57.92 48.24 0.95
57.83 47.38 0.00
58.19 46.22 0.00
59.74 43.77 0.00
63.58 39.03 0.00
63.84 38.57 0.00
64.84 37.37 0.00
102.11 0.00 0.00
101.71 0.00 0.00
PCpsi)
TABLE 2
(ConL)
Volumeteric I^ta for CO /nC H /H O Systems at 305.5 K2 14 30 2
Composition (molar): 36.82 % CO 4.09 % nC H 59.09 % H Or 14 30 "
V (cm)L3
V (cm') V (cm') V (cm')LI L2
990. 48.40 80.70 0.00 229.81
1003. 48.60 82.70 0.00 215.41
1014. 49.70 83.00 0.00 203.01
1025. 50.00 84.70 0.00 190.11
1036. 51.50 85.20 0.00 175.91
1046. 51.60 88.10 0.00 161.31
1055. 51.30 91.10 0.00 146.11
1064. 49.30 92.70 0.00 133.31
1071. 48.80 97.09 0.00 117.11
1088. 47.70 101.80 2.00 98.71
1088. 49.70 98.00 13.30 77.01
1088. 50.00 95.60 24.60 54.81
1090. 49.80 94.50 33.68 36.33
1091. 50.00 93.30 42.47 17.94
1092. 49.80 91.70 60.10 1.71
1092. 49.80 91.58 50.30 1.23
1092. 49.70 91.35 50.50 0.56
1099. 49.60 92.19 49.92 0.00
1112. 49.70 92.77 48.04 0.00
1141. 49.60 95.45 44.46 0.00
1174. 49.40 97.57 41.44 0.00
1215. 48.90 104.30 34.31 0.00
1248. 48.40 126.88 11.23 0.00
1250. 48.90 132.34 5.17 0.00
1296. 49.00 137.21 0.00 0.00
fm
PCpsi)
TABLE 2
(ConL)
Volumeteric Data for CO /nC H /H O Systems at 305.5 K2 14 30 2
Composition (molar): 32.15 % CO 4.39 % nC H 63.46 % H 02 14 30 2
V (cm)L3
V (cm)Ll
V (cm)L2
V (cm)V
990. 57.40 92.60 0.00 208.01
1005. 58.30 93.80 0.00 192.41
1017. 60.20 94.50 0.00 178.21
1030. 60.50 96.50 0.00 162.81
1043. 61.00 98.60 0.00 147.91
1054. 60.40 101.60 0.00 133.21
1064. 59.30 103.40 0.00 119.91
1074. 57.90 107.80 0.00 102.61
1081. 57.00 113.00 0.00 86.51
1086. 59.10 115.80 0.00 70.71
1089. 60.10 114.30 9.20 51.61
1089. 59.70 112.60 18.56 33.25
1089. 59.50 111.12 27.48 15.31
1089. 59.30 110.51 32.48 5.72
1090. 58.90 110.25 34.10 1.36
1090. 59.20 110.02 33.94 0.85
1090. 59.20 110.00 34.16 0.25
1090. 59.20 110.00 34.27 0.04
1094. 59.20 109.90 34.21 0.00
1104. 59.10 110.93 32.58 0.00
1117. 59.10 111.11 32.10 0.00
1132. 58.90 113.64 29.07 0.00
1149. 58.80 115.47 26.44 0.00
1171. 58.30 118.41 23.20 0.00
1195. 58.10 123.00 18.41 0.00
1225. 57.70 132.10 9.21 0.00
1231. 57.60 141.21 0.00 0.00
1249. 57.30 141.11 0.00 0.00
1309. 56.90 140.81 0.00 0.00

TABLE 2
(Cont)
Volumeteric Data for CO /nC H /HO Systems at 305.5 K2 14 30 2
Composition (molar): 28.44 % CO 4.63 % nC H 66.93 % H 02 14 30 2
P(psi) V (cm^) V (cm^) V (cm^) V (cm^)L3 Ll L2 V
945. 57.70 98.40 0.00 186.91
963. 57.70 98.50 0.00 172.21
980. 59.40 99.00 0.00 156.01
997. 59.40 100.60 0.00 140.81
1013. 57.60 102.10 0.00 127.61
1030. 57.00 105.50 0.00 108.91
1045. 56.80 109.40 0.00 91.01
1059. 57.70 113.20 0.00 72.81
1070. 57.20 119.35 0.00 54.26
1078. 57.40 124.42 0.00 37.09
1086. 59.20 128.06 1.42 18.13
1085. 58.80 127.50 5.64 10.27
1085. 57.80 126.90 8.31 4.70
1085. 58.70 126.59 9.55 1.97
1084. 58.80 126.60 9.26 1.15
1085. 58.80 126.90 8.73 0.58
1102. 59.40 126.47 8.64 0.00
1125. 59.20 127.86 5.95 0.00
1152. 59.00 131.61 2.90 0.00
1158. 59.00 134.35 0.06 0.00
1178. 58.60 134.31 0.00 0.00

m,
TABLE 2
(Cont)
Volumetedc Data for CO /nC H /H O Systems at 305.5 K2 14 30 2
Composition (molar): 25.40 % CO 4.83 % nC H 69.77 % H O
iKpsi) (cm') (cm') (cm') (cm')
949. 73.20 104.00 0.00 17161
968. 74.20 105.90 0.00 154.71
987. 73.70 107.90 0.00 138.51
1001 74.30 109.70 0.00 123.41
1018. 7140 11190 0.00 108.71
1033. 71.30 116.70 0.00 91.21
1047. 71.90 120.40 0.00 74.41
1059. 7110 124.50 0.00 57.11
1070. 71.10 129.68 0.00 40.33
1080. 71.70 135.22 0.00 20.49
1085. 71.70 139.82 0.00 6.49
1087. 73.40 138.66 1.02 0.13
1087. 73.60 138.38 1.08 0.05
1087. 73.60 138.20 1.09 0.02
1091 73.70 138.20 0.91 0.00
1095. 7180 139.14 0.67 0.00
1097. 7180 139.70 0.01 0.00
1115. 71.90 140.41 0.00 0.00
1141. 71.90 140.21 0.00 0.00

KpsO
958.
972.
986.
1002.
1016.
1029.
1042.
1054.
1063.
1072.
1075.
1077.
1145.
1182.
1222.
TABLE 2
(Cont)
Volumeteric Data for CO /nC H /H O Systems at 305.5 K2 14 30 2
Composition (molar): 22.78 % CO 4.99 % nC H 72.23 % H O2 14 30 2
V (cm') V (cm') V (cm') V (cm')L3 LI U V
83.60
85.10
85.10
84.50
85.00
84.80
84.30
82.20
82.00
80.50
81.40
81.70
81.20
81.40
81.30
125.80
127.10
n8.00
131.70
135.10
139.10
143.10
148.03
152.70
158.64
156.70
158.58
158.61
158.21
158.11
0.00
0.00
0.00
0.00
0.00
0.00
0.00
0.00
0.00
0.00
0.00
0.00
0.00
0.00
0.00
149.51
135.51
12131
106.31
89.91
72.91
57.61
40.98
25.61
10.27
5.01
0.13
0.00
0.00
0.00
/•t
TABLE 2
(ConL)
Volumeteric Data for CO /nC H /H O Systems at 305.5 K2 14 30 2
Composition (molar): 20.57 % CO 5.15 % nC H 74.28 % H O2 14 30 2
WpsO V (cm') V (cm') V (cm') V (cm')U LI L2 V
832. 73.10 92.30 0.00 175.01
853. 74.00 93.70 0.00 156.81
878. 74.40 95.80 0.00 139.41
903. 74.00 96.90 0.00 122.91
930. 73.00 98.50 0.00 106.81
956. 7110 100.50 0.00 88.91
981. 71.90 103.90 0.00 71.91
1006. 71.60 108.20 0.00 53.21
1029. 71.20 111.12 0.00 37.09
1054. 70.40 116.91 0.00 16.70
1068. 70.00 121.36 0.00 0.35
1134. 73.40 117.81 0.00 0.00
1171. 73.70 116.71 0.00 0.00
1261. 73.90 116.21 0.00 0.00
UlO.
I
£3lAM
0
1350
1300-
1250
1200
1150
1100
1050-
1000-
950
L«9«ndO UDUIO l»M4»C^ XL^»eol UttUID yHA»C4- >HA«CX icLi«mo uauiD WAtC
-r-nr
0.4 0.6
Phase Voluma Fraction
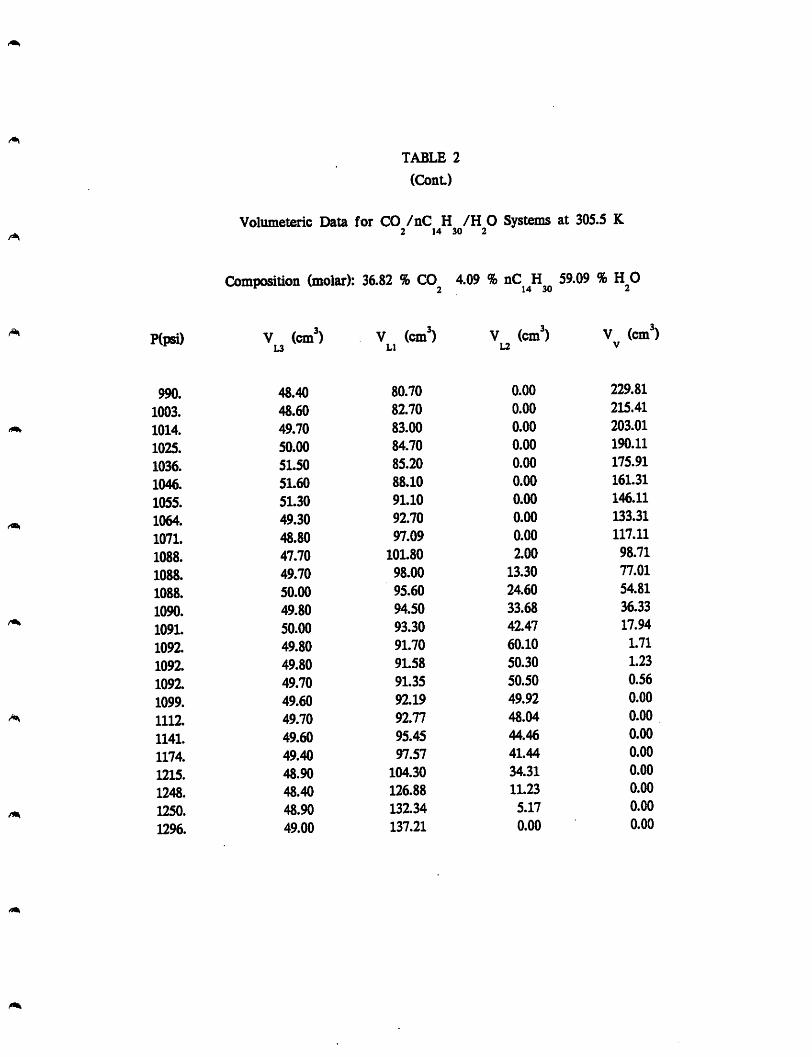
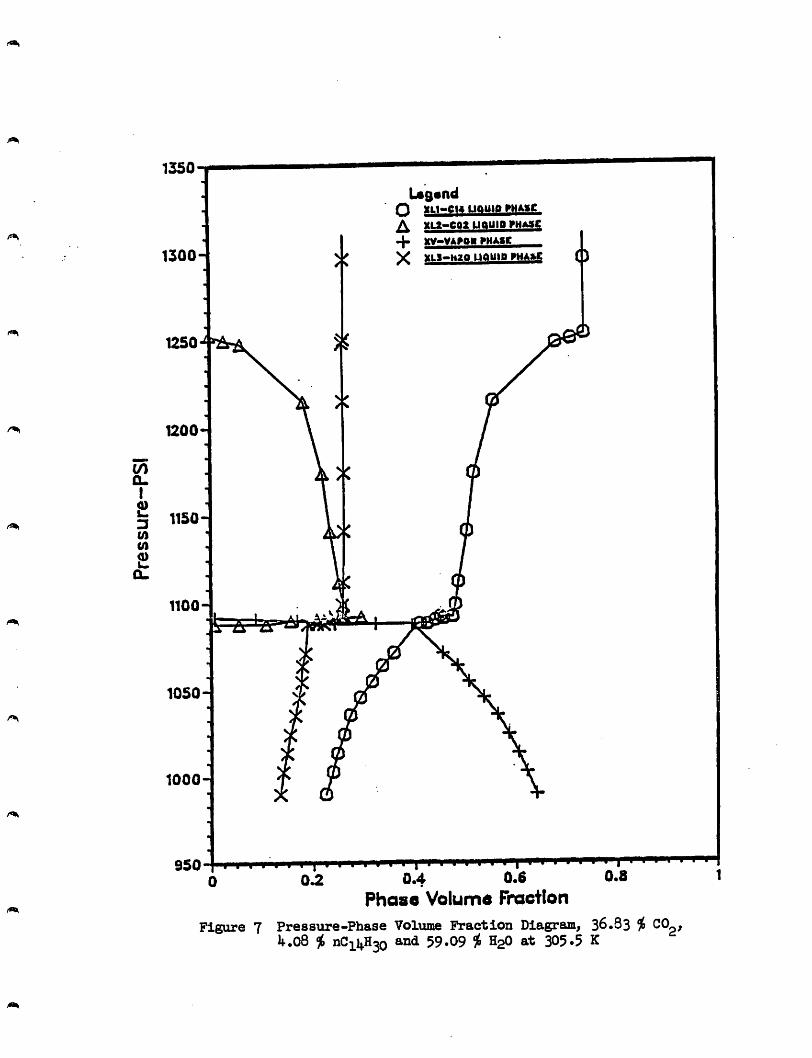
Figure 7 Pressure-Phase Volume Fraction Diagram, 36.33 ^1^.08 ^ nCii^H3o and 59-09 ^ H2O at 305-5 K
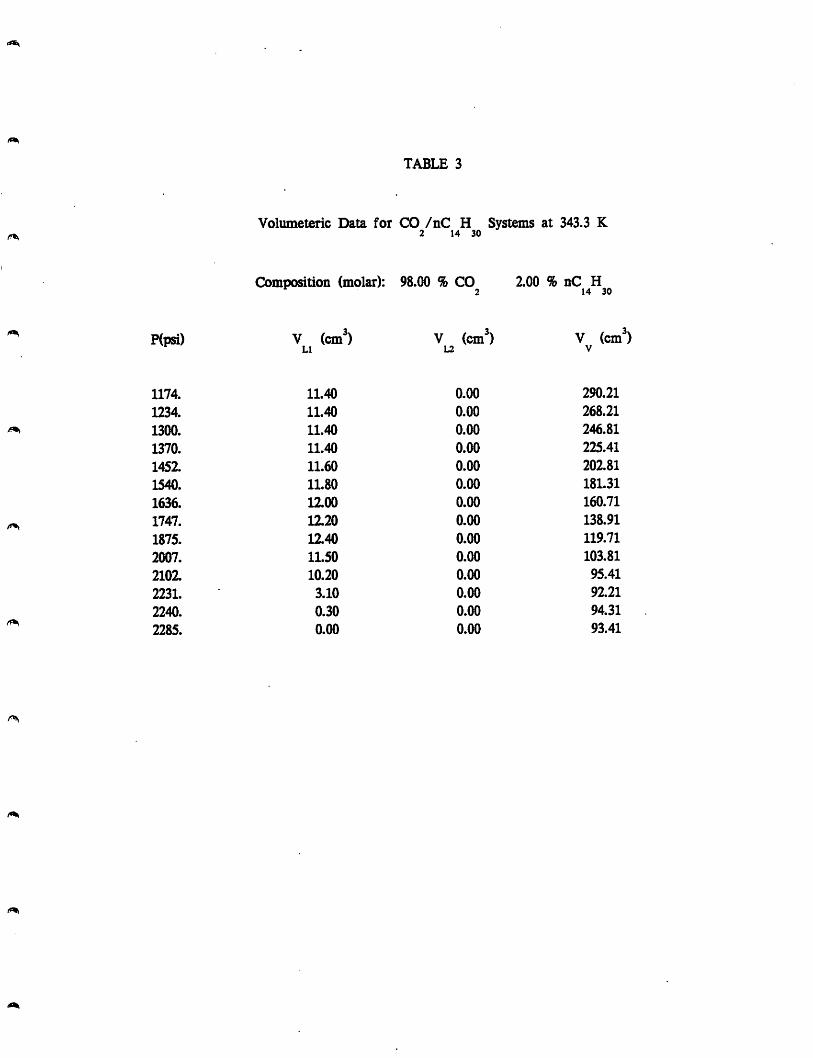
TABLE 3
Volumeteric Data for CO /nC H Systems at 343.3 K2 14 30
Composition (molar): 98.00 % CO 2.00 % nC H2 14 30
Hpsi) V (cm^) V (cm^) V (cm^)Ll L2 V
1174. 11.40 0.00 290.21
n34. 1L40 0.00 268.21^ 1300. 11.40 0.00 246.81
1370. 11.40 0.00 225.41
1452. 11.60 0.00 202.81
1540. 11.80 0.00 18L31
1636. 12.00 0.00 160.71
^ 1747. 12.20 0.00 138.911875. 1Z40 0.00 119.71
2007. 11.50 0.00 103.81
2102. 10.20 0.00 95.41
223L 3.10 0.00 92.21
2240. 0.30 0.00 94.31
2285. 0.00 0.00 93.41

TABLE 3
(ConL)
Volumeteric Data for CO /nC H Systems at 343.3 K2 14 30
Composition (molar): 94.00 % CO 6.00 % nC H2 14 30
P(psi) V (cm^) V (cm^) V (cm^)Ll L2 V
1048. 2140 0.00 264.11
1099. 22.70 0.00 244.91
1153. 23.00 0.00 226.31
1215. 23.40 0.00 207.61
1283. 23.80 0.00 190.11
1356. 24.10 0.00 171.21
1440. 24.60 0.00 152.51
1533. 25.40 0.00 133.31
1640. 26.30 0.00 116.11
1766. 27.10 0.00 96.41
1922. 28.40 0.00 77.11
2152. 30.00 0.00 57.31
2273. 31.00 0.00 50.01
2286. 30.80 0.00 49.31
2319. 31.40 0.00 47.91
2345. 32.85 0.00 45.46
2389. 34.00 0.00 42.81
2401. 75.91 0.00 0.00
2485. 75.41 0.00 0.00
2543. 75.01 0.00 0.00
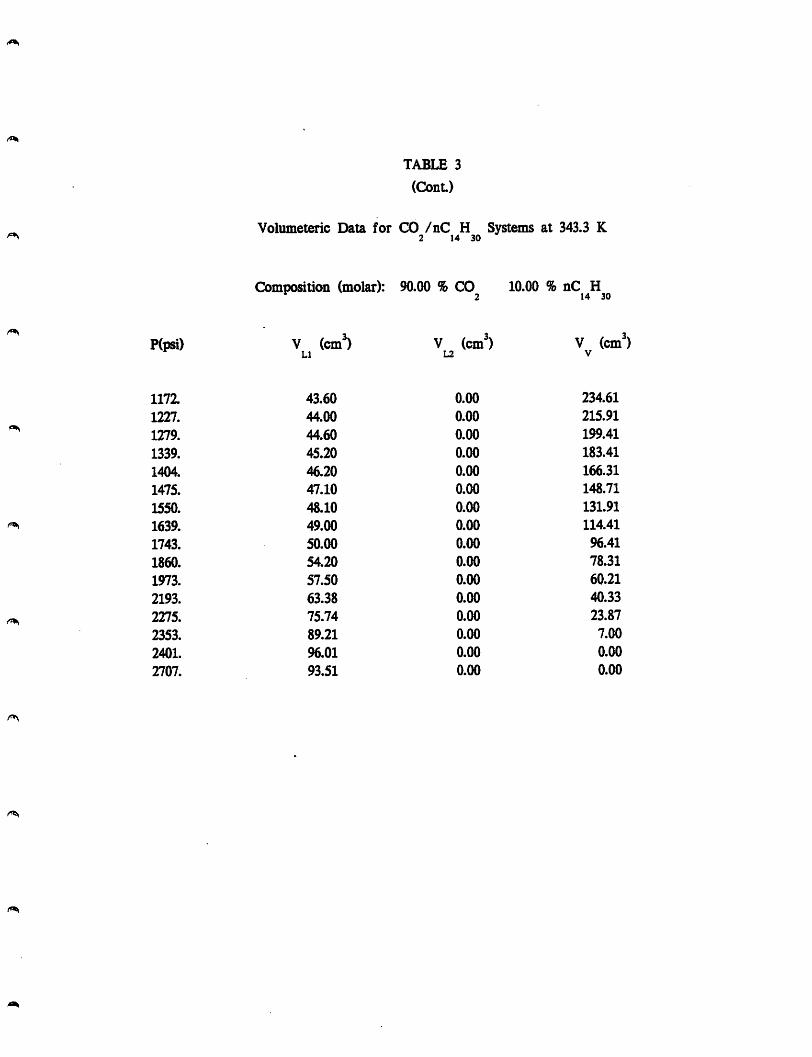
TABLE 3
(Cont)
Volumeteric Data for CO /nC H2 14 30
Composition (molar): 90.00 % CO2
P(psi) V (cm^)Ll
V (cm'L2
1171 43.60 0.00
1227. 44.00 0.00
1279. 44.60 0.00
1339. 45.20 0.00
1404. 46.20 0.00
1475. 47.10 0.00
1550. 48.10 0.00
1639. 49.00 0.00
1743. 50.00 0.00
1860. 54.20 0.00
1973. 57.50 0.00
2193. 63.38 0.00
2275. 75.74 0.00
2353. 89.21 0.00
2401. 96.01 0.00
2707. 93.51 0.00
14 30
V (cm')V
234.61
215.91
199.41
183.41
166.31
148.71
131.91
^ 1639. 49.00 0.00 114.41
96.41
78.31
60.21
40.33
23.87
7.00
0.00
0.00

TABLE 3
(Cont)
Volumeteric Data for CO /nC H Systems at 343.3 K2 14 30
Composition (molar): 86.00 %CO^ 14.00 %nC^^H^^
P(psi) V (cm^) V (cm^) V (cm^)Ll L2 V
1160. 65.50 0.00 247.31
1218. 65.90 0.00 226.11
1271 66.20 0.00 206.01
133L 66.70 0.00 188.11
1394. 68.20 0.00 169.11
1467. 69.80 0.00 148.71
1547. 72.50 0.00 128.91
1637. 74.10 0.00 109.11
1744. 76.80 0.00 88.21
1851 80.60 0.00 68.91
1957. 84.67 0.00 53.54
2039. 89.50 0.00 41.71
2086. 92.52 0.00 34.79
2149. 97.33 0.00 25.98
2195. 98.30 0.00 23.41
2247. 112.32 0.00 7.29
2268. 117.06 0.00 L15
2288. 117.71 0.00 0.00

TABLE 3
(Cont)
Volumeteric Data for CO /nC H Systems at 343.3 K^ . 2 14 30
Composition (molar): 82.00 % CO 18.00 % nC H2 14 30
P(psi) V (cm^) V (cm^) V (cm^)Ll L2 V
1034. 75.30 0.00 210.21
1099. 75.40 0.00 187.31
1168. 76.40 0.00 165.31
1237. 77.90 0.00 145.41
1316. 79.10 0.00 125.91
1405. 81.10 0.00 105.01
1509. 84.00 0.00 83.51
1637. 87.80 0.00 60.21
1801. 98.56 0.00 30.85
1956. 103.20 0.00 15.31
2079. 109.74 0.00 1.07
2083. 109.78 0.00 0.73
2126. 110.31 0.00 0.00
SOOO-V
2&00-
2600-
2200
2000
1600-
WOO-
1200-
1000-f
Lig«ndO MAMA xu-cu u«iiio rwAsc•4* XU-MaO UftMlB MME
Pha^io Volume Fraction
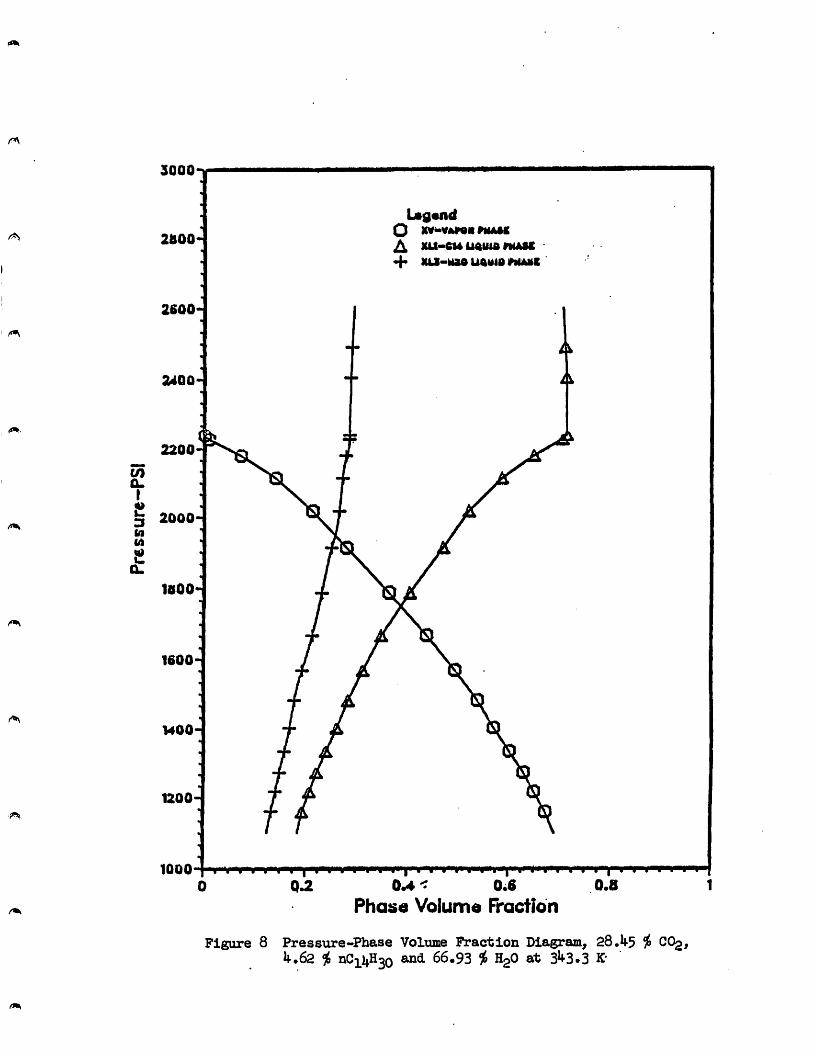
Figure 8 PressTire-Phase Volume Fraction Diagram, 2Q,h^ ^ COg,4.62 i nCii^H3o and 66.93 ^ HgO at 3^3.3 K-
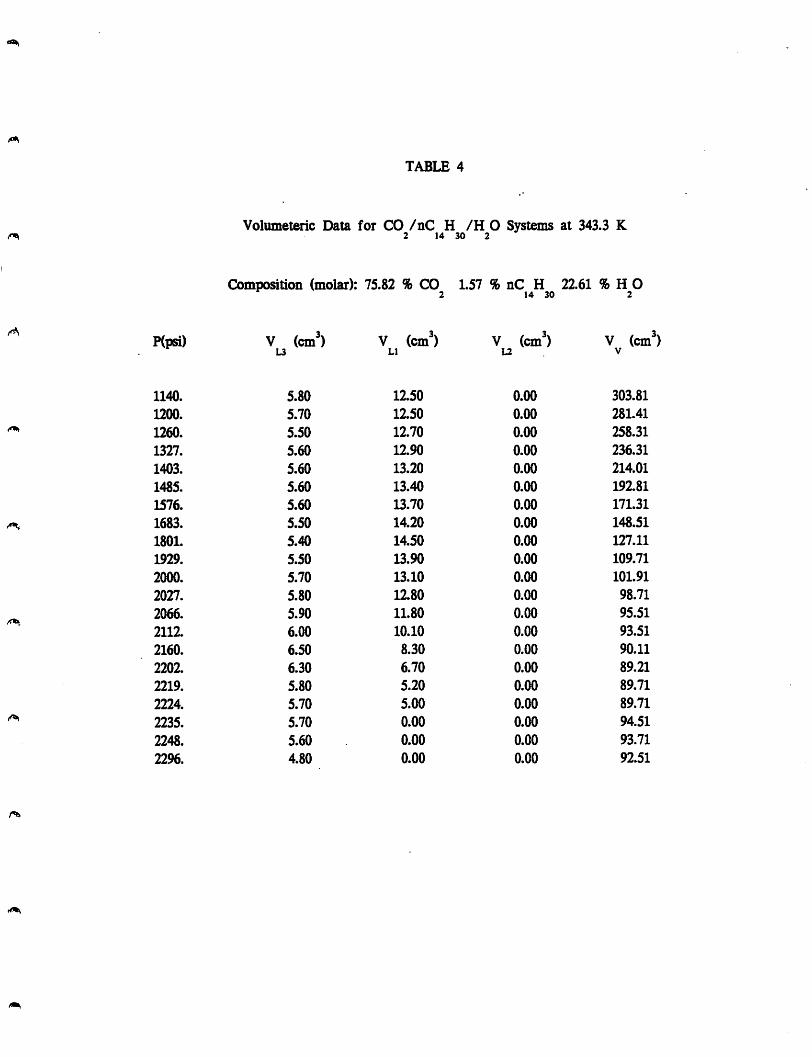
TABLE 4
Volumeteric Data for CO /nC H2 14
/H 0 Systems at 343.3 K30 2
Composition (molar):: 75.82 % CO2
1.57 % nC H 22.6114 30
% HO2
P(psi) V (cm^)L3
V (cm^)Ll
V (cm^)L2
V (cm"V
1140. 5.80 12.50 0.00 303.81
1200. 5.70 12.50 0.00 281.41
1260. 5.50 12.70 0.00 258.31
1327. 5.60 12.90 0.00 236.31
1403. 5.60 13.20 0.00 214.01
1485. 5.60 13.40 0.00 192.81
1576. 5.60 13.70 0.00 17L31
1683. 5.50 14.20 0.00 148.51
180L 5.40 14.50 0.00 127.11
1929. 5.50 13.90 0.00 109.71
2000. 5.70 13.10 0.00 101.91
2027. 5.80 12.80 0.00 98.71
2066. 5.90 11.80 0.00 95.51
2112. 6.00 10.10 0.00 93.51
2160. 6.50 8.30 0.00 90.11
2202. 6.30 6.70 0.00 89.21
2219. 5.80 5.20 0.00 89.71
2224. 5.70 5.00 0.00 89.71
2235. 5.70 0.00 0.00 94.51
2248. 5.60 0.00 0.00 93.71
2296. 4.80 0.00 0.00 92.51

TABLE 4
(Cont)
Volumeteric Data for CO /nC H /H O Systems at 343.3 K2 14 30 2
Composition (molar): 50.35 % CO2
3.21 % nC H 46.4414 30
% HO2
P(psi) V (cm^)u
V (cm^)Ll
V (cm^)L2
V (cm^)V
1099. 14.60 24.60 0.00 241.11
1159. 14.60 24.90 0.00 221.11
1221. 14.90 25.10 0.00 201.61
1290. 14.70 25.20 0.00 183.21
1366. 14.80 26.10 0.00 165.01
1451. 15.00 26.40 0.00 145.81
1550. 15.10 26.60 0.00 126.71
1663. 15.10 27.50 0.00 106.61
1796. 15.80 29.00 0.00 87.91
1955. 16.10 30.30 0.00 68.91
2116. 16.30 32.00 0.00 55.01
2232. 16.50 30.96 0.00 49.55
2331. 15.40 31.09 0.00 46.62
2372. 15.30 31.27 0.00 46.34
2412. 15.60 77.11 0.00 0.00
2464. 15.80 74.71 0.00 0.00
2688. 15.80 72.71 0.00 0.00

TABLE 4
(ConL)
Volumeteric Data for CO /nC H /H O Systems at 343.3 Kr»s 2 14 30 2
Composition (molar): 36.82 % CO 4.09 % nC H 59.09 % H O2 14 30 2
Wpsa V (cm^ V (cm^) V (cm') V (cm')L3 LI L2 V
1123. 32.40 45.80 0.00 245.511171. 33.90 46.00 0.00 226.61
1225. 34.00 46.20 0.00 207.41
1284. 33.60 46.40 0.00 189.81
1347. 33.50 46.70 0.00 172.01
1415. 33.40 47.40 0.00 154.41
1489. 33.00 49.00 0.00 137.71^ 1573. 33.40 49.60 0.00 120.21
1670. 33.30 51.00 0.00 101.41
1779. 33.20 54.10 0.00 82.71
1907. 32.50 60.00 0.00 63.91
2075. 32.60 64.25 0.00 44.462284. 32.80 81.20 0.00 16.21
2326. 33.10 91.42 0.00 4.392344. 33.00 94.70 0.00 0.912365. 33.00 95.41 0.00 0.002401. 33.40 94.61 0.00 0.002471. 33.10 94.41 0.00 0.00
7^
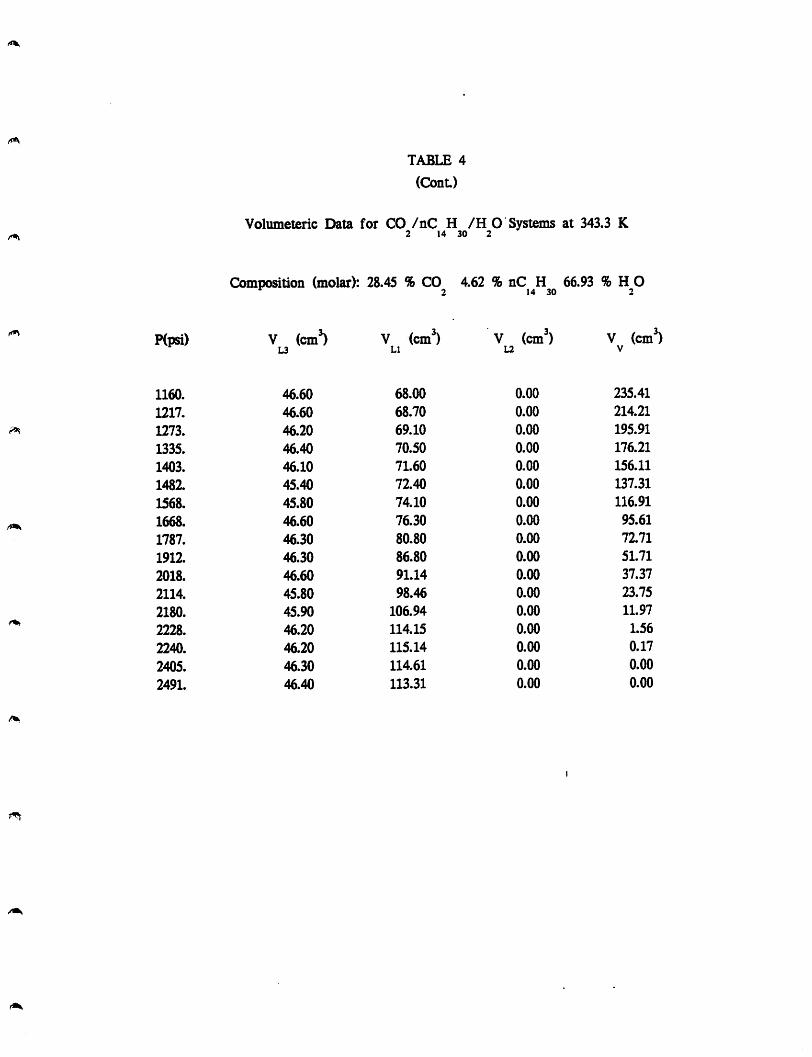
TABLE 4
(Cont)
Volumeteric Data for CO /nC H /H O Systems at 343.3 K^ 2 14 30 2
Composition (molar): 28.45 % CO 4.62 % nC H 66.93 % H O2 14 30 2
Kpsi) V (cm') V W) V (cm') V (cm')L3 LI L2 V
/«s
/•S
1160. 46.60 68.00 0.00 235.41
1217. 46.60 68.70 0.00 214.21
1273. 46.20 69.10 0.00 195.91
1335. 46.40 70.50 0.00 176.21
1403. 46.10 7L60 0.00 156.11
1482. 45.40 72.40 0.00 137.31
1568. 45.80 74.10 0.00 116.91
1668. 46.60 76.30 0.00 95.61
1787. 46.30 80.80 0.00 72.71
1912. 46.30 86.80 0.00 5L71
2018. 46.60 9L14 0.00 37.37
2114. 45.80 98.46 0.00 23.75
2180. 45.90 106.94 0.00 11.97
2228. 46.20 114.15 0.00 1.56
2240. 46.20 115.14 0.00 0.17
2405. 46.30 114.61 0.00 0.00
249L 46.40 113.31 0.00 0.00

TABLE 4
(Cont)
Volumeteric Data for CO /nC H /H 0 Systems at 343.3 K2 14 30 2
Composition (molar): 22.78 % CO 5.00 % nC H 72.22 % H O2 14 30 2
P(psi) V (cm^) V (cm^) V (cm^) V (cm^)U Ll L2 V
5^
1015. 58.50 77.40 0.00 200.41
1077. 58.70 77.50 0.00 178.21
1145. 58.90 78.50 0.00 156.21
ni5. 57.30 80.20 0.00 135.41
1297. 56.50 81.30 0.00 114.61
1389. 56.10 83.40 0.00 93.61
1499. 56.10 87.00 0.00 70.91
1624. 55.90 9L37 0.00 49.64
179L 55.20 99.14 0.00 24.77
1837. 55.10 102.05 0.00 17.66
1900. 55.00 106.03 0.00 10.08
1949. 54.80 108.37 0.00 4.54
1999. 54.40 110.54 0.00 0.17
2305. 54.40 109.31 0.00 0.00
2438. 54.10 109.01 0.00 0.00
2740. 53.90 108.21 0.00 0.00
2600-h
2400-
2200'
2000-
IttOO-
I
3 1600HMM
UOO'
1200
1000-
ttOO-
Lji>g«nd
A xu-cu uauid
0 0^ OA' 0.6 0.8
Phasa Voluma Fraction
Figure 9 Pressure-Phase Voliame Fraction Diagram, 82.3U ^ COg,9.66 i, CHi^ and 8.00 i at 305.5 K
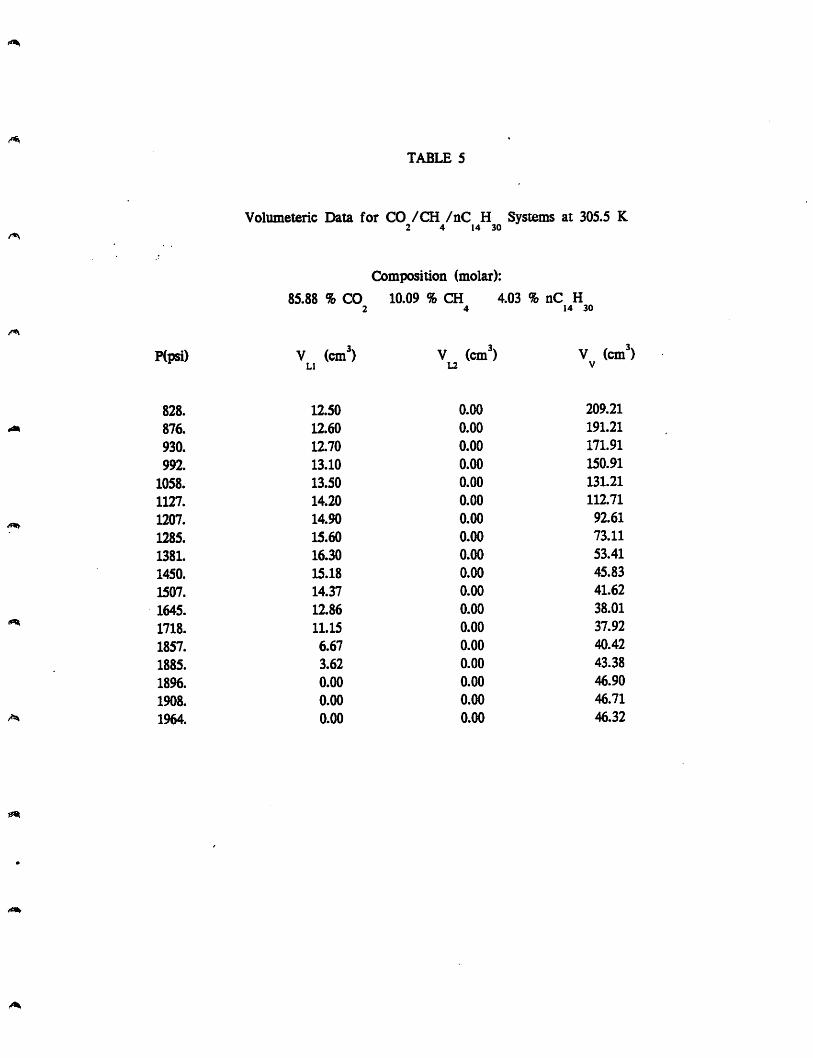
TABLE 5
Volumetenc Data for CO /CH /nC H Systems at 305.5 K2 4 14 30
Composition (molar):
85.88 % CO 10.09 % CH 4.03 % nC H2 4 14 30
P(psi) V (cm^) V (cm^) V (cm^)Ll L2 V
828. 12.50 0.00 209.21
876. 12.60 0.00 191.21
930. 12.70 0.00 171.91
992. 13.10 0.00 150.91
1058. 13.50 0.00 131.211127. 14.20 0.00 112.71
1207. 14.90 0.00 92.61
1285. 15.60 0.00 73.111381. 16.30 0.00 53.411450. 15.18 0.00 45.831507. 14.37 0.00 41.62
1645. 12.86 0.00 38.011718. 11.15 0.00 37.921857. 6.67 0.00 40.421885. 3.62 0.00 43.381896. 0.00 0.00 46.901908. 0.00 0.00 46.711964. 0.00 0.00 46.32
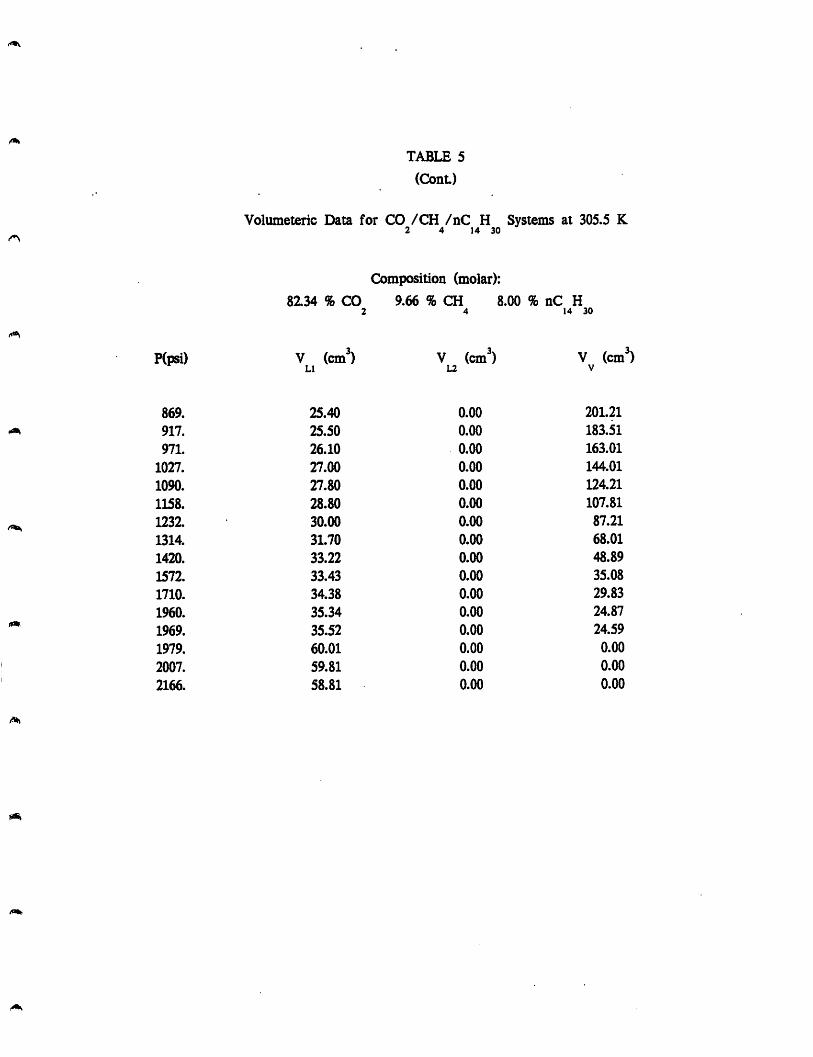
TABLE 5
(ConL)
Volumeteric Data for CO /CH /nC H Systems at 305.5 K2 4 14 30
Composition (molar):
8134 % CO2
9.66 % CH 8.00 94
h nC H14 30
P(psi) V (cm^)Ll
V (cm^)L2
V (cm^V
869. 25.40 0.00 201.21
917. 25.50 0.00 183.51
971. 26.10 0.00 163.01
1027. 27.00 0.00 144.01
1090. 27.80 0.00 124.21
1158. 28.80 0.00 107.81
1232. 30.00 0.00 87.21
1314. 31.70 0.00 68.01
1420. 33.22 0.00 48.89
1572. 33.43 0.00 35.08
1710. 34.38 0.00 29.83
1960. 35.34 0.00 24.87ifi».
1969. 35.52 0.00 24.59
1979. 60.01 0.00 0.00
2007. 59.81 0.00 0.00
2166. 58.81 0.00 0.00

TABLE 5
(Cont.)
Volumeteric Data for CO /CH /nC H Systems at 305.5 K^ 2 4 14 30
Composition (molar):
78.75 % CO 9.25 % CH 12.00 % nC H2 4 14 30
im
P(psi) V (cm^) V (cm^) V (cm^)Ll L2 V
845. 36.50 0.00 190.31
895. 37.30 0.00 171.11
947. 38.20 0.00 152.01
1007. 39.50 0.00 131.71
1071. 40.80 0.00 113.61
1147. 42.30 0.00 92.41
1230. 44.00 0.00 71.91
1327. 46.80 0.00 51.11
1424. 47.67 0.00 36.14
1520. 48.83 0.00 25.88
1826. 56.13 0.00 10.18
1946. 63.75 0.00 0.96
2066. 64.21 0.00 0.00

TABLE 5
(Cont)
Volumeteric Data for CO /CH /nC H Systems at 305.5 K2 4 14 30
Composition (molar):
75.18 % CO 8.82 % CH 16.00 % nC H2 4 14 30
P(psi) V (cm^)Ll
V (cm^)L2
V (cm^;V
568. 33.00 0.00 272.51
59L 33.20 0.00 255.81
613. 33.40 0.00 242.51
637. 33.60 0.00 228.01
668. 34.00 0.00 21L41
706. 34.40 0.00 193.91
745. 35.00 0.00 177.51
790. 35.40 0.00 159.41
841. 36.00 0.00 141.41
906. 36.90 0.00 121.61
974. 38.10 0.00 103.41
105L 39.30 0.00 84.51
1098. 39.90 0.00 74.01
1117. 40.40 0.00 69.71
1133. 4L30 0.00 66.11
1152. 41.10 0.00 63.01
1174. 41.30 0.00 58.11
1199. 4L50 0.00 53.61
1226. 41.80 0.00 50.11
1252. 41.47 0.00 45.24
1282. 43.16 0.00 40.45
1322. 43.90 0.00 34.41
1367. 45.19 0.00 28.32
1420. . 45.73 0.00 22.18
1491. 47.10 0.00 16.31
1580. 48.80 0.00 10.51
1787. 53.95 0.00 2.59
1840. 56.00 0.00 0.45
2306. 55.45 0.00 0.00

TABLE 5
(Cont)
Volumeteric Data for CO /CH /nC H Systems at 305.5 K^ 2 4 14 30
Composition (molar):
71.60 % CO 8.40 % CH 16.00 % nC H2 4 14 30
P(psi) V (cm^) V (cm^) V (cm^)Ll L2 V
792. 56.00 0.00 168.71
839. 56.90 0.00 149.81
893. 57.80 0.00 129.71
955. 58.90 0.00 109.21
1027. 60.20 0.00 88.01
1107. 62.80 0.00 68.71
1197. 64.74 0.00 49.17
1307. 68.27 0.00 29.64
1393. 69.75 0.00 17.66
1510. 74.74 0.00 5.17
1585. 76.14 0.00 1.17
1614. 76.16 0.00 0.55
1668. 76.01 0.00 0.00
ina.
1
23MlA
tsa.
3SOO<
SOOO
2500
2000-
isoo-
1000
soo I I I0 0.2 0.4 0.6
Phasd Voluma Fraction
Figure 10 Pressure-Phase Volume Fraction Diagram, 85.92 ^ COg,10.08 i CHi^. and 1^.00 ^ a-t 3^3.3 K
biO«ndO XU-CM U«aiB ¥tUML
xv-VAPoanuu
' I ' '
0.8

TABLE 6
Volumetenc Data for CO /CH /nC H /H O Systems at 305.5 K2 4 14 30 2
Composition (molar):
54.30 % CO 6.38 % CH 2.55 % nC H 36.77 % H O2 4 14 30 2
Kpsi) V (cm') V (cm') V (cm') V (cm')u LI U V
885. 7.90 13.00 0.00 186.11
939. 7.90 13.00 0.00 166.31
1002. 8.00 13.30 0.00 146.21
1068. 7.70 14.00 0.00 126.71
1140. 7.60 14.80 0.00 109.01
1217. 8.10 15.20 0.00 89.41
1304. 8.20 16.00 0.00 68.81
1408. 8.30 16.30 0.00 49.41
1514. 8.30 14.22 0.00 40.79
1636. 8.32 13.30 0.00 37.09
1717. 8.86 11.62 0.00 36.23
1799. 8.80 10.85 0.00 36.71
1872. 9.60 6.65 0.00 38.20
1908. 10.88 2.40 0.00 40.98
1932. 11.59 0.00 0.00 42.40
1965. 11.72 0.00 0.00 41.91
2045. 11.84 0.00 0.00 41.52

A
TABLE 6
(ConL)
Volumeteric Data for CO /CH /nC H /H O Systems at 305.5 K^ 2 4 14 30 2
Composition (molar):
38.20 % CO 4.48 % CH 3.71 % nC H 53.61 % H O2 4 14 30 2
P(psi) V (cm^) V (cm^) V (cm^) V (cm^)U Ll L2 V
rm
888. 19.10 25.00 0.00 189.61
940. 18.60 26.00 0.00 169.81
996. 18.40 27.20 0.00 150.31
1059. 18.20 28.30 0.00 130.41
1124. 18.10 29.40 0.00 111.01
1202. 18.00 31.00 0.00 91.81
1287. 18.00 32.70 0.00 71.91
1384. 18.30 33.00 0.00 53.71
1489. 18.80 33.27 0.00 38.94
1666. 19.00 33.55 0.00 29.36
1845. 19.00 35.65 0.00 24.96
1990. 19.10 41.11 0.00 17.00
2022. 19.20 57.81 0.00 0.00
2040. 19.10 57.11 0.00 0.00
2250. 19.00 56.91 0.00 0.00
TABLE 6
(Cont.)
A
Volumeteric Data for CO /CH /nC H /H O Systems at 305.5 K2 4 14 30 2
Composition (molar):
28.81 % CO 3.38 % CH 4.39 9h nC H 63.42 9h HO2 4 14 30 2
P(psi) V (cm^) V (cm^) V (cm^) V (cm-u Ll L2 V
832. 28.70 37.10 0.00 188.71
881. 28.80 37.60 0.00 168.61
936. 28.70 38.50 0.00 148.51
999. 28.60 39.80 0.00 127.71
1068. 28.30 40.80 0.00 107.61
1147. 28.10 42.20 0.00 87.21
1241. 27.90 45.50 0.00 66.01
132L 28.00 47.41 0.00 50.30
1417. 28.30 48.93 0.00 34.98
1562. 28.60 50.74 0.00 20.87
1701. 29.00 53.00 0.00 13.71
1829. 29.30 56.83 0.00 7.68
1930. 29.40 61.81 0.00 1.50
1939. 29.60 62.89 0.00 0.12
2007. 29.30 63.01 0.00 0.00
2131. 29.10 63.01 0.00 0.00
2208. 28.70 63.21 0.00 0.00

TABLE 6
(ConL)
^ Volumeteric Data for CO /CH /nC H /H O Systems at 305.5 K^ 2 4 14 30 2
Composition (molar):
22.70 % CO 2.66 % CH 4.83 % nC H 69.81 % H O2 4 14 30 2
.
P(psi) V (cm^) V (cm^) V (cm^) V (cm^)L3 Ll L2 V
865. 30.10 35.90 0.00 124.91
930. 30.30 37.70 0.00 106.01
1004. 30.70 39.10 0.00 87.21
1085. 30.80 40.60 0.00 70.11
1191. 31.00 41.92 0.00 50.49
1249. 30.90 43.50 0.00 40.61
1323. 31.00 44.80 0.00 30.21
1424. 31.20 46.71 0.00 18.60
1584. 31.10 49.45 0.00 8.16
1775. 31.20 53.34 0.00 1.37
1781. 31.20 53.40 0.00 0.91
1954. 31.20 53.81 0.00 0.00
2410. 31.10 53.41 0.00 0.00
2792. 31.20 52.91 0.00 0.00
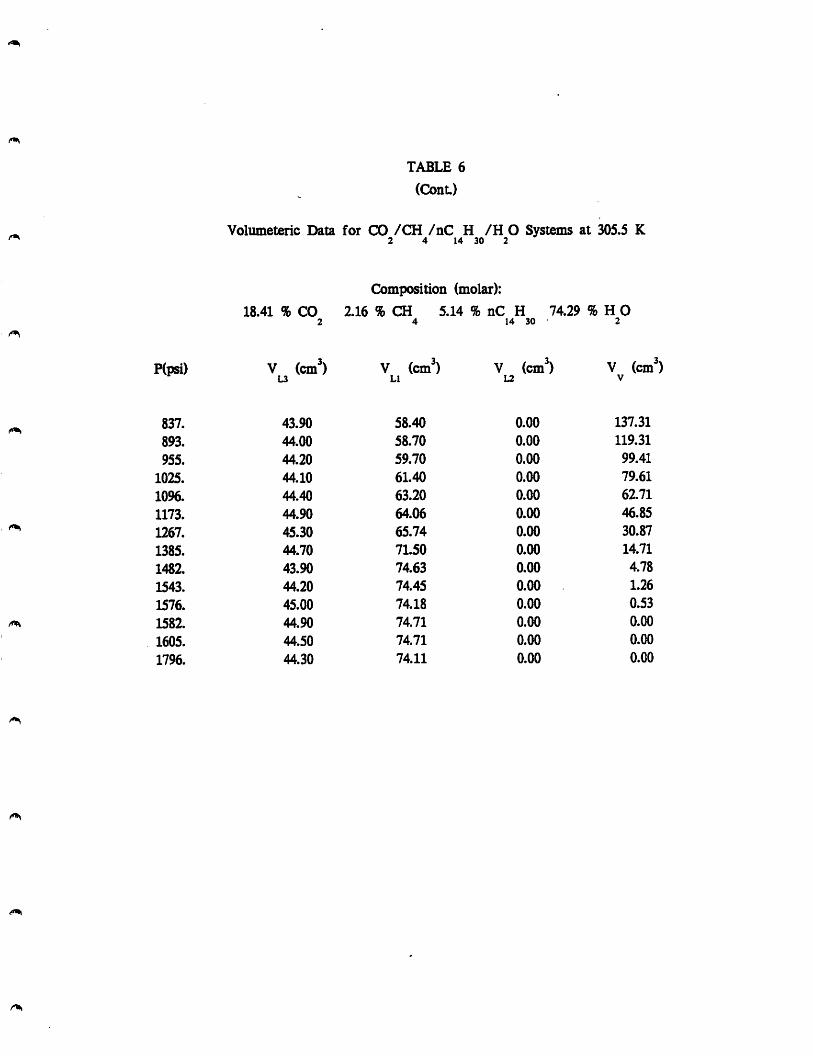
TABLE 6
(ConL)
Volumeteric Data for CO /CH /nC H /H O Systems at 305.5 K2 4 14 30 2
Composition (molar):
18.41 % CO 2.16 % CH 5.14 % nC H 74.29 % H O2 4 14 30 2
Kpsi) V (cm') V (cm') V (cm') V (cm')U LI L2 V
837. 43.90 58.40 0.00 137.31
893. 44.00 58.70 0.00 119.31
955. 44.20 59.70 0.00 99.41
1025. 44.10 61.40 0.00 79.61
10%. 44.40 63.20 0.00 62.71
1173. 44.90 64.06 0.00 46.85
1267. 45.30 65.74 0.00 30.87
1385. 44.70 71.50 0.00 14.71
1482. 43.90 74.63 0.00 4.78
1543. 44.20 74.45 0.00 1.26
1576. 45.00 74.18 0.00 0.53
1582. 44.90 74.71 0.00 0.00
1605. 44.50 74.71 0.00 0.00
1796. 44.30 74.11 0.00 0.00
2fi00-
2200
1000-
ttOO-
600- -1 I I I
Ljig«ndO kv-VAraahu»£
XU-CM USMItt niAU
ku-ioa uauia^MAftC
Phaso Volume Fraction
Figure 11 Pressure-Phase Volume Fraction Diagram, 38.20^ COg,3.71^ and 53.615^ H2O at 305.5 K

(«*»
TABLE 7
Volumeteric Data for CO /CH /nC H Systems at 343.3 K2 4 14 30
Composition (molar):
85.92 % CO 10.08 % CH 4.00 % nC H2 4 14 30
P(psi) V (cm^) V (cm^) V (cm^)Ll L2 V
1019. 13.50 0.00 214.91
1100. 13.60 0.00 193.61
1193. 13.90 0.00 172.01
1302. 14.20 0.00 150.31
1432. 14.70 0.00 128.81
1583. 15.20 0.00 109.81
1760. 15.60 0.00 90.11
1982. 16.40 0.00 7L71
2180. 17.00 0.00 59.31
2403. 17.50 0.00 49.31
2638. 16.26 0.00 44.75
U13. 14.43 0.00 43.38
2876. 9.49 0.00 46.32
2890. 6.93 0.00 48.70
2910. 0.00 0.00 55.26
3014. 0.00 0.00 54.36

TABLE 7
(Cont)
Volumeteric Data for CO /CH /nC H Systems at 343.3 K2 4 14 30
Composition (molar):
82.33 % CO 9.67 % CH 8.00 % nC H2 4 14 30
P(psi) V (cm^) V (cm^) V (cm^)Ll L2 V
981 23.70 0.00 226.61
1047. 23.80 0.00 206.81
1126. 24.10 0.00 186.21
1218. 24.60 0.00 164.41
1325. 25.20 0.00 143.211445. 25.80 0.00 122.91
1581. 26.50 0.00 105.111748. 27.50 0.00 86.11
1936. 29.00 0.00 68.41
2098. 30.40 0.00 56.312295. 30.88 0.00 45.832456. 31.69 0.00 39.222590. 32.99 0.00 34.022714. 34.28 0.00 29.73
2860. 38.77 0.00 22.742936. 40.90 0.00 20.213000. 59.41 0.00 0.00
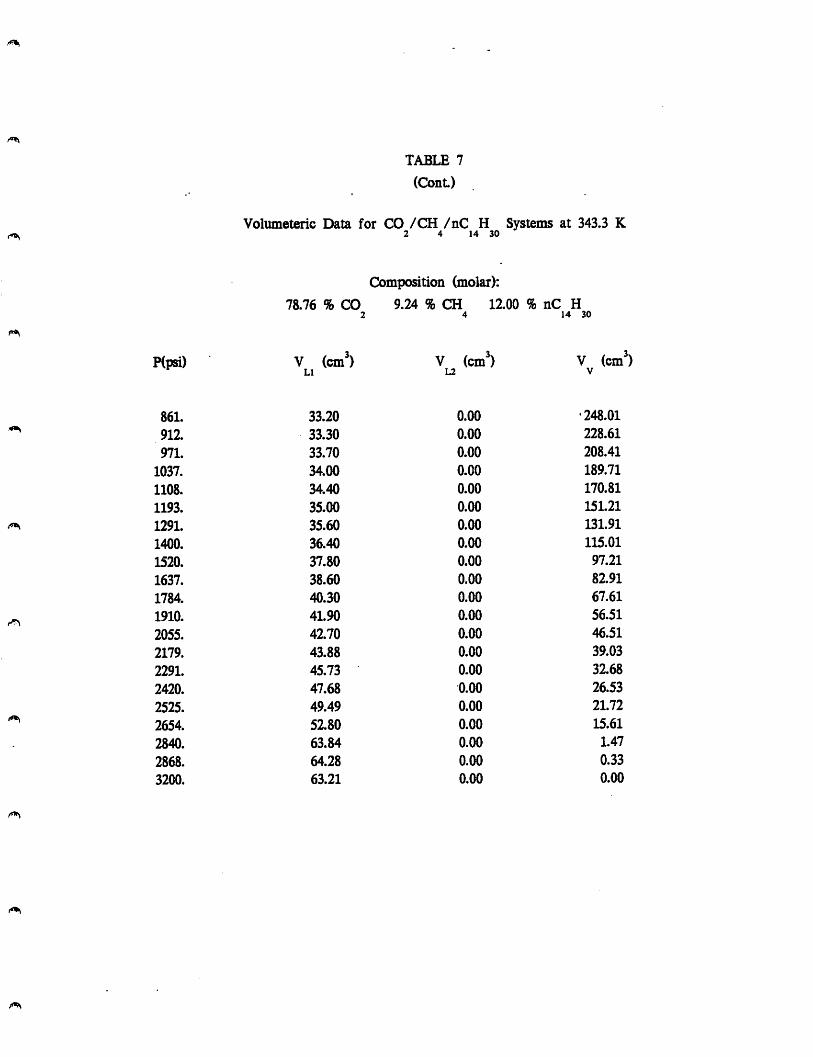
TABLE 7
(Cont)
Volumeteric Data for CO /CH /nC H Systems at 343.3 K2 4 14 30
Composition (molar):
78.76 % CO 9.24 % CH 12.00 % nC H2 4 14 30
Hpsi) V (cm') V (cm') V (cm')LI L2 V
861. 33.20 0.00 •248.01
912. 33.30 0.00 228.61
971. 33.70 0.00 208.41
1037. 34.00 0.00 189.71
1108. 34.40 0.00 170.81
1193. 35.00 0.00 151.21
1291. 35.60 0.00 131.91
1400. 36.40 0.00 115.01
1520. 37.80 0.00 97.21
1637. 38.60 0.00 82.91
1784. 40.30 0.00 67.61
1910. 41.90 0.00 56.51
2055. 42.70 0.00 46.51
2179. 43.88 0.00 39.03
2291. 45.73 0.00 32.68
2420. 47.68 0.00 26.53
2525. 49.49 0.00 21.72
2654. 52.80 0.00 15.61
2840. 63.84 0.00 1.47
2868. 64.28 0.00 0.33
3200. 63.21 0.00 0.00

TABLE 7
(Cont)
Volumeteric Data for CO /CH /nC H2 4 14 30
Systems at 343.3 K
Composition (molar):
75.18 % CO2
8.82 % CH 164
.00 % nC H14 30
P(psi) V (cm')LI
V (cm^)L2
V (cm^)V
957. 45.10 0.00 200.31
1028. 45.50 0.00 180.01
1108. 45.00 0.00 158.81
1200. 47.10 0.00 137.81
1307. 48.50 0.00 117.01
1437. 49.90 0.00 96.21
1590. 51.40 0.00 77.71
1764. 53.70 0.00 59.21
1938. 55.78 0.00 44.83
2139. 58.21 0.00 32.00
2300. 61.29 0.00 22.92
2458. 63.29 0.00 16.42
2600. 69.42 0.00 7.19
2720. 73.18 0.00 1.23
2725. 73.68 0.00 0.33
2752. 73.81 0.00 0.00
2945. 73.31 0.00 0.00

/«(
TABLE 7
(ConL)
Volumeteric Data for CO /CH /nC H Systems at 343.3 K- 2 4 14 30
Composition (molar):
71.60 % CO 8.40 % CH 20.00 % nC H2 4 14 30
Hpsi) V (cm') V (cm') V (cm')LI L2 V
953. 55.10 0.00 186.61
1030. 55.80 0.00 164.81
1113. 57.00 0.00 143.51
1212. 58.00 0.00 122.21
1330. 59.70 0.00 100.91
1478. 61.40 0.00 79.01
1645. 64.50 0.00 58.51
1818. 68.11 0.00 42.10
1990. 71.61 0.00 28.60
2243. 76.90 0.00 12.81
2465. 80.81 0.00 3.20
2516. 81.48 0.00 0.63
2543. 82.01 0.00 0.00
2692. 81.51 0.00 0.00

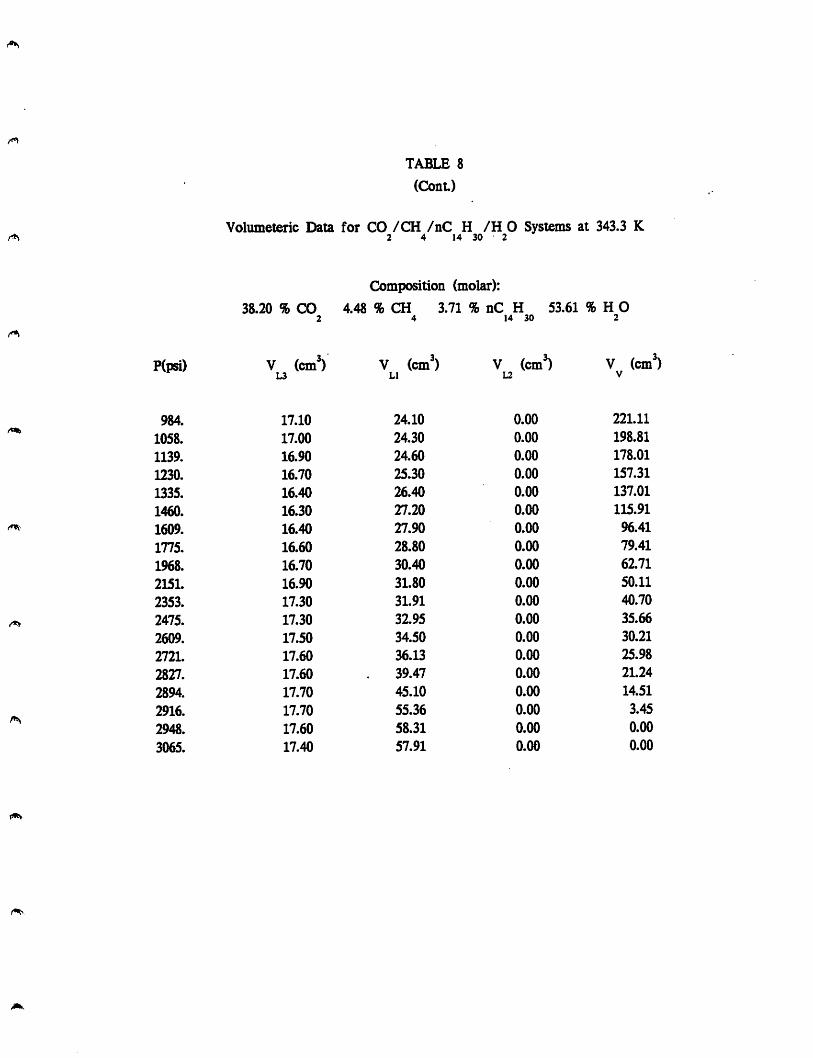
fop this system at 305.5 K. Figure 12 exhibits the volumetric data for the same
system shown in Figure 10 but with water added. Again, the same type of phase
behavior was observed except for the addition of aqueous phase. Table 8 presents
the data for this system at 343.3 K.

3600-w
SOOO
2S00-
COH.
I
^ 2000MM
M
1S00<
1000-
500
Ui9«n<iO XV-VAMII ntMNCA xu-cu uatfitt riuMt+ KU-waouaMOmum
()()
d)
(TH 'I 'I'"!—I'l 'I' I 9*9'
a 0^' 0.6 0.A
Phas« Volume Fraction
Figure 12 Pressure-Phase Volume- Fraction Diagram^ 3k*k6ffi CO2, 6.38^GHl^, nCiP^o an«i 36.63^ HgO at 34-3.3 K

TABLE 8
Volumeteric Data for CO /CH /nC H /H O Systems at 343.3 K2 4 14 30 2
Composition (molar):
54.46 % CO 6.38 % CH 2.54 % nC H 36.62 % H O2 4 14 30 2
Wpsi) V (cm') V (cm') V (cm') V (cm')L3 LI L2 V
1004. 7.50 15.90 0.00 215.911111. 7.50 16.00 0.00 187.01
1200. 7.20 16.50 0.00 166.31
1305. 7.00 17.00 0.00 145.51
1425. 6.90 17.50 0.00 125.41
1578. 6.70 18.20 0.00 105.81
1763. 6.40 19.30 0.00 85.71
1965. 6.40 20.50 0.00 68.212127. 6.30 21.50 0.00 57.51
2296. 6.70 22.20 0.00 48.51
2404. 7.00 22.45 0.00 44.06^ 2500. 7.10 22.70 0.00 40.81
2615. 7.00 22.74 0.00 37.772751. 6.90 22.43 0.00 35.182854. 7.00 19.18 0.00 36.43
2861. 7.00 17.05 0.00 38.262876. 7.10 0.00 0.00 54.91
2990. 7.00 0.00 0.00 54.013071. 7.00 0.00 0.00 53.71
TART.F 8
(ConL)
Volumeteric Data for CO /CH /nC H /H 0 Systems at2 4 14 30 2
343.3 K
Composition (molar):
38.20 % CO2
4.48 % CH 3.71 %4
nC H 53.61 9114 30
j HO2
P(psi) V (cm^)u
V (cm^)Ll
V (cm')L2
V (cm^)V
984. 17.10 24.10 0.00 221.11
1058. 17.00 24.30 0.00 198.81
1139. 16.90 24.60 0.00 178.01
1230. 16.70 25.30 0.00 157.31
1335. 16.40 26.40 0.00 137.01
1460. 16.30 27.20 0.00 115.91
1609. 16.40 27.90 0.00 96.41
1775. 16.60 28.80 0.00 79.41
1968. 16.70 30.40 0.00 62.71
2151. 16.90 31.80 0.00 50.11
2353. 17.30 31.91 0.00 40.70
2475. 17.30 32.95 0.00 35.66
2609. 17.50 34.50 0.00 30.21
2721. 17.60 36.13 0.00 25.98
2827. 17.60 39.47 0.00 21.24
2894. 17.70 45.10 0.00 14.51
2916. 17.70 55.36 0.00 3.45
2948. 17.60 58.31 0.00 0.00
3065. 17.40 57.91 0.00 0.00

TABLE 8
(Cont.)
Volumeteric Data for CO /CH /nC H /H O Systems at 343.3 K/<*> 2 4 14 30 2
/*!•
am,
Composition (molar):
28.81 % CO 3.38 % CH 4.39 % nC H 63.42 % H O2 4 14 30 2
P(psi) V (cm^) V (cm^) V (cm^) V (cm^)U LI L2 V
944. 24.30 34.70 0.00 211.41
1012. 24.30 35.00 0.00 190.31
1087. 24.40 35.60 0.00 169.71
1175. 24.80 35.90 0.00 149.11
1275. 24.90 36.30 0.00 129.51
1394. 24.70 36.70 0.00 110.21
1534. 24.50 37.70 0.00 91.11
1700. 24.60 40.40 0.00 72.01
1858. 25.10 4130 0.00 57.31
2045. 25.40 42.25 0.00 44.06
2227. 25.50 45.27 0.00 33.44
2419. 26.00 47.96 0.00 23.75
2570. 26.00 52.20 0.00 15.81
ms. 26.10 57.50 0.00 6.81
2851. 26.10 62.38 0.00 0.63
2895. 26.00 62.81 0.00 0.00
2945. 25.90 62.71 0.00 0.00
3085. 25.80 61.91 0.00 0.00
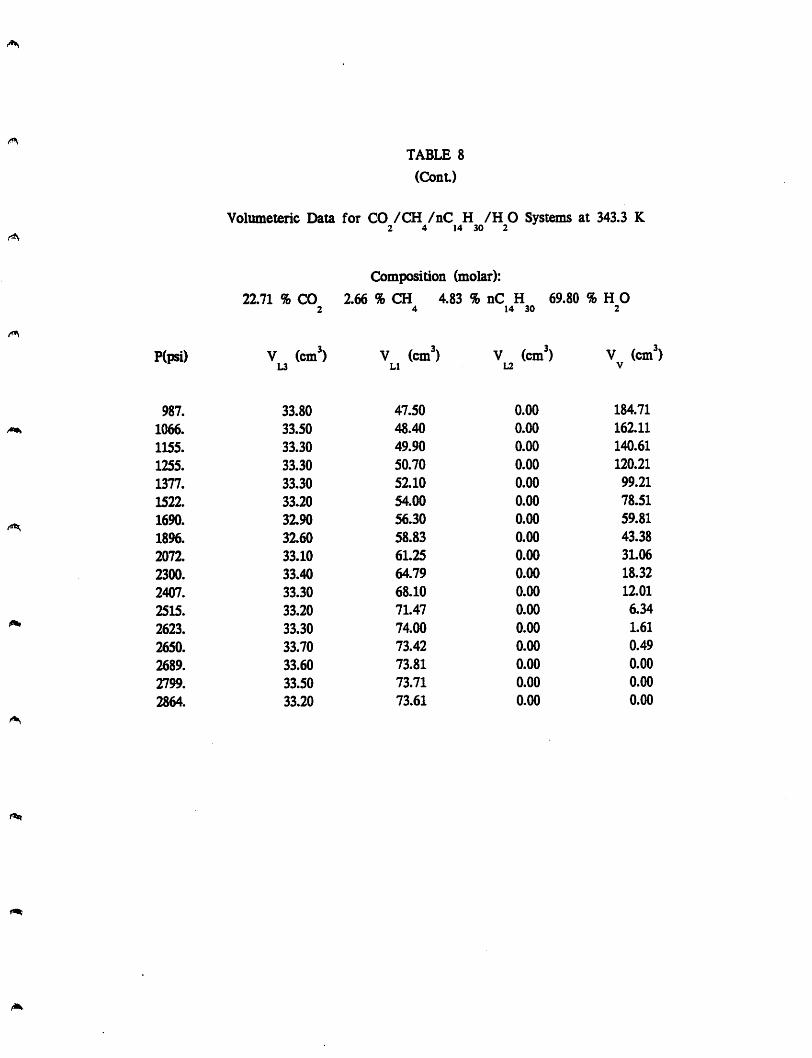
A
TABLE 8
(ConL)
Volumeteric Data for CO /CH /nC H /H 0 Systems at2 4 14 30 2
343.3 K
Composition (molar):
22.71 % CO2
2.66 % CH 4.83 %4
nC H 69.80 9114 30
9 HO2
P(psi) V (cm^)L3
V (cm^)Ll
V (cm^)L2
V (cm^V
987. 33.80 47.50 0.00 184.71
1066. 33.50 48.40 0.00 162.11
1155. 33.30 49.90 0.00 140.61
1255. 33.30 50.70 0.00 120.21
1377. 33.30 52.10 0.00 99.21
1522. 33.20 54.00 0.00 78.51
1690. 32.90 56.30 0.00 59.81
1896. 3160 58.83 0.00 43.38
2072. 33.10 61.25 0.00 31.06
2300. 33.40 64.79 0.00 18.32
2407. 33.30 68.10 0.00 12.01
2515. 33.20 71.47 0.00 6.34
2623. 33.30 74.00 0.00 1.61
2650. 33.70 73.42 0.00 0.49
2689. 33.60 73.81 0.00 0.00
2799. 33.50 73.71 0.00 0.00
2864. 33.20 73.61 0.00 0.00