multiphase meter capable of detecting scale on the … · multiphase meter capable of detecting...
TRANSCRIPT
31st North Sea Flow Measurement Workshop Norway, October 2013
1
Multiphase meter capable of detecting scale on the pipe wall
and correcting flow rate measurements
Arnstein Wee, MPM Øystein Fosså, ConocoPhillips
Vidar Rune Midttveit, Statoil 1 INTRODUCTION Scaling and wax deposits of oilfield equipment represent a major issue in oil and gas production as the decreased cross-sectional area leads to reduced fluid flow and hence reduced productivity. The deposits may further damage instruments or in best case lead to reduced functionality and increased measurent uncertainty. MPM has developed and patented a method for both scale detection inside the multiphase meter and measurement of the scale thickness. The method further encompasses corrections to be performed, in order for the MPM meter to provide reliable flow rate measurements even with significant amounts of scale on the pipe wall. Once scale has been detected by the meter, the operator is left with several choices. The meter can be used to monitor the effect of corrective actions initiated by the operator to clean or to prevent further build-up of scale in the piping. The MPM meter sensor calibration parameter can also easily be corrected for scale build up such that the measurement integrity of the meter is maintained during these operations. Alternatively, the meter can be removed from service and cleaned once scale is detected. This paper present the work performed over several years in JIP projects with leading oil companies, including Statoil and ConocoPhillips. A first study, sponsored by ConocoPhillips, was performed in 2009 where scale was artificially created at laboratory conditions. Based on the results from this study, some preliminary conclusions were made and lessons learned. One conclusion was that studies from real scale should be sought investigated. In 2012, an MPM Meter, which had been in operation for several years at a Statoil operated field, was returned for service. It was found that the meter had a scale layer of approximately 2 mm. Statoil agreed the meter could be used for extensive studies as a part of the ongoing JIP with participation by 9 oil companies. The meter was installed in the MPM flow loop and flow tested in order to study the measurement effect with scale on the pipe walls. The paper describes the test results and the experience with artificial generated scale versus scale from a real field application. Pictures and measurement of the scale on the meter internals is presented together with the method for detecting and measuring scale on the pipe wall. The scaled-up meter was flowtested before and after cleaning and the method for correcting the calibration parameters of a multiphase meter to account for the presence of scale on the pipe walls has been tested and verified. 2 SCALE IN OIL PRODUCTION FACILITIES Oilfield scale is generally found as inorganic salts of the alkaline metals calcium (Ca), strontium (Sr) and barium (Ba), examples of which are carbonates and sulfates. Scale may also be complex iron salts such as sulfides, hydrous oxides and carbonates.

31st North Sea Flow Measurement Workshop Norway, October 2013
2
Carbonate scales usually form through precipitation due to the change in condition. Sulfate scales on the other hand, arise when two incompatible waters mix together. Lastly, iron scales derive from iron-rich sources such as pipe work and vessels and hence reflect the corrosion in these. Mineral scales deposition depends on several variables, among which are: - Degree of water saturation - Rate of change in temperature - Impurities - Change in pH of the solution - Change in pressure Scale problems can arise under the following circumstances [18]:
During drilling and well completion, if the drilling mud or completion fluid is incompatible with the formation water
At the commissioning stage of new injectors, if the injection water is incompatible with the formation water
During production, when a well starts to produce formation water with the hydrocarbons During wellstream processing, when significant quantities of produced water put process
equipment at risk Commingled production, where wellstreams from various formations, reservoirs or
individual wells are mixed together, can make matters worse. Scaling can thus occur in both production and injection wells and scale removal is therefore a common well-intervention operation. Figure 1 below shows a picture of extreme buildup of scale in pipe lines [18].
Figure 1: Example of significant scale buildup A multiphase meter, which is going to be used for flow for conditions where there is risk for scale build-up, needs to be able to provide reliable measurements of the oil, water and gas flow rate in the presence of some scale on the pipe walls. This is particularly important when multiphase flow
31st North Sea Flow Measurement Workshop Norway, October 2013
3
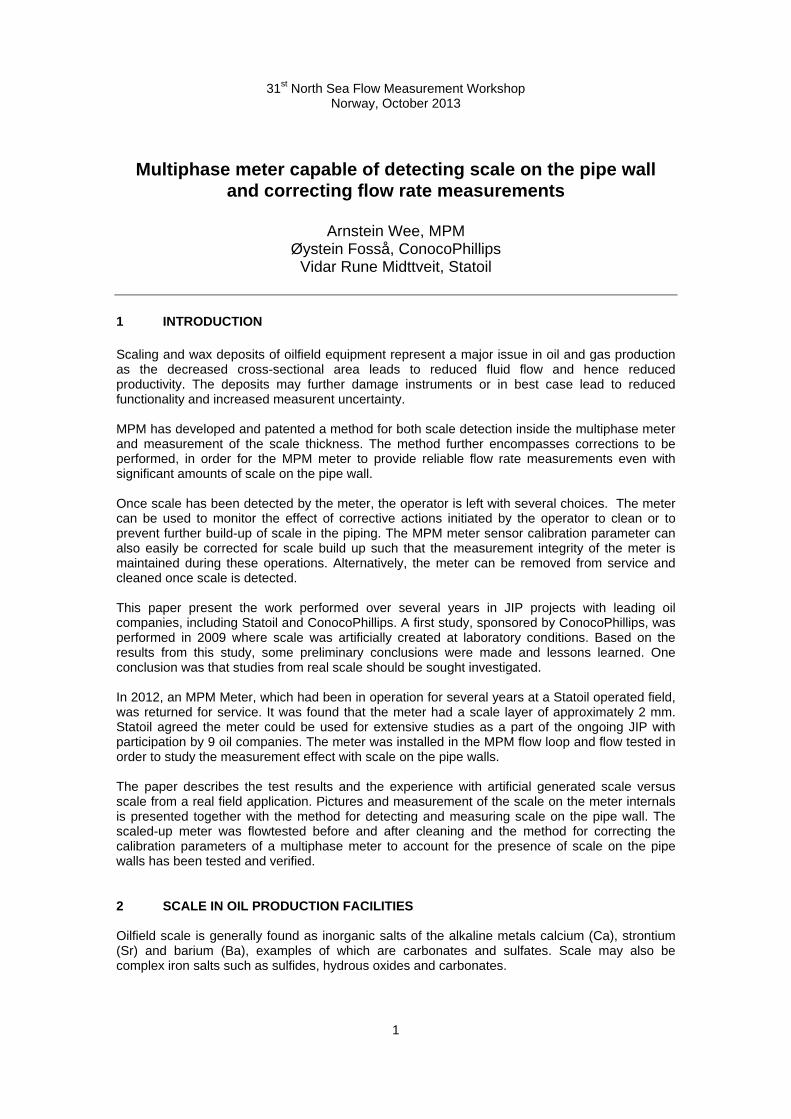
meters are used to measure the production of comingled wells or fields since the risk of scale build-up then can be quite large. 3 MPM TECHNOLOGY 3.1 3D Broadband™ The MPM meter measures multiphase flowrates with no separation or mixing device. A combination of a Venturi flow meter, a gamma-ray densitometer, a multi-dimensional, multi-frequency dielectric measurement system and advanced flow models are used. These are combined to form a multi-modal parametric measurement system [10], [11], [12], [13], [14]. The 3D Broadband system is a high-speed electro-magnetic (EM) wave based technique for measuring the water/liquid ratio, the water salinity and the liquid/gas distribution within the pipe cross section, as illustrated in Figure 2. By combining this information with the measurements from the Venturi, the flowrates of oil, water and gas are determined. The measurement is based on permittivity measurements performed at many frequencies in many planes within the sensor simultaneously. The measurement frequencies cover a range of 20 to 3700 MHz. The MPM meter has a dual mode functionality, which means that the meter is a combined multiphase and a wet gas meter [16]. At ultra-high GVFs (typically > 99% GVF), the liquid volume is extremely small compared to the gas volume. Under these conditions, the Droplet Count® functionality improves the measurement resolution of the liquid fraction. This function is also highly tolerant towards changes in fluid PVT properties, such as the oil and gas densities and water properties. Liquid droplets flowing with the gas stream in a pipe causes statistical variations in electromagnetic measurement signals. The statistical variation is primarily a function of the liquid droplet size, the number of droplets, and the permittivity of the droplets.The DropletCount® is a patented method whereby statistical electromagnetic measurements are combined with measured water fractions from the 3-Phase wetgas mode, venturi models, and empirically derived correlations to calculate the liquid fraction related to the liquid droplets. MPM uses electromagnetic measurements with ultra fast and sensitive responses, which are scaled to the pipe diameter and the permittivity of the material within the pipe. The measurement field is uniformly distributed within the cross section of the pipe with low sensitivity to the liquid film along the pipe wall and more towards where the droplets flow. The measurements are extremely sensitive to small variations in permittivity caused by droplets flowing in a pipe. [17]. 3.2 In situ measurement of fluid properties The MPM meter has three methods for in situ measurement of fluid properties that represent further increased robustness against uncertainties of the PVT properties for the MPM technology [4], [7], [15].
Figure 2: 3D Broadband multi-planar measurement

31st North Sea Flow Measurement Workshop Norway, October 2013
4
Measurement of water salinity of the water phase. This is an in-line continuous
measurement which is performed while the well is flowing. Separate methods are used for multiphase and wet gas flow conditions. The method used in multiphase flow conditions covers water-continuous flow conditions only (typically WLR > 50%) and the method used in wet gas flow conditions covers both oil- and water-continuous liquid emulsions.
Measurement of gas density and permittivity by utilising the DropletCount method [17] to
detect periods with pure gas within the pipe. During these periods, the permittivity and density measurement is used to measure, verify and correct the PVT calculated values for permittivity and density. The method can also be used to measure the permittivity and density of oil.
Multi Mode Analysis. In wet gas, the MPM meter incorporates three different methods for
measurement of the fractions and flowrates of the wet gas which can be used to determine PVT properties. This is an in-line continuous measurement which is performed while the well is flowing based on recalculation of the following measurement modes:
a. three-phase mode with Droplet Count b. three-phase mode without Droplet Count c. two-phase mode with GOR Input
These three methods behave differently when errors are introduced in the PVT configuration data which can be used to derive an estimate of the PVT configuration data. The methods used for in situ measurements of fluid properties are further described in [3], [4], [6], [7], [15]. 3.3 In situ measurement of scale build-up Funcionality for measuring scale has been available in the MPM meter since 2007. A parameter named “Scale Index” was developed prior to supplying a early version of the MPM meter to ConocoPhillips in 2007 at the Ekofisk platform. At this location, scale build up was assumed to be a potential problem, and MPM therefore developed a first version of scale detection method in order to monitor potential scale build-up. In 2007, there was no experimental data available to test the scale detection function. During the first two years of operation no scale build up was seen on the meter and therefore ConocoPhillips initiated a separate development project in 2009 to investigate the scale detection function further. The MPM meter at Ekofisk has now been in continuous operation since October 2007 and still no scale build up of any significance has been seen in the meter. Test results from this meter has been presented at the North Sea Flow Measurmeent Workshop in 2009 [2]. Based on the function which was initially developed in 2007 and the experience from laboratory tests and tests of a meter which has been scaled in a field location (Gullfaks A), MPM has developed, tested and patented a new function for detection and measurement of scale build up. But even more importantly, the tests have demonstrated that the MPM meter is able to provide reliable flow rate measurements with significant amount of scale build-up inside the meter. The scale detection function first detects a known state within the pipe, such as water or gas filled sensor. Based on the measured frequency response of the 3D BroadBand antennas, and comparing these frequency sweeps with factory values, scale build up can be detected. For some conditions, such as gas filled pipe, the scale thicknes can also be determined. Based on the determined thickness of scale, the empty pipe calibration parameters, pipe diameter and venturi discharge coefficient for the sensor can easily be corrected to account for scale build-up. This method has been verified by performing flow loop testing of a MPM meter which was returned
31st North Sea Flow Measurement Workshop Norway, October 2013
5
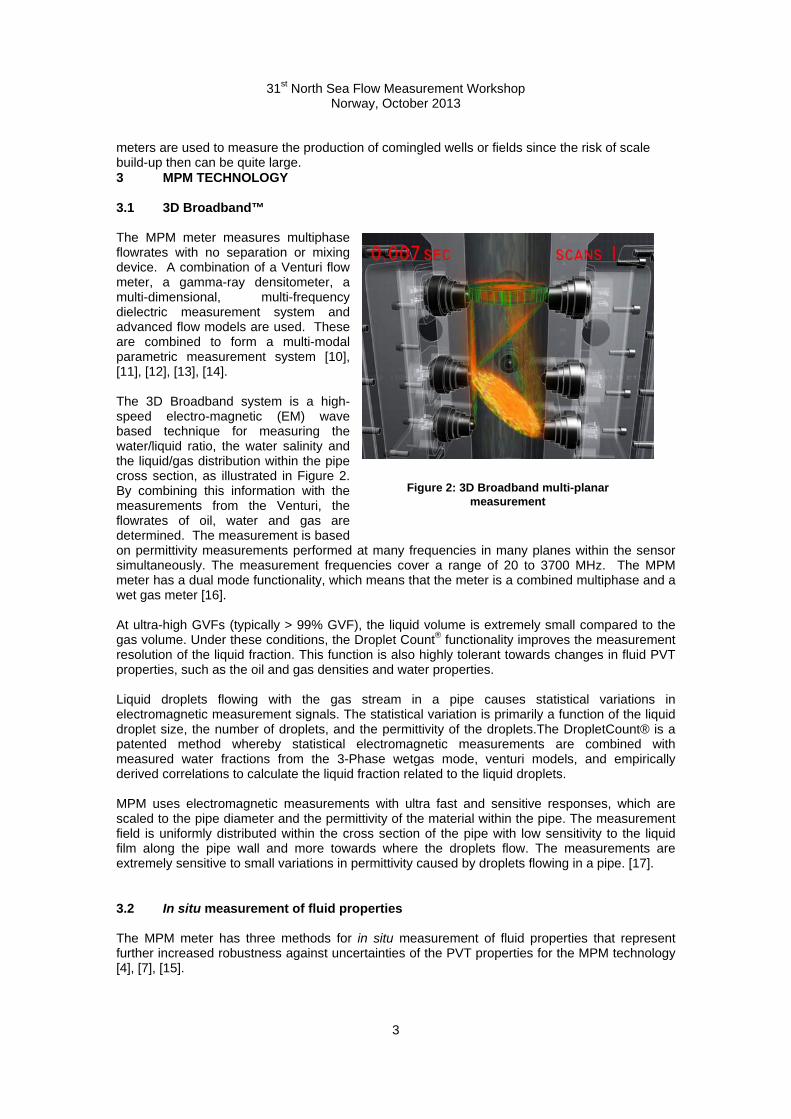
from the Gullfaks A for service. Hence the meter used during the test contained significant amount of scale from a real oil-field installation. After testing and cleaning the meter, the meter was returned to Gullfaks A and put in operation. 4 TEST SETUP 4.1 Test equipement Early prototype versions of the MPM meter has been used for all the testing described in this document. The 3D BroadBand sensor contains 9 single pin antennas where 3 antennas acts as transmitters and 6 antennas are used as receivers and one 3-pin antenna where one antenna act as a transmitter and two as a receiver (salinity antenna). All the antennas are coaxial conductors which penetrates slightly into the pipe, which is a well known antenna for transmitting and receiving electromagnetic signals (pipes/waveguides, mobile phones, radios etc). The insulating material may either be PEEK or glass. PEEK is used for low pressure applications and glass is used for high pressure and high temperature. A picture of the internal antennas are shown in the figure below.
Figure 3: Picture of the 3D BroadBand antennas 4.2 Laboratory experiements with artificial generated scale A first study was performed in 2009, sponsored by ConocoPhillips, where the main purpose was to find out if the 3-pin antenna could be used to detect presence of scale in the sensor. Barite scale was artificially created under laboratory conditions and was conducted by Intertek WestLab in Stavanger. Initially the scale was created by placing the antennas in a bath container and adding BaCl2 and Na2SO4 to form BaSO4. Throughout the execution of the experiments it proved to be difficult to build up sufficient scale with this procedure. It was therefore decided to carry out a series of experiments where thick layers of barite deposits were made on the probes manually. The latter method resulted in a porous crystalline layer rather than the hard deposits one would expect in a real field installation. The layer of scale on the antennas was gradually increased with 6 different layers, where the tickest scale layer was approximately 5 mm. For each layer of scale, the antennas was installed in a MPM meter and the frequency response was then measured and the scale layer thickness was documented by measurements and pictures.
31st North Sea Flow Measurement Workshop Norway, October 2013
6
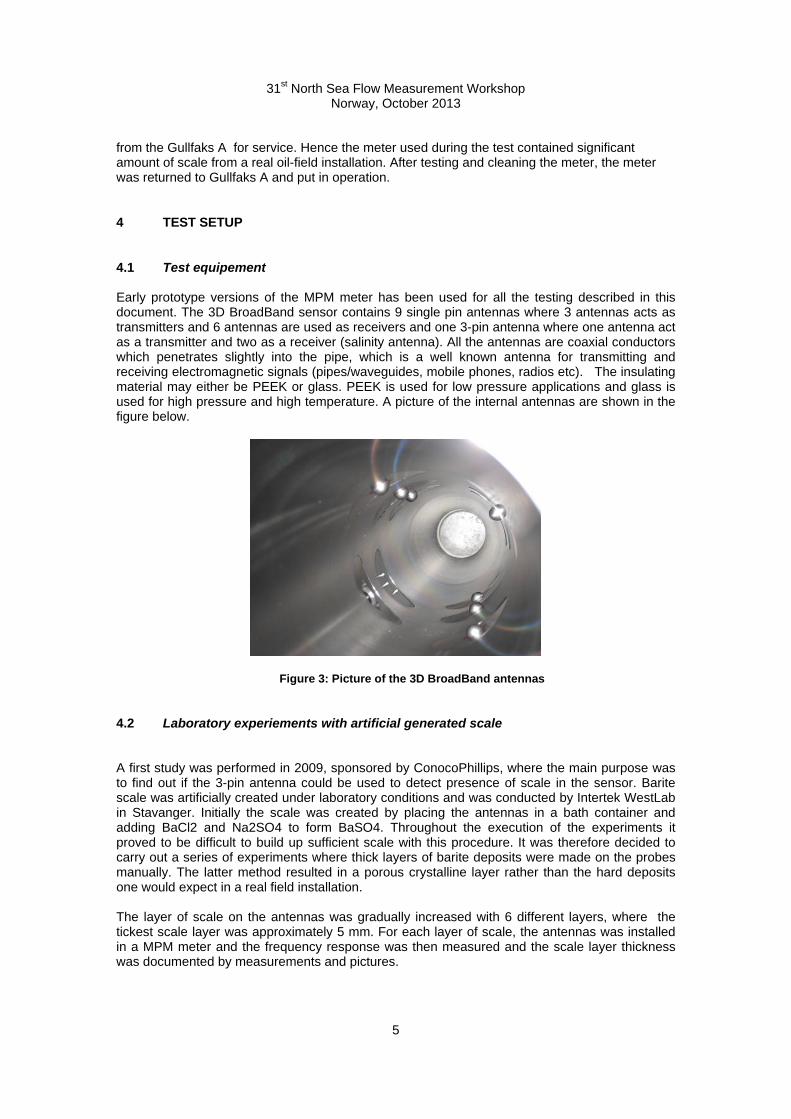
4.3 Field experiemts with real scale A 3” MPM meter has been installed in series with the test separator at Gullfaks A and has been in continuous operation since December 2006 for testing of the Gullfaks A platform wells. The initial meter was a prototype of the current MPM meter which was used to test and qualify the MPM meter. The test results and experience with this meter has been published by Statoil [9]. The meter has also been upgraded with many of the improvements and changes of the present version of the MPM meter. Figure 4 below shows a picture of the installation at Gullfaks A from December 2006.
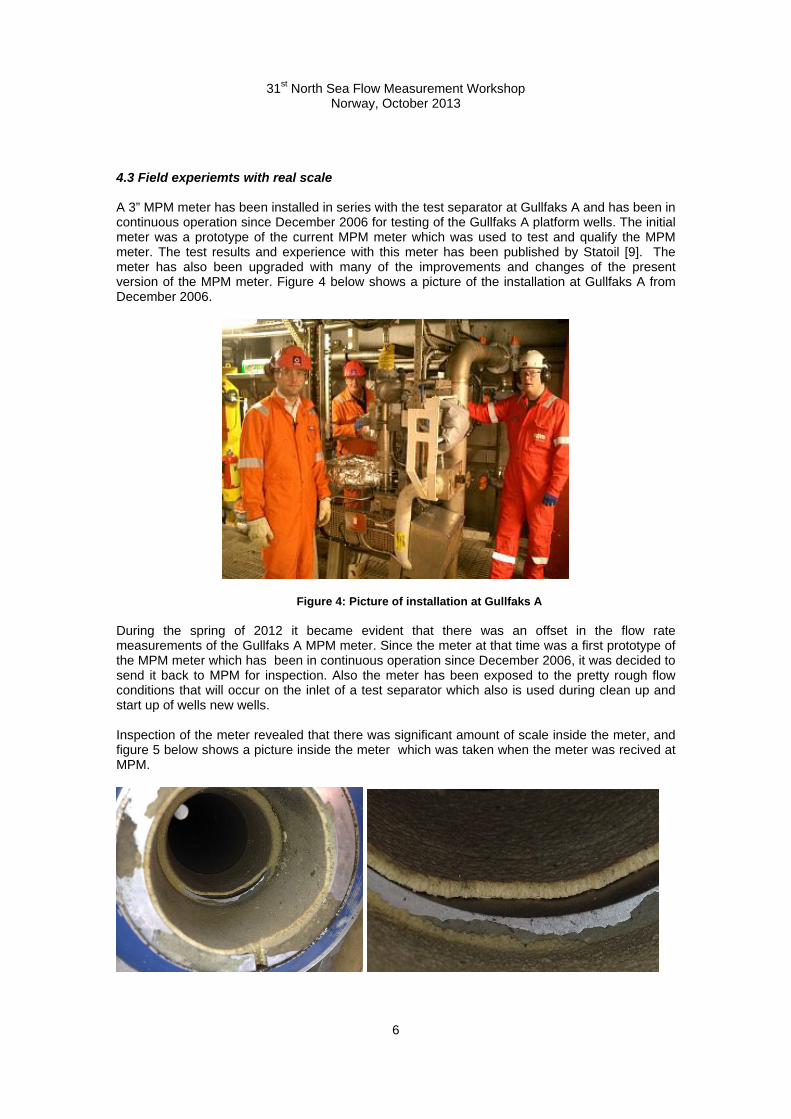
Figure 4: Picture of installation at Gullfaks A During the spring of 2012 it became evident that there was an offset in the flow rate measurements of the Gullfaks A MPM meter. Since the meter at that time was a first prototype of the MPM meter which has been in continuous operation since December 2006, it was decided to send it back to MPM for inspection. Also the meter has been exposed to the pretty rough flow conditions that will occur on the inlet of a test separator which also is used during clean up and start up of wells new wells. Inspection of the meter revealed that there was significant amount of scale inside the meter, and figure 5 below shows a picture inside the meter which was taken when the meter was recived at MPM.

31st North Sea Flow Measurement Workshop Norway, October 2013
7
Figure 5: Picture of scale in meter at Gullfaks A
Since MPM now had obtained a meter which contained real scale, a test program, as a part of the on going In-Situ Verification II project, was initiated to test the scale detection functionality developed during the project. The purpose was also to investigate the effect of scale on the flow measurement and determine if it would be possible to correct the calibration of the meter for presence of scale. The meter was tested with scale in air, salt water (15 different salinities) in adition to 44 test points in the MPM flow rig which included single phase of oil, water and gas in adition to multiphase test points over a wide GVF and WLR range covering the expected flow range for the Gullfaks A field. 5 TEST RESULTS WITH ARTIFICIAL GENERATED SCALE 5.1 Scale levels Figure 6 below shows pictures of scale layer 1-6 for the 3 pin antenna with the artificial generated scale by Intertek Westlab. The thickness for layer 6 is approximately 5 mm and scale layer 5 is approximately 3-4 mm. The porosity of the artificial generated scale is higher compared to scale in a real field applications.
Figure 6: Picture of 3-pin antenna with artificial generated scale
Figure 7 below shows corresponding pictures of one of the glass version of the single pin antennas for scale level 4-6. Similar scale levels was introduced on the PEEK version of the

31st North Sea Flow Measurement Workshop Norway, October 2013
8
antenna used for low pressure applications. Scale level 1 was omitted on the single pin antenna since the layer of scale was “microscopic”, as seen on figure 6.
Figure 7: Picture of 1-pin antenna with artificial generated scale 5.2 Frequency response of sensor with scaled single-pin antennas The scaled antennas was installed in a MPM meter sensor and the frequency response was measured from 0 to 2.500 Mhz
0 500 1000 1500 2000 2500 3000 3500-140
-120
-100
-80
-60
-40
-20
0
Frequency fqs (MHz)
Po
wer
lo
ng
-sal
init
y (p
ls)
dB
GLASS sensor:Frequency vs power long
Scale 2
Scale 4
Scale 5
Scale 6
Figure 8: Antenna (Glass) frequency in a MPM sensor with scale level 2-6
The signal frequency (MHz) is plotted shown on the x-axis of figure 8 above and the y-axis is the measured power attenuation (dBm) on the longest signal path (the receiver which has the longest distance from the transmitter). As expected, there is a small left-shift of the response as the scale layer thickens due to an increase in permittivity within the pipe as a result of the scale present. However, the shape of the frequency response and the coupling efficiency of the antennas are completely unaffected by all scale layers and hence scale have no impact on the measurement integrity or functionality of the glass antennas.
31st North Sea Flow Measurement Workshop Norway, October 2013
9
0 500 1000 1500 2000 2500 3000 3500-140
-120
-100
-80
-60
-40
-20
0
20
Frequency fqs (MHz)
Po
wer
lon
g-
salin
ity
(pls
)d
B
PEEK sensor:Frequency vs power long
Scale 2Scale 4Scale 5Scale 6
Figure 9: Antenna (PEEK) frequency in a MPM sensor with scale level 2-6
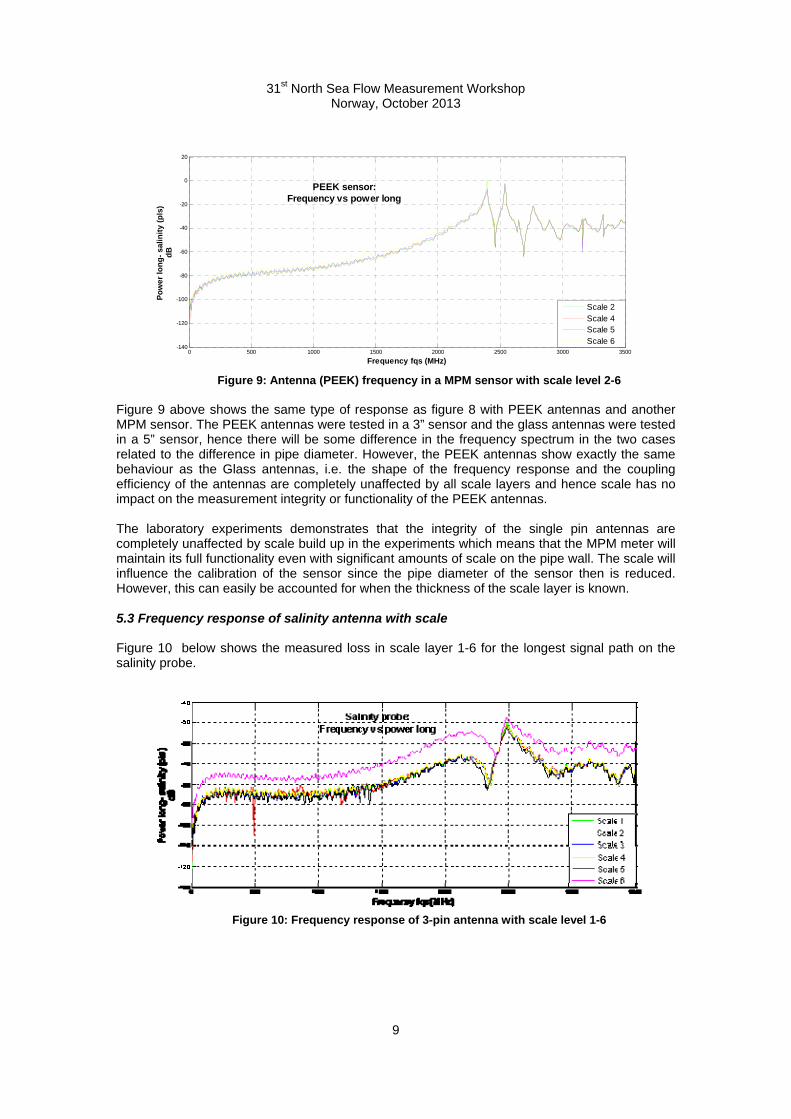
Figure 9 above shows the same type of response as figure 8 with PEEK antennas and another MPM sensor. The PEEK antennas were tested in a 3” sensor and the glass antennas were tested in a 5” sensor, hence there will be some difference in the frequency spectrum in the two cases related to the difference in pipe diameter. However, the PEEK antennas show exactly the same behaviour as the Glass antennas, i.e. the shape of the frequency response and the coupling efficiency of the antennas are completely unaffected by all scale layers and hence scale has no impact on the measurement integrity or functionality of the PEEK antennas. The laboratory experiments demonstrates that the integrity of the single pin antennas are completely unaffected by scale build up in the experiments which means that the MPM meter will maintain its full functionality even with significant amounts of scale on the pipe wall. The scale will influence the calibration of the sensor since the pipe diameter of the sensor then is reduced. However, this can easily be accounted for when the thickness of the scale layer is known. 5.3 Frequency response of salinity antenna with scale Figure 10 below shows the measured loss in scale layer 1-6 for the longest signal path on the salinity probe.
Figure 10: Frequency response of 3-pin antenna with scale level 1-6

31st North Sea Flow Measurement Workshop Norway, October 2013
10
Scale level 5 and 6 are covering the entire antennas and area between the antennas. Scale level 6 has in addition a thick level of scale above the antennas such that the total thickness is approximately 5 mm. The x-axis is the signal frequency (MHz) and along the y-axis is the measured power attenuation (dBm). As seen from the figure above, the salinity probe behaves slightly different compared to the single-pin antenna. For the thin layers, the impact is marginal. For the thickest scale layer (layer 6), there is a distinct reduction in the measured loss. The single-pin antennas transmit energy into the entire pipe’s cross- and longitudinal section, hence the permittivity impact of scale is proportional to the total volume fraction of scale in the pipe cross-section. This causes a small left shift in the responses with scale for the single pin antennas when scale is added. For the 3-pin probe, there is a local effect of scale since scale is covering both the antennas and the material in-between the antennas. The combination of scale on antennas and scale in the medium in-between the antennas cause a reduction in the measured loss (i.e. more efficient signal transfer between the antennas). The reason for the loss reduction is caused by an increased coupling efficiency of the antennas into the scale medium compared to when the sensor is filled with air/gas. Based on the test performed in the laboratory, it appears that a scale layer of 5 mm is required in order to be reliably detected by the 3-pin antenna. Reducing the length of the antennas will most likely enable the meter to detect thinner layers of scale. Scale levels less than 5 mm seems to have virtually no effect on the measured response with the 3-pin antenna. However, reducing the length of the antennas, or even making the antennas flush with the pipe wall, will most likely enable the meter to detect thinner layers of scale if this would be required by a field installation. 6 TEST RESULTS WITH SCALE FROM A FIELD INSTALLATION 6.1 Investigation of scale layer in the meter Figure 10 below shows a picture of the layer on the meter returned from Gullfaks A vs. a clean meter.
Figure 11: Picture of Gullfaks A meter with scale vs a clean meter
From figure 11 above it is seen that the scale is evenly distributed across the entire section of the meter, and it looks like the meter has been “spray-coated” with a scale layer inside.

31st North Sea Flow Measurement Workshop Norway, October 2013
11
Figure 12 below shows two pictures of the 3-pin antenna. All three antennas and the area between the antennas are covered with scale in a similar way as the scale which was created artificially in the laboratory. However, the scale layer in the Gullfaks A meter was much more evenly distributed and significantly harder (less porous) compared to the scale created artificially in the lab.
Figure 12: Picture of 3-pin antenna in Gullfaks A meter with scale The thickness of the scale layer was measured at 11 locations along the meter as shown in figure 13 below.
1.5
1.6
1.7
1.8
1.9
2.0
2.1
2.2
2.3
2.4
2.5
1 00 2 00 3 00 4 00 5 00 6 00 7 00 8 00 9 00 10 00 11 00 12 00 13 00 14 00 15 00
Scale thickness [m
m]
Figure 13: Measurement of the scale thickness at 11 different locations
From figure 13 above it is seen that the scale layer was slightly thicker in the throat of the venturi (2.4 mm) compared to the scale layer upstream and downstream the throat (2.0 - 2.2 mm). Table 1 below shows the average thickness in the upstream section, throat and downstream section of the venturi.

31st North Sea Flow Measurement Workshop Norway, October 2013
12
Location Average scale thickness [mm]
Upstream venturi throat 2.2 mm Venturi throat 2.4 mm
Downstream venturi throat 2.0 mm Average 2.2 mm
Table 1: Measurement of the scale thickness
The measurements shows that for any practical purposes one can assume that the thickness of the scale level is evenly distributed in the entire sensor with an average thickness of 2.2 mm (within ±0.2 mm of the average value). Figure 14 below shows a picture of the dP tapping for the venturi. From the picture it is seen that the hole has been rounded off by the scale and that the scale layer also extend into the channel which leads to the differential pressure transmitter of the venturi.
Figure 14: Pictures of the antennas inside the sensor
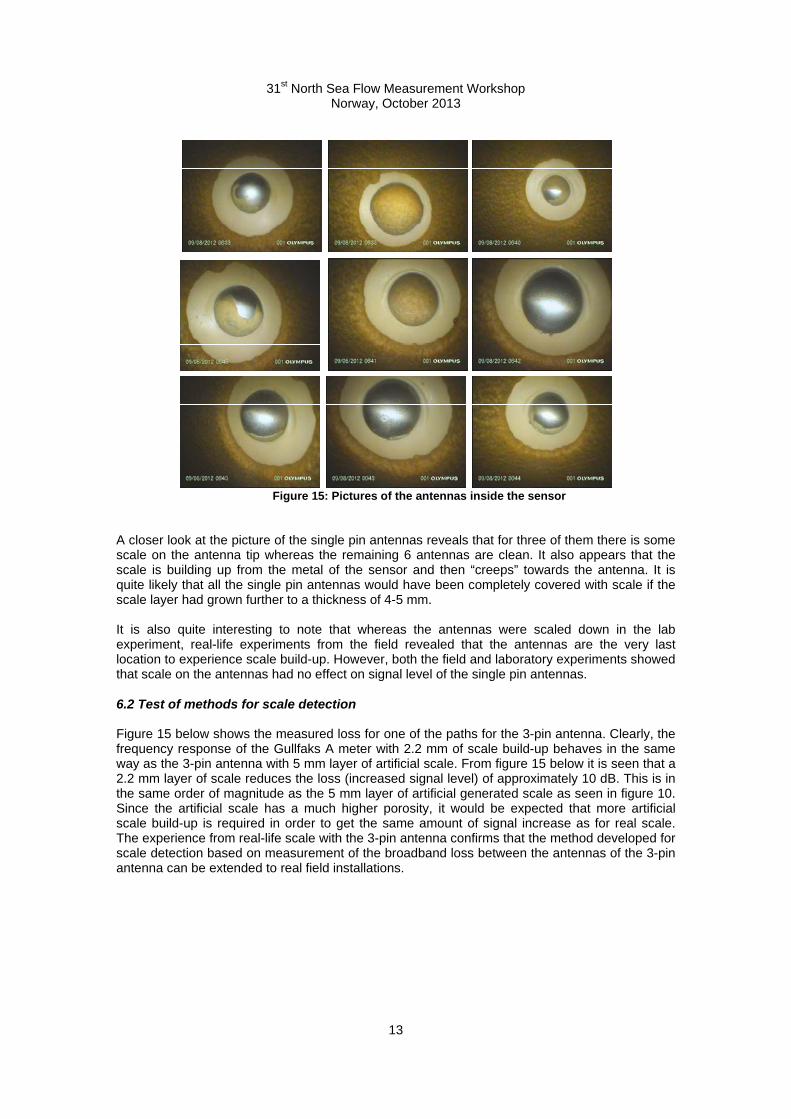
Figure 15 below shows detailed pictures of the nine 3D BroadBand single pin antennas. From figure 15 below it is seen that there are virtually no scale build-up on the antennas and the PEEK insulator for the antenna.
31st North Sea Flow Measurement Workshop Norway, October 2013
13
Figure 15: Pictures of the antennas inside the sensor
A closer look at the picture of the single pin antennas reveals that for three of them there is some scale on the antenna tip whereas the remaining 6 antennas are clean. It also appears that the scale is building up from the metal of the sensor and then “creeps” towards the antenna. It is quite likely that all the single pin antennas would have been completely covered with scale if the scale layer had grown further to a thickness of 4-5 mm. It is also quite interesting to note that whereas the antennas were scaled down in the lab experiment, real-life experiments from the field revealed that the antennas are the very last location to experience scale build-up. However, both the field and laboratory experiments showed that scale on the antennas had no effect on signal level of the single pin antennas. 6.2 Test of methods for scale detection Figure 15 below shows the measured loss for one of the paths for the 3-pin antenna. Clearly, the frequency response of the Gullfaks A meter with 2.2 mm of scale build-up behaves in the same way as the 3-pin antenna with 5 mm layer of artificial scale. From figure 15 below it is seen that a 2.2 mm layer of scale reduces the loss (increased signal level) of approximately 10 dB. This is in the same order of magnitude as the 5 mm layer of artificial generated scale as seen in figure 10. Since the artificial scale has a much higher porosity, it would be expected that more artificial scale build-up is required in order to get the same amount of signal increase as for real scale. The experience from real-life scale with the 3-pin antenna confirms that the method developed for scale detection based on measurement of the broadband loss between the antennas of the 3-pin antenna can be extended to real field installations.

31st North Sea Flow Measurement Workshop Norway, October 2013
14
0 500 1000 1500 2000 2500 3000 3500-100
-90
-80
-70
-60
-50
-40
Frequency [Mhz]
Loss
[dB
]
2 mm of Scale
Clean Sensor
Figure 16: Measured loss, 3-pin antenna of the Gullfaks A meter
Based on experiments with the sensor containing real scale from a field installation, the following methods for detecting scale have been identified. Use of 3-pin antenna during in-situ gas periods
The MPM meter automatically detects periods with pure gas in the meter based on the patented DropletCount® function [17]. When pure gas is detected, a frequency response of the 3-pin antenna is stored and compared towards factory value. Scale on the pipe wall will reduce the loss between the antennas (e.g. increase the signal coupling between the antennas) compared to the factory value. Field tests has shown that this method is able to detect a scale layer of 2 mm. Smaller scale layer may also be detectable, however further tests is required to confirm this. The method can be extended to detect smaller levels than 2 mm by shortening the antennas of the 3-pin probe.
Comparison of measured gas density from gamma meter vs. PVT calculated value
This method is also based on the function for automatic detection of pure gas. During these periods, the gamma densitometer is used to measure the density of the gas which then is compared to the PVT calculated value. If the gamma densitometer measures a significantly higher gas density compared to the PVT calculated value, this could be caused by scale formation on the pipe wall. This method can also be used to confirm the scale measurement obtained by the 3-pin antenna.
Check of Bradband WLR measurement for water filled sensor
Gas dominant wells (e.g. wetgas wells and wells with high GVF) frequently have periods where there is pure gas in the multiphase meter. This may happen during normal operation in connection with slug flow or in connection with shut downs and start ups of the wells. For wells with high WLR (e.g. water flooded wells), the multiphase flow is dominated by water and for these wells is quite common to experience longer periods where the
31st North Sea Flow Measurement Workshop Norway, October 2013
15
multiphase meter is filled with no gas and even pure water for shorter periods. This typically occurs during shut down or starts up of the wells. The 3D Broadband system of the MPM meter is a high-speed electro-magnetic multi-frequency technique for measuring the water/liquid ratio, the water salinity and the liquid/gas distribution within the pipe cross section, as illustrated in Figure 2. The meter has capability for performing measurements in up to 28 different measurement directions (paths) in the meter at many simultaneous measurement frequencies. For water continuous flow conditions, typically 10-15 of these measurement directions are used. When the sensor is filled with pure liquid (e.g. water), there is no annular concentration of gas in the meter and hence all the measurement directions should measure the same WLR with a gas fraction of 0%. Test with the scaled meter from Gullfaks A, revealed that all the measurement directions, apart from the directions where all the signal paths are in the cross section of the pipe, is very tolerant to scale build up. The three measurement directions where the all signal path is in the cross section were measuring a significantly lower WLR for a water filled sensor compared to all the other measurement directions. Hence, it is possible to detect scale build-up on the pipe wall by comparing the three cross sectional measurement directions with all the other 7-12 measurement directions for water continuous conditions with no gas in the pipe. Scale build up will cause the three cross sectional measurement directions to calculate a significantly lower WLR compared to all the 7-13 other measurement directions. If scale is detected, the cross sectional measurement directions can easily be disabled in the software of the meter. This configuration change would slightly increase the measurement uncertainty of the meter for some conditions, but on the other hand, make the measurements from meter less influenced by scale build up.
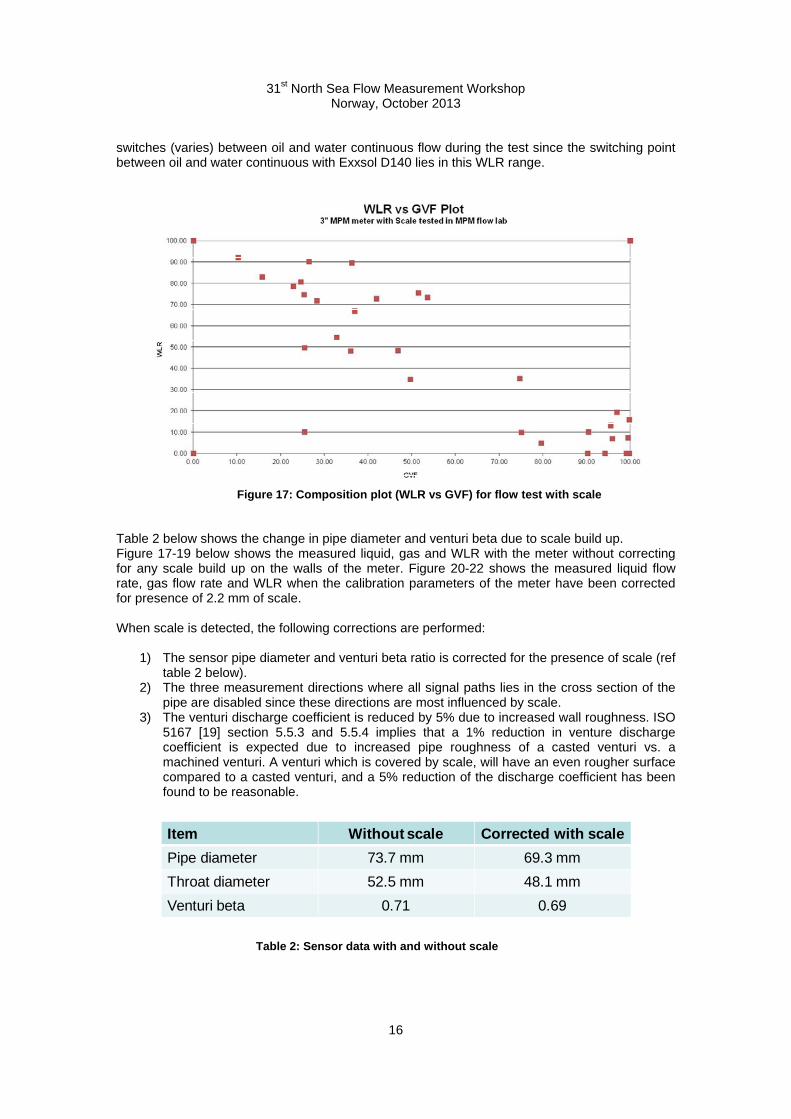
Three independent methods for scale detection has been identified and tested, which means that the operator can be reasonable well assured that scale build up in the meter is present before any expensive operational procedures are executed in order to rectify the situation. If there is scale build up in the multiphase meter, it is also quite likely that there is scale in other parts of the well and production system which may lead to expensive clean-up operations. It is therefore important that any scale alarm issued by the meter can be verified with several independent methods. 7 FLOW TEST OF THE METER WITH SCALE The meter which was returned from Gullfaks A with 2.2 mm of scale, was flow tested with the same test matrix as was used during the FAT of the meter in 2006. This test matrix is representative for the flow rates of the Gullfaks A platform wells. The flow test was performed in the MPM flow loop at an average operating pressure of 8 barg. Since this is a low pressure test, larger variation on the measurements is expected compared to high pressure conditions, particularly for the gas measurement. This is also reflected in the uncertainty specification for the MPM meter which is valid for pressures above 20 barg. For lower pressures, the uncertainty is quoted on a case by case basis. A total of 44 test points was performed, covering both oil and water continuous flow conditions with a GVF and WLR range for 0 – 100%. Exxsol D140 was used as oil and salt water (NaCl) with a salinity of 3.5 % (typical sea water conditions). Figure 16 below shows the composition map for the flow test with scale. All the test points with WLR above 40% are most of the time water continuous whereas all the test points below 40 % WLR are most of the time oil continuous. Some of the test points in the 30-50% WLR range
31st North Sea Flow Measurement Workshop Norway, October 2013
16
switches (varies) between oil and water continuous flow during the test since the switching point between oil and water continuous with Exxsol D140 lies in this WLR range.
Figure 17: Composition plot (WLR vs GVF) for flow test with scale
Table 2 below shows the change in pipe diameter and venturi beta due to scale build up. Figure 17-19 below shows the measured liquid, gas and WLR with the meter without correcting for any scale build up on the walls of the meter. Figure 20-22 shows the measured liquid flow rate, gas flow rate and WLR when the calibration parameters of the meter have been corrected for presence of 2.2 mm of scale. When scale is detected, the following corrections are performed:
1) The sensor pipe diameter and venturi beta ratio is corrected for the presence of scale (ref table 2 below).
2) The three measurement directions where all signal paths lies in the cross section of the pipe are disabled since these directions are most influenced by scale.
3) The venturi discharge coefficient is reduced by 5% due to increased wall roughness. ISO 5167 [19] section 5.5.3 and 5.5.4 implies that a 1% reduction in venture discharge coefficient is expected due to increased pipe roughness of a casted venturi vs. a machined venturi. A venturi which is covered by scale, will have an even rougher surface compared to a casted venturi, and a 5% reduction of the discharge coefficient has been found to be reasonable.
Item Without scale Corrected with scale
Pipe diameter 73.7 mm 69.3 mm
Throat diameter 52.5 mm 48.1 mm
Venturi beta 0.71 0.69
Table 2: Sensor data with and without scale

31st North Sea Flow Measurement Workshop Norway, October 2013
17
Figure 17 below shows the uncorrected measured liquid flow rate with a scale layer of 2.2 mm. There is a consistent positive difference between the liquid flow rate of the multiphase meter and flow loop reference of approximately 30% over the entire GVF range.
Figure 18: Measured liquid flow rate with 2.2 mm scale (uncorrected) Figure 19 below shows the uncorrected measured gas flow rate with a scale layer of 2.2 mm. At low GVF there is a positive difference of approximately 30% between the measured gas flow rate of the multiphase meter and at high GVF (above 80%), there is a negative difference of approximately 30%. For pure gas, there is a positive difference of approximately 20%. Some of the difference is also caused by the low operating pressure in combination with low venturi dP. At higher operating pressures, the scatter in the gas measurement would have been far less since the flow then has a stronger kinetic energy such that the impact of the friction loss due to the rough scale surface is mitigated.
31st North Sea Flow Measurement Workshop Norway, October 2013
18
Figure 19: Measured gas flow rate with 2.2 mm scale (uncorrected)
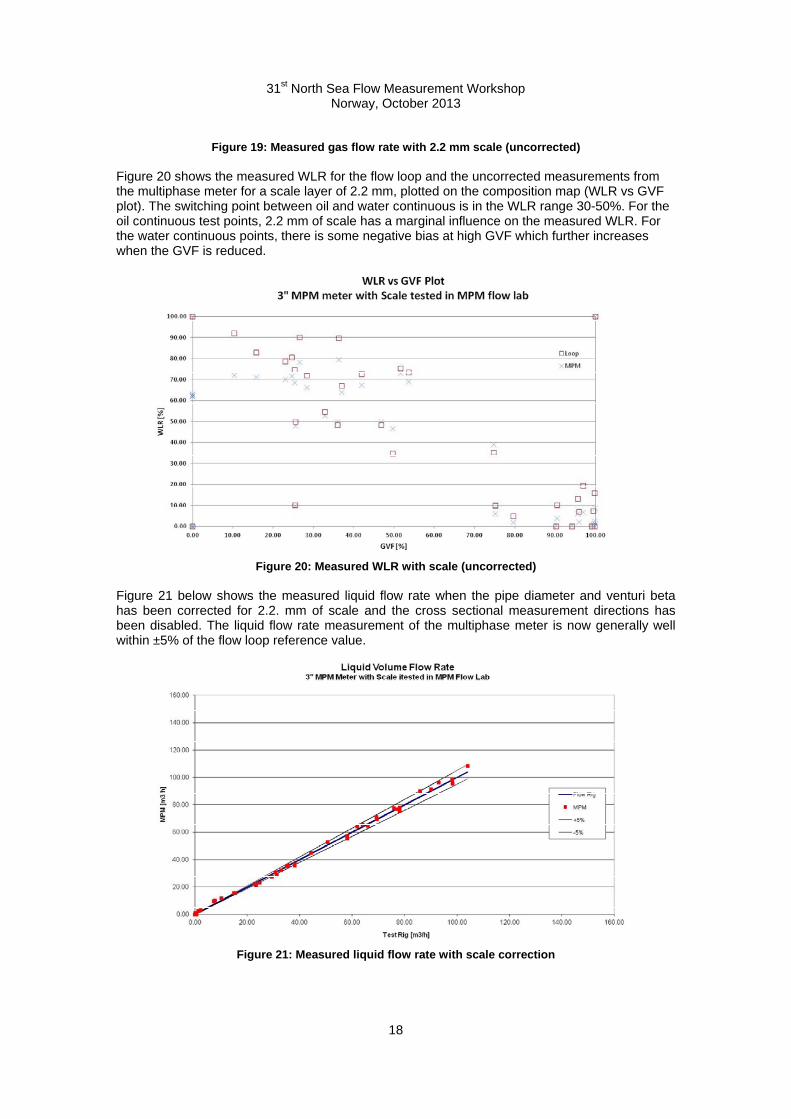
Figure 20 shows the measured WLR for the flow loop and the uncorrected measurements from the multiphase meter for a scale layer of 2.2 mm, plotted on the composition map (WLR vs GVF plot). The switching point between oil and water continuous is in the WLR range 30-50%. For the oil continuous test points, 2.2 mm of scale has a marginal influence on the measured WLR. For the water continuous points, there is some negative bias at high GVF which further increases when the GVF is reduced.
Figure 20: Measured WLR with scale (uncorrected)
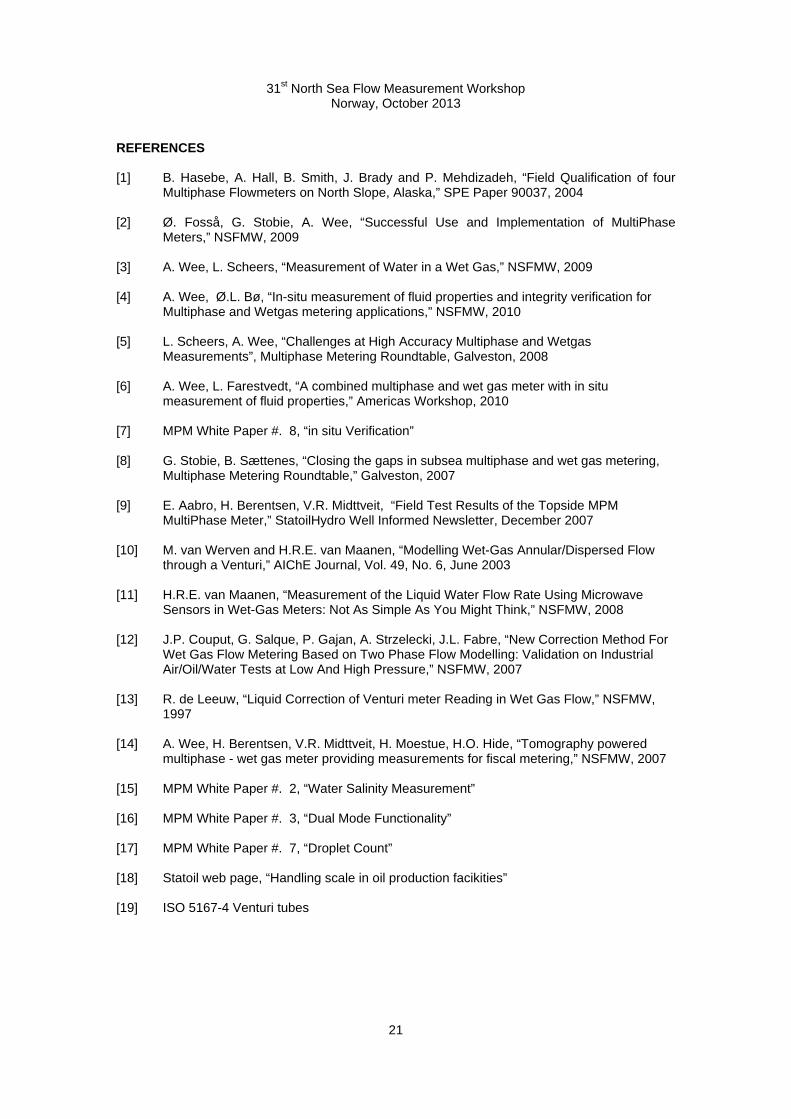
Figure 21 below shows the measured liquid flow rate when the pipe diameter and venturi beta has been corrected for 2.2. mm of scale and the cross sectional measurement directions has been disabled. The liquid flow rate measurement of the multiphase meter is now generally well within ±5% of the flow loop reference value.
Figure 21: Measured liquid flow rate with scale correction

31st North Sea Flow Measurement Workshop Norway, October 2013
19
Figure 22 below shows the measured gas flow rate when the pipe diameter and venturi beta has been corrected for 2.2. mm of scale and the cross sectional measurement directions has been disabled. At medium GVFs, the gas flow rate of the multiphase meter is within 10% of the reference. For pure gas, the gas flow rate of the multiphase meter is within ± 5% of the reference value. For low and high GVFs, the gas flow rate of the multiphase meter is within ± 20% of the reference value.
Figure 22: Measured gas flow rate with scale correction Figure 23 below shows the measured WLR when the pipe diameter, venturi beta has been corrected for 2.2. mm of scale and the cross sectional measurement directions has been disabled. Apart from a few test points in the switching area between oil and water continuous flow, the difference between the WLR of the multiphase meter and flow loop reference value is within a few percent [abs]. For wetgas conditions, the impact on the measured WLR is slightly larger, which is also due to the low operating pressure of the flow loop. At higher operating pressures, the difference would have been smaller.
Figure 23: Measured WLR with scale correction

31st North Sea Flow Measurement Workshop Norway, October 2013
20
11 SUMMARY AND CONCLUSIONS Based on the work conducted in close co-operation with leading oil companies, a method for detection of scale build up in a MPM meter has been developed, verified and patented. Testing has demonstrated that the MPM meter is very tolerant towards scale build up and the new functionality enables the meter to easily correct the flow rate measurement for presence of scale on the pipe wall. The MPM meter, with scale inside, can then be used on a continuous basis while the operator initiates actions to clean the meter or to prevent further build-up of scale in the meter. On a more detail level, the conclusions of the work performed are as follows:
The MPM meter works well with scale inside the meter when the meter calibration is corrected for scale build up.
The 3D Broadband single pin antennas are very tolerant to scale build up. No signal degradation was observed neither in the laboratory scale experiments nor in the field scale data.
3D Broadband measurement performed by the salinity probe can be used to detect scale build up, and determine the thickness of the scale layer.
Results from laboratory experiments with artificial scale agree reasonable well with the test experiments performed with real scale from a field installation. Scale from the field is easier to detect compared to artificial scale generated in the lab.
Several methods for detecting scale have been tested and verified. A combination of methods for scale detection provides a high degree of confidence in the scale detection functionality.
12 ACKNOWLEDGEMENTS The authors want to thank the participants of the In-Situ verification JIP projects (ConocoPhillips, Dong, ENI, GdF, Petronas, PDO, Shell, Statoil, Total and Woodside) for their technical and financial support, the Gullfaks A operation for allowing us to use the meter for scale experiments and finally the Norwegian Research Council / Demo 2000 for sponsoring the projects.
31st North Sea Flow Measurement Workshop Norway, October 2013
21
REFERENCES [1] B. Hasebe, A. Hall, B. Smith, J. Brady and P. Mehdizadeh, “Field Qualification of four
Multiphase Flowmeters on North Slope, Alaska,” SPE Paper 90037, 2004 [2] Ø. Fosså, G. Stobie, A. Wee, “Successful Use and Implementation of MultiPhase
Meters,” NSFMW, 2009 [3] A. Wee, L. Scheers, “Measurement of Water in a Wet Gas,” NSFMW, 2009 [4] A. Wee, Ø.L. Bø, “In-situ measurement of fluid properties and integrity verification for
Multiphase and Wetgas metering applications,” NSFMW, 2010 [5] L. Scheers, A. Wee, “Challenges at High Accuracy Multiphase and Wetgas
Measurements”, Multiphase Metering Roundtable, Galveston, 2008 [6] A. Wee, L. Farestvedt, “A combined multiphase and wet gas meter with in situ
measurement of fluid properties,” Americas Workshop, 2010
[7] MPM White Paper #. 8, “in situ Verification” [8] G. Stobie, B. Sættenes, “Closing the gaps in subsea multiphase and wet gas metering,
Multiphase Metering Roundtable,” Galveston, 2007
[9] E. Aabro, H. Berentsen, V.R. Midttveit, “Field Test Results of the Topside MPM MultiPhase Meter,” StatoilHydro Well Informed Newsletter, December 2007
[10] M. van Werven and H.R.E. van Maanen, “Modelling Wet-Gas Annular/Dispersed Flow through a Venturi,” AIChE Journal, Vol. 49, No. 6, June 2003
[11] H.R.E. van Maanen, “Measurement of the Liquid Water Flow Rate Using Microwave
Sensors in Wet-Gas Meters: Not As Simple As You Might Think,” NSFMW, 2008 [12] J.P. Couput, G. Salque, P. Gajan, A. Strzelecki, J.L. Fabre, “New Correction Method For
Wet Gas Flow Metering Based on Two Phase Flow Modelling: Validation on Industrial Air/Oil/Water Tests at Low And High Pressure,” NSFMW, 2007
[13] R. de Leeuw, “Liquid Correction of Venturi meter Reading in Wet Gas Flow,” NSFMW,
1997 [14] A. Wee, H. Berentsen, V.R. Midttveit, H. Moestue, H.O. Hide, “Tomography powered
multiphase - wet gas meter providing measurements for fiscal metering,” NSFMW, 2007 [15] MPM White Paper #. 2, “Water Salinity Measurement” [16] MPM White Paper #. 3, “Dual Mode Functionality” [17] MPM White Paper #. 7, “Droplet Count” [18] Statoil web page, “Handling scale in oil production facikities” [19] ISO 5167-4 Venturi tubes