multinational production networks and the new geo-economic ... · multinational production networks...
TRANSCRIPT

Multinational Production Networks and the New Geo-economic Division of Labour in the Pacific Rim
Prema-chandra Athukorala
Research School of Pacific and Asian Studies
Australian National University [email protected]
Abstract: This paper examines the implications of international fragmentation of production for trade patterns in the Pacific Rim, with special emphasis on regional and global integration of countries in East Asia. The analysis reveals that the degree of dependence of East Asia on this new global division labour is much larger compared to the other countries in the Pacific Rim and Europe. Network- related trade in parts and components has certainly strengthened intra-regional economic interdependence among the East Asian countries, but this has not lessoned the dependence of growth dynamism of these countries on the global economy. The operation of cross-border production networks depends inexorably on trade in final goods with North America and the European Union. The paper also probes the challenges posed by the fragmentation-based international division of labour for the ‘flying geese’ approach to the analysis of growth patterns in East Asia.
JEL classification: F15, F23, O53
Key words: production fragmentation, multinational production networks, economic
transition in China

1
Multinational Production Networks and the New Geo-economic Division of Labour in the Pacific Rim∗
International fragmentation of production, the splitting of production process into discrete
activities which are then allocated across countries, has been an increasingly important
facet of economic globalization over the past three decades. With a modest start in
electronics and clothing industries in the late 1960s, multinational production networks
have gradually evolved and spread into many industries such as sport footwear, automobile,
televisions and radio receivers, sewing machines, office equipment, power and machine
tools, cameras and watches, and printing and publishing. At the formative stage, the
process involved locating small fragments of the production process in a low cost country
and reimporting the assembled components to be incorporated in the final product. Over
time, production networks have begun to encompass many countries which are engaged in
the assembly process at different stages, resulting in multiple-border crossing of product
fragments before getting incorporated in the final product. Recent years have witnessed
two other important developments in the process, setting the stage for rapid expansion in
the share of fragmenta ion-based trade in world trade. First, some fragments of the
production process in certain industries have become ‘standard fragments’ which can be
effectively used in a number of products.1 Second, as international networks of parts and
comments supply became firmly rooted, producers in advanced countries have begun to
move final assembly of an increasing range of consumer durables (for example, computers,
cameras, TV sets and motor cars) to overseas locations in order to be physically closer to
their final users and/or to take advantage of cheap labour.
The expansion of fragmentation-based international exchange has been
underpinned by three mutually reinforcing developments. First, rapid advancements in
production technology have enabled the industry to slice up the value chain into finer,
‘portable’, components. Second, technological innovations in communication and
transportation have shrunk the distance that once separated the world’s nations, and
improved speed, efficiency and economy of coordinating geographically dispersed
production process. This has facilitated establishment of ‘services links’ to combine
various fragments of the production process in a timely and cost efficient manner. Third,

2
liberalisation policy reforms in both home and host countries have considerably removed
barriers to trade and investment (Jones 2000, Jones and Kierzkowski 2001).
Conventionally, international fragmentation of production took the form of a
multinational enterprise (MNE) building a subsidiary abroad to perform some of the
functions that it once did at home. Thus there was a close relationship between foreign
direct investment (FDI) and trade in parts and components (henceforth referred to as
‘fragmentation-based trade’ within vertically integrated manufacturing industries
(Helleiner 1989). However, in recent years, fragmentation practices have begun to spread
beyond the domain of MNEs. As production operations in host countries have become
firmly rooted, MNE subsidiaries have begun to subcontract some activities to local (host-
country) firms to which they provide detailed specifications and even fragments of their
own technology. At the same time, many firms which are not parts of MNE networks have
begun to procure components globally through arm’s-length trade. Moreover, many MNEs
in electronics and related industries have begun to rely increasingly on independent contract
manufacturers for the operation of their global-scale production networks⎯a process that
has been facilitated by the standardization of some components and advances in modular
technology (Sturgeon 2003, Brown and Linden 2005). These new developments imply that
increase in fragmentation-based trade may or may not be accompanied by an increase in the
host-country stock of FDI (Brown, Deardoff and Stern 2004, p.305).
There is a sizable literature which points to the growing importance of
fragmentation-based specialisation for economic growth and structural transformation in
countries in the Pacific Rim.2 It is clearly evident that while growth in fragmentation-
based trade is now a global phenomenon, it is far more important and growing rapidly in
the Pacific Rim, particularly in East Asia, than elsewhere in the world. However, the
implications of this new form of international specialisation for economic transformation
for individual countries in the region and regional economic integration have not yet been
systematically examined. The literature on these issues is by and large based on the
traditional notion of horizontal specialisation scenario in which countries trade goods that
are produced from start to finish in just one country. In a context where fragmentation
trade is growing rapidly, this conventional approach can lead to misleading inferences as to
the nature and extent of trade integration among countries, for two reasons. First, the total
amount of recorded trade could be a multiple of the actual value of final goods, goods-in-

3
process cross multiple international borders before getting embodied in the final product.
Second, and perhaps more importantly, intra/extra regional patterns of fragmentation trade
and trade in related final goods (‘final trade’) are unlikely to follow the same geographic
patterns, and hence trade shares calculated using reported data can lead to wrong inferences
as to the relative importance of the ‘region’ and the rest of the world for growth dynamism
of a given country/region.
The purpose of this paper is to examine the extent, trends and patterns of
international production fragmentation and its implications for trade patterns in the Pacific
Rim, with special emphasis on regional and global integration of countries in East Asia.
Particular emphasis will be placed on the implications of China’s evolving role in the
process of international fragmentation of production for trade patterns in the region. The
analysis is based on a systematic separation of fragmentation trade from total trade flows
using a new data set extracted from the UN trade database. The Pacific Rim experience is
examined in the wider global context, focussing specifically on the comparative
experiences of the North American Free Trade Asia (NAFTA) and the European Union
(EU).
The paper is organised as follows. The next section discusses the procedure
followed in extracting data from the UN trade data tapes and data quality. The following
section examines the nature and extent of fragmentation trade and the role of Pacific Rim
countries in this new global division of labour. The subsequent sections deals in turn with
the growing importance of fragmentation-based specialisation for intra-regional trade and
forging new supply-side complementariness among countries in the region, with emphasis
on the emerging role of China in regional production networks; the implications of the
rapid expansion of fragmentation-based trade for intra- versus extra-regional trade patterns;
challenges posed by the fragmentation-based international division of labour for the
conventional changing comparative advantage (‘flying geese’) approach to the analysis of
growth patterns in the region. The final section presents the key policy inferences.

4
Data
The data for this paper are compiled over the period from 1992 to 2004 from the UN
Comtrade database based on the Revision 3 of the Standard International Trade
Classification (SITC, Rev 3). The year 1992 was selected as the starting point because by
this time countries accounting for over 95 per cent of total world manufacturing trade had
adopted the revised data reporting system. The analysis ends in 2004, the most recent year
for which data are available for all reporting countries.
In its original form (SITC, Rev 1), the UN trade data reporting system did not
provide for separating parts and components from final manufactured goods. The SITC
Revision 2 introduced in the late 1970s (and implemented by most countries only in the
early 1980s) adopted a more detailed commodity classification, which provided for
separation of parts and components within the machinery and transport sector (SITC 7).
There were, however, considerable overlap between some advanced-stage assembly
activities and related final goods within the sector in the Revision 2, which made it difficult
to separate fragmentation trade from total trade (Ng and Yeats 2001) 3 . Revision 3
introduced in the mid-1980s marked a significant improvement over Revision 2. In
addition to redressing overlaps within SITC 7, this new version of SITC provided for
separation of parts and components trade in the ‘miscellaneous goods’ sector (SITC 8).
These two sectors together accounted for around 70% of total world manufacturing trade
(defined as goods belonging to SITC 5 though 8 less SITC 68 (non-ferrous metals)) during
the period under study. The list of parts and components identified at the 5-digit level for
these two sectors, which provides the basis of our empirical analysis. It contains a total of
225 five-digit products—168 products belonging to SITC 7 and 57 belonging to SITC 8. 4
It is important to note that, despite its significant improvement over the previous
version, SITC Revision 3 does not provide for the construction of data series covering the
entire range of fragmentation-based trade. Data reported under SITC 7 do provides a
comprehensive coverage of fragmentation trade. But data for SITC 8 does not seem to
fully capture fragmentation trade within that commodity category. For instance, for some
products such as clothing, furniture, and leather products in which outsourcing is prevalent
(and perhaps has been increasing), some of the related components (e.g., pieces of textile,

5
parts of furniture, parts of leather soles) are presumably recorded under other SITC
categories. Moreover, there is evidence that production fragmentation has been spreading
beyond SITC 7 and 8 to other product categories such as pharmaceutical and chemical
products (falling under SITC 5) and machine tools and various metal products (SITC 6).
Assembly activates in software trade, too, have recorded impressive expansion in recent
years. These are lumped together with ‘special transactions’ under SITC 9. So the
tabulations presented here of the magnitude of fragmentation-based trade are downward
biased. However, the magnitude of the bias is unlikely to be substantial because
fragmentation-based international specialisation is predominantly concentrated in
machinery and transport equipment category (SITC 7) (Yeats 2001, Feenstra 1998).
As regards the country coverage/classification, the term Pacific Rim is used to refer
to the member countries of the Asia Pacific Economic Cooperation (APEC). These include
East Asia, NAFTA, Australia and New Zealand and Peru and Chile.5 East Asia is defined
to include Japan, the newly industrialised economies (NIEs) in North Asia (South Korea,
Taiwan and Hong Kong), China and members of the Association of Southeast Asian
Nations (ASEAN) Free Trade Area (AFTA). Among the AFTA member countries, only
the six largest economies― Indonesia, Malaysia, the Philippines, Thailand, Singapore and
Vietnam― are covered; Brunei, Cambodia, Laos and Myanmar are ignored because of lack
of data.
The data are tabulated using importer records, which are considered to more
appropriate compared to the corresponding exporter records for analysing trade patterns for
a number of reasons (Ng and Yeats 2003, Appendix 1, Feenstra et al 1999 and 2005).
Importer records are admittedly less susceptible to double counting and erroneous
identification of the source/destination country in the presence of entrepot trade compared
to data based on reporting country records (eg. China’s trade through Hong Kong and
Indonesia’s through Singapore). Also, some countries fail to properly report goods shipped
from their own export processing zones. These exports are simply lump these exports into
one highly aggregated category of ‘special transactions’ under SITC 9. While no fully
satisfactory solutions exist for these problems, it is generally believed that data compiled
from importer records are less susceptible to recording errors and reveal the origins and
composition of trade more accurately since there normally are important legal penalties for
incorrectly specifying this information on customs declarations. Among the countries
6
covered in this study, Taiwan is not covered in the UN data system and Vietnam has not yet
begun to make data available according to the standard UN format. Singapore was not
reporting data on its bilateral trade with Indonesia because of political reasons. 6 In these
cases, the data gaps were filled using the corresponding trading partner records.
Trends and Patterns of Product Fragmentation
Table 1 summarises data on the growing importance of trade in parts and components7 in
world manufacturing trade. Value of total world component trade increased from about
$403 billion in 1992 to over 1250 in 2004, at a compound annual rate of 13.6% compared
to a 12.4% growth in total manufacturing exports. The share of components in total world
manufacturing exports increased from 21% to over 26% between these two years.
Components accounted for over a third of the total increment in world manufacturing
exports between these two years.
Table 1 about here
Countries in the Pacific Rim (APEC countries) account for the bulk of world trade
in component trade. Their share in total world exports of components increased from
52.9% in 1992 to 62.3% in 2004. The share of East Asia (including Japan) increased faster
rate, from 29.6% to 43.6% between these two years. This was in spite of a notable decline
in the share of Japan, the dominant economy in the region. The share of developing East
Asia (East Asia excluding Japan) increased from 14% to 31.9%. Within that group, all
reported countries have recorded increases in world market shares. Interestingly, the
significant increase in the relative importance of East Asia in fragmentation trade has taken
placed against the backdrop of a notable decline in the shares of NAFTA and EU.
The degree of dependence of East Asian countries as a group on component trade is
much higher compared to all other regions in the world. In 2004, components accounted
for 33.5% of total manufacturing exports of these countries, 20.9% in EU and 30.7% in
NAFTA and a world average of 26.3%. Within East Asia, countries belonging to AFTA,
in particular Malaysia, Philippine, Singapore and Thailand, stand out for their heavy
7
dependence on product fragmentation for export dynamism. In 2004, components
accounted for 47.8% of total manufacturing exports in AFTA, up from 31.9% in 1992.
The growing importance of China is component trade is particularly noteworthy. It share in
total world exports increased from one per cent in 1992 to nearly 8.3% in 2004. The share
of components in manufacturing exports of china increased from 4.8% to 19% between
these two years. On the import-side, the increase was from 21.5% to 42.1%. The share of
Hong Kong in world component trade has eroded persistently as a result of the dramatic
relocation of manufacturing ventures to the mainland China during this period.
Some observers had predicted that the formation of NAFTA and the integration of
some of the new countries emerged from the former Soviet Union with the rest of the
Europe could adversely affect the developing East Asia’s relative position in world
assembly activities (USITC 1999, Kierzkowski 2001, Kaminski and Ng 2005). In addition
to the anticipated positive impact of significant tariff reduction, proximity to industrial
countries and relatively low wages by regional standard (though not compared to some of
the East Asian countries) are considered as important specific advantages of Mexico (in
penetrating the US market) and the countries in the European periphery (in penetrating the
EU) compared to countries in East Asia. Interestingly, this prediction does not seem to
have materialized. World market share of developing East Asia in fragmentation-based
trade has increased at a much faster rate compared to that of both NAFTA and the EU.
The explanation for the continued pre-eminence of East Asia in component trade
seems to lie in a number of powerful supply-side factors. Despite rapid growth,
manufacturing wages in China and other latecomers to export-oriented industrialisation in
East Asia (Malaysia, Thailand, Viet Nam and the Philippines) still remain lower than or
comparable to those in countries in the European periphery and Mexico. 8 Moreover,
significant differences in wages among the countries within the East Asia region have
provided the basis for rapid expansion of intra-regional product sharing systems, giving rise
to increased cross-border trade in parts and components. Second, the relative factor cost
advantage has been supplemented by a relatively more favourable trade and investment
policy regimes, and better ports and communication systems that facilitate trade by
reducing the cost of maintaining ‘services links’ (Baldwin 2006, Jones et al. 2004,
Athukorala and Yamashita 2005).

8
Third, rapid economic expansion for over three decades in a number of countries in
the region seems to have brought about ‘market thickness’ (the economic depth of trading
nations) which positively impact on the location of outsourcing activity (Grossman and
Helpman 2005). Finally, part of the explanation also seems to lie in economic history, the
early choice of the region (firstly Singapore and subsequently Malaysia and other countries)
by MNEs as a location of outsourcing activities. There is a general tendency for MNE
affiliates to become increasingly embedded in host countries the longer they are present
there and the more conducive the overall investment climate of the host country becomes
over time (Rangan and Lawrence 1999). Also, as firstcomers in this area of international
specialisation, countries in East Asia (particularly Singapore, Korea, Taiwan and Malaysia)
offer considerable agglomeration advantages for companies that are already located there.
Site selection decisions of MNEs operating in assembly activities are strongly influenced
by the presence of other key market players in a given country or neighbouring countries.
Against the backdrop of a long period of successful operation in the region, many MNEs
(particularly US-based MNEs) have significantly upgraded technical activities of their
regional production networks in East Asia and assigned global production responsibilities
to affiliates located in more mature countries (Singapore and Taiwan in particular, and also
Malaysia in recent years) (Borrus et al. 2000; McKendrick, Doner & Haggard 2000).
Production Networks
The discussion is based on data on regional bilateral trade flows reported in Tables 2, 3 and
4. Tables 2 and 3 give data on the geographic profile of manufacturing trade and trade in
parts and components respectively. Reported in Table 4 are percentage shares of parts and
comments in bilateral flows of manufacturing trade. The data reported in these tables
vividly shows the gowning importance of component trade in intraregional trade flows in
the Pacific Rim, particularly among countries in East Asia. Intra-regional trade accounts
for a much larger share in component exports and imports in East Asia compared to the
comparable share in total exports and imports. Moreover, share of components in intra-
regional imports is much larger and has increased at a faster rate in total import compared
to exports, reflecting the greater reliance of the region on the rest of the world as a market
for final goods.

9
Table 2 about here
Table 3 about here
Table 4 about here
Within East Asia, countries in AFTA stand out for the high share of components in
intra-regional trade flows.9 The share of components in total intra-regional exports in
AFTA increased from 98% in 1992 to 92.3% in 2004. On the import side, the increase was
from 75.3% to 84.4%. According to country-level data (not reported here for brevity), the
share of component in manufacturing exports and imports amounted to over four fifths in
Singapore, Malaysia and the Philippines and over two thirds in Thailand. Korea and
Taiwan are also involved in sizable trade in components with the other countries in the
region. East Asia’s intra-regional share of trade in components (both in exports and
imports) of all East Asian countries have increased at a much faster rate (from 48% to
67.4% in exports and from 62.7% to 73.6% in imports) compared that in trade with any
other region (Table 3). The intra-regional share of component trade (both in exports and
imports) is also much larger in Pacific Rim region compared to EU, as an outcome of the
heavy concentration of component trade within East Asia.
As already noted, China, in spite of the late entry into fragmentation-based global
division of labour, has begun to replicate the overall regional patterns.10 The shares of
Chinese imports of total manufacturing coming from East Asia increased from 64.3% in
1992 to 76.2% in 2004 (Table 5). This increase was dominated by components. The
regional share of total Chinese imports of components increased from 30.3% to 77.7%
between these two years. Component accounted for over 90% of the total increment in
Chinese intra-regional manufacturing imports between 1992 and 2004. Japan has
continued to remain the major regional source country, but there has been a notable
diversification of source country composition between 1992 and 2004. The most notably
development is the rapid growth of the combined share of AFTA, from a mere 0.9% in
1992 to 19.3% 2004. Within AFTA, import shares of Malaysia and the Philippines have
increased at a faster rate compared to that of Singapore. By 2004, Malaysia’s share in total
Chinese imports of components stood at 7.9% compared to Singapore’s share of 3.5%.
Import shares of Taiwan and Korea also have increased persistently. However, the share
of Hong Kong has declined persistently as much of manufacturing activities carried out by

10
Hong Kong businesses relocated to Mainland China. Overall, the data clearly suggest that
China’s trade integration through fragmentation trade is not predominantly a phenomenon
limited to Greater China (or the ‘China Circle’, a la Haughton 1997). The procurement
network has rapidly expanded to cover other countries in the region.
Table 5 about here
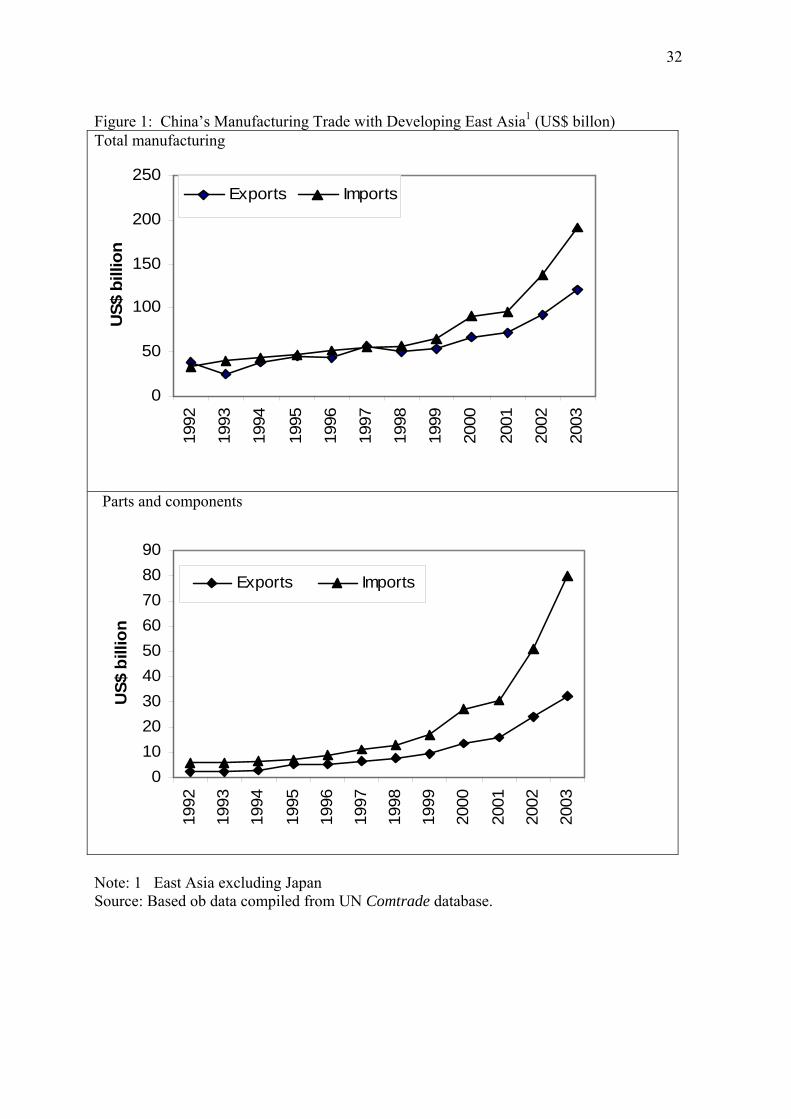
On the exports side, China’s aggregate intra-regional share has declined persistently
in both total manufacturing as well as component exports. Overall, China’s evolving export
patterns exhibit a clear extra-regional bias (the degree of which has increased over the
year), in contrast to greater regional integration on the import side. This difference reflects
the increasingly important role of China as a final product assembler for advanced-country
markets using middle-products procured from the region. For about the mid 1990s, China
has maintained a widening net importing position (trade deficit) with the region (Figure 1).
The prime source of the widening deficit has been increasing reliance on countries in the
region for sourcing parts and component for fuelling booming domestic final good
assembly activities. Net part and component trade with the region increased persistently
from about US$ 2 billion in 1997 to over U$50 billion in 2004.
Figure 1 about here
So far we have examined the growing importance of fragmentation trade for the
emerging economic interdependence among countries in the Pacific Rim, East Asia and the
other subregions. With this background, we now proceed to examine the implications of
this new form of international specialisation for two key themes central to the contemporary
debate on growth dynamism and the process of intra- versus inter-regional economic
integration in East Asia, namely the relative importance of intra-regional versus global
economic integration and catching-up in the growth process of latecomers in the region
through economic globalization.

11
Production Fragmentation and Regional versus Global Economic Integration
There is a vast literature based on the standard trade data analysis (which is essentially
based on the traditional notion of horizontal specialisation scenario in which trade is
essentially an exchange of goods that are produced from start to finish in just one country)
that unequivocally points to a persistent increase in intra-regional trade in East Asia
(including as well as excluding Japan) form about the early 1980s (e.g., Kwan 2001,
Drysdale and Garnaut 1997, Frankel and Wei 1997, Petri 1993, Pearson 1994, Ng and
Yeats 2003). This evidence figures prominently in the current regional debate on forming
regional trading arrangements covering some or all countries in East Asia. In particular, the
proponents of the proposal to expand AFTA to encompass Japan, China and Korea
(‘ASEAN + 3’ proposal) often refer to deepening economic interdependence reflected in
intra-regional trade among these countries as evidence of its likely success (Ng and Yeats
2003, Baldwin 2005). Increasing trade integration is also cited as an indicator of the
potential benefits of monetary integration in the region (Kwan 2001).
The discussion in the previous section on the emerging patterns of intra-regional
component trade however casts doubts on the validity of these inferences. We have noted
two important peculiarities of trade patterns in East Asia compared to total global trade and
trade of EU and NAFTA. First, component trade has played a much more important role in
trade expansion in East Asia relative to the overall global experience and experiences of
countries in other major regions. Second, trade in components accounts for much larger
share in intra-regional trade compared to region’s trade with the rest of the world. Given
these two peculiarities, trade flow analysis based on reported trade data is bound to yield a
misleading picture as to the relative importance of intra-regional trade relations (as against
global trade) in the growth dynamism of East Asia (and AFTA and other subregional
groupings therein). This is because the growth dynamism based on assembly activities
eventually depend on demand for final goods which depends increasingly on extra-regional
growth dynamism.
Alternative estimates of intra-regional trade shares reported in Table 6 help illustrate
this argument. Reported in panel A and B are the interregional trade shares estimated
using data on total (reported) trade and trade in components (which are directly obtained

12
from Tables 4 and 5). Intra-regional shares of ‘net trade’ (that is, total trade minus
components) are reported in panel C.
Table 6 about here
There is no notable difference between the intra-regional trade shares in all
countries in APEC calculated on the basis of data on total or final trade. However, the
alternative estimates are vastly different for East Asia, particularly for developing Asia and
AFTA: Both the level in the two given years and the change over time of intra-regional
trade shares are significantly lower in terms of estimates based on final trade. For instance,
intra-regional share of total trade in developing Asia increased from 58% in 1992 to 65% in
2004. However, in terms of estimates based on final trade, the share increased from 33% to
36%. While the difference between intra-regional shares of final and total trade is
observable for both exports and imports, the magnitude of the difference is much larger on
the export side. In 2004 only 32% of final goods exported from developing Asia found
markets within the region, compared to 40% in total exports. For AFTA the relevant
figures were 20% and 24% respectively. Moreover, for all East Asian countries Japan is a
much smaller market for final goods exports, accounting for less than 10% in all cases in
2003, compared to the USA and the EU. It is also interesting to note that, unlike in the case
of East Asia (or developing East Asia and AFTA), the estimated intra-regional trade share
for NAFTA, the EU and the other regional groupings are remarkably resilient to the
inclusion or exclusion of component trade.
In sum, the estimates presented in this section support our hypothesis that, in a
context where fragmentation based trade in expanding rapidly, the standard trade flows
analysis can lead to misleading inferences regarding the on-going process of economic
integration through trade. When data on assembly trade are excluded from trade flows, our
estimates suggest that extra-regional trade is much more important than intra-regional trade
for continued growth dynamism of East Asia, both including and excluding Japan. Thus,
the ongoing process of product fragmentation seems to have strengthened the case for a
global, rather than a regional, approach to trade and investment policymaking.

13
Production Fragmentation and Growth Patterns: Preliminary Observations
The received view on growth patterns in countries in the Aisia-Pcific region stipulates a
dynamic process of changing comparative advantage, a process in which each country
rapidly shifts its output from raw materials to manufactures, and within manufactures from
labour-intensive to more capital and technology-intensive sectors. This sequential growth
pattern have been described as the ‘flying geese pattern’ of development by the Japanese
economists (Akamatsu 1961, Kojima 2000) and is consistent with the Hecksher-Ohlin
explanations of how trade patterns are likely to change with the accumulation of human and
physical capital (Balassa 1979).
A large number of studies carried out in the 1980s and early 1990s have shown that
the flying geese pattern of sequential growth hold remarkably well in East Asia. 11
Specifically, Japan was found to have begun to compete with the USA in technologically
sophisticated products from about early 1980s, with NIEs following Japan in export
structure with a lag of 15 to 20 years, the economies in Southeast Asia are ten years further
behind, and China trailing the Southeast Asian countries by another few years (Petri, 1993).
This view of orderly, sequential economic transformation has profound implications for
trade and industrial policy. The rapidly changing structure of exports implies competitive
pressure experienced by countries at lower rugs of the ladder, but it also means new export
opportunities for new comers, as countries at higher rugs vacate export markets. For
importing countries, the source of competitive pressure in traditional labour intensive
products would shift. But to the extent that imports from one country merely displace
imports from another, no new domestic resource adjustment cost arise. For instance, the
United State and Japan at the top rungs find themselves in direct competition in
technologically sophisticated products, but the competitive pressure is tolerable because
most of these products create their own markets.
Has this sequential process of economic transformation been disturbed by the on-
going process of production fragmentation? The flying geese pattern of growth is based on
the conventional (product-based) division of labour among economies. It assumes a
competitive, rather than a complementary, relationship among countries in the growth
process, which permits countries to climb the growth ladder on the basis of their own

14
competitiveness achieved though policy reforms. The process of fragmentation-based
international specialisation, which permits firms to relocation of each stage of production
process in places where they can be conducted at lowest cost could well disturb this
sequential process of economic transformation. This process permits firms in countries at
upper rungs of the growth ladder to remain internationally competitive in some segments of
the production process (such as in product/component design, production of skill- and
technology-intensive components, and various head-quarter functions) even when rising
incomes and the related domestic cost pressure begin to erode their competitiveness in
integrated production of the whole product at home. This, in turn, could constrain the
growth process of countries at the middle rungs, while countries at the lower rungs still
benefit from their relative labour cost advantages. In other words, in face of rapid
expansion of fragmentation-based specialisation in the world economy, countries at the
middle are confronted with an increasingly challenging task of finding ways to ‘tech up’
and enter the global knowledge economy, so as to escape the trap of having to dumb down
to compete in standardised manufacturing (and, increasingly standardised services) (Garrett
2004).
The implications of growing complementarity of production processes across
countries resulting from production fragmentation for latecomers in catching up in the
growth process is an important subject for further research. Recent studies which have
done some useful ground-clearing work in this direction include Lall and Albaladejo
(2004), Rodrik (2006) and Schott (2006). The primary focus of these studies is on the
implications of China’s rise as a major trading nation for the global economy, but the
findings have important general implications for the subject at hand.
Lall and Albaladejo (2004) examine changing technological sophistication of
Chinese exports from a comparative regional perspective by disaggregating export data on
the basis of a commodity classification that reflects factor intensity properties of end
products. Rodrik (2006) undertakes a comparative analysis of the sophistication of the
export profile of China relative to its income level based on a newly constructed index that
measures the productivity level associated with a country’s export basket. Schott (2006)
examines the relative sophistication of Chian’s exports to the USA by comparing China’s
export bundle and prices (unit values) within broader product categories to those of the

15
relatively skill- and capital-abundant members of the OECD as well as to similarly
endowed US trading partners.
The findings of Rodrik (2006) and Lal and Albaladejo (2004) suggest that, within a
period of about one-and-a-half decades, China has ended up with an export basket that is
significantly more sophisticated than what would be normally indicated for a country at its
income level. Put differently, taken at face value these results seem to suggest that the
complementarity in specialisation patterns dictated by the ongoing process of product-
fragmentation-based specialisation does not seem to have created an unsurmountable
constraint for China’s economic transition. These authors combine their findings with
some (selective) impressionistic accounts of China’s industrial policy to suggest that
China’s activist policy has played a pivotal role in China’s export success by nurturing
domestic capabilities in consumer electronics and other advanced product lines.
The findings of these studies, however, need to be treated with caution because the
authors have failed to take into account the on-going process of product fragmentation in
the analysis. This is a serious limitation because, although the end products of electronics,
electrical items, automobile and other related products belonging to medium and high-tech
products categories are obviously capital/technology intensive, assembly activities within
the production process (both component assembly and final assembly) are generally low-
tech and highly labour intensive. In other words, the mere fact that a given country is
exporting final goods (end products) in a highly fragmented high-tech industry does not
necessarily imply the domestic production of those goods. Therefore the classification of
final commodities by factor intensity is not the same as the classification of the production
process occurring in these countries by factor intensity. Put simply, any analysis of
technology structure of exports (as in Lall and Albaladejo 2004) or technological
sophistication of products (Rodrik 2006) based on the readily-available data on total
(reported) trade data is likely to come up with an exaggerated picture of the technological
sophistication of China’s exports.
Over the past ten years China’s export composition has undergone a dramatic shift
away from the conventional labour intensive product lines and towards more sophisticated
ones (Table 7). For instance, between 1994/5 and 2003/4 the share of miscellaneous
manufactured products (SITC 8) (consisting predominantly of clothing, footwear, toys and

16
sport good, and other labour intensive products) declined from 55.6% to 37.4%. This was
mirrored in an increase in the share of machinery and transport equipment (SITC 7)
(consisting predominantly of various capital- and technology- intensive product) from
24.7% to 46.3%. This increase was underpinned by China’s highly-publicized export
success in a wide range of electronics and electrical products (falling under SITC 75, 76
and 77). However, data on the relative importance of parts and components in machinery
and transport equipment trade (reported in Panels B, C and D in the table) clearly suggest
that, the role of Chinese firms (most of which are subsidiaries of MNEs) in the global
production chain of these products mostly limited to final assembly. China’s total imports
of machinery and transport equipment are dominated my parts and components. The share
of parts and components accounted for 62% of total imports of this product category in
2003/4, up from 40.3% in 1994/5. By contrast final goods (total exports minus parts and
components still accounts from two thirds of total export (65% in 2003/4). Trade balance
in machinery and transport equipment increased from -9.7% of exports to over 35% in
2003/4. This was the outcome of a dramatic increase in the trade surplus in final goods,
while trade deficit in parts and components widened from -8.3% to -15.1%. Given the fact
that production of parts and component is generally more capital- and technology-intensive
compared to final assembly, the basic message conveyed by these figures is that China’s
export success has so far been underpinned by and large by its comparative advantage in
international production arising from labour abundance rather than increased sophistication
of the export mix.12
Table 7 about here
This inference is consistent with the findings of Schott (2005) who examines the
relative ‘sophistication’ of China’s exports to the United States during the period fom 1972
to 2001. By comparing China’s export bundle to that of the relatively skill- and capital-
abundant members of the OECD as well as to similarly endowed US trading partners Schott
(2005) finds that China’s export bundle increasingly overlaps with that of more developed
countries, rendering it more sophisticated compared to that of the other countries with
similar factor endowments. By contrast, his comparison of prices (unit values) within
product categories reveals that China’s exports ‘sell at a substantial discount relative to its
level of GDP and the exports of the OECD countries’ (p. 15). Schott stops short of probing
this rather puzzling contrast between the observed product sophistication and price trends,
17
but it is certainly consistent with the nature of China’s participation in fragmentation-based
specialisation in global manufacturing trade. China is engaged in labour intensive stages
of production (mostly final assembly) in otherwise advanced industries.
Concluding Remarks
There is clear evidence that the fragmentation-based specialisation has become an integral
part of the economic landscape of East Asia. Trade in components has been expanding
more rapidly than conventional final-good trade. The degree of dependence on this new
form of international specialisation is proportionately larger in East Asia compared to North
America and Europe. This seems to have been the outcome of the relatively more
favourable policy setting for international production, agglomeration benefits arising from
the early entry into this new form of specialisation, and considerable inter-country wage
differential in the region.
A notable recent development in international fragmentation of production in the
region has been the rapid integration of China into the regional production networks. This
development is an important counterpoint to the popular belief that China’s global
integration would crowd out other countries’ opportunities for international specialization.
The estimates presented in this paper support our hypothesis that, in a context where
fragmentation based trade in expanding rapidly, the standard trade flows analysis can lead
to an understatement of the trading significance of China in the process of economic
integration through trade. China’s imports of components from East Asia have grown
rapidly, in line with rapid expansion of manufacturing exports mostly to North America and
the European Union.
Production fragmentation has certainly played a pivotal role in continuing
dynamism of the East Asian economies and increasing intra-regional economic
interdependence. This does not, however, mean that the process has contributed to
lessoning the regions dependence on the global economy. The high intra-regional trade
shares reported in recent studies largely reflect rapidly expanding intra-regional trade in
components. There is no evidence of rapid intra-regional trade integration in terms of final
products. In fact, the region’s growth dynamism based on vertical specialisation depends

18
inexorably on its extra-regional trade in final good, and this dependence has in fact
increased over the years. The growing importance of China both as a regional exporter and
importer has begun to change the picture in recent years, but extra-regional trade is likely to
remain the engine of growth of the region in the foreseeable future. Put simply, growing
trade in components has made the East Asia region increasingly reliant on extra-regional
trade for its growth dynamism. In this context, these countries would be better off by
upholding universal principles of economic openness.
Finally, what are the implications of these findings for the contemporary policy
debate on regional economic corporation? In particular, is the new-found fondness in
countries in the region for free trade agreements (FTAs) is consistent with the objective of
maximising gains from the ongoing process of international product fragmentation?
Trade in components and final assembly is postulated to be relatively more sensitive
to tariff changes compared to final trade (or total trade as captured in published trade data)
((Yi 2003). Normally a tariff is incurred each time a good-in-process crosses a border.
Consequently, with one percentage point reduction in tariff, the cost of production of a
vertically-integrated good declines by a multiple of this initial reduction, in contrast to a
one percent decline in the cost of a regular traded good. Moreover, because of tariff
reduction may also make more profitable for goods that were previously produced in
entirely in one country to now become vertically specialised. Consequently, in theory, the
trade stimulating effect of FTA would be higher for parts and component trade than for
normal trade, other things remaining unchanged. However, in reality, much would depend
on the nature of ‘rules or origin’(ROOs) built into FTAs (Garnaut 2003). Trade distorting
effects of ROOs are presumably more detrimental to fragmentation-based trade than for
conventional final good trade, because of the inherent difficulties involved in defining the
‘product’ for giving duty exception and the transaction costs associated the bureaucratic
supervision of the amount of value added in production coming from various sources.
Moreover, maintaining barriers to trade against non-members (while allowing free trade
among members) can thwart ‘natural’ expansion of fragmentation trade across countries.
Thus, in terms of benefiting from the new opportunities for trade expansion through
the fragmentation-based division of labour, the ideal (first best) policy choice appears to be
multilateral liberalisation through the WTO process; the ongoing process of product

19
fragmentation seems to have strengthened the case for a global, rather than a regional,
approach to trade and investment policymaking. The APEC-wide approach to regional
trade liberalization, with a firm commitment to open regionalism, remains the only second
best strategy. Our findings do not lend support to the case recently put forward by Baldwin
(2006) for a ‘New East Asia Regional management Effort’ with a reinforced ASEAN+3,
with a view to ensuring smooth functioning of the process of fragmentation-based
specialisation (which he bubs ‘Factory Asia’). Baldwin has correctly identified the
importance of fragmentation-based specialisation for economic growth in these countries,
but unfortunately he has completely overlooked the important fact that the growth
dynamism based on this new form of specialisation depends inexorably on extra-regional
trade in final good, and this dependence has in fact increased over the years.
Notes ∗ Revised version of a paper presented at the 31st Pacific Trade and Development Conference, Guadalajara, Mexico, 10-12 June 2006. I am grateful to Hadi Soesastro, Dinh Hien Minh, Peter Drysdale, Juan Palacios, Hugh Patrick, other conference participant, and Thee Kean Wee for helpful comments and to Nobuaki Yamashita for able research assistance. 1 Examples include long-lasting cellular batteries originally developed by computer produces and now widely used in cellular phones and electronic organisers; transmitters which are used not only in radios (as originally designed) but also in PCs and missiles; and electronic chips the use of which have spread beyond the computer industry into consumer electronics, motor vehicle production and many other product sectors (Jones 2000; Jones and Kierzkowski 2001a; Brown, Deardroff and Stern 2003). 2 Key contributions to this literature include Borrus 1997, Naughton 1999, McKendrick et al. 2000, Ng and Yeats 2001 and 2003, and Dobson and Chia 1997. 3 For instance ‘television tubes’ were not separable from ‘TVc’ and ‘ computer processors’ were lumped together with ‘computers’. 4 The list is available in Athukorala (2003), Appendix A-5. 5 The terms, Pacific Rim countries and APEC countries are used interchangeably in the remainder of the paper. 6 In 2005 Singapore started releasing data on trade with Indonesia, after being pressured for decades by the Indonesian government.

20
7 Henceforth we used the term ‘components’ in place of ‘parts and components’ for brevity. 8 Average annual compensation (Salary/wage plus other remuneration) per worker (US$) in selected countries: China 1835 (2001), Indonesia 880 (2000), Philippines 2965 (2000), Thailand 3345 (1994), Malaysia 4380 (2000), Vietnam 650 (2000), Taiwan 14420 (1997), Korea 15780 (2000), Singapore 20440 (2000), Poland 2502 (2000), Hungary 2898 (2000), Czech Republic 4150 (1998), Mexico 8050 (2000) (Source: China: China Statistical Press (2003) (average wage for Beijing, Tianjin, Shanhai, Zhejiang, Liaoning and Guangdon); Vietnam, General Statistical Office 2000; other countries: Nicita and Olarreage 2006, Statistical Appendix). 9 Rapid growth of intra-regional fragmentation trade in AFTA countries clearly pre-dates the formation of AFTA in 1994. Whether the formation of AFTA would have provided further impetus for the expansion of this trade remains an unresolved issue that warrants further study. From the inception in the early 1960, this form of international exchange in these countries took place under virtual free-trade conditions as part of the policy emphasis on export-led industrialization. Trade liberalization under AFTA could well have simply substituted for the existing tariff concessions rather that generating new incentives (Athukorala and Yamashita 2006). 10 It is important to note that cross-border production networks in East Asia had already become well-rooted by the time China’s rapid penetration in world manufacturing trade began in the early 1990. This form of new division of labour could have sustained even without China’s entry. 11 Petri 1993, Pearson 1994 and the works cited therein. 12 The data reported in Table 8 (Panel B) do point to a modest increase in the share of parts and components in exports. This share in total export of machinery and transport equipment increased from 26.8% in 1994/5 to 35% in 2000/04. The increased is particularly notable for electrical machinery and parts (from 30.4% to 47%) and road vehicles (from 34.6% to 51.6%). However, it is not possible to interpret these increases as an indication of increase in production sophistication (a shift from labour intensive final assembly to capital- and technology-intensive component production) because parts and components in export records include both domestically ‘designed and produced’ components as well as those simply ‘assembled and/or tested’ . The available evidence on global production chains in electronics components suggest that activities undertaken in China still largely (if not totally) confined to simple assembly and testing (See Brown and Linden 2005 and the works cited therein). Further research into the extent to which China’s involvement in fragmentation-based specialisation has evolved from mere assembly to local production of intermediate skill- and technology intensive products certainly warranted.

21
References Akamatsu, K. (1961), ‘A Theory of Unbalanced Growth in the World Economy’,
Weltwirtschaftliches Archiv, 86, 196-217. Athukorala, Prema-chandra (2003). Product fragmentation and trade patterns in East Asia’.
Trade and Development Discussion Paper 2003/21, Division of Economics, Research School of Pacific and Asian Studies, The Australian National University, Canberra.
Athukorala, Prema-chandra (2005), Component trade and China’s regional economic
integration. In R. Garnaut & L. Song (Eds.), The China boom and its discontents (pp.139-163). Canberra: Asia Pacific Press.
Athukorala, Prema-chandra and Nobuaki Yamashita (2005), ‘Production fragmentation and
Trade Integration: East Asia in a Global Context’, North American Journal of Economics and Finance, 17(4)
Baldwin, Richard (2006), ‘Managing the Noodles Bowl: The Fragility of East Asian
Regionalism’, Centre for Policy Research (CEPR) Discussion Paper 5561, London: CEPR.
Balassa, Bela (1979), ‘Changing Patterns of Comparative Advantage in Manufactured
Goods’, Review of Economics and Statistics, 61(2), 259-266. Borrus, Michael (1997), ‘Left for Dead: Asian Production Networks and the Revival of US
Electronics’, in Barry Naughton (Ed.), The China Circle: Economics and Technology in the PRC, Taiwan and Hong Kong (pp.215-239). Canberra: Brookings Institution Press.
Brown, Clair and Greg Linden (2005), ‘Offshoring in the Semiconductor Industry: A Historical Perspective’, in Lael Brainard and Susan M. Collins (eds), The Brookings Trade Forum 2005: Offshoring White-Collar Work: The Issues and Implications, Washington DC: Brooking Institution Press.
Brown, Drusilla K., Alan V. Deardorff and Robert M. Stern (2004), ‘The Effect of
Multinational Production on Wages and Working Conditions in Developing Countries’, in Robert E. Baldwin and L. Alan Winters (ed.), Challenges of Globalization: Analyzing the Economics, Chicago: University of Chicago Press, 279-332.
China Statistical Press (2003), China Statistical Yearbook 2003, Beijing Cline, William R. (1984), Export of Manufactures from Developing Countries, Washington
DC: Brookings Institution.

22
Drysdale, Peter & Ross Garnaut (1997), “The pacific: an application of a general theory of economic integration’, in C. Fred Bergsten & Mark Noland (Eds.), Pacific dynamism and the international economic system (pp.183-224). Washington DC: Institute for International Economics.
Feenstra, Robert (1998), ‘Integration of Trade and Disintegration of production in the
Global Economy’, Journal of economic Perspectives, 14(4): 31-50. Feenstra, Robert C., Wen Hai, Wing T. Woo and Shuni Uao (1999), ‘Discrepancies in
International Trade Data: An Application to China-Hong Kong Entrepôt Trade’ American Economic Review, May, 338-343.
Feenstra, Robert C., Robert E. Lipsey, Haiyan Deng, Alyson C. Ma and Hengyong Mo
(2005), ‘World Trade Flows, 1962-2000’, National Bureau of Economic Research (NBER) Working Paper 11040, Cambridge, MA: NBER.
(http:/www.nber.org/papers/w11040) Frankel, Jefrey A. and Shang-Jin Wei (1997), ‘The new regionalism and Asia: impact and
policy options’, in Arvind Panagariya, M.G. Quibria & N. Rao (Eds.), The global trading system and developing Asia (pp. 83-130). Oxford: Oxford University Press.
Garnaut, Ross (2003) ‘Australia And Japan: Time To Be Important To Each Other Again’,
Address to the Australia-Japan Business Cooperation Committee conference, Kyoto, 5 October 2003, Division of Economics, Research School of Pacific and Asian Studies, Australian National University (mimeo)
Garrett, Geoffrey (2004), ‘Globalization’s Missing Middle’, Foreign Affairs,
November/December, 1-6. Grossman, Gene. M. & E. Helpman (2005). Outsourcing in a global economy. Review of
Economic Studies, 72 (1), 135-159. Helleiner, Gerald K. (1989) ‘Transnational Corporations and Direct Foreign investment’ in
Hollis Chenery and T.N. Srinivasan (eds.) Handbook of Development Economics, Volume 2, Amsterdam; North Holland, pp. 1142-1480.
Jones, Ronald W. (2000). Globalization and the theory of input trade. Cambridge, Mass.:
MIT Press. Jones, R. W. & H. Kierzkowski, H. (2001). Globalization and the consequences of
international fragmentation. In R. Dornbusch, G. Calvo & M. Obstfeld (Eds.), Money, factor mobility and trade: the festschrift in honor of Robert A. Mundell (pp. 365-381). Cambridge, Mass.: MIT Press.
Jones, Ronald W., Henryk Kierzkowski and C. Lurong, C. (2004). What does the evidence
tell us about fragmentation and outsourcing. International Review of Economics and Finance, 14 (3), 305-316.

23
Kaminski, Bartlomiej and Francis Ng (2005), ‘Production Disintegration and Integration of Central Europe into Global markets’, International Review of Economics and Finance, 14, 377-390.
Kwan, C.H. (2001). Yen bloc: toward economic integration in Asia. Washington DC:
Brookings Institution Press. Kierzkowski, Henryk (2001), ‘Joining the global economy: experience and prospects of the
transition economies’, in Seven.W. Arndt & Henryk Kierzkowski (Eds.), Fragmentation: new production patterns in the world economy (pp. 231-253). Oxford: Oxford University Press.
Kojima, Kiyoshi (2000), ‘The ‘Flying geese’ model of Aisn Economic Development:
Origin, Theoretical Extensions, and Regional Policy Implications’, Journal of Asian Economics, 11(4), 375-401.
Krugman, P. (1995). Growing world trade: causes and consequences. Brooking Papers on
Economic Activity, 25th Anniversary Issue, 327-377. Lall Sanjaya and Manuel Albaladejo (2004), ‘China’s Competitive Performance: A Threat
to East Asian Manufactured Exports?’, World Development, 32(9), 1441-1466. McKendrick, David G., Richard F. Doner and Stephen Haggard (2000), From Silicon
Valley to Singapore: location and competitive advantage in the hard disk drive industry. Stanford, Cal: Stanford University Press.
Ng, Francis & Alexander Yeats (2001), Production sharing in East Asia: who does what
for whom, and why? In L. K. Cheng & H. Kierzkowski (Eds.), Global production and trade in East Asia (pp. 63-109). Boston: Kluwer Academic Publishers.
Ng, Francis & Alexander Yeats (2003), Major trade trends in East Asia: what are their
implications for regional cooperation and growth? Policy Research Working paper 3084, Washington DC: World Bank.
Nicita, Alessandro and Marcelo Olarreaga (2006), ‘Trade, Production and Protection 1976-
2004’, Washington DC: World Bank (www.worldbank.org) Pearson, Charles S. (1994), ‘The Asian Export Ladder’, in Shu-Chin Yang (ed.),
Manufactured Exports of Asian Industrializing Economies: Possible Regional Cooperation, New York: M.E. Sharpe, 35-52.
Petri, Peter (1993). The East Asian trading block: an analytical history. In J. A. Frankel &
M. Kahler (Eds.), Regionalism and rivalry: Japan and the United State in Pacific Asia (pp. 21-48). Chicago: Chicago University Press.
Rodrik, Dani (2006), What’s so Special about China’s Exports?’, National Bureau of
Economic Research (NBER) Working Paper 11947, Cambridge MA: NBER.

24
Schott, Peter K. (2006), ‘The Relative Sophistication of Chinese Exports’, National Bureau of Economic Research (NBER) Working paper 12173, Cambridge, MA: NBER (http:/www.nber.org/papers/w12173)
Rangan, S. & Lawrence, R. (1999). A prism on globalization. Washington DC: Brookings
Institution Press. Tung, An-Chi (2003), ‘Beyond Flying Geese: The Expansion of East Asia’s Electronics
Trade’, German Economic Review, 4(1), 35-51. USITC (United State International Trade Commission) (1999). Production Sharing: Use of
U.S. Components and Material in Foreign Assembly Operations, 1995-1998. USITC Publication 3265, Washington DC: USITC.
Vietnam General Statical Office (2000), Analysing the Results of the Industrial Survey of Vietnam –
1999, Hanoi: Statistical Publishing House Yi, Kei-Mu (2003), ‘Can vertical specialization explain the growth of world trade’,.
Journal of Political Economy, 111 (1), 52-102.

25
Table 1: World Trade in Parts and Components, 1992-2003 (%) Exports Imports Country/regional
Composition Share in total
manufacturing exports
Country/regional Composition
Share in total manufacturing
imports Country/Region 1992 2004 1992 2004 1992 2004 1992 2004 APEC 52.9 62.3 25.8 32.5 43.2 57.6 25.9 33.0 East Asia 29.6 43.6 23.3 33.5 18.9 35.3 25.2 39.7 Japan 15.6 11.7 28.9 37.5 3.8 3.9 21.1 28.7 Developing East Asia 14.0 31.9 19.1 32.2 15.1 31.5 26.5 41.7 China 1.0 8.3 4.8 18.8 2.5 9.8 21.6 42.1 Hong Kong SAR 2.1 1.1 21.1 32.9 2.2 5.5 14.9 38.6 Taiwan 3.2 6.2 22.2 46.3 2.0 3.2 32.6 38.8 Korea, RP 1.9 4.9 19.7 35.6 1.4 3.0 27.0 36.3 AFTA 5.9 11.6 31.9 47.8 7.1 10.0 36.2 46.4 Indonesia 0.1 0.3 2.6 14.2 0.5 0.6 20.0 28.1 Philippines 0.5 2.3 34.1 74.8 0.5 1.4 33.0 55.9 Malaysia 2.0 4.3 38.3 58.1 1.6 3.0 42.8 58.1 Singapore 2.6 3.1 43.9 53.2 3.4 3.3 43.6 48.3 Thailand 0.7 1.5 21.5 32.6 1.0 1.6 28.3 40.0 Vietnam 0.0 0.1 1.0 6.0 0.0 0.2 7.7 17.8 Oceania 0.2 0.3 13.3 16.5 1.2 0.9 20.1 18.0 Australia 0.2 0.2 14.7 18.3 1.0 0.8 20.3 18.5 New Zealand 0.0 0.0 9.1 11.7 0.2 0.1 19.1 15.6 NAFTA 22.9 18.3 30.4 30.7 22.6 20.8 26.9 26.3 USA 17.4 13.4 30.7 32.3 13.0 14.0 23.2 24.4 Canada 3.6 2.3 28.5 23.9 6.0 3.7 32.4 27.9 Mexico 1.8 2.5 31.2 30.7 3.6 3.2 37.5 36.8 Other APEC 0.0 0.0 5.6 3.8 0.3 0.2 17.0 15.4 Chile 0.0 0.0 7.2 4.5 0.2 0.1 16.6 15.5 Peru 0.0 0.0 2.2 1.9 0.1 0.1 18.3 15.1 European Union 15 41.1 29.0 18.8 20.9 16.0 13.7 7.7 10.2 Other 6.0 8.7 12.4 17.3 40.8 28.8 47.1 38.9 World 100.0 100.0 21.2 26.3 100.0 100.0 21.7 26.2 US$ billion1 403.8 1257.8 386.4 1241.7 Note: 1. By definition percentage shares in exports and imports for a given year should be identical. The minor differences seem to reflect recording errors and differences in merriment arising from the use of CIF price for reporting imports and FOB price for most reporting exports. Source: Compiled from UN Comtrade database.

26
Table 2: Direction of Manufacturing Trade: Total Manufacturing Exports ImportsExporter APEC EA Japan DEA CH AFTA6 NAFTA EU Other APEC EA Japan DEA China AFTA NAFTA EU Other
APEC 1992 69.0 32.6 3.9 28.7 9.8 11.9 36.4 18.0 13.1 80.3 50.0 26.9 23.1 6.5 8.7 30.3 16.8 2.9
2004 75.7 44.4 5.5 38.9 18.6 12.7 31.3 13.9 10.4 83.4 57.0 17.3 39.7 13.7 13.4 26.4 13.8 2.9
East Asia (EA) 1992 70.3 41.7 3.0 38.7 14.5 15.7 28.6 17.2 12.5 80.5 60.7 30.7 30.0 9.9 11.1 19.8 16.5 2.9
2004 76.1 56.3 6.2 50.1 25.6 15.5 19.8 13.9 10.0 85.7 71.2 21.0 50.2 15.3 18.4 14.4 12.4 2.0
Japan 1992 66.1 35.5 --- 35.5 9.2 14.2 30.7 19.4 14.5 74.8 31.7 --- 31.7 4.6 13.2 43.1 21.9 3.3
2004 74.0 49.8 --- 49.8 20.7 15.3 24.3 15.0 11.0 87.1 62.8 --- 62.8 23.6 20.5 24.3 12.5 0.4
Developing 1992 75.2 49.1 6.5 42.5 20.7 17.5 26.1 14.6 10.2 81.3 64.7 34.9 29.8 10.7 10.8 16.6 15.8 2.9
East Asia (DEA) 2004 76.9 58.8 8.6 50.2 27.5 15.6 18.0 13.5 9.6 85.5 72.4 24.0 48.4 14.2 18.1 13.1 12.3 2.2
China (CH) 1992 79.3 63.1 3.3 59.9 45.0 9.2 16.2 11.9 8.8 81.5 71.7 28.6 43.1 24.2 6.2 9.8 15.1 3.4
2004 76.4 57.5 8.2 49.3 33.9 8.7 18.9 14.3 9.3 83.7 76.2 23.0 53.2 16.2 14.7 7.4 13.5 2.8
AFTA6 1992 77.0 47.6 8.4 39.3 7.3 26.8 29.4 15.5 7.5 80.9 63.4 34.3 29.2 3.8 16.7 17.5 16.7 2.4
2004 80.0 63.8 10.2 53.6 15.8 27.9 16.2 12.9 7.1 87.1 69.5 21.5 48.0 11.4 24.2 17.6 11.8 1.1
EU 1992 18.1 7.9 1.3 6.5 2.2 2.8 10.2 62.5 19.5 26.4 15.3 9.6 5.6 1.3 2.1 11.2 67.3 6.3
2004 21.5 10.0 1.3 8.6 4.2 2.8 11.5 51.6 26.9 31.8 21.1 6.5 14.6 6.3 4.2 10.6 58.9 9.3
NAFTA 1992 66.9 18.5 5.2 13.3 2.6 5.9 48.4 19.1 14.0 80.1 39.7 23.3 16.4 3.1 6.5 40.5 17.0 2.9
2004 75.0 20.3 4.1 16.2 4.4 6.9 54.7 13.9 11.1 80.5 38.9 12.5 26.4 11.5 7.0 41.6 15.5 4.0
World 1992 44.4 20.3 2.6 17.7 5.8 7.4 24.1 38.7 16.9 52.9 31.3 17.5 13.9 3.7 5.1 21.5 42.2 5.0
2004 51.4 28.2 3.5 24.7 11.4 8.2 23.2 30.7 17.9 59.8 40.0 12.0 28.0 10.3 8.7 19.8 32.0 8.2
Note: --- Not applicable. Source: Complied from UN Comtrade Database.

27
Table 3: Direction of Manufacturing Trade: Parts and Components Exports Imports
APEC EA Japan DEA GCH AFTA NAFTA EU Other APEC EA Japan DEA CH AFTA NAFTA EU Other
APEC 1992 74.5 36.1 4.9 31.1 8.3 14.3 38.4 16.9 8.6 84.4 51.2 25.8 25.4 5.6 11.1 33.2 13.3 2.3
2004 81.2 54.4 6.1 48.3 22.9 16.1 26.9 12.1 6.7 86.3 61.5 17.5 44.0 11.2 18.0 24.8 11.1 2.6
East Asia (EA) 1992 79.6 48.0 4.1 43.9 12.9 19.8 31.6 15.2 5.1 86.1 62.7 28.8 33.9 9.2 15.0 23.3 12.3 1.6
2004 83.9 67.4 6.8 60.6 31.1 18.8 16.5 11.2 4.8 88.9 73.6 19.7 53.9 13.1 22.6 15.3 9.5 1.6
Japan 1992 77.8 40.3 --- 40.3 6.9 17.2 37.5 17.0 5.2 83.0 33.4 --- 33.4 4.0 13.8 49.6 14.7 2.3
2004 83.3 58.5 --- 58.5 24.3 19.3 24.8 12.9 3.8 90.1 66.4 --- 66.4 19.0 22.1 23.6 9.5 0.4
Developing 1992 81.3 55.1 7.8 47.3 18.5 22.2 26.2 13.6 5.0 86.5 67.0 33.0 34.0 9.9 15.1 19.5 12.0 1.5
East Asia (DEA) 2004 84.1 70.2 9.0 61.2 33.3 18.6 13.9 10.7 5.2 88.8 74.5 22.1 52.3 12.3 22.7 14.3 9.5 1.8
China 1992 86.4 74.2 4.2 70.0 45.4 13.3 12.1 7.9 5.7 85.0 72.0 25.1 46.8 22.4 9.5 13.1 13.2 1.7
2004 86.0 74.4 7.8 66.6 47.3 10.4 11.6 8.8 5.2 88.4 81.0 22.5 58.6 13.6 20.0 7.3 9.3 2.3
AFTA+6 1992 81.5 53.1 9.1 44.0 7.2 30.1 28.4 13.7 4.8 85.9 65.5 31.1 34.3 4.0 21.5 20.4 12.5 1.6
2004 82.8 68.2 9.5 58.7 17.9 29.1 14.5 12.5 4.7 88.5 68.6 20.1 48.6 10.2 26.6 19.9 10.3 1.1
EU 1992 17.3 7.5 1.3 6.2 2.0 2.9 9.8 66.1 16.7 25.5 13.3 7.5 5.8 0.7 2.5 12.2 69.0 5.5
2004 22.4 11.5 1.5 10.1 4.4 3.9 10.9 53.0 24.6 31.6 19.8 5.6 14.2 4.4 5.8 11.8 60.0 7.8
NAFTA 1992 68.2 21.5 6.0 15.5 2.7 7.5 46.6 19.0 12.9 82.7 39.5 22.8 16.7 1.9 7.3 43.2 14.3 3.1
2004 75.5 26.4 4.5 21.9 5.3 10.2 49.1 13.9 10.6 81.7 39.8 13.5 26.3 8.0 9.7 41.9 14.0 4.3
World 1992 48.8 22.9 3.3 19.6 5.1 9.1 25.9 38.5 12.7 55.1 31.0 15.7 15.3 3.0 6.5 24.1 40.7 4.2
2004 58.9 37.2 4.1 33.1 14.9 11.4 21.7 27.8 13.3 64.4 44.2 12.5 31.7 8.5 12.5 20.2 28.8 6.8
Note: --- Not applicable. Source: Complied from UN Comtrade Database.

28
Table 4: Share of Parts and Components in Bilateral Trade Flows (%) Exports Imports
APEC EA Japan DEA GCH AFTA NAFTA EU Other APEC EA Japan DEA GCH AFTA NAFTA EU Other
APEC 1992 49.1 52.2 39.8 55.9 34.9 79.5 47.0 38.6 31.5 52.1 48.2 58.1 39.6 19.9 67.9 57.7 35.4 29.7
2004 57.6 80.5 52.1 87.4 81.3 103.4 39.4 44.1 32.9 63.0 63.5 74.6 59.5 36.3 82.9 62.1 41.5 37.9
East Asia (EA) 1992 51.4 53.2 39.2 55.4 34.1 83.9 49.3 35.1 18.8 54.6 52.5 65.2 44.4 24.5 83.1 60.3 34.6 17.8
2004 68.2 83.9 55.8 89.4 84.5 87.3 40.5 45.4 24.2 70.7 70.1 80.2 67.0 42.2 81.2 73.3 46.4 44.0
Japan 1992 44.8 46.6 --- 46.6 28.8 57.8 43.4 30.9 30.1 65.5 47.7 --- 47.7 17.3 74.2 82.2 27.5 36.6
2004 57.8 70.1 --- 70.1 67.3 80.7 42.4 42.6 34.4 63.8 62.4 --- 62.4 36.7 89.4 67.2 30.2 70.6
Developing 1992 58.4 63.1 51.0 65.9 41.9 65.2 50.5 35.9 22.3 52.4 50.5 59.2 43.7 24.6 85.7 59.6 39.3 17.7
East Asia (DEA) 2004 72.3 89.6 59.1 98.0 91.0 75.3 37.7 46.0 27.4 72.0 70.8 73.2 69.6 45.4 87.3 77.4 51.1 34.8
China 1992 43.7 47.2 51.7 46.9 40.5 58.1 30.1 26.7 25.9 42.6 41.0 35.9 44.3 37.8 62.6 54.3 35.7 20.7
2004 59.8 68.7 50.8 71.7 74.2 63.6 32.6 32.8 29.5 67.2 67.6 62.1 70.0 53.2 86.7 62.6 44.0 51.1
AFTA+6 1992 69.3 75.4 60.0 80.3 58.7 89.1 61.1 40.8 38.5 58.6 59.2 55.5 63.6 41.9 75.3 56.9 36.7 30.9
2004 82.1 84.6 70.4 86.2 71.2 92.3 53.0 66.1 58.0 76.8 73.9 71.7 75.1 60.1 84.4 86.8 58.2 63.2
EU 1992 47.0 50.5 40.1 57.3 38.3 71.1 45.8 41.2 38.4 50.5 44.5 53.6 33.8 12.4 54.0 56.8 35.8 32.7
2004 45.2 68.8 45.2 79.1 60.4 98.2 38.9 42.3 41.0 53.9 50.5 64.5 44.5 26.9 76.5 57.2 37.3 36.2
NAFTA 1992 61.4 60.2 35.0 72.5 66.6 83.2 62.2 53.7 56.7 53.1 44.5 54.3 33.2 12.6 58.6 64.9 47.3 34.8
2004 61.4 82.0 45.7 94.4 87.6 96.1 49.2 53.7 55.2 55.2 53.3 60.6 50.4 31.8 86.0 58.3 46.9 38.5
World 1992 56.0 56.4 41.9 60.5 38.8 85.0 55.7 39.9 40.9 54.8 49.8 58.5 41.7 21.0 70.5 61.8 40.9 31.8
2004 64.0 86.8 55.2 65.2 86.5 78.2 45.6 41.6 41.3 62.0 64.4 73.2 60.8 36.7 99.6 58.0 41.7 43.1
Note: --- Not applicable. Source: Complied from UN Comtrade Database.

29
Table 5: Direction of China’s Manufacturing Trade
1992, 1996 and 2004 (%) Exports Imports 1992 1996 2004 1992 1996 2004 (a) Total manufacturing Japan 9.2 18.2 12.7 20.5 28.7 26.6 Hong Kong 53.1 23.7 18.5 27.9 8.4 4.3 Taiwan 0.6 1.6 2 9.9 17 17.3 Korea, Rep of 1.4 3.5 3.7 3.1 12.1 14.6 AFTA 3.2 5.7 6.2 2.6 5.7 13.7 Indonesia 0.4 0.7 0.8 1.1 0.7 1.0 Malaysia 0.5 0.9 1.4 0.4 1.3 3.9 Philippines 0.2 0.5 0.6 0.1 0.1 2.1 Singapore 1.4 2.4 2.0 0.6 2.0 3.1 Thailand 0.6 0.7 0.8 0.2 0.9 2.3 Vietnam 0.1 0.5 0.5 … … 0.1 Total East Asia 67.6 52.7 43.0 64.3 71.8 76.2 Rest of the world Total 100 100 100 100 100 100 (b) Parts and components Japan 8.6 18.8 11.1 24.2 35.0 25.3 Hong Kong 61.0 22.9 27 5.3 8.6 4.2 Taiwan 1.7 3.7 3.6 5.3 10.4 16.9 Korea, Rep. Of 1.5 5.4 4.3 1.9 7.6 12.2 AFTA 4.8 10.4 11.2 0.9 7.5 19.3 Indonesia 0.7 1.4 0.8 0.0 0.1 0.5 Malaysia 1.0 2.4 3.8 0.1 1.7 7.9 Philippines 0.3 0.7 1.1 0.0 0.3 4.7 Singapore 2.4 5.2 3.9 0.7 4.2 3.5 Thailand 0.5 0.8 1.6 0.1 1.3 2.7 Vietnam 0.1 0.3 0.3 … … … Total East Asia 77.6 61.1 57.2 30.3 69.1 77.7 Other countries Total 100 100 100 100 100 100 Notes: --- Not applicable.… Zero or negligible. Source: Complied from UN Comtrade Database.

30
Table 6: Intra-Regional Trade Shares: Total Manufacturing, Parts and Components, and Final Trade (%), 1992 and 2004 A: Total Manufacturing APEC East
Asia1Developing
East Asia2AFTA NAFTA3 EU4
Exports (X) 1992 69.0 41.7 42.5 26.8 48.4 62.5 2004 75.7 56.3 50.2 27.9 54.7 51.6 Imports (M) 1992 80.3 60.7 29.8 16.7 45.5 67.3 2004 83.4 71.2 48.4 24.2 41.6 58.9 Trade (X+M) 1992 74.2 49.4 35.3 20.6 44.3 64.8 2004 79.4 62.8 49.4 26.1 47.5 52.7 B: Parts and Components Exports(X) 1992 74.5 48.0 47.3 30.1 46.6 66.1 2004 81.2 67.4 61.2 29.1 49.1 53.0 Imports (M) 1992 84.4 62.7 34.0 21.5 43.2 69.8 2004 86.3 73.7 52.3 26.6 41.9 60.0 Trade (X+M) 1992 79.0 54.4 39.8 25.1 44.5 67.5 2004 83.7 70.3 56.8 27.9 45.4 58.2 C: Final goods Exports(X) 1992 63.8 36.7 37.8 22.2 50.6 59.6 2004 68.2 40.4 32.3 24.1 61.8 53.6 Imports (M) 1992 76.6 58.7 25.8 11.6 38.0 65.8 2004 79.4 56.6 40.4 17.6 41.4 56.4 Trade (X+M) 1992 69.7 45.2 30.9 15.3 43.5 62.6 2004 73.5 45.2 35.9 20.8 49.7 54.4 Notes: 1. Including Japan 2. Including AFTA Source: Source: Complied from UN Comtrade Database.

31
Table 7: The structure of manufacturing exports from China Commodity category 1994/52 1999/02 2000/42SITC
code (a) Export composition 5 Chemicals and related products 4.1 3.5 3.56 Manufactured goods classified by material2 15.6 13.1 12.87 Machinery & transport equipment 24.7 35.0 46.371 Power generating machinery 1.1 1.3 1.072 Special industrial machinery 0.5 0.5 0.873 Metalworking machinery 0.2 0.2 0.274 General industrial machinery 1.7 2.1 2.975 Office machines 4.1 9.3 15.576 Telecomm. And sound recording equipment 9.3 9.5 12.777 Electrical machinery and parts 6.8 10.7 11.778 Road vehicles 0.9 1.2 1.379 Other transport equipment 0.2 0.2 0.28 Miscellaneous manufactured goods 55.6 48.4 37.484 Clothing and accessories 20.2 15.4 11.585 Footwear 8.6 6.2 4.1894 Toys, games etc. 9.5 9.4 6.7 Total 100 100 100 (b) Share of parts and components in machinery & transport equipment exports 71 Power generating machinery 15.0 27.9 32.272 Special industrial machinery 23.4 27.5 26.973 Metalworking machinery 19.7 29.2 38.174 General industrial machinery 27.5 35.5 35.875 Office machines 44.3 42.6 35.476 Telecomm. And sound recording equipment 17.4 23.9 22.577 Electrical machinery and parts 30.4 38.7 47.078 Road vehicles 34.6 38.3 51.679 Other transport equipment 16.4 18.4 19.47 Total 26.8 34.7 35.0 (c ) Share of parts and components in machinery & transport equipment imports 71 Power generating machinery 58.7 69.7 68.172 Special industrial machinery 16.9 22.2 20.573 Metalworking machinery 19.2 23.4 23.074 General industrial machinery 26.1 38.9 40.075 Office machines 64.0 63.6 65.376 Telecomm. And sound recording equipment 54.9 72.4 76.577 Electrical machinery and parts 68.6 80.7 84.678 Road vehicles 32.1 55.1 53.179 Other transport equipment 8.0 13.4 13.37 Total 40.3 59.9 62.5 (d) Trade balance in machinery & transport equipment Total trade -9.7 35.8 35.6 Trade in parts and components -8.3 -10.7 -15.1 Trade in final products 2.4 60.6 62.9Note: 1 SITC 6 net of SITC 68 (non-ferrous metals)
2 Tow-year averages. Source: Source: Complied from UN Comtrade Database.
32
Figure 1: China’s Manufacturing Trade with Developing East Asia1 (US$ billon) Total manufacturing
0
50
100
150
200
25019
92
1993
1994
1995
1996
1997
1998
1999
2000
2001
2002
2003
US$
bill
ion
Exports Imports
Parts and components
0102030405060708090
1992
1993
1994
1995
1996
1997
1998
1999
2000
2001
2002
2003
US$
bill
ion
Exports Imports
Note: 1 East Asia excluding Japan Source: Based ob data compiled from UN Comtrade database.