multimode - belspo.be · mun . science for a sustainable development (ssd) final report a...
TRANSCRIPT

A MULTISCALAR AND MULTIAGENT MODELLING FRAMEWORK
FOR ASSESSING SUSTAINABLE FUTURES IN A GLOBALISED
ENVIRONMENT
“MULTIMODE”
L. Acosta-Michlik, B. Henry de Frahan, H. Brucke, K. Hansen,
G. Engelen, I. Uljee, A. Van Herzele, M. Rounsevell, R. White

Transversal Actions
Lilibeth Acosta-Michlik and Bruno Henry de Frahan Henrich Brunke and Kristina Hansen
UCL
Guy Engelen and Inge Uljee
VITO
Ann Van Herzele
VUB
Mark Rounsevell
GEOS
Roger White
MUN
SCIENCE FOR A SUSTAINABLE DEVELOPMENT
(SSD)
FINAL REPORT
A Multiscalar and Multiagent Modelling Framework for
Assessing Sustainable Futures in a Globalised Environment
MULTIMODE
SD/TA/01

D/2011/1191/52
Published in 2011by the Belgian Science Policy
Avenue Louise 231
Louizalaan 231
B-1050 Brussels
Belgium
Tel: +32 (0)2 238 34 11 – Fax: +32 (0)2 230 59 12
http://www.belspo.be
Contact person: Marc Van Heuckelom
+32 (0)2 238 35 55
Neither the Belgian Science Policy nor any person acting on behalf of the Belgian Science Policy
is responsible for the use which might be made of the following information. The authors are
responsible for the content.
No part of this publication may be reproduced, stored in a retrieval system, or transmitted in any
form or by any means, electronic, mechanical, photocopying, recording, or otherwise, without
indicating the reference: L. Acosta-Michlik, B. Henry de Frahan, H. Brunke, K. Hansen,
G. Engelen, I. Uljee, A. Van Herzele, M. Rounsevell, R. White. A Multiscalar and Multiagent
Modelling Framework for Assessing Sustainable Futures in a Globalised Environment
(MULTIMODE). Final Report. Brussels: Belgian Science Policy 2011 – 79 p. (Research
Programme Science for a Sustainable Development)
SD/TA/01 - A Multiscalar and Multiagent Modelling Framework for Assessing Sustainable Futures in a Globalised
Environment - "Multimode"
SSD - Science for a Sustainable Development – Transversal actions 3
TABLE OF CONTENTS List of Figures ........................................................................................................................ 5 1. Project Network ................................................................................................................ 11 2. Summary.......................................................................................................................... 13 3. Context of research .......................................................................................................... 15 4. Objectives ........................................................................................................................ 17 5. MultiMode Framework ...................................................................................................... 19 6. Work Package Models and Results .................................................................................. 21
6.1 WP1: Meta-Model of Policy Options and Scenarios ..................................................... 21 6.1.1 Introduction to WP1 ....................................................................................... 21 6.1.2 Scenarios and storylines ................................................................................ 21
6.2 WP2: Multi-scale Constrained Cellular-Automata Model ............................................... 27 6.2.1 Introduction to WP2 ....................................................................................... 27 6.2.2 Agricultural land use (link to WP3) ................................................................. 28 6.2.3 Implementation of scenarios (link to WP1) ..................................................... 30 6.2.4 The variable-grid activity-based CA land use model ...................................... 39
6.3 WP3: Landscape Scale Agent-Based Model of Decision Rules ................................. 42 6.3.1 Introduction to WP3 ....................................................................................... 42 6.3.2 The agent parameters (link to WP4) .............................................................. 43 6.3.3 Market parameters and scenarios (link to WP1) ............................................ 50 6.3.4 Land use parameters and scenarios (link to WP2) ......................................... 53
6.4 WP4: Stakeholder Dialogue and Feedbacks .............................................................. 57 6.4.1 Introduction to WP4 ....................................................................................... 57 6.4.2 Data collection ............................................................................................... 57 6.4.3 Study 1 – Mobilisation capacity for agri-environmental management ............. 59 6.4.4 Study 2 – Farmers' motivations to participate in AEMs with different degrees of complexity (link to WP3) ..................................................................................... 63
7. Summary of MultiMode sustainability indicators ............................................................... 69 8. Recommendations in terms of support to the decision ..................................................... 71 9. Dissemination of results ................................................................................................... 73 10. Follow-up Committee ..................................................................................................... 75 11. References ..................................................................................................................... 77 ANNEXES ............................................................................................................................ 79


SD/TA/01 - A Multiscalar and Multiagent Modelling Framework for Assessing Sustainable Futures in a Globalised
Environment - "Multimode"
SSD - Science for a Sustainable Development – Transversal actions 5
List of Figures
Figure 1 Flow diagram of Data, Methods and Outputs in each Work Package
Figure 2 Web diagrams illustrating the emphasis of drivers in the four scenarios
Figure 3 Left: The Utilised Agricultural Area (in 1000 ha) in Flanders and Wallonia according to farm holding statistics. Right: The Utilised Agricultural Area in Flanders and Wallonia in km² as represented in the BE-CLC
Figure 4 Projected trend of major agricultural land use classes in the four WP1 scenarios
Figure 5 Top Left: BAU, land use in 2000. Top Right: BAU, land use in 2030
Figure 6 Left: BAU, land use in 2060. For legend, see Figure 5. Right: BAU, Fuzzy Kappa comparison of land use in 2000 and 2060
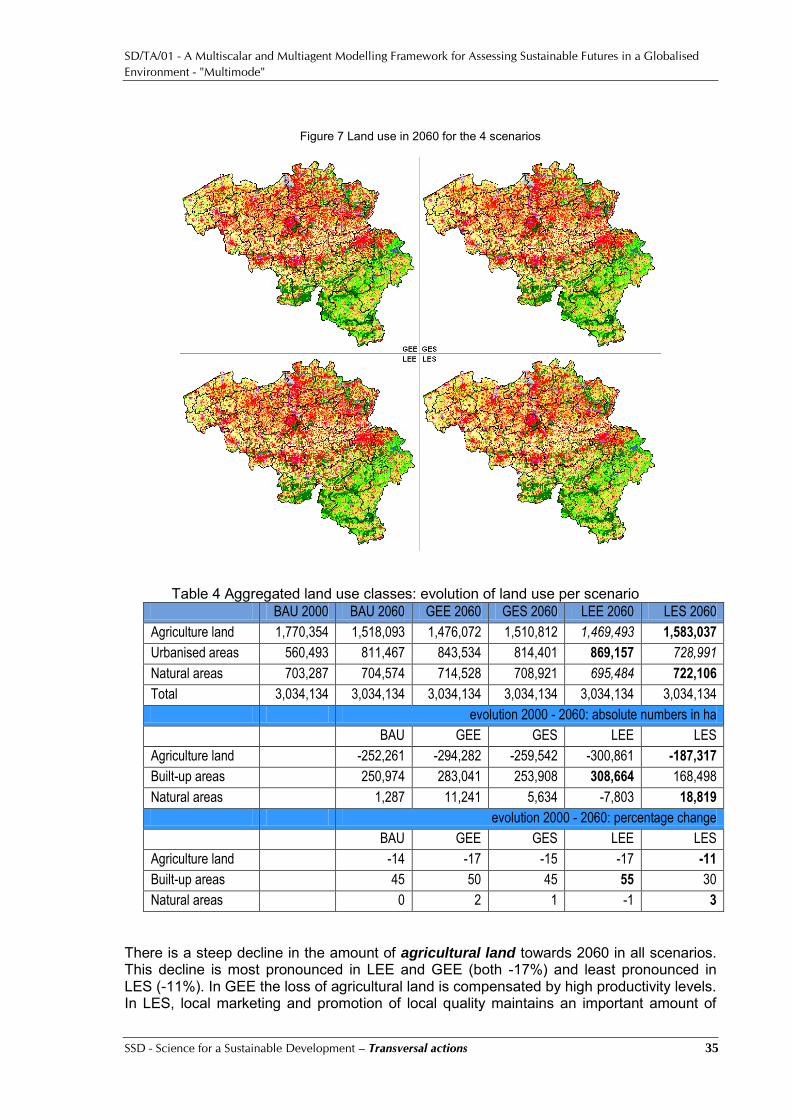
Figure 7 Land use in 2060 for the 4 scenarios
Figure 8 Agricultural land, changes in 2000-2060. In green areas already occupied by the land use in 2000, in red areas no longer occupied by the land use in 2060, in blue new areas occupied by the land use in 2060.
Figure 9 Natural areas, changes in 2000-2060. In green areas already occupied by the land use in 2000, in red areas no longer occupied by the land use in 2060, in blue new areas occupied by the land use in 2060.
Figure 10 Left: Evolution 2000-2060 of ‗Urban pressure on agricultural land‘ (average of all cells) according to 4 scenarios and BAU. Right: Urban pressure on agricultural land in 2000
Figure 11 Urban pressure on agricultural land in 2060 according to the four scenarios
Figure 12 Land use, Belgium. Left, actual land use, 2000; right, simulated land use 2060
Figure 13 Population density, Belgium. Left, actual density, 2000; right, predicted density, 2060
Figure 14 Industrial and Commercial activity, Belgium. Left, actual employment, 2000; right, predicted employment, 2060
Figure 15 Distribution of the farmers into the four clusters of land use decisions
Figure 16 Example of a choice task in the conjoint survey questionnaire
Figure 17 Baseline projections for (a) production and (b) prices of selected crops, 2007-2060
Figure 18 Comparison of (a) production and (b) prices in different scenarios, 2060
Figure 19 Future trends in (a) production and (b) prices of sugar beets in different scenarios
Figure 20 Raster layer of land use in Belgium for the baseline, 2000
Figure 21 Vector layers of (a) 2010 CA-simulated land use and (b) 2007 actual land use
Figure 22 Vector layers of land use for the different scenarios, 2060
Figure 23 Percent changes from 2007 land use to 2060 LES scenario
Figure 24 Conceptual framework for implementation chain
Figure 25 Participation styles: distribution over farmer categories (C1, C2, C3) and respective requirements for AEMs

SD/TA/01 - A Multiscalar and Multiagent Modelling Framework for Assessing Sustainable Futures in a Globalised
Environment - "Multimode"
SSD - Science for a Sustainable Development – Transversal actions 7
List of Tables
Table 1 Trends in the most relevant indicators for each driver in baseline and scenarios
Table 2 Database of the most relevant indicators for CA and ABM models
Table 3 Link between BE-CLC (Belgian Corine Land Cover) classes and STAT (Farm holding census data) classes, and proposed aggregation
Table 4 Aggregated land use classes: evolution of land use per scenario
Table 5 Population and employment in Industry and Services in 2060 per scenario
Table 6 Description of the survey response in the case study regions
Table 7 Comparison of selected farmer and farm characteristics in the different clusters
Table 8 Example of attributes and their levels used for constructing choice tasks
Table 9 Relative importance of the attributes on land use decisions from conjoint analysis
Table 10 Matrix scoring of farmer/farm characteristics and land use decisions
Table 11 Characterisation of the data set for the analysis of AEM motivations
Table 12 Selected national and regional level indicators, percent change 2000-2060
Table 13 Selected farmer level indicators, importance rank for year 2010


SD/TA/01 - A Multiscalar and Multiagent Modelling Framework for Assessing Sustainable Futures in a Globalised
Environment - "Multimode"
SSD - Science for a Sustainable Development – Transversal actions 9
Acronyms and abbreviations
AB-CA – activity-based variable-grid Cellular Automata model
ABM – Agent-based Model
ACCELERATES – Assessing climate change effects on land use and ecosystems, from regional analysis to the European scale
ANT Actor-Network Theory
AEM – Agri-environmental measure
ATEAM – Advanced terrestrial ecosystem analysis and modelling
BAU – Business as usual
BE-CLC – Belgian Corine Land Cover
BELPA – Belgian Paying Agencies
CA Cellular Automata (model)
CCA Constrained Cellular Automata (model)
CAP - Common Agricultural Policy
ECRU – Unité d‘économie rurale
GEE – Global and economic emphasis
GES – Globalised and environmental/social emphasis
GIREA – Groupe Interuniversitaire de Recherches en Ecologie Appliquée (Inter-university Group for Applied Ecology)
GIS – Geographic Information Systems
IPCC – Intergovernmental Panel on Climate Change
LEE – Localised and economic emphasis
LES – Localised and emphasis on social/environment
MultiMode - Multiscalar and Multiagent Model
PRELUDE – Prospective Environmental analysis of Land Use Development in Europe
SBM – Social Behavioural Model
SRES – Special Report on Emissions Scenarios
UCL – Université catholique de Louvain
VITO – Vlaamse Instelling voor Technologisch Onderzoek
VLM - Vlaamse Landmaatschappij (Flemish Land Agency)
VUB – Vrije Universiteit Brussel
WP – Work package
WP1 – Meta-Model of Policy Options and Scenarios
WP2 – Multi-scale Constrained Cellular-Automata Model
WP3 – Landscape Scale Agent-Based Model of Decision Rules
WP4 – Stakeholder Dialogue and Feedbacks

SD/TA/01 - A Multiscalar and Multiagent Modelling Framework for Assessing Sustainable Futures in a Globalised
Environment - "Multimode"
SSD - Science for a Sustainable Development – Transversal actions 11
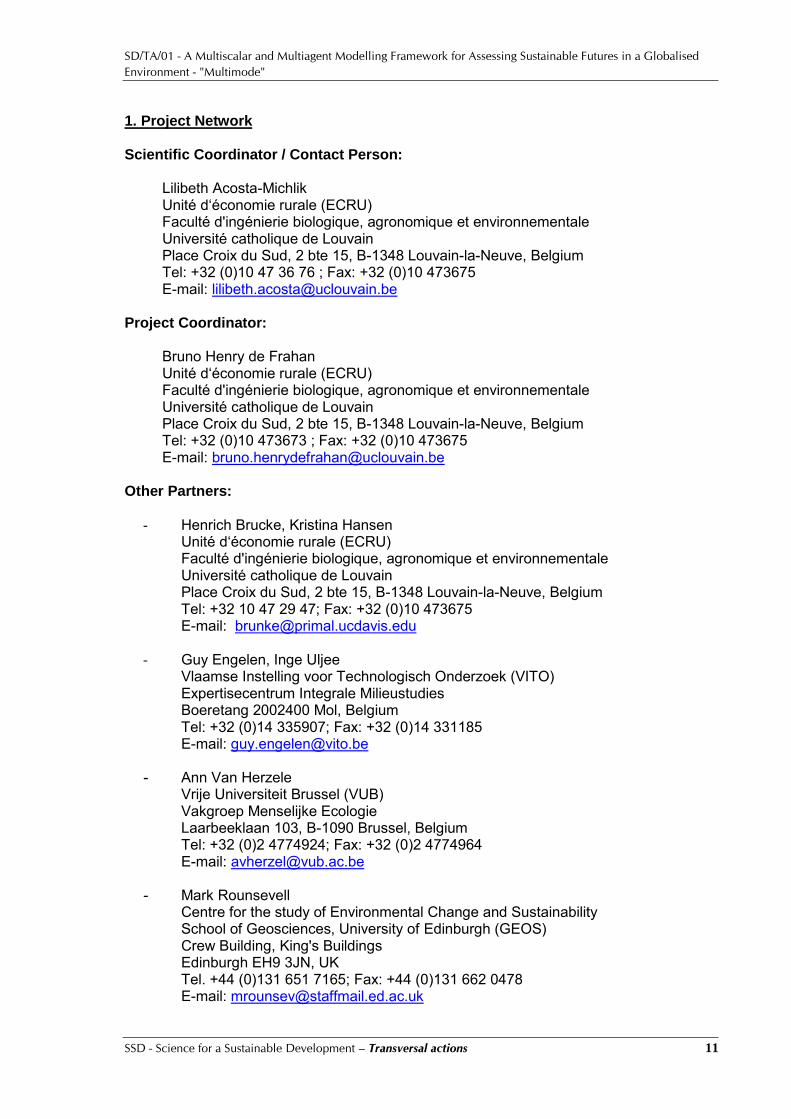
1. Project Network Scientific Coordinator / Contact Person: Lilibeth Acosta-Michlik Unité d‘économie rurale (ECRU) Faculté d'ingénierie biologique, agronomique et environnementale Université catholique de Louvain Place Croix du Sud, 2 bte 15, B-1348 Louvain-la-Neuve, Belgium Tel: +32 (0)10 47 36 76 ; Fax: +32 (0)10 473675 E-mail: [email protected] Project Coordinator:
Bruno Henry de Frahan Unité d‘économie rurale (ECRU) Faculté d'ingénierie biologique, agronomique et environnementale Université catholique de Louvain Place Croix du Sud, 2 bte 15, B-1348 Louvain-la-Neuve, Belgium Tel: +32 (0)10 473673 ; Fax: +32 (0)10 473675 E-mail: [email protected]
Other Partners:
- Henrich Brucke, Kristina Hansen Unité d‘économie rurale (ECRU)
Faculté d'ingénierie biologique, agronomique et environnementale Université catholique de Louvain Place Croix du Sud, 2 bte 15, B-1348 Louvain-la-Neuve, Belgium Tel: +32 10 47 29 47; Fax: +32 (0)10 473675
E-mail: [email protected] - Guy Engelen, Inge Uljee
Vlaamse Instelling voor Technologisch Onderzoek (VITO) Expertisecentrum Integrale Milieustudies Boeretang 2002400 Mol, Belgium Tel: +32 (0)14 335907; Fax: +32 (0)14 331185
E-mail: [email protected]
- Ann Van Herzele Vrije Universiteit Brussel (VUB) Vakgroep Menselijke Ecologie Laarbeeklaan 103, B-1090 Brussel, Belgium Tel: +32 (0)2 4774924; Fax: +32 (0)2 4774964
E-mail: [email protected]
- Mark Rounsevell Centre for the study of Environmental Change and Sustainability School of Geosciences, University of Edinburgh (GEOS) Crew Building, King's Buildings Edinburgh EH9 3JN, UK Tel. +44 (0)131 651 7165; Fax: +44 (0)131 662 0478
E-mail: [email protected]

SD/TA/01 - A Multiscalar and Multiagent Modelling Framework for Assessing Sustainable Futures in a Globalised
Environment - "Multimode"
SSD - Science for a Sustainable Development – Transversal actions 12
- Roger White Memorial University of Newfoundland (MUN) Department of Geography St John's, Nfld A1B 3X9, Canada Tel: +1 (709) 737.8193; Fax: +1 (709) 737.4000
E-mail: [email protected]
SD/TA/01 - A Multiscalar and Multiagent Modelling Framework for Assessing Sustainable Futures in a Globalised
Environment - "Multimode"
SSD - Science for a Sustainable Development – Transversal actions 13
2. Summary
Context With increasingly globalised economies, sustainable development becomes an even greater challenge to both policy and science because new opportunities and unknown risks created by globalisation are unevenly distributed between regions and between people. Policy should be able to provide measures to help different regions and communities benefit from these opportunities and cope with these risks in a sustainable manner, and science should take the challenge to contribute to design such measures. This research project aims to contribute to this challenge by developing an integrated modelling framework. Such framework will be implemented through a multiscalar & multiagent model (MultiMode) in which national impacts of global changes trickle down to the local communities through the adaptive decisions of institutions and agents at the regional, provincial and communal levels. Project description Objectives The overall aim of MultiMode was to promote sustainable development in Belgium in a globalised context through the development of an integrated, multi-scale modelling framework of economic activities and their associated land uses. The modelling framework combined top-down and bottom-up models that address both urban and rural land use. Given the importance in spatial terms of agricultural land use, a specific focus was dedicated on the sustainability of farming practices. Specifically, Multimode aimed to generate multi-scale indicators of social, economic and ecological sustainability by integrating the empirical knowledge generated from different models. Methodology MultiMode has four closely interconnected work packages (WP): a meta-model of policy options and global scenarios (WP1), a multi-scale constrained cellular-automata (CA) model (WP2), a landscape scale agent-based model (ABM) of decision rules (WP3), and stakeholder dialogue and feed-backs (WP4). The policy options and scenarios at the global and European scale from WP1 provide inputs to the CA of the WP2 and ABM of the WP3 as drivers of land use change and socio-economic decision-making processes. The meta-model of WP1 produces look-up tables and/or simple statistical functions of relevant global drivers (e.g., socio-economic, technological, demographic, climatic, etc.). The constrained CA of WP2 generates spatio-temporal changes in the social, economic and natural environment, including land use, at different spatial scales. Results from the CA provide the boundary conditions for the ABM of WP3 by describing the spatial dynamics in the environment of the agents (e.g., farmers). The novelty of the ABM in assessing future sustainability rests in its ability to capture the behaviour of individual decision agents in adapting to the changes in their environment. Its results informed the CA about the impacts of their adaptive decisions on changes in the social, economic and natural environment. The feedback mechanism between the CA and ABM improves their practical use for assessing the indicators of sustainable development. In the ABM, adaptive decisions from agents are represented in social behavioural models (SBM). These SBM were developed from the knowledge elicited through stakeholder dialogue and feedbacks in WP4. Moreover, WP4 provides in-depth analyses of agri-environmental measures (AEMs) at the institutional and farmer levels.

SD/TA/01 - A Multiscalar and Multiagent Modelling Framework for Assessing Sustainable Futures in a Globalised
Environment - "Multimode"
SSD - Science for a Sustainable Development – Transversal actions 14
Main results and deliverables Model analysis and simulation runs WP1 generated scenarios for socio-economic (e.g. population, employment) and farm-
level indicators (e.g. yields, prices) for the period 2000-2060 based on time-series data from 1970s. Four scenarios were identified: Global and economic emphasis (GEE), Globalised and environmental/social emphasis (GES), Localised and economic emphasis (LEE), and Localised and emphasis on social/environment (LES). The values of the indicators were highest for GEE and lowest for the LES scenario.
Using the WP1 socio-economic scenarios, the CA model from the WP2 generated land use change scenarios at different administrative levels. The strongest expansion of the built-up area is observed in LEE (+55%) and the least in LES (30%). The occupation of land by industrial and commercial activities is rather modest in LEE in comparison to the expansion of the built-up area in this scenario. There is a steep decline in the amount of agricultural land towards 2060 in all scenarios. This decline is most pronounced in LEE and GEE (both -17%) and least pronounced in LES (-11%).
The ABM model in WP3 identified four types of farmer typologies including imitative, innovative, conservative, and adaptive. When making land use decisions, the imitative and innovative farmers give more importance on the type of farm activities (45%) and social feedback (11%). Meanwhile, the conservative and adaptive farmers give more importance to the changes in farm income (21%). Based on the land use constraints from the WP2, the largest changes in land use pattern are expected to happen in LES scenario mainly as a response to changes in farm income.
As an extension of the land use analysis in WP3, analysis of agri-environmental measures (AEMs) was carried out in WP4. In addition, two separate studies were conduced. First, Actor-Network analysis was performed to examine the mechanisms by which mobilisation for agri-environmental management proceeds, and by doing so, to develop mobilisation capacity as a concept to be used for evaluating policy implementation in this area. Second, a mixed-method approach was used to examine farmers‘ decision-making in relation to ‗simple‘, ‗medium‘ and ‗complex‘ AEMs. Among others, this resulted in the identification of six styles of AEM participation.
Models and codes A series of documented model runs consisting of time-series sustainability indicators
and maps at the European, national, regional, provincial, communal and farm levels. Validated models including multi-scalar cellular automata model at the national,
regional, provincial and communal levels in Belgium as well as landscape scale agent-based models for the case study areas in the Flemish and Walloon regions.
Publications Working papers with full documentation of the work carried out, the main results, and
recommendations for further analysis. Articles in internationally refereed journals: (1) A. Van Herzele, N. Dendoncker, and L.
Acosta-Michlik, Mobilisation capacity for agri-environmental management, Journal of Environmental Management 92 (2011) 1023-1032; (2) R. White, I. Uljee, and G. Engelen, Integrated Modelling of Population, Employment, and Land Use Change with a Multiple Activity Based Variable Grid Cellular Automaton, International Journal of Geographical Information Science, accepted 2011; (3) A. Van Herzele et al., Effort for money? Farmers‘ response to agri-environment measures with different degrees of complexity, Land Use Policy, submitted 2011; (4) L. Acosta-Michlik et al., Complex social-ecological system modelling of sustainable land use decisions, special issue Regional Environmental Change, in preparation 2011.

SD/TA/01 - A Multiscalar and Multiagent Modelling Framework for Assessing Sustainable Futures in a Globalised
Environment - "Multimode"
SSD - Science for a Sustainable Development – Transversal actions 15
3. Context of research With increasingly globalised economies, sustainable development is becoming an even greater challenge to both science and policy. Globalisation provides new opportunities, but also creates unknown risks and so, global policies must seek to balance economic growth, human development and environmental health to ensure sustainable development. Trade liberalisation and climate change are the most controversial issues on the current global political agenda because of the unequal distribution of benefits and costs. International agreements on trade and climate influence sustainable development because of their direct impacts on the environment through changes in regional consumption, production and land use patterns. However, emerging regional patterns are not only the consequence of the effects of global drivers and regional policies alone, but they are also a manifestation of the adaptive behaviour of individuals and institutions to the impacts of these drivers and policies. People possess cognitive abilities to exhaust or economise social, economic and natural resources to adapt to any changes in the environment. Such that global policies are outcomes of international political compromise, national economic gains are unequally distributed between sectors, between places and between people. Thus, governments develop strategies that will help to balance the negative impacts of globalisation (e.g. urban migration, environmental degradation, etc.) and to promote sustainable development in affected areas and communities. For example, the Common Agricultural Policy (CAP), the European Spatial Development Perspective, and the Water Framework Directive are strategies at the European level that aim to achieve these goals. Hence, sustainable development can be understood as an outcome of the decision-processes of policy-makers and communities alike to adapt to the opportunities created through or risks caused by global drivers and regional policies. In view of these issues, understanding sustainable development requires knowledge of adaptation processes, and the promotion of sustainable development demands appropriate adaptation measures. Policy should be able to provide measures to help local communities adapt in a sustainable manner, and science has the challenging task of informing policy about the future sustainability of these measures. This project aimed to contribute to the fulfilment of this task by developing an integrated modelling framework that can assess, first, the impacts of global processes on social, economic and natural environment in Belgium, and secondly, the effects of decision-processes at different institutional levels (e.g. national, regional, provincial, municipal/communal) in achieving sustainable social, economic and ecologic development of Belgian local communities. The integrated modelling framework generated quantitative and qualitative sustainability indicators (i.e. social, economic and natural resource). Indicators of sustainable development must capture the interaction between human system and the environment because ―if a system is viable in its environment, it will be sustainable‖ (Bossel 1999:26). It is thus important to assess the sustainability of not only the people, but also the spatially and temporally environment on which their existence depends. Moreover, the set of indicators must represent the system‘s structure of hierarchy and subsidiarity (Bossel 1999:22) that reflects responsibility and the means for adapting to the changes in the environment at different levels of administration. In the project, we thus emphasised the assessment of sustainability of not only the total system, but also the nested sub-systems that function within it with some degree of autonomy. The project‘s integrated framework provided a spatio-temporal links between the human system and its social, economic and natural environment, and used an embedded approach for evaluating the changes in the human system‘s environment at different administrative scale. Moreover, it created a synergy between the empirical knowledge derived from various approaches that allowed a more coherent and realistic link between global changes, national impacts and local adaptation over time.

SD/TA/01 - A Multiscalar and Multiagent Modelling Framework for Assessing Sustainable Futures in a Globalised
Environment - "Multimode"
SSD - Science for a Sustainable Development – Transversal actions 17
4. Objectives MultiMode aimed to promote sustainable development in Belgium in a globalised context through the development of an integrated, multi-scale modelling framework of human economic activities and associated land uses. The modelling framework combined top-down and bottom-up models that address both urban and rural land use, but given the importance (in spatial terms) of agricultural land use. The specific research objectives were: to construct sets of narrative storylines based on existing knowledge about global
drivers of environmental change (policy, demographic, economic, climate and technological) and make these global scenarios and policy options readily available for assessment using a meta-model;
to model demographic, economic, environmental (including land use) changes at different embedded spatial scales resulting from global drivers and the adaptation, mitigation or reinforcement measures of planning and policy authorities at each level using a constrained cellular automata model;
to evaluate the adaptive behaviour of land use decision-makers in selected case studies in Belgium using an agent-based model and generate knowledge on adaptation processes to develop state transition rules;
to represent the decision-making processes of land use agents in a social behavioural model and thus generate information for building decision rules for the agent-based model;
to analyse the sustainable practices of farmers in selected communities by using socio-economic assessment procedures and participatory approaches based on stakeholder dialogue;
to test and validate the scenarios, assumptions and results of the models at different scales of analysis by obtaining feedback from stakeholders through meetings with the follow-up committee; and
to generate multi-scale measures (indicators) of social, economic and ecologic sustainability by integrating the empirical knowledge generated from the meta-model, cellular automata, agent-based model, social behavioural model and stakeholder involvement.
To achieve these objectives, a network of 5 expert research groups from Belgium and beyond made up the multi-disciplinary team providing complementary expertise in the fields of natural and human sciences, in particular natural and human ecology, physical and human geography, economics and statistics. It was not the intention of the project to duplicate existing modelling exercises, but to apply existing scenarios, cellular automata and agent-based models and agency-oriented approaches, and to integrate the empirical knowledge generated from them to improve their practical utility. The scenarios, concepts and approaches in Multimode were drawn from interdisciplinary projects, in which the different partners have been involved. Stakeholders were involved at different levels of the analysis throughout the duration of the project to ensure not only a valid synergy between the different concepts used in the integrated framework, but also to identify results that are of practical use for policy and decision making. The operationalisation of the MultiMode integrated approach thus required dialogue and information exchange between scientists from various fields, decision-makers at different levels of authority, groups of individuals lobbying for a common interest, and farmers with different socio-economic attributes. Such an integration of tools and knowledge was crucial for understanding the complex and dynamic aspects of sustainability, which would not be possible if the models were applied independently. Thus, Multimode had to consider crosscutting issues in different research areas to achieve systematic and optimal integration of the different models.


SD/TA/01 - A Multiscalar and Multiagent Modelling Framework for Assessing Sustainable Futures in a Globalised
Environment - "Multimode"
SSD - Science for a Sustainable Development – Transversal actions 19
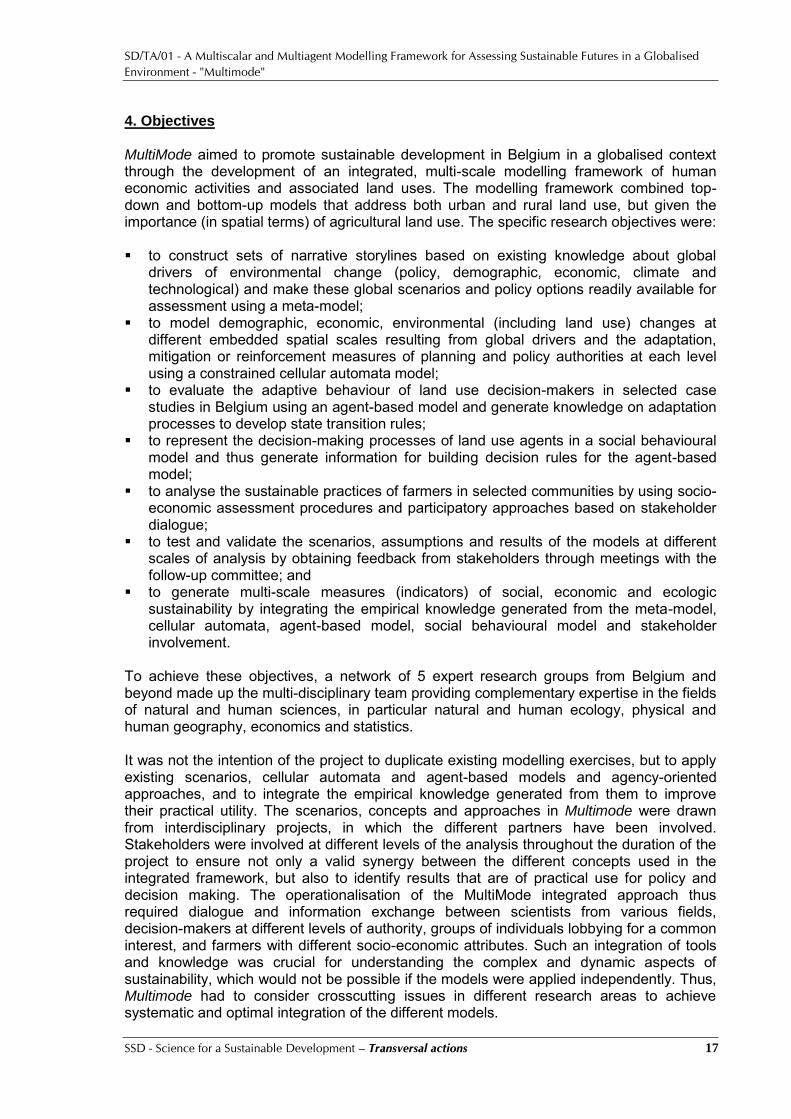
5. MultiMode Framework The key innovation carried out within MultiMode is its multi-scale and multi-agent integrative approach for assessing and forecasting the consequences of policies aimed at sustainable development. Integration took place not only across different scales and agents, but also across a range of disciplines and approaches. The levels of administration and decision-making represented the scales (i.e. national, regional, provincial, municipal, and community) and the institutions and individuals that make decisions at different scales represented the agents (e.g. decision-makers, planners, farmers). The project was organised into four work packages: Meta-Model of Policy Options and Scenarios (WP1), Multi-scale Constrained Cellular-Automata Model (WP2), Landscape Scale Agent-Based Model of Decision Rules (WP3) and Stakeholder Dialogue and Feedbacks (WP4). The integration between these work packages is presented in Figure 1. The policy options and scenarios at the global and European scale (WP1) flows into the cellular-automata model (WP2) and agent-based model (WP3) as drivers of land use change and socio-economic decision-making processes, respectively. As the name implies, cellular automata (CA) are models based on cells with attributes that are bounded in space. The different attributes of the cell can represent physical, environmental, social, economic, infrastructural and institutional characteristics. CA is a useful tool for assessing spatial dynamics in the environment due to the impacts of global drivers and European policies. However, adaptation process of institutions and individuals are not captured in CA because human agent‘s, whose actions and decisions are not bounded in space, are not explicit in the model. Agent-based modelling (ABM) takes account of the adaptive decisions of agents and the impacts of their decisions on the sustainability of the local environment because the agents are the focus of the analysis. However, the empirical application of ABM is mostly limited at a community level due to the huge amount of data required. ABM links the agents to their social, economic and natural environment. Within the integrated MultiMode approach, on the one hand, the spatially and temporally dynamic environment created in the CA was used to define the constraints and opportunities of the agents in the ABM. On the other hand, the CA used farm structure information such as farming holdings, their managers, the land use, livestock and the labour force. The agricultural production database provides yield, surface area and production statistics on all major crops in Belgium aggregated to the country, region and province level. Thus, there was a feedback of information between the cellular-automata and agent-based models. The ABM captured the behaviour of the agents in adapting to changes in their environment and these adaptive decisions were represented by social behavioural model (SBM), which was developed using knowledge elicited from stakeholder dialogue and feedbacks (WP4). SBM summarised both rational (e.g. economic maximization) and sub-rational (e.g. imitation) cognitive strategies of the agents. Allowing the integration of both rational and sub-rational cognitive strategies in ABM improved the current scientific practice of assessing future sustainability because it allowed assessment of sustainability not only according to economic, but also social and environmental factors. The successful completion of WP3 was largely dependent on the knowledge and information generated from WP4. The models in the four work packages generated various measures of sustainable development at different scales. These measures are spatio-temporal indicators and maps (from WP2 and WP3) at national, regional, provincial, communal and landscape levels as well as qualitative description of generic sustainability (from WP1) and farm sustainable practices (from WP4) in Belgium.
SD/TA/01 - A Multiscalar and Multiagent Modelling Framework for Assessing Sustainable Futures in a Globalised
Environment - "Multimode"
SSD - Science for a Sustainable Development – Transversal actions 20
Figure 1 Flow diagram of Data, Methods and Outputs in each Work Package

SD/TA/01 - A Multiscalar and Multiagent Modelling Framework for Assessing Sustainable Futures in a Globalised
Environment - "Multimode"
SSD - Science for a Sustainable Development – Transversal actions 21
6. Work Package Models and Results The results discussed below focus on the individual work carried out in each work package but with reference on the links to each other. 6.1 WP1: Meta-Model of Policy Options and Scenarios
6.1.1 Introduction to WP1 The scenario approach is widely used in many sciences (physical, economic, and social) in varied circumstances and for different purposes (Alcamo, 2001). Scenario thinking may offer solutions to complex issues for which there appears to be no simple analysis (Davis, 2002). Scenarios are coherent, credible stories about alternative futures. Importantly, scenarios are not predictions of the future. Instead, the main idea of the scenario approach is to use multiple perspectives to explore a specific problem (Rounsevell, et al., 2005). Scenarios on global trade and climate change were given emphasis in this work package because they are important processes in globalisation and because they provide the boundary conditions for future change within Belgium. The economic literature provides several global models applied to agricultural and trade policies (van Tongeren et al., 2000), the concepts of which can be based on partial or general equilibrium. The different trade models have their pros and cons hence it is necessary to evaluate the applicability of their assumptions and analyses for the objectives of MultiMode. Scenarios on climate change and other socio-economic variables were drawn from various European projects such as VISIONS (Rotmans et a. 2000), ACCELERATES (Abiltrup et al., 2006; Rounsevell et al., 2006a), ALARM (Settele et al., 2005), ATEAM (Schröter et al. 2005; Rounsevell et al., 2006b), PRELUDE (Delden et. al, 2005). The global scenarios developed in these different projects are consistent with frameworks of the Millennium Ecosystem Assessment (MA) and Intergovernmental Panel on Climate Change (IPCC) Special Report on Emissions Scenarios (SRES). Whilst scenarios of global drivers have been generated from previous models and are published in the literature, there has been no attempt to collect and analyse these scenarios as the basis for evaluating sustainable development. MultiMode developed a meta-model of policy options and scenarios, based on look-up tables and/or simple statistical functions. The model allowed key demographic, economic and climate parameters to be estimated in a flexible way from the existing knowledge base. The work package did not intend to develop new models to generate these parameters, but to take advantage of existing model outputs and scenarios. In addition to reviewing knowledge of existing drivers of global processes and constructing sets of narrative storylines that are based on these drivers, the work package also reviewed global and regional policies that are currently implemented or negotiated, which were relevant for describing future changes in demographic, economic and climatic conditions. All options and scenarios, which were collected and validated for the assessment of sustainable development, were used for the analysis of global and regional changes in the other work package models. 6.1.2 Scenarios and storylines A comprehensive literature review was carried out to identify both quantitative and qualitative models that are useful for developing an appropriate scenario framework for WP1. Among the most useful models included those developed in European projects including Accelerates, ATEAM, PRELUDE, etc. Like these studies, MultiMode followed closely the interpretations of the global storylines of the Intergovernmental Panel on Climate Change (IPCC) that are
SD/TA/01 - A Multiscalar and Multiagent Modelling Framework for Assessing Sustainable Futures in a Globalised
Environment - "Multimode"
SSD - Science for a Sustainable Development – Transversal actions 22
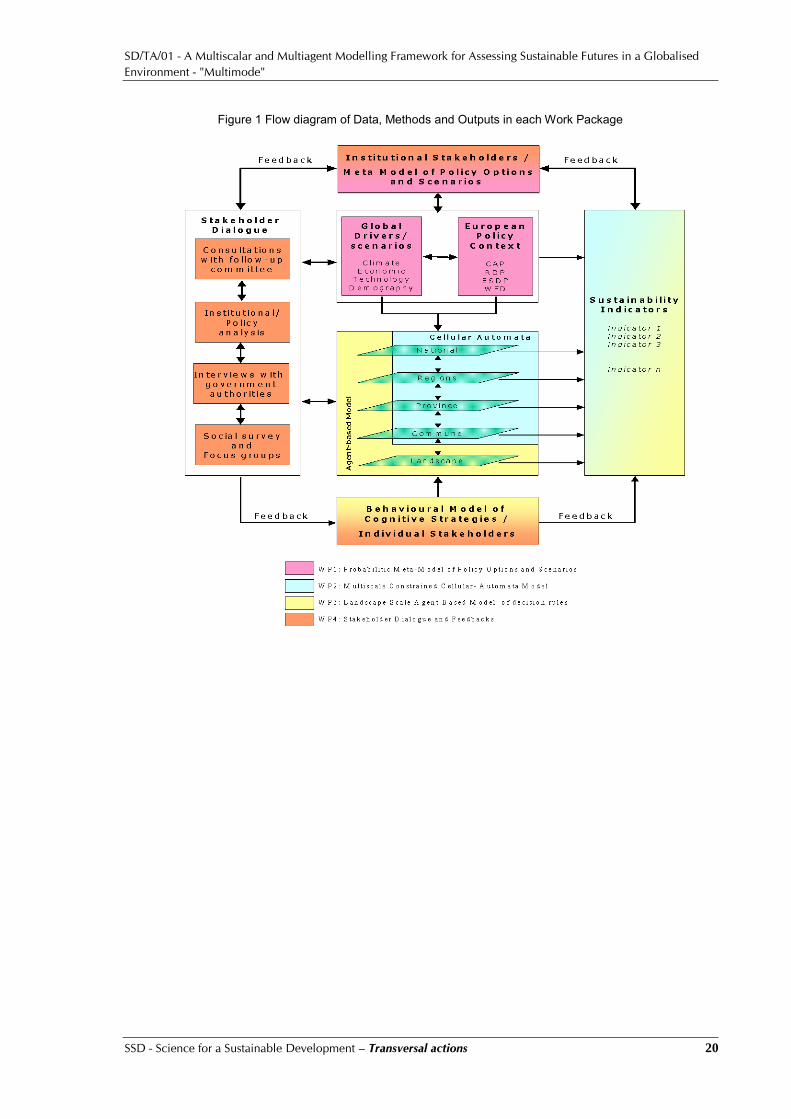
presented in the special report on emissions scenarios (SRES). Whilst we tried to fit in the scenarios in the SRES framework, an important contribution of this project was interpreting the storylines and downscaling the drivers to the regional scale within Belgium. The SRES framework is global in extent and therefore it is necessary to translate these global driving forces to a more local level, so that it can be applied for a smaller study area, i.e. Belgium. In the work of WP1, the specific drivers that influence each land use type were identified through regular working sessions of the multimode project staff. We further had regular follow-up sessions with the entire advisory committee and special sessions with individual advisory committee members, both of which provided feedback on our assumptions in the MultiMode work. Four scenarios based on SRES framework have been identified for MultiMode - Global and economic emphasis (GEE), Globalised and environmental/social emphasis (GES), Localised and economic emphasis (LEE), and Localised and emphasis on social/environment (LES). Detailed storylines for each scenario have been developed and are described in the WP1 Working Paper (Annex 1). Considering the data requirements of the CA and ABM models, five groups of driving forces that determine each scenario‘s character were selected including economy, technology, demographics, policy and environment. These main categories of drivers influence living and working in Belgium in the future. All the drivers can be grouped according to the three pillars of sustainability, economic, social and ecological. Figure 2 presents these drivers in a web diagram to show which drivers have more emphasis in each scenario. The indicators selected to represent the different groups of drivers are relevant not only in the development context of Belgium, but also to the data requirements of the other work packages. The qualitative values of these indicators, which have been interpreted from the storylines for the Belgian context, are presented in Table 1. MultiMode aimed to construct a meta-model, which required identification of an appropriate tool to present the policy options and scenarios in a way that is transparent for stakeholder validation and sufficiently flexible for application in cellular automata and agent-based models.
Figure 2 Web diagrams illustrating the emphasis of drivers in the four scenarios
Figure 3: Scenario 1
Economy
Technology
SocietyPolicy
Environment
Figure 4: Scenario 2
Economy
Technology
SocietyPolicy
Environment
Figure 5: Scenario 3
Economy
Technology
SocietyPolicy
Environment
Figure 6: Scenario 4
Economy
Technology
SocietyPolicy
Environment
SD/TA/01 - A Multiscalar and Multiagent Modelling Framework for Assessing Sustainable Futures in a Globalised
Environment - "Multimode"
SSD - Science for a Sustainable Development – Transversal actions 23
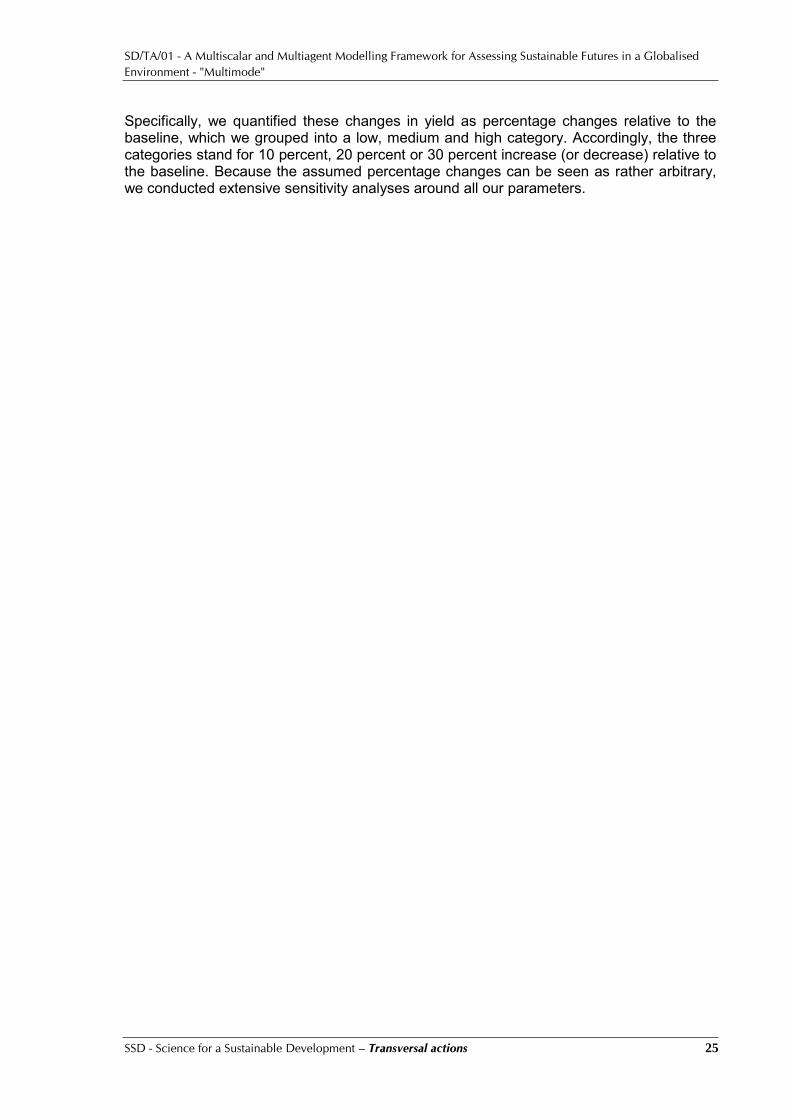
6.1.3 Historical data and future scenarios (link to WP2 and WP3) One major aspect of work was the quantification of the drivers because actual numbers were needed as inputs for the cellular automata and agent based modelling. While the quantification of certain drivers was fairly straightforward (for example, the increase in the Belgian population can easily be quantified because the Belgian Planning Bureau publishes reliable estimates), other drivers were much more challenging to quantify. This concerns, for example, the impact from climate change on the major regions in Belgium. Many studies exist predicting a range of impacts in the short and longer term, but for a 50-year horizon, as was envisioned by the MultiMode project, the concrete impacts are relatively unknown. We thus conducted a careful analysis of the existing studies to obtain the most reliable estimates for the Belgian case. Moreover, we collected historical data ranging from 1970 to 2008, which were necessary to estimate values for the baseline projections of the indicators with no available future estimates from literature. The baseline projections were used as basis for developing the values for the different four scenarios. The description of the database of the most relevant indicators that have been collected is presented in Table 2. Due to the differences in the scale of analysis, the CA and ABM models required different datasets. The input data for the CA like employment, population, etc. usually has available baseline projections from literature. The input data for the ABM was usually not available due to the detailed information the model requires. For the ABM data, we thus based the extrapolation of future values based on the historical data. We used projected data in the Agmemod project, which provides baseline projections out to 2020, for our extrapolation. We applied different methods to extrapolate the historic data (for details, see WP1 Working Paper in Annex 1): we took the three-year average values for the 1973-1975 and 2006-2008 periods and
then based the extrapolation on the average change per year between the two three-year values;
we run a simple regression for the entire historic period (1973-2008) and applied coefficients and intercepts to extrapolate the period after 2008; and
we examined the historic data (1973-2008) for structural breaks and took those into account in the regression.
SD/TA/01 - A Multiscalar and Multiagent Modelling Framework for Assessing Sustainable Futures in a Globalised
Environment - "Multimode"
SSD - Science for a Sustainable Development – Transversal actions 24
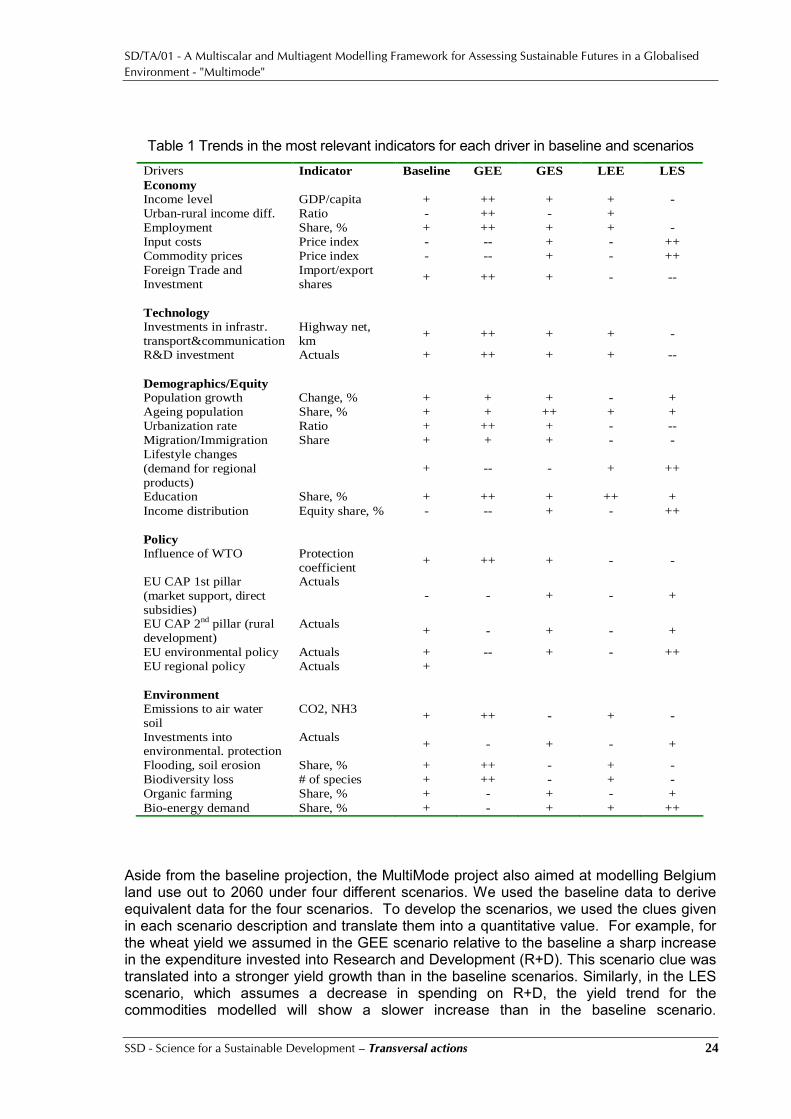
Table 1 Trends in the most relevant indicators for each driver in baseline and scenarios Drivers Indicator Baseline GEE GES LEE LES
Economy
Income level GDP/capita + ++ + + -
Urban-rural income diff. Ratio - ++ - +
Employment Share, % + ++ + + -
Input costs Price index - -- + - ++
Commodity prices Price index - -- + - ++
Foreign Trade and
Investment
Import/export
shares + ++ + - --
Technology
Investments in infrastr.
transport&communication
Highway net,
km + ++ + + -
R&D investment Actuals + ++ + + --
Demographics/Equity
Population growth Change, % + + + - +
Ageing population Share, % + + ++ + +
Urbanization rate Ratio + ++ + - --
Migration/Immigration Share + + + - -
Lifestyle changes
(demand for regional
products)
+ -- - + ++
Education Share, % + ++ + ++ +
Income distribution Equity share, % - -- + - ++
Policy
Influence of WTO Protection
coefficient + ++ + - -
EU CAP 1st pillar
(market support, direct
subsidies)
Actuals - - + - +
EU CAP 2nd
pillar (rural
development)
Actuals + - + - +
EU environmental policy Actuals + -- + - ++
EU regional policy Actuals +
Environment
Emissions to air water
soil
CO2, NH3 + ++ - + -
Investments into environmental. protection
Actuals + - + - +
Flooding, soil erosion Share, % + ++ - + -
Biodiversity loss # of species + ++ - + -
Organic farming Share, % + - + - +
Bio-energy demand Share, % + - + + ++
Aside from the baseline projection, the MultiMode project also aimed at modelling Belgium land use out to 2060 under four different scenarios. We used the baseline data to derive equivalent data for the four scenarios. To develop the scenarios, we used the clues given in each scenario description and translate them into a quantitative value. For example, for the wheat yield we assumed in the GEE scenario relative to the baseline a sharp increase in the expenditure invested into Research and Development (R+D). This scenario clue was translated into a stronger yield growth than in the baseline scenarios. Similarly, in the LES scenario, which assumes a decrease in spending on R+D, the yield trend for the commodities modelled will show a slower increase than in the baseline scenario.
SD/TA/01 - A Multiscalar and Multiagent Modelling Framework for Assessing Sustainable Futures in a Globalised
Environment - "Multimode"
SSD - Science for a Sustainable Development – Transversal actions 25
Specifically, we quantified these changes in yield as percentage changes relative to the baseline, which we grouped into a low, medium and high category. Accordingly, the three categories stand for 10 percent, 20 percent or 30 percent increase (or decrease) relative to the baseline. Because the assumed percentage changes can be seen as rather arbitrary, we conducted extensive sensitivity analyses around all our parameters.
SD/TA/01 - A Multiscalar and Multiagent Modelling Framework for Assessing Sustainable Futures in a Globalised
Environment - "Multimode"
SSD - Science for a Sustainable Development – Transversal actions 26
Table 2 Database of the most relevant indicators for CA and ABM models Indicator First data Last data Source Available proj. Our proj.
Economy
Real GDP growth 1971 2006 OECD Real GDP per capita 1950 2004 Penn World Tables yes Income level Growth rate of Real GDP per capita 1970 2004 Penn World Tables Annual growth of real value added 1971 2006 OECD yes Value added per economic
sector Value added (share of total value added) 1970 2006 OECD yes Urban-rural income diff.
1997 2007 DGSIE1 1983 2006 OECD Employment rate (15/64 years) 1980 2013 Fed Plan. Bureau yes yes Employment
Employment rate (15 years and more) 1980 2020 UN2 yes Employment per economic sector Number of people 1980 2013 Fed Plan. Bureau yes yes
Agricultural input prices indice 1995 2008 Ecodata Price indices for raw materials 1996 2008 National Bank Nominal remuneration / full-time equiv. 1970 2008 Ecodata Growth of real labour cost per capita 1985 2013 Fed Plan. Bureau yes Long term interest rates 1955 2006 OECD yes Arable land prices 2001 2004 DGSIE
Input costs
Pasture prices 2001 2004 DGSIE Consumer prices indice 1970 2006 OECD Consumer prices indices: food 1970 2006 OECD Consumer prices indices: energy 1970 2006 OECD Commodity prices
Producer prices indices: manufacturing 1980 2006 OECD Share of trade in GDP 1970 2006 OECD yes Foreign Trade and
Investment Foreign direct investment, net inflows 1975 2006 World Bank Technology
Total length of the road net 1966 2006 DGSIE yes Investments in infrastr. Transport&Communication Total length of the highway net 1938 2006 DGSIE yes R&D investment Gross domestic expenditure on R&D 1983 2006 OECD Demographics/Equity
Population growth Total population 2000 2060 Fed Plan. Bureau yes Ageing population Population of 65 years and more (share) 2000 2060 Fed Plan. Bureau yes Urbanization rate Urban population (share) 1950 2030 UN yes
"Accroissement migratoire" 1998 2007 DGSIE 1970 2006 OECD Migration/Immigration Migration rate 1995 2050 UN yes
Lifestyle changes (demand for regional products) Organic products consumption (share)??
Education Tertiary attainment for age group 25-64 1991 2005 OECD yes Income quintile share ratio 1995 2006 Eurostat Income distribution Gini coefficient 1995 2006 Eurostat
Policy
Influence of WTO PSE (%) 1986 2007 OECD Agriculture support (% GDP) 1990 2005 UN EU CAP Agriculture support (million US$) 1990 2005 UN
1994 2006 EEA3 EU CAP 1st and 2nd pillar Budgetary expenditure 2007 2013 EU4 "yes"
Government expenditure 1995 2006 Eurostat EU environmental policy Government expenditure (share of GDP) 1995 2006 Eurostat
EU regional policy Budgetary expenditure 2007 2013 EU "yes" Environment
1989 2006 DGSIE CO2 of energetic origin 1971 2005 OECD Atmospheric NH3 1990 2005 DGSIE Emissions to air water soil
Greenhouse gas emissions 2004 2010 EEA yes Investments into environmental protection Government expenditure 1990 2006 UN
Flooding, soil erosion Share, % Biodiversity loss Number of species Organic farming Share of UAA 1998 2006 DGSIE Bio-energy demand (?) Share of UAA
1 Direction Générale Statistique et Information Economique of SPF Economie (ex-INS) 2 UN : United Nations 3 EEA : European Environment Agency 4 EU : European Union (official sources, such as European Council)

SD/TA/01 - A Multiscalar and Multiagent Modelling Framework for Assessing Sustainable Futures in a Globalised
Environment - "Multimode"
SSD - Science for a Sustainable Development – Transversal actions 27
6.2 WP2: Multi-scale Constrained Cellular-Automata Model 6.2.1 Introduction to WP2 The prime objective of the work carried out in WP2 was the development and application of a constrained cellular automata (CCA) land use model for Belgium. We used to the extent possible the MOLAND1 modelling shell (Engelen et al., 2007). The CCA model is a high resolution simulation model. It allocates changes in different socio-economic activities on a land use map of Belgium at a 300m resolution. Its prime goal is to explore the effects of different policy scenarios on future land use in an integrated context. Information feeding these scenarios was partly obtained from WP1 and WP3. Based on the information from WP1, parameter values were estimated representing major trends and developments in the demography, the social and economic subsystems. WP3 provided information with regards to parameters and trends with respect to the specifics of agricultural land use. Other parameters in the model, such as the stochastic component of the land use allocation, are essentially technical in nature and are estimated alongside the development of the model itself. The model is based on the systems view that spatial systems like cities, regions, countries, watersheds, etc. evolve as the result of endogenous processes combined with exogenous events including policy-induced changes. Therefore, the model incorporates a sufficient description of the autonomous processes making and changing the land use patterns of Belgium and represents policy and other constraints as elements interacting with these. Thus, integrated pictures of possible futures of the modelled system can be presented. As the name implies, cellular automata (CA) are mathematical models represented as an n-dimensional grid of identical cells. Each cell is in one of a discrete number of states: one dominant land use in the context of this model. They are dynamic models featuring state changes. To that effect, an automaton is applied to each cell in the grid to determine its state transition. The automaton is a transition rule written as a function of the state of the cell itself and that of the cells within its immediate neighbourhood, called the CA-neighbourhood. Typically CA-neighbourhoods in two-dimensional models are limited to the 4 or 8 immediate neighbours (Couclelis 1997). Such small neighbourhoods are sufficient for modelling diffusion processes, however, they fail to represent the socio-economic interactions taking place over longer distances (Engelen et al., 2007). Thus, the CCA model implemented in WP2 applies a neighbourhood of 196 cells maximally. The basic assumption underlying traditional CA-land use models is that land use dynamics can be fully explained by the land uses and associated spatial interactions in a relatively limited neighbourhood. In reality however, the behaviour of the cells and their resulting land use is determined and constrained by a variety of processes operating at larger scales beyond that of the neighbourhood (e.g. municipal, provincial, national, European and global) and by the precise heterogeneous character of the geographical environment within which they are situated. This has led to the development of hybrid CA models constrained in their dynamics by coupled models operating at coarser spatial scales (Batty and Xie, 1994, Engelen et al., 1995, White and Engelen, 1997) and evolving in a finite non-homogeneous cell space: a bounded cell space consisting of cells with different attribute values representing their physical, environmental, social, economic, infrastructural and institutional characteristics (Clarke et al. 1997, Li and Yeh, 2000, Poelmans and Van Rompaey, 2010). Such integrated models are useful because they are more than mere land use models: they allow an urban or regional system to be treated as a dynamic whole. 1 MOLAND has been developed for the DG EU-Joint Research Centre, IES in Ispra, Italy by the Research
Institute for Knowledge Systems, the Netherlands

SD/TA/01 - A Multiscalar and Multiagent Modelling Framework for Assessing Sustainable Futures in a Globalised
Environment - "Multimode"
SSD - Science for a Sustainable Development – Transversal actions 28
Consequently, these hybrid models are gradually becoming important instruments for the assessment of policies aimed at improved spatial planning and sustainable development (de Nijs et al., 2004) as well as scenario-analysis (White et al., 2004, van Delden et al., 2005; 2007; Maes et aL., 2009; Peymen et al., 2009). In MultiMode WP2, a hybrid CA model was implemented consisting of models operating at three linked levels: national, regional, and finally, cellular: the National level, representing Belgium as one entity subjected to influences from
abroad as quantified in scenario‘s, not in the least those developed in WP1; the Regional level, representing Belgium in terms of its 43 arrondissements. The level
of the arrondissements is a good modelling-technical compromise between municipalities and provinces providing sufficient regional differentiation while avoiding technical complication.
the Cellular level, representing Belgium as consisting of a regular grid of cells measuring 9 ha each (300 m by 300 m). From a modelling-technical point of view, this resolution is appropriate for the CA-algorithm applied (50 m < 300 m < 1000 m), it permits to work with dominant land uses present in the cells and the spatial extent of its CA-neighbourhood (8 cells x 300 m = 2400 m) sufficiently incorporates local spatial interactions.
At both the National and the Regional level the population is represented as one age cohort and the economy is represented by three aggregated sectors, namely Agriculture, Industry, and Services. The latter are grouped on the basis of the NACE-codes. At the Cellular level 19 land uses are modelled, of which 7 are dynamic, 3 are passive, and the remaining 9 are static. The linkage between the population and sectors of the Regional level and the land uses at the Cellular level is established in the so-called Land use-Sector matrix. The model is equipped with a fairly simple transportation model sufficient to analyse the complex interlinkages between transportation infrastructure and land use at both the Regional and the Cellular level of the model. However, the model is too simple to deal with modal split, routing of traffic and detailed forecasting of congestion. 6.2.2 Agricultural land use (link to WP3) Matching data sources In the multimode project, two modelling frameworks were developed in parallel: an Agent Based Model that focuses on the agri-environment and a Constraint Cellular Automata Model. We linked the two modelling approaches through the datasets on agricultural areas. A major part of the statistical data on agricultural land use is available for administrative units with no direct way to assign them to units more relevant from a geographical point of view (e.g. catchments, agricultural regions). The Belgian agricultural census data held every year on 15th May, of which the results are reported to the Farm Structure Survey (FSS) in Eurostat, provides for a long term dataset on farming activities in Belgium. The data include the structure of the farming holdings, their managers, the land use, livestock and the labour force. The agricultural production database, as part of the census dataset, provides yield, surface area and production statistics on all major crops in Belgium aggregated to the country, region and province level. The yearly datasets provide inter alia for an invaluable source to elicit trends in agricultural surface area for different crops. The agricultural census data, however, cover statistics on the agricultural sector but may not sufficiently reflect (agricultural) land use outside the professional agricultural sector. A comparison with other data sources is necessary to

SD/TA/01 - A Multiscalar and Multiagent Modelling Framework for Assessing Sustainable Futures in a Globalised
Environment - "Multimode"
SSD - Science for a Sustainable Development – Transversal actions 29
reveal differences and their significance in relation to land use partitioning. In order to spatially allocate statistics from administrative regions to another spatial dimension, the statistics should be redistributed via a spatial modelling process. A spatially explicit land cover map for Belgium is the Belgian Corine Land Cover map (BE-CLC). BE-CLC provides for a limited time series of land cover (1990, 2000, 2006) produced with a methodologically uniform nation-wide coverage. A methodology needed to be developed to localise the information more precisely while limiting information loss. Thus the work carried out involved: comparing BE-CLC and statistical land cover data and defining a common classification
scheme that is relevant for studying sustainable agriculture and environment; defining statistical trends in agricultural surface area and their likely evolution in future;
and defining a methodology to spatially allocate statistics and evolution to BE-CLC. A comparison of the different databases was made in terms of spatial characteristics, data allocation, classification and data acquisition. The importance of the geometric precision of the different databases is closely related to the size of the aggregation unit or administrative region. The error of precision plays an important role for objects placed along the border of an administrative region or spatial unit. The proposed aggregated classes and link between the statistical data and the spatial BE-CLC is detailed in Table 3. The statistical classes (FSS) are aggregated according to the effect that the crop has on the environment. The BE-CLC classes remain unchanged in the table. Table 3 Link between BE-CLC (Belgian Corine Land Cover) classes and STAT (Farm holding census data) classes, and proposed aggregation
Level 1 Level 2 - CLC Level 3 – CLC & Agric. Census
Agricultural area: - Total agricultural area
- Grassland - Permanent crops
- Permanent and temporary - Mainly fruit trees
- Arable - Cereals - Maize - Root crops (potato, sugar beets, chicory, ...) - Industrial crops (oilseeds, flax, ...) - Fodder crops (rape, beet, ...) - Green fodder (clover, ...)
- Heterogeneous - Complex cultivation patterns - Agriculture & Nature
Trends in agricultural surface area and future evolution
The major trends in agricultural surface area observed in the past have been analysed and reported for the classes at Level 1, Level 2 and Level 3. Some expected future trends were derived. Figure 3 presents an example of results from this analysis (more results are presented in WP2 Working Paper in Annex 2).

SD/TA/01 - A Multiscalar and Multiagent Modelling Framework for Assessing Sustainable Futures in a Globalised
Environment - "Multimode"
SSD - Science for a Sustainable Development – Transversal actions 30
Figure 3 Left: The Utilised Agricultural Area (in 1000 ha) in Flanders and Wallonia according to farm holding statistics. Right: The Utilised Agricultural Area in Flanders and Wallonia in km² as represented in the BE-CLC
UAA
Year
1975 1980 1985 1990 1995 2000 2005 2010
Are
a
500
550
600
650
700
750
800
850
YEAR vs VL YEAR vs WA
The Utilised Agricultural Area (Figure 3, Left) is the sum of arable land, kitchen gardens (i.e. plots with vegetables situated in agricultural land), permanent crops (mainly fruit trees), grassland (pastures and meadows). There is a historical downward trend until 1993, followed by an upward trend till 2000 and again a downward trend until present. BE-CLC (Figure 3, Right) shows a downward trend from 1990 to 2006. The huge difference between the statistics and BE-CLC are attributed to the differences between land cover (CLC is based on interpretation of satellite imagery) and land use (statistics). The effect is particularly strong for grasslands. For the future, it is expected that from 2000 onwards there will be a (weak) exponential decay. Trends in production units, agricultural production and farm decision making
Agricultural production units are changing in Belgium. There is a general tendency for less but larger farms in Flanders; a similar trend is taking place in Wallonia. This tendency centralises the decision making on agricultural land and provides for an important factor in land use / cover changes. The share of farming area under agri-environmental measures is proportionally increasing to utilised agricultural area. The most common measures are the maintenance of green cover grass strips related to the water framework directive and small landscape elements. AEM areal increase relates to landscape conservation and environmental concerns. In the MultiMode project it is assumed that farm sizes will increase, agri-environmental concerns will rise, and technological advances will continue such that future farms are considered more resilient to climate impacts.
6.2.3 Implementation of scenarios (link to WP1)
The spatial allocation methodology and databases have been used with scenarios from WP1 and with the ABM from WP3. Agricultural land uses associated with WP1-scenarios have been further quantified (Figure 4).
UAA
8000
10000
12000
14000
16000
18000
20000
1990 2000 2006
FLWABE

SD/TA/01 - A Multiscalar and Multiagent Modelling Framework for Assessing Sustainable Futures in a Globalised
Environment - "Multimode"
SSD - Science for a Sustainable Development – Transversal actions 31
Figure 4 Projected trend of major agricultural land use classes in the four WP1 scenarios
The connections established between statistics and CLC data in Belgium, the Wallonia and Flanders regions, are made further explicit using data disaggregated at the province level for which level both datasets are available. At the arrondissement level (the level at which the CCA model operates), no statistical data are available and a principle of constant share with respect to the province level is implemented. Spatial modelling of the WP1 scenarios It was one of the main aims of MultiMode to quantify, compute and analyze the detailed spatial consequences of the scenarios developed in WP1 by means of the CCA land use model of WP2. To this effect, the scenarios developed in WP1 were translated as completely as possible in terms of the parameters and variables of the CCA model. They were interpreted with respect to the qualitative and quantitative descriptions of the expected changes in the activities and land uses in the period 2000-2060. This was not an easy exercise as the parameters in the model are highly technical in nature and further, the qualitative scenarios are not necessarily very explicit in the type of assumed spatial developments. More so, scenarios may well show inconsistencies in aspects dealt with by the model. Prior to the quantification and parameterization of the 4 scenarios developed in WP1, a fifth scenario was developed. It is named BAU and stands for Business As Usual. The BAU is also referred to as the baseline scenario and is based on a continuation of trends from the past. Typically, BAU-scenarios are considered to describe a most ‗likely future‘, yet, and as discussed in WP1, due to the uncertainty associated with long term forecasts, ‗likely future‘ has to be interpreted with care. Like in WP3, BAU is used in WP2 to provide a reference for the interpretation and quantification of the 4 scenarios. A first step in the quantification procedure consisted in harmonizing the land use categories defined in WP1, which are essentially based on statistical data available from DGSIE, and those used in the land use model of WP2, largely based on BE-CLC. The correspondence between both classifications is not perfect at the level of the individual categories, but the totals are less problematic. This is very obvious for the total agricultural area. As to the urban categories, there is more urbanised land on BE-CLC, and hence in the land use model, than assumed in WP1. Also, the categories continuous and discontinuous urban

SD/TA/01 - A Multiscalar and Multiagent Modelling Framework for Assessing Sustainable Futures in a Globalised
Environment - "Multimode"
SSD - Science for a Sustainable Development – Transversal actions 32
fabric comprise more than the residential land use, rather include some industrial, commercial and service activities too. In fact, the confusion reported here demonstrates the merits of an activity-based approach like the one developed in WP2 (see WP2 Working Paper in Annex 2), as it enables activities of various kinds in the urban land use categories. Conversion factors were applied to the figures in the scenarios in order to translate them in growth figures of the associated land use categories. The next step focused on developing two linked tables that relate, on the one hand, spatial processes affected by the various drivers considered to the scenarios of WP1, and, on the other hand, a table linking as accurately as possible the drivers to the various parameters of the model. The drivers and along with it the associated parameters in the model were quantified. This resulted in a parameter set per scenario. The main results of the quantification are as follows: The growth of the population and jobs in the industry and service sector is taken from
WP1 and applied in the respective scenario. The trends in the spatial extent of the 5 agricultural land use classes (Arable land,
Permanent crops, Pastures, Complex vegetation patterns and Agriculture with natural vegetation) are as derived and discussed in section ‗Agricultural land use‘. Thus trends are computed per scenario, land use class and arrondissement. The figures for Brussels Capital have been reduced to take into consideration the urban expansion pressure in the arrondissement. In particular the demand for land occupied by ‗Agriculture with natural vegetation‘ is limited to 46ha in 2060.
The absolute figures for the area occupied by urban activities in the BE-CLC map, and hence the land use map of the model, differ too much from the data used in WP1. As a result these figures cannot be used in the scenarios as such. The parameters in the density equation of the regional model have therefore been tuned to reflect the urban land use expansion trends in WP1, not the actual numbers. The area taken in by the urban categories in the simulation interval is next computed by the model based on the evolving densities. In this context, the model was adapted: the land use class ‗Industrial and commercial areas‘ was split in ‗Industrial areas‘ and ‗Commercial areas‘ as they represent very different densities.
The distribution of activities, population and jobs, over the various arrondissements is calibrated in the BAU scenario by means of an historic calibration (hindcasting) based on the period 1995-2007. The parameters of the attractivity and density equations of the regional model are estimated accordingly. These parameters are next adapted to represent the different trends of the 4 scenarios from WP1.
As discussed in WP1, the population is distributed over the Belgian territory on the basis of the typology of the Belgian municipalities. At the regional level, the CCA model operates on the level of the arrondissements, hence has no input nor knowledge of municipalities. The regional model itself computes and allocates activity levels (population and jobs) to each arrondissement based on its built-in mechanisms (principally the relative attractivity of each arrondissement). Thus, for each scenario, the discrepancies in population at the level of the arrondissement between each of the 4 scenarios and the BAU scenario were computed. Next, the model was calibrated to mimic the population distribution for each scenario as closely as possible. To the effect the parameters of the regional model (essentially those of the attractivity equation) originally estimated for the BAU scenario were fine-tuned for each scenario. The parameters for the distribution of jobs in industry and services estimated for the BAU scenario are applied in the other four scenarios without change.
The transition rules in the transition potential of the cellular automata model are kept identical for all scenarios. This reflects an identical spatial interaction among land uses in all scenarios. This is a simplification of reality as the land uses may differ slightly in composition among scenarios and consequently exert a different effect on one another.

SD/TA/01 - A Multiscalar and Multiagent Modelling Framework for Assessing Sustainable Futures in a Globalised
Environment - "Multimode"
SSD - Science for a Sustainable Development – Transversal actions 33
The suitability maps of all land uses are kept identical in all scenarios, thus reflecting that the physical constraints on the land use dynamics is the same in all scenarios. However, in the LES scenario, the importance given to suitability is less than in all other scenarios.
The accessibility parameters are only significant for the urban land use categories, neither for agriculture nor for natural vegetation. The parameters are the same for all scenarios. This reflects the assumption that the need for access of all land uses is the same in the various scenarios. Again this is a simplification as the market oriented scenarios (GEE and LEE) may need better access to means of transportation to export the goods produced.
The zoning maps are based on the official legislative documents as they apply in Flanders, Wallonia and Brussels. For as far as they are not incorporated in the previous, the Natura 2000 areas are taken into consideration too. The scenarios BAU, GEE and LEE share the same zoning map. GES and LES share another set. The latter differs from the former in that Natura 2000 areas cannot be taken in by urban nor by agricultural activities. In the LES scenario, the zoning map is given more weight in the transition potential.
Finally, scenarios incorporate trends with respect to urban functions and agriculture, but not nature. The extent of the protected nature is kept constant and fixed in space. Natural land use which is not protected is dealt with as a vacant land use, meaning that it can be taken in by any of the agricultural or urban land uses.
Results of the BAU-scenario
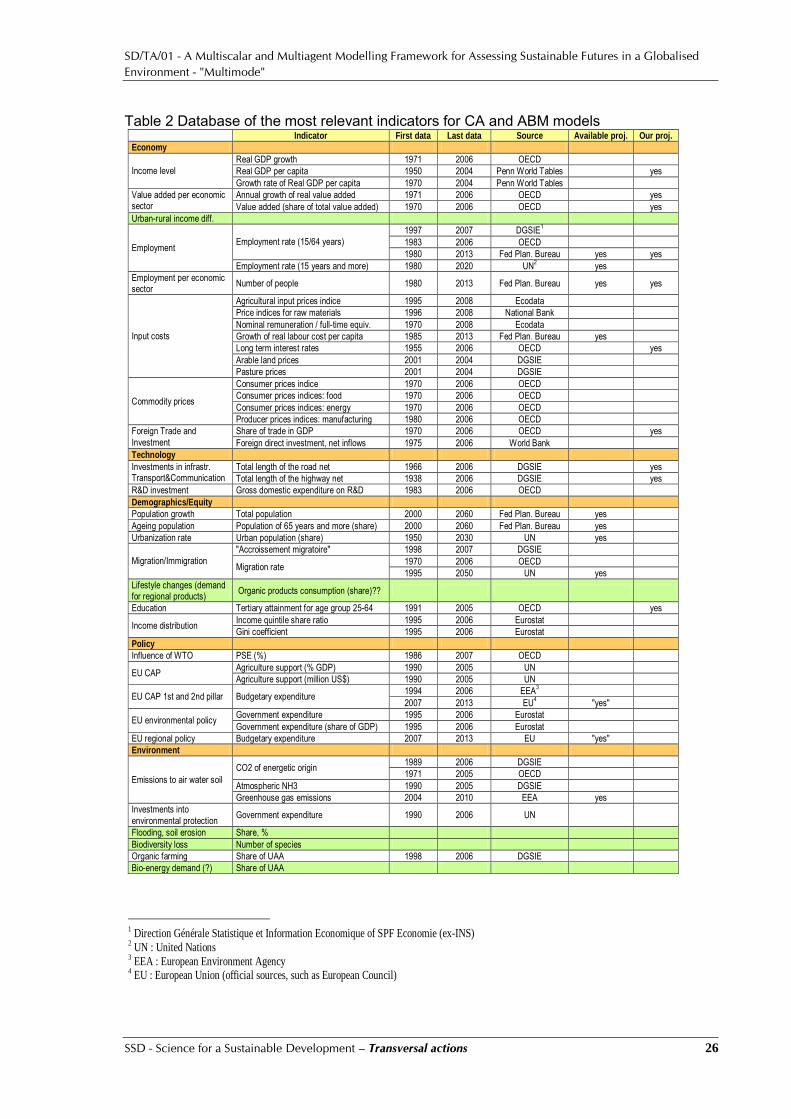
As can be concluded from Figure 5 and Figure 6, the expansion of the urban land uses is remarkable. This is most explicit in 2030-2060. It is also more obvious in the Flanders region than Wallonia. The Brussels region is already nearly completely urbanised in 2000 (Figure 5), hence, can hardly expand. The urban expansion generally happens to the disadvantage of the agricultural land uses, mostly the class complex cultivation patterns, and, to a lesser extent forests. With a view to locate the most important changes in 2000-2060, the Fuzzy Kappa map of Figure 6 is generated. It shows in the reddish tones the areas that undergo the strongest changes. These are on the one hand located at some distance from the biggest agglomerations: Antwerp, Brussels, Liège and Charleroi. It reflects the continued growth of these agglomerations until 2060 and at increasing distances away from the historic centres of the agglomerations. On the other hand, there are also major changes in the western part of West Flanders province, the Eastern part of Antwerp province and the central part of Limburg province. Per land use comparison confirms that the most dramatic changes in the land use are due to the expansion of the discontinuous urban land use class.
SD/TA/01 - A Multiscalar and Multiagent Modelling Framework for Assessing Sustainable Futures in a Globalised
Environment - "Multimode"
SSD - Science for a Sustainable Development – Transversal actions 34
Figure 5 Top Left: BAU, land use in 2000. Top Right: BAU, land use in 2030. Bottom: Legend
Figure 6 Left: BAU, land use in 2060. For legend, see Figure 5. Right: BAU, Fuzzy Kappa comparison of land
use in 2000 and 2060. Colours ranging from green to red: in green areas undergoing little or no change, in red, areas undergoing strong change.
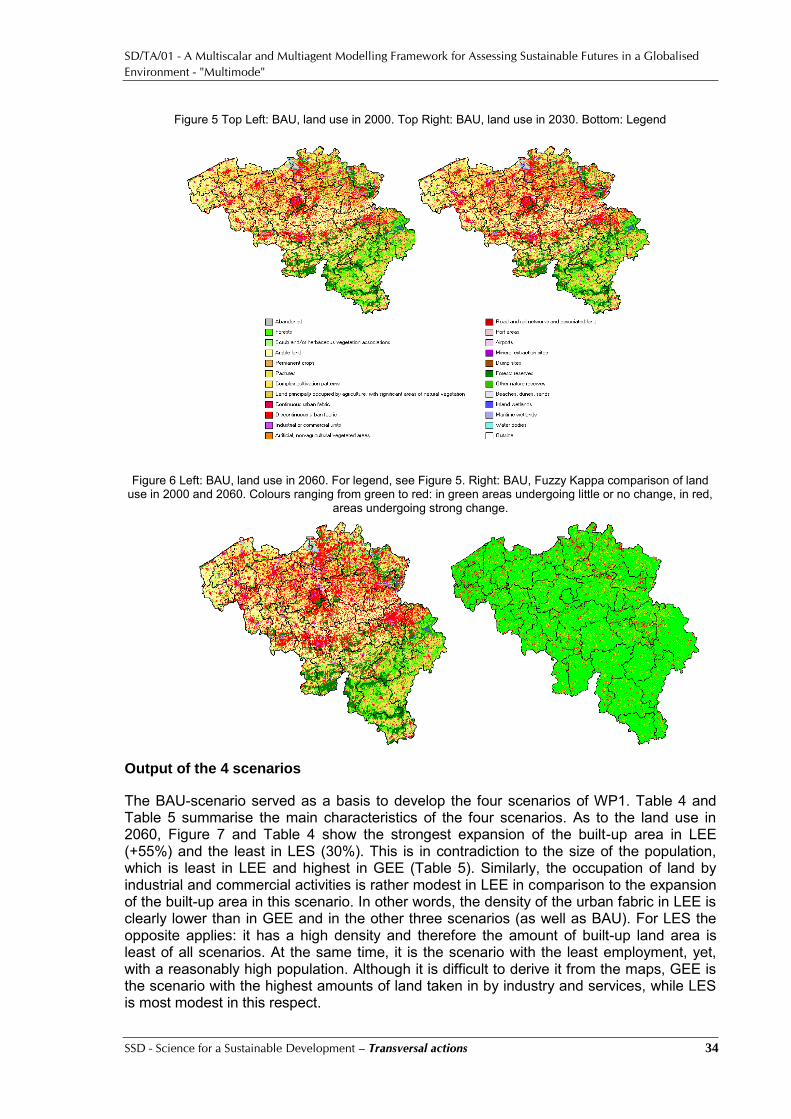
Output of the 4 scenarios
The BAU-scenario served as a basis to develop the four scenarios of WP1. Table 4 and Table 5 summarise the main characteristics of the four scenarios. As to the land use in 2060, Figure 7 and Table 4 show the strongest expansion of the built-up area in LEE (+55%) and the least in LES (30%). This is in contradiction to the size of the population, which is least in LEE and highest in GEE (Table 5). Similarly, the occupation of land by industrial and commercial activities is rather modest in LEE in comparison to the expansion of the built-up area in this scenario. In other words, the density of the urban fabric in LEE is clearly lower than in GEE and in the other three scenarios (as well as BAU). For LES the opposite applies: it has a high density and therefore the amount of built-up land area is least of all scenarios. At the same time, it is the scenario with the least employment, yet, with a reasonably high population. Although it is difficult to derive it from the maps, GEE is the scenario with the highest amounts of land taken in by industry and services, while LES is most modest in this respect.
SD/TA/01 - A Multiscalar and Multiagent Modelling Framework for Assessing Sustainable Futures in a Globalised
Environment - "Multimode"
SSD - Science for a Sustainable Development – Transversal actions 35
Figure 7 Land use in 2060 for the 4 scenarios
Table 4 Aggregated land use classes: evolution of land use per scenario
BAU 2000 BAU 2060 GEE 2060 GES 2060 LEE 2060 LES 2060
Agriculture land 1,770,354 1,518,093 1,476,072 1,510,812 1,469,493 1,583,037
Urbanised areas 560,493 811,467 843,534 814,401 869,157 728,991
Natural areas 703,287 704,574 714,528 708,921 695,484 722,106
Total 3,034,134 3,034,134 3,034,134 3,034,134 3,034,134 3,034,134
evolution 2000 - 2060: absolute numbers in ha
BAU GEE GES LEE LES
Agriculture land -252,261 -294,282 -259,542 -300,861 -187,317
Built-up areas 250,974 283,041 253,908 308,664 168,498
Natural areas 1,287 11,241 5,634 -7,803 18,819
evolution 2000 - 2060: percentage change
BAU GEE GES LEE LES
Agriculture land -14 -17 -15 -17 -11
Built-up areas 45 50 45 55 30
Natural areas 0 2 1 -1 3
There is a steep decline in the amount of agricultural land towards 2060 in all scenarios. This decline is most pronounced in LEE and GEE (both -17%) and least pronounced in LES (-11%). In GEE the loss of agricultural land is compensated by high productivity levels. In LES, local marketing and promotion of local quality maintains an important amount of

SD/TA/01 - A Multiscalar and Multiagent Modelling Framework for Assessing Sustainable Futures in a Globalised
Environment - "Multimode"
SSD - Science for a Sustainable Development – Transversal actions 36
activity in the agricultural sector. Much of the land lost in agriculture is urbanised in 2060. In LEE, the urban expansion results in a slight decline (- 1%) of the nature areas on top of the loss of agricultural land. The growth of nature is most pronounced (+3%) in LES. As to the location of the changes in agriculture, Figure 8 shows somewhat similar results for all scenarios. Agricultural land is mostly lost in the areas near the urban centres where urban expansion is most explicit. In LEE, due to its low density urban land use, agriculture is pushed back further away from the urban centres, while in the more compact LES, the loss of agricultural land is considerably less: it remains closer to the urban centres in 2060. In all scenarios new agriculture invades land previously taken in by nature in Antwerp, Limburg and Liège provinces. This is much less the case in GES and LES with more strict planning regulations.
Table 5 Population and employment in Industry and Services in 2060 per scenario BAU GEE GES LEE LES
Population 12,662,761 13,146,689 12,662,761 12,176,980 12,661,785
Jobs in Industry 717,000 611,773 698,234 690,521 616,227
Jobs in Services 4,289,000 4,738,585 4,179,129 4,132,967 3,688,293
Total Jobs 5,046,000 5,384,756 4,916,622 4,852,604 4,348,000
Figure 8 Agricultural land, changes in 2000-2060. In green areas already occupied by the land use in 2000, in
red areas no longer occupied by the land use in 2060, in blue new areas occupied by the land use in 2060.
The total amount of land taken in by natural areas (Figure 9) changes only by few percent for all scenarios. In all but LEE, the area taken in by natural land slightly grows. The most explicit growth is in LES with close to 19,000 ha new natural land. New nature areas show up in West Flanders province in all scenarios but also in Luxemburg, Liège and Hainaut provinces for both GEE and GES scenarios. Natural areas are lost for all scenarios near the bigger agglomerations: Antwerp, Liège, Charleroi and to a lesser extent Gent and Brussels. Also, the central part of Limburg and the eastern part of Brabant province lose

SD/TA/01 - A Multiscalar and Multiagent Modelling Framework for Assessing Sustainable Futures in a Globalised
Environment - "Multimode"
SSD - Science for a Sustainable Development – Transversal actions 37
nature areas in all scenarios. This is due to the expansion of permanent crops. More in depth discussion of the spatial outcome of the various scenarios is discussed in the WP2 Working Paper in Annex 2. Figure 9 Natural areas, changes in 2000-2060. In green areas already occupied by the land use in 2000, in red
areas no longer occupied by the land use in 2060, in blue new areas occupied by the land use in 2060.
Four spatial indicators
With a view to emphasize specific characteristics of the forecasted development, four selected indicators are computed by the CCA model in parallel to land use. Like land use, these indicators are computed on a yearly time step and are available in the model as maps, but are also aggregated per arrondissement and for the whole of Belgium. They thus can be consulted as time graphs showing their evolution over time. The selected indicators are: (1) Degree of urbanisation; (2) Urban pressure on agricultural land; (3) Cluster size of urbanised area; and (4) Cluster size of open spaces. All indicators are discussed in WP2 Working Paper in Annex 2. As an example the urban pressure on agricultural land is presented. Urban pressure on agricultural land is computed as the percentage of urbanised cells in a circular area with radius 1.5 km positioned around each cell occupied by an agricultural land use. The higher the value of the indicator, the more the agricultural land is enclosed or fragmented by urban land uses. The agricultural activity therefore can be assumed to be under a pressure of urbanisation (Figure 10). LEE and LES differ strongly for as far as urban pressure on agricultural land is concerned (Figure 11). This is due to the low density of the urban tissue in LEE and hence the larger amount of urban cells as compared to the compact and high density character of LES. Especially in Western Flanders province there is less urban pressure on the agricultural land in both GES and LES. The same applies for northern Antwerp and Limburg provinces.
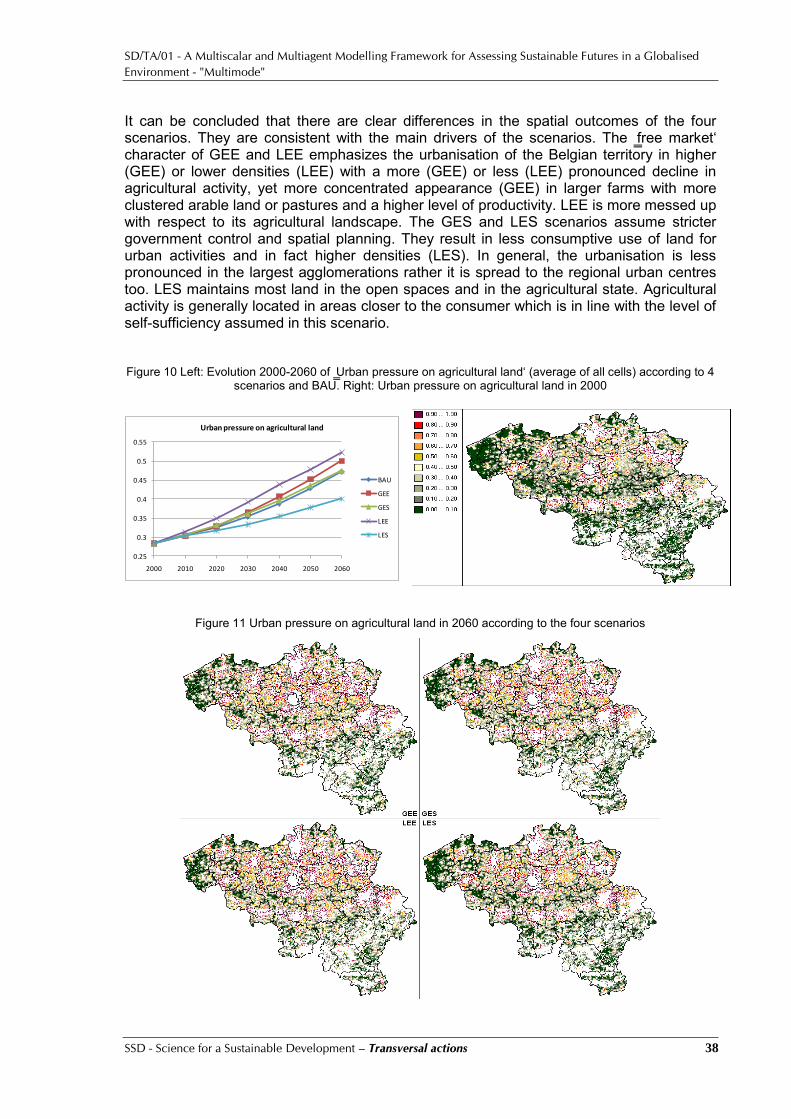
SD/TA/01 - A Multiscalar and Multiagent Modelling Framework for Assessing Sustainable Futures in a Globalised
Environment - "Multimode"
SSD - Science for a Sustainable Development – Transversal actions 38
It can be concluded that there are clear differences in the spatial outcomes of the four scenarios. They are consistent with the main drivers of the scenarios. The ‗free market‘ character of GEE and LEE emphasizes the urbanisation of the Belgian territory in higher (GEE) or lower densities (LEE) with a more (GEE) or less (LEE) pronounced decline in agricultural activity, yet more concentrated appearance (GEE) in larger farms with more clustered arable land or pastures and a higher level of productivity. LEE is more messed up with respect to its agricultural landscape. The GES and LES scenarios assume stricter government control and spatial planning. They result in less consumptive use of land for urban activities and in fact higher densities (LES). In general, the urbanisation is less pronounced in the largest agglomerations rather it is spread to the regional urban centres too. LES maintains most land in the open spaces and in the agricultural state. Agricultural activity is generally located in areas closer to the consumer which is in line with the level of self-sufficiency assumed in this scenario. Figure 10 Left: Evolution 2000-2060 of ‗Urban pressure on agricultural land‘ (average of all cells) according to 4
scenarios and BAU. Right: Urban pressure on agricultural land in 2000
Figure 11 Urban pressure on agricultural land in 2060 according to the four scenarios
0.25
0.3
0.35
0.4
0.45
0.5
0.55
2000 2010 2020 2030 2040 2050 2060
Urban pressure on agricultural land
BAU
GEE
GES
LEE
LES

SD/TA/01 - A Multiscalar and Multiagent Modelling Framework for Assessing Sustainable Futures in a Globalised
Environment - "Multimode"
SSD - Science for a Sustainable Development – Transversal actions 39
6.2.4 The variable-grid activity-based CA land use model In the course of the project, the question arose whether a variant of the CCA modelling concept could be developed which would be more transparent and simpler to implement, yet easier to integrate with the ABM-approach of WP3. Such variant should (1) get rid of the layered structure of the CCA in order to represent more closely the true, bottom-up processes responsible for structuring space, thus embodying the decisions of individual agents resulting in the macroscopic, morphological structures that we associate with clusters of occupation and activity in cities and regions. It should also (2) reflect the fact that not land use itself, rather the activity carried out in a location is responsible for structuring space. Finally it should (3) represent the fact that agents behave locally, but base their decision making and actions on information about distant places too, be it that the latter information is treated more globally and gets less importance with increasing distance. As a result, in WP2, an activity-based variable-grid CA model was developed. The variable-grid is the answer to the criteria 1 and 3, while the activity-based approach is the answer to the criterion 2. Contrary to the fixed-grid CCA, which CA-neighbourhood is limited to the 196 nearest cells, the variable-grid CA applies a CA-neighbourhood consisting of the full modelled area. It is defined in terms of cells which become progressively larger towards the periphery of the neighbourhood, so that the number of cells in the neighbourhood remains small even though the neighbourhood always covers the entire modelled area. Larger cells are in fact summed or averaged values of the base layer cells that behave like entities in the CA-neighbourhood. Moreover, in MultiMode the application of an activity-based variable-grid Cellular Automata model (AB-CA) is developed as an alternative to the classic CCA. In the latter, the state variables in the model are no longer the dominant land use of the individual cells, rather the density of each activity (residential, economic and natural) present in the cell. The model determines, at each iteration, the activity levels in the various functions modelled on each cell as a function of activity levels in the entire surrounding area (i.e. all of Belgium), as well as other factors such as the inherent suitability of the cell for the activity, accessibility to the transport system, land use regulations, and externalities such as congestion costs and land prices. Based on the relative representation of each activity, the dominant land use is defined. The AB-CA land use model thus combines the characteristics of cellular automata models (as it operates on individual cellular entities) and traditional gravity based models (as it features spatial interactions spanning the entire territory and its variables represent activities). For the in depth comparative analysis of its performance and behaviour, the AB-CA is applied on the high-quality dataset for the larger Dublin area available from the MOLAND project and the EU Joint Research Centre in Ispra, Italy. For Dublin a layered fixed-grid CA land use model similar to that developed in WP2 for Belgium is available (Engelen et al., 2007). In parallel, the AB-CA is applied to the datasets gathered for Belgium in WP2 and the context of the CCA. Additional data required for its application include population and employment at the place of work in the various economic sectors at the finest administrative scale. For the population these are the statistical sectors and for the employment the municipalities. The analysis is to enable a clear statement with regards to the applicability of the type of model for polycentric areas with a mixed and messy land use like Belgium. Technical details of the AB-CA and the results of its application, calibration and validation to both Dublin and Belgium are available in WP2 Working Paper in Annex 2 as well as in a paper submitted for publication (White et al., submitted).
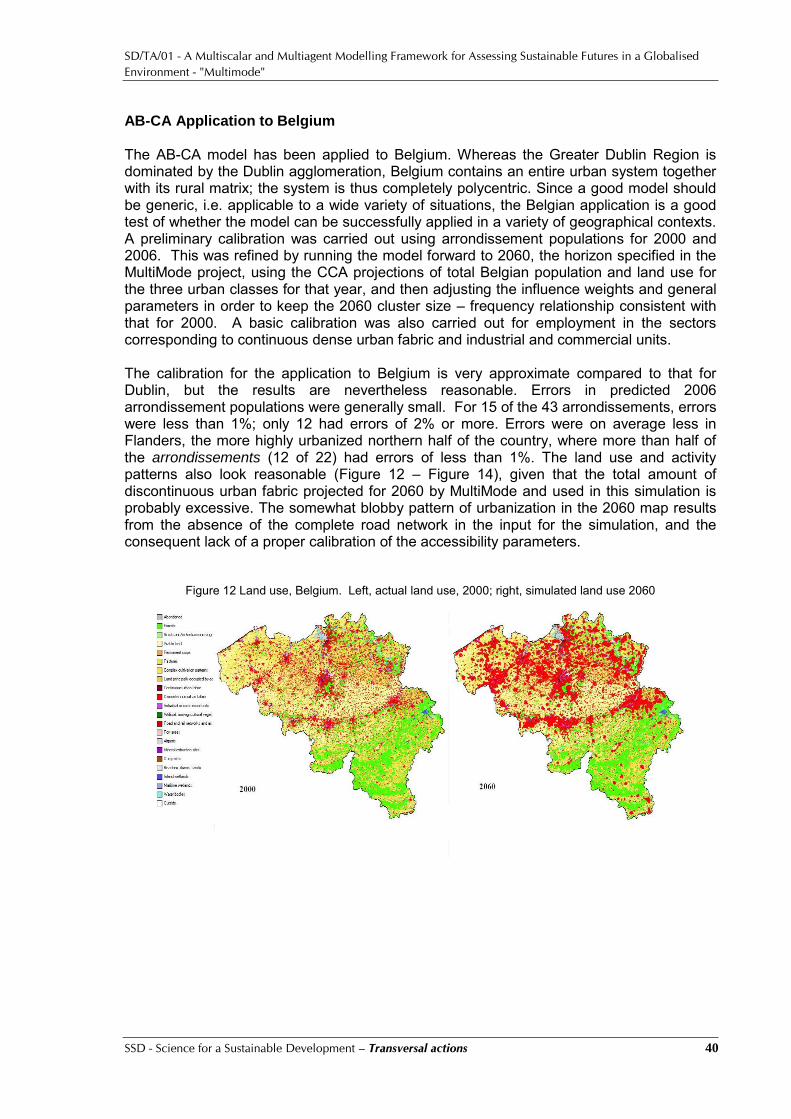
SD/TA/01 - A Multiscalar and Multiagent Modelling Framework for Assessing Sustainable Futures in a Globalised
Environment - "Multimode"
SSD - Science for a Sustainable Development – Transversal actions 40
AB-CA Application to Belgium The AB-CA model has been applied to Belgium. Whereas the Greater Dublin Region is dominated by the Dublin agglomeration, Belgium contains an entire urban system together with its rural matrix; the system is thus completely polycentric. Since a good model should be generic, i.e. applicable to a wide variety of situations, the Belgian application is a good test of whether the model can be successfully applied in a variety of geographical contexts. A preliminary calibration was carried out using arrondissement populations for 2000 and 2006. This was refined by running the model forward to 2060, the horizon specified in the MultiMode project, using the CCA projections of total Belgian population and land use for the three urban classes for that year, and then adjusting the influence weights and general parameters in order to keep the 2060 cluster size – frequency relationship consistent with that for 2000. A basic calibration was also carried out for employment in the sectors corresponding to continuous dense urban fabric and industrial and commercial units. The calibration for the application to Belgium is very approximate compared to that for Dublin, but the results are nevertheless reasonable. Errors in predicted 2006 arrondissement populations were generally small. For 15 of the 43 arrondissements, errors were less than 1%; only 12 had errors of 2% or more. Errors were on average less in Flanders, the more highly urbanized northern half of the country, where more than half of the arrondissements (12 of 22) had errors of less than 1%. The land use and activity patterns also look reasonable (Figure 12 – Figure 14), given that the total amount of discontinuous urban fabric projected for 2060 by MultiMode and used in this simulation is probably excessive. The somewhat blobby pattern of urbanization in the 2060 map results from the absence of the complete road network in the input for the simulation, and the consequent lack of a proper calibration of the accessibility parameters.
Figure 12 Land use, Belgium. Left, actual land use, 2000; right, simulated land use 2060
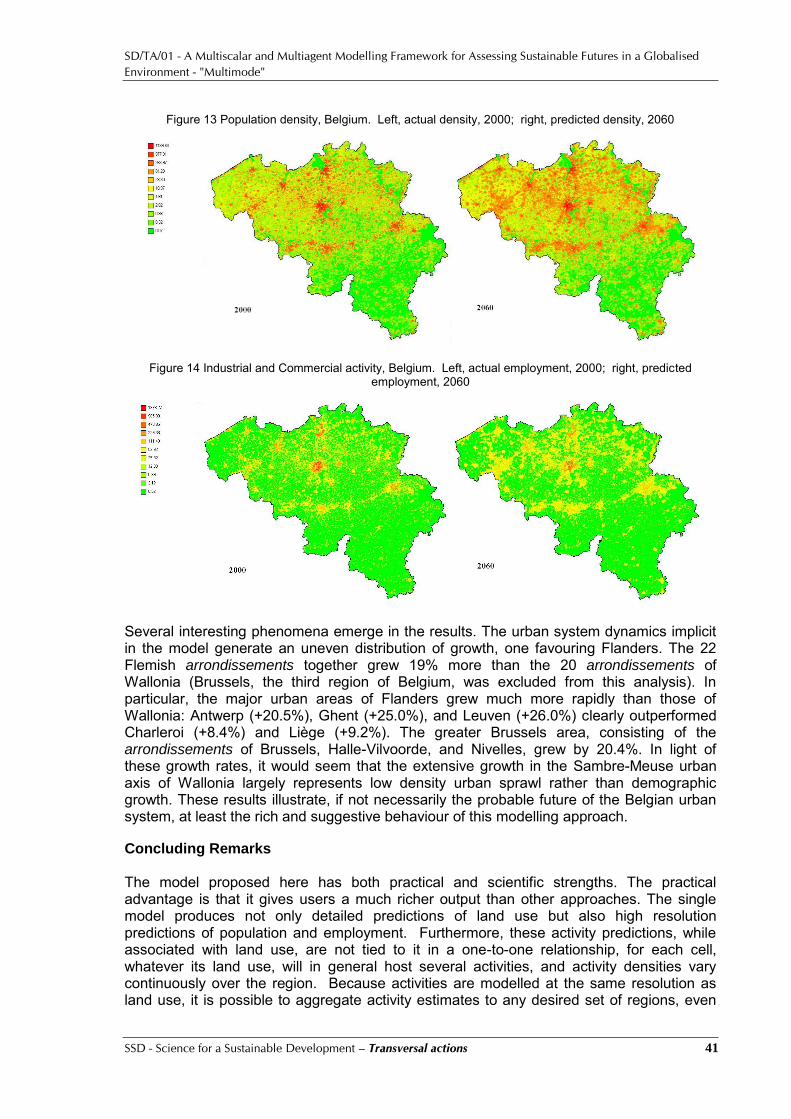
SD/TA/01 - A Multiscalar and Multiagent Modelling Framework for Assessing Sustainable Futures in a Globalised
Environment - "Multimode"
SSD - Science for a Sustainable Development – Transversal actions 41
Figure 13 Population density, Belgium. Left, actual density, 2000; right, predicted density, 2060
Figure 14 Industrial and Commercial activity, Belgium. Left, actual employment, 2000; right, predicted employment, 2060
Several interesting phenomena emerge in the results. The urban system dynamics implicit in the model generate an uneven distribution of growth, one favouring Flanders. The 22 Flemish arrondissements together grew 19% more than the 20 arrondissements of Wallonia (Brussels, the third region of Belgium, was excluded from this analysis). In particular, the major urban areas of Flanders grew much more rapidly than those of Wallonia: Antwerp (+20.5%), Ghent (+25.0%), and Leuven (+26.0%) clearly outperformed Charleroi (+8.4%) and Liège (+9.2%). The greater Brussels area, consisting of the arrondissements of Brussels, Halle-Vilvoorde, and Nivelles, grew by 20.4%. In light of these growth rates, it would seem that the extensive growth in the Sambre-Meuse urban axis of Wallonia largely represents low density urban sprawl rather than demographic growth. These results illustrate, if not necessarily the probable future of the Belgian urban system, at least the rich and suggestive behaviour of this modelling approach.
Concluding Remarks The model proposed here has both practical and scientific strengths. The practical advantage is that it gives users a much richer output than other approaches. The single model produces not only detailed predictions of land use but also high resolution predictions of population and employment. Furthermore, these activity predictions, while associated with land use, are not tied to it in a one-to-one relationship, for each cell, whatever its land use, will in general host several activities, and activity densities vary continuously over the region. Because activities are modelled at the same resolution as land use, it is possible to aggregate activity estimates to any desired set of regions, even

SD/TA/01 - A Multiscalar and Multiagent Modelling Framework for Assessing Sustainable Futures in a Globalised
Environment - "Multimode"
SSD - Science for a Sustainable Development – Transversal actions 42
quite small ones, and spatially detailed activity predictions can be particularly useful for planners. Of course the smaller the regions, the larger, on average, the prediction errors will be, so there is a trade-off between resolution and accuracy, or to put it another way, between spatial and quantitative error. The Dublin application demonstrates that the model performs well enough to be useful as a planning tool. In fact it outperforms existing models like the Moland model. The model performs well not only for the urban centred region of Dublin, but also for the polycentric, national scale application to Belgium, even though because of data limitations, it is not yet possible to fully calibrate the Belgian application. The fact that the model gives good results in both of these very different settings is a strong indication that it captures the generic spatial processes that underlie the formation of spatial structure in urban and regional systems. Such a model is one that can be more confidently applied to other cases. The AB-CA framework is efficient, not only in the sense that a single generic model can be applied to a wide variety of situations, but also in that it models two different classes of phenomena—land use and activities—with a single mechanism. It thus replaces the two types of models that were developed to deal with these phenomena independently, as well as the hybrid model CCA created by linking those models. In doing so it produces richer results with a simpler algorithmic structure and fewer parameters. 6.3 WP3: Landscape Scale Agent-Based Model of Decision Rules 6.3.1 Introduction to WP3 Models of multi-agent systems are designed to integrate complex processes. The concept of multi-agent systems, which originated in the computer sciences (i.e. artificial intelligence research) in the 1970s, has gained popularity in the social sciences, for example, to link human and natural systems at both spatial and temporal scales so as to understand changes in land cover and land use change. Matthews et al. (2007) reviewed the applications of agent-based land use models from the early 1990s to 2006 covering the issues on policy analysis and planning, participatory modelling, explaining spatial patterns of land use or settlement, testing social science concepts and explaining land use functions. Many studies on agricultural land use change are however not based on empirical data, thus ignoring the inherent diversity of farmers and their farms (Valbuena 2008). Janssen and Ostrom (2006) discuss the challenges of the empirical application of agent-based models (ABM) in contemporary social sciences. Despite these challenges, more recent studies have used empirical data to capture land use decision processes as they occur in practice (e.g. Huigen 2004 ; Acosta-Michlik and Espaldon 2008; Valbuena 2009, Mena et al. 2010; Naivinit 2010; Polhill et al. 2010; Saqalli et al. 2010). These studies seek to take advantage of the key strengths of ABM in capturing the heterogeneity of agents, the dynamics of their interactions and their behaviour in response to the geography of physical space. These attributes are especially useful when exploring land use change futures, where farmer decisions are influenced not only by changes in the economic and climatic environments, but also by their social and cultural values. Considering the complexity of combining comprehensive knowledge on social, ecological and economic decisions of groups of agents with heterogeneous attributes in a single model, we constructed an agent-based model (ABM) in two steps. The first step dealt with the construction of a prototype-ABM, which aim to make operational the conceptual framework introduced above for assessing sustainability and to make a realistic representation of the social, physical and economic environment of the agents in the case

SD/TA/01 - A Multiscalar and Multiagent Modelling Framework for Assessing Sustainable Futures in a Globalised
Environment - "Multimode"
SSD - Science for a Sustainable Development – Transversal actions 43
study area. We interviewed farmers and planners to gain an initial understanding of not only the economic, but also the social and ecological considerations on land use change decisions. The second step aimed to develop a calibrated-ABM that integrates the results of the survey and results from other Work Packages (i.e. WP1 on scenario development and WP2 on cellular automata) of the project. The survey seeks to: (a) increase the number of farmer respondents and thus allow the development of statistically tested farmer typologies and decision rules, and (b) estimate preference weights for economic, social and environmental dimensions of land use decisions. The first objective was aimed at improving the representation of the social environment of the farmers in the case study area. The last objective intended to extend the empirical application of utility maximization in the calibrated-ABM beyond the narrow limits of economic theories through inclusion of non-economic parameters. Finally, in the second step of the ABM modelling, the representation of the physical environment was also improved by using physical constraints that are based on the cellular automata-based (CA) land use model for Belgium. The simulation results of the CA model from the Work Package 2 generated urbanization trends to inform the ABM how much of the land, which are currently used for agriculture will decrease in the future. To ensure consistency between the calibrated-ABM and its model inputs, the ABM and CA models used the same scenario storylines in the simulations runs. Detailed descriptions of CA models are available in the Working Paper for Work Package 2. The ABM presented here required three categories of input data: (1) agent parameters; (2) market parameters; and (3) landscape parameters. Market parameters are trends in economic variables affecting the land use decisions of the farmers including prices, yields and costs. The agent parameters were estimated from statistical analyses (i.e. cluster, conjoint) of the data collected from the personal interviews and field survey. Details on data collection methods are presented in section 5.4.2 (i.e. discussion on WP4). The landscape parameters are physical variables that could constrain the choices of activities on the farm. The market and landscape parameters were mainly drawn from Work Packages 1 and 2, respectively. 6.3.2 The agent parameters (link to WP4) Farmer typologies Farmer typologies are increasingly developed to capture heterogeneity of farmers and diversity in farm decisions in agent-based land use research. Following the stepwise construction of the agent-based model, the farmer typologies were also developed in two stages. The first stage developed farmer typologies using a descriptive analysis of the results from interviews with farmers in the case study area. Two types of typologies were created from the qualitative analysis of the interview results, one relating to AEM participation styles and the other to land use decisions. Among the information collected to build the former typology type include motivations for applying AEM, practical experiences in AEM application, suggestions for improving AEM design and distribution, the role of communications with advisors, other farmers and the public, and future intentions on AEM application. The latter farm typology was built on information relating to the decisions for changing land use in the past, adaptive responses to the impacts of global environmental changes (e.g. decrease in yield due to climate change, decrease in prices due to global trade), influence of social network (e.g. neighbours decisions), and responses to the changes in AEM technical and financial support. Four types of farmer typologies for both AEM participation styles and land use decisions were identified from the interview results. Conservative, innovative, follower and adaptive behaviour are the typologies identified for

SD/TA/01 - A Multiscalar and Multiagent Modelling Framework for Assessing Sustainable Futures in a Globalised
Environment - "Multimode"
SSD - Science for a Sustainable Development – Transversal actions 44
farmers‘ land use decisions, whilst opportunist, modifying, catalysing and engaged participation were classified based on the AEM participation. Farmers with different typologies make different decisions because of their differences in human attributes and personal motivations. Farmers‘ land use decisions are presented in ABM as rule-based (i.e. ―if-and-then‖) statements, which creates the dynamics in the model. The rule-based statements or ―decision rules‖ of the farmers belonging to different typologies were generated from the qualitative analysis of the interview results. The following are examples of decisions rules identified for the combined typologies: Conservative-opportunist: The farmer will continue his current land use and uncertain about
decision to continue applying AEM given the current market and policy conditions. If subsidies are reduced, then he will stop applying AEM.
Conservative-modifying: The farmer will not change his land use and farming practices, primarily due to old age. If subsidies will increase, he will not implement new AEM. If subsidies of his current AEM decrease, then he will stop applying it.
Conservative-catalysing: The farmer will continue his current land use. He will apply environmental management beyond the AEM requirements if constraints in the system diminish and if subsidies increase. If technical advice on AEM is not available anymore, then he will stop applying AEM.
Adaptive-opportunist: The farmer will change land use based on market prices and economic profits. If income from bio-energy crops will increase, then he will adopt it. He will apply AEM only if it does not require changes in his land use and farming practices. AEM should not interfere with his farming practices.
Adaptive-modifying: The farmer will change land use based on market prices and economic profits. He will apply AEM only if fits with his current land use and farming practices. He will stop applying current AEM if rules on its application change. If prices of cereals increase, and AEM is not anymore profitable, he will stop applying AEM.
Adaptive-catalysing: The farmer will change land use based on market prices and economic profits. He will adopt bio-energy crops only due to its profitability, but also if he is convinced of the positive environmental effects. He will continue his AEM even without advisers and would shift to AEM that is easy to apply if subsidies diminish.
Innovative-catalysing: The farmer will try new land use that is less labour intensive. He will adopt bio-energy crops at a large scale. He will try new AEM, and will definitely do more if subsidies increase. He will not stop applying AEM even if subsidies diminish due its contribution to public satisfaction in terms improved landscape.
Innovative-engaged: The farmer will shift to organic farming in a near future and also produce bio-energy crops. His AEM is linked to land use (management), like shifting to spring cereals. He will do more AEM in the future and will continue even if subsidies stop. He will encourage other farmers to do the same.
These decision rules were validated through the statistical analysis of the survey results. The study area for the mail survey was the larger area of the river Dyle‘s catchment located in the provinces of Vlaams Brabant (Flanders, 13 municipalities) and Brabant Walloon (Walloon region, 14 municipalities). Table 6 describes the survey response in the case study areas.

SD/TA/01 - A Multiscalar and Multiagent Modelling Framework for Assessing Sustainable Futures in a Globalised
Environment - "Multimode"
SSD - Science for a Sustainable Development – Transversal actions 45
Table 6 Description of the survey response in the case study regions
To match the results of the qualitative analysis, we preselected 4 clusters in the analysis of land use decisions. The distribution of the farmers into these clusters is presented in Figure 15. Cluster 4 accounts for the largest number of the farmers (32.9 percent) and cluster 4 the smallest (16 percent). Each cluster 2 and 3 account for a quarter of the total number of the surveyed farmers. Thus, there is a good distribution of the survey respondents between the different clusters.
Figure 15 Distribution of the farmers into the four clusters of land use decisions
Table 7 compares the average values of the most statistically significant variables (They were identified through factor components analysis.) in the different cluster groups. Among the variables defining farmer characteristics, the average farm area shows a large contrast among the clusters, with Cluster 4 accounting for as high 64 hectares and Cluster 1 as low as 41 hectares. The ownership of land also shows a large variation among the four clusters, with Cluster 2 owning as high as 47 percent of the farm and Cluster 3 owning as low as 33 percent. Among the variables defining farm characteristics, the areas planted to cereals provide a variation of about 1 to 4 hectares between the four clusters. The breeding of cattle is responsible for a large variation in socio-economic attributes of the farmers, ranging from 49 to 80 heads of cattle. However, Clusters 1 and 2 have an equal number of cattle (49), making the variable cattle breeding less important for differentiating across clusters. Other variables for farm characteristics, which have close values for at least two clusters include sugar beet (ca. 8 hectares for Clusters 1, 2 and 3), silage maize (ca. 7 hectares for Clusters 3 and 4), permanent pasture (ca. 10 hectares for Clusters 2, 3 and 4). The relevance of these variables for defining the typologies will be further discussed below in the section on land use decisions.
First Round Second Round Total First Round Second Round AllWalloon 597 72 85 157 12,06 12,06 26,30Flanders 574 48 32 80 8,36 8,36 13,94Total 1171 120 117 237 10,25 10,25 20,24
Response Rate (%)Number ResponseRegions Survey sent

SD/TA/01 - A Multiscalar and Multiagent Modelling Framework for Assessing Sustainable Futures in a Globalised
Environment - "Multimode"
SSD - Science for a Sustainable Development – Transversal actions 46
Table 7 Comparison of selected farmer and farm characteristics in the different clusters
Code Variables Cluster 1 Cluster 2 Cluster 3 Cluster 4 Total
Farmer characteristics (average values)
qI01 Total farm area (ha) 47,55 44,70 41,95 64,35 51,46
qI02_1 Percent of owned land 35,52 47,51 33,00 38,44 39,07
qI02_2 Percent of rented land 73,93 65,71 73,55 70,17 70,68
qI03 Number of farm parcels 22,48 25,49 23,09 22,36 23,29
qI04 Years farming 22,16 26,65 27,31 22,53 24,19
qI05 Retirement age 65,62 65,81 66,68 63,72 65,12
Farm characteristics (average hectare or heads)
qII01_2 Winter cereals 25,03 22,33 21,94 30,41 25,95
qII01_3 Sugar beet 8,50 8,83 8,84 10,76 9,54
qII01_4 Potato 8,020 6,599 4,373 12,951 9,318
qII01_10 Silage maize 6,63 5,91 7,81 7,25 6,85
qII01_11 Permanent pasture 8,76 10,00 9,62 10,90 9,87
qII01_19 Dairy cattle 47,20 43,57 31,00 40,71 42,29
qII01_18 Cattle breeding 49,57 49,08 82,40 93,50 70,19
Farmer preferences Conjoint analysis (also known as choice models or experiments) is a practical technique not only for measuring preferences. This is a technique widely used in different scientific fields including psychology, transport, economics, and environment to transform subjective choice responses into estimated parameters. The theoretical basis for conjoint analysis is the random utility theory, which describes the choice behaviour of an agent in a utility maximizing framework. Like other preference-based methods, conjoint analysis assumes that individuals are the best judges of their own well-being and make decisions to improve this well-being (i.e. maximum utility). The combinations of attributes and levels, which are the basis of the respondents‘ choices and of the statistical estimation of preferences, are designed by the analysts. Table 8 presents the attributes and levels used in the project to develop the choice tasks for the survey questionnaire. A choice task consists of different options, and each option in a task presents specific level of an attribute. Figure 16 presents an example of a choice task in the survey questionnaire for conjoint analysis and a description of the choice task. The farmers were presented 5 choice tasks and in the conjoint questionnaire we referred to each task as ―scenario‖. The conjoint questionnaire was included in the survey, which were used to collect data for the cluster analysis (see above). Table 9 presents the relative importance of the different land use decision attributes across the various clusters. The choice of farm activities is the most important attribute to land use decisions accounting for more than 40 percent. Clusters 1 and 2 reveal the highest preference on farm activities when making land use decisions. After farm activities, the level of income turns out to be the most important consideration in land use decisions for all the clusters. Among the four clusters, Cluster 1 is least concern about the change in income when making land use decisions. Social feedback and environmental impact receive almost equal importance for all clusters with values ranging from 10 to 11 percent. Cluster 2 is most concerned about social feedback, whilst Cluster 1 about environmental impact. The level of risk is the least important attribute for land use decisions, followed by the effort required to engage in land use. Cluster 4 is the least risk averse.
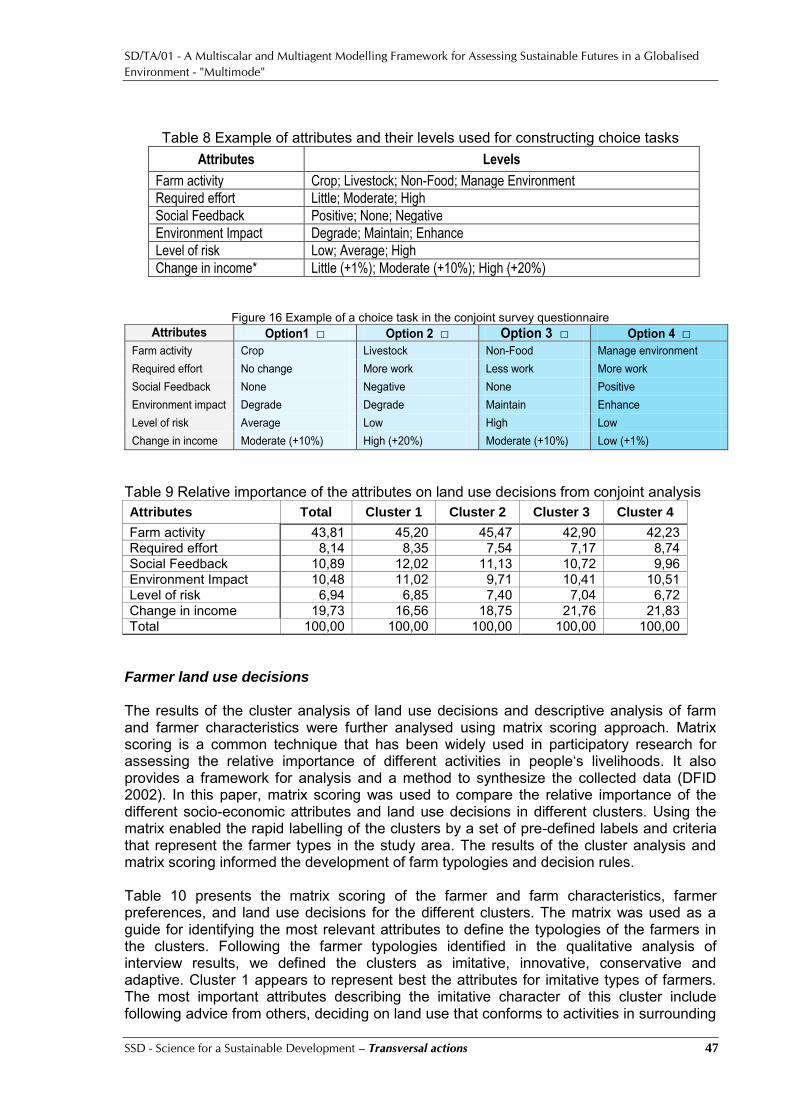
SD/TA/01 - A Multiscalar and Multiagent Modelling Framework for Assessing Sustainable Futures in a Globalised
Environment - "Multimode"
SSD - Science for a Sustainable Development – Transversal actions 47
Table 8 Example of attributes and their levels used for constructing choice tasks
Attributes Levels
Farm activity Crop; Livestock; Non-Food; Manage Environment
Required effort Little; Moderate; High
Social Feedback Positive; None; Negative
Environment Impact Degrade; Maintain; Enhance
Level of risk Low; Average; High
Change in income* Little (+1%); Moderate (+10%); High (+20%)
Figure 16 Example of a choice task in the conjoint survey questionnaire Attributes Option1 □ Option 2 □ Option 3 □ Option 4 □
Farm activity Crop Livestock Non-Food Manage environment
Required effort No change More work Less work More work
Social Feedback None Negative None Positive
Environment impact Degrade Degrade Maintain Enhance
Level of risk Average Low High Low
Change in income Moderate (+10%) High (+20%) Moderate (+10%) Low (+1%)
Table 9 Relative importance of the attributes on land use decisions from conjoint analysis Attributes Total Cluster 1 Cluster 2 Cluster 3 Cluster 4
Farm activity 43,81 45,20 45,47 42,90 42,23 Required effort 8,14 8,35 7,54 7,17 8,74 Social Feedback 10,89 12,02 11,13 10,72 9,96 Environment Impact 10,48 11,02 9,71 10,41 10,51 Level of risk 6,94 6,85 7,40 7,04 6,72 Change in income 19,73 16,56 18,75 21,76 21,83 Total 100,00 100,00 100,00 100,00 100,00
Farmer land use decisions The results of the cluster analysis of land use decisions and descriptive analysis of farm and farmer characteristics were further analysed using matrix scoring approach. Matrix scoring is a common technique that has been widely used in participatory research for assessing the relative importance of different activities in people‘s livelihoods. It also provides a framework for analysis and a method to synthesize the collected data (DFID 2002). In this paper, matrix scoring was used to compare the relative importance of the different socio-economic attributes and land use decisions in different clusters. Using the matrix enabled the rapid labelling of the clusters by a set of pre-defined labels and criteria that represent the farmer types in the study area. The results of the cluster analysis and matrix scoring informed the development of farm typologies and decision rules. Table 10 presents the matrix scoring of the farmer and farm characteristics, farmer preferences, and land use decisions for the different clusters. The matrix was used as a guide for identifying the most relevant attributes to define the typologies of the farmers in the clusters. Following the farmer typologies identified in the qualitative analysis of interview results, we defined the clusters as imitative, innovative, conservative and adaptive. Cluster 1 appears to represent best the attributes for imitative types of farmers. The most important attributes describing the imitative character of this cluster include following advice from others, deciding on land use that conforms to activities in surrounding
SD/TA/01 - A Multiscalar and Multiagent Modelling Framework for Assessing Sustainable Futures in a Globalised
Environment - "Multimode"
SSD - Science for a Sustainable Development – Transversal actions 48
farms, observing popular land use in the province and searching information from farmers and administrations. Unlike in other clusters, farmers in Cluster 1 would be willing to buy land being sold by its neighbour. These motivations and considerations in land use decisions are exclusively important for farmers in Cluster 1. Hence, unlike in the qualitative analysis from which no concrete evidence about the existence of imitative farmers, the quantitative analysis shows that some farmers exhibit strong imitative character. Another important indication for defining the imitative character of Cluster 1 is the irrelevance of comparing prices and calculating expected income in land use decisions. It is the only cluster that does manifest such behaviour. Moreover, the results of the conjoint analysis confirm that imitative farmers are high risk averse.
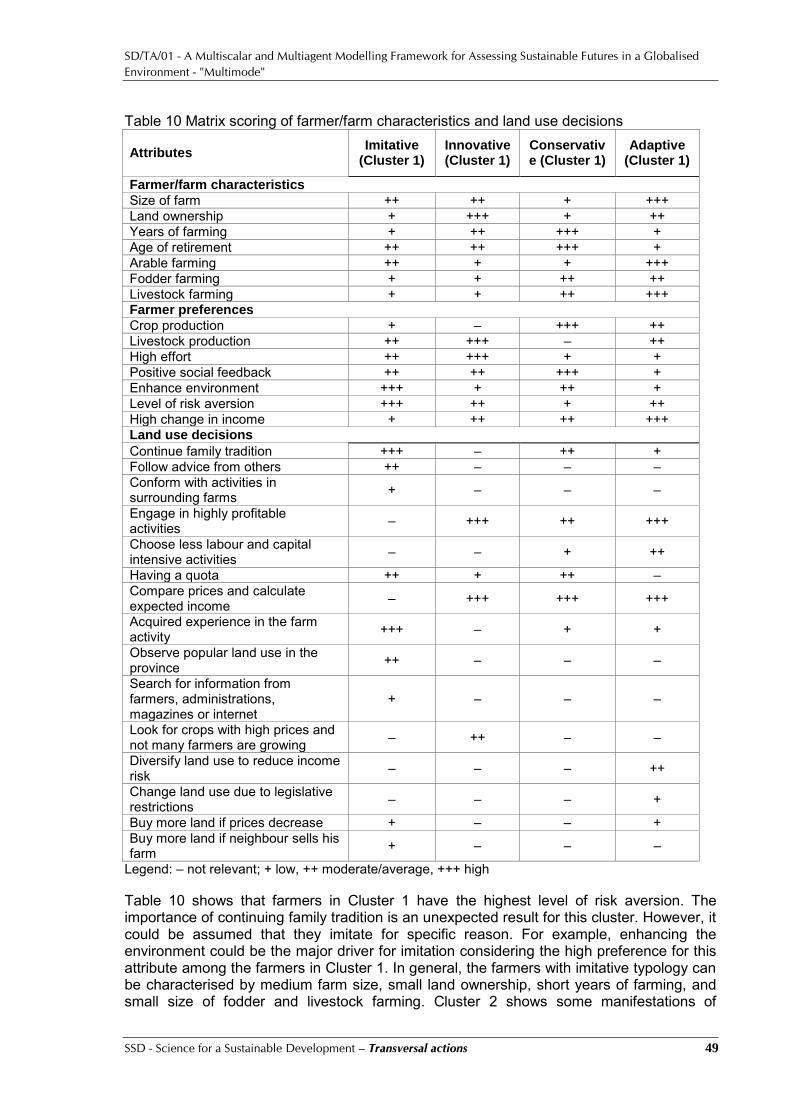
SD/TA/01 - A Multiscalar and Multiagent Modelling Framework for Assessing Sustainable Futures in a Globalised
Environment - "Multimode"
SSD - Science for a Sustainable Development – Transversal actions 49
Table 10 Matrix scoring of farmer/farm characteristics and land use decisions
Attributes Imitative
(Cluster 1) Innovative (Cluster 1)
Conservative (Cluster 1)
Adaptive (Cluster 1)
Farmer/farm characteristics Size of farm ++ ++ + +++ Land ownership + +++ + ++ Years of farming + ++ +++ + Age of retirement ++ ++ +++ + Arable farming ++ + + +++ Fodder farming + + ++ ++ Livestock farming + + ++ +++ Farmer preferences Crop production + – +++ ++ Livestock production ++ +++ – ++ High effort ++ +++ + + Positive social feedback ++ ++ +++ + Enhance environment +++ + ++ + Level of risk aversion +++ ++ + ++ High change in income + ++ ++ +++ Land use decisions Continue family tradition +++ – ++ + Follow advice from others ++ – – – Conform with activities in surrounding farms + – – –
Engage in highly profitable activities – +++ ++ +++
Choose less labour and capital intensive activities – – + ++
Having a quota ++ + ++ – Compare prices and calculate expected income – +++ +++ +++
Acquired experience in the farm activity +++ – + +
Observe popular land use in the province ++ – – –
Search for information from farmers, administrations, magazines or internet
+ – – –
Look for crops with high prices and not many farmers are growing – ++ – –
Diversify land use to reduce income risk – – – ++
Change land use due to legislative restrictions – – – +
Buy more land if prices decrease + – – + Buy more land if neighbour sells his farm + – – –
Legend: – not relevant; + low, ++ moderate/average, +++ high
Table 10 shows that farmers in Cluster 1 have the highest level of risk aversion. The importance of continuing family tradition is an unexpected result for this cluster. However, it could be assumed that they imitate for specific reason. For example, enhancing the environment could be the major driver for imitation considering the high preference for this attribute among the farmers in Cluster 1. In general, the farmers with imitative typology can be characterised by medium farm size, small land ownership, short years of farming, and small size of fodder and livestock farming. Cluster 2 shows some manifestations of
SD/TA/01 - A Multiscalar and Multiagent Modelling Framework for Assessing Sustainable Futures in a Globalised
Environment - "Multimode"
SSD - Science for a Sustainable Development – Transversal actions 50
innovative character, the most important of which are (1) looking for crops with high prices and not many farmers are growing, and (2) engaging in highly profitable activities. So the motivations for innovation are highly influence by the increase in income rather than enhancement of the environment, as shown by the low preference for enhancing environment. Farmers with innovative character prefer livestock than crop production and they are willing to exert more effort in the farming activities to achieve their economic goals. The continuation of family tradition is not relevant for Cluster 2, which can be expected in innovative types of farmers. The most important characteristics of innovative farmers are medium size of farm, which they mainly own, and moderate years of farming and moderate age of retirement. Farmers in Cluster 3 can be defined as conservative because they have the longest farming experience and oldest retirement age, and put a relatively high value on keeping the family tradition (Table 10). They prefer crop production, which could be considered a more traditional farming activity than livestock production. More important manifestation of conservative character is perhaps the preference given to positive social feedback. Farming with tradition has a good reputation to keep. Contrary to the qualitative analysis of farmer typologies, the diversification of land use to reduce income risk is not very relevant in Cluster 3. However, this should not necessarily be the case for traditional farms which keep their land use over a long period of time and thus do not easily diversify. As compared to farmers in other clusters, those in Cluster 3 own relatively small farms. Cluster 4 represents farmers with adaptive typologies because their considerations in land use decisions include high profitability of farming activities as well as comparing prices and calculating expected income from different land uses. Both considerations are responses to economic signals. Moreover, among all the clusters, Cluster 4 shows the highest preference for a high change in income. Positive social feedbacks and environmental impacts play very little role in the decisions of adaptive farmers. They diversify their land use to reduce income risk, and thus have a relatively high preference for both crop and livestock production. Farmers in Cluster 4 have the largest farm size as compared to other clusters. This is not surprising because the results of the cluster analysis show that they would be willing to buy more land if prices decrease. The quantitative analysis of farmer decisions to AEM participation was not straightforward due to differences in the agri-environmental schemes in Flanders and Walloon, but also due to overlap in the objectives of different schemes. The data coding required special attention in order to sensibly combine the data for both case study regions and across the schemes, otherwise statistical analysis can not be carried out due to sparse distribution of data. The AEM needs have been classified to make use of the available data for quantitative analysis. The results of the analysis revealed that the typologies on AEM participation do not directly correspond to those derived from the qualitative analysis and turned out to be more complex to combine with the typologies on land use decisions (see section 5.4.4). For these reasons, only the land use typologies were considered as agent parameters to the ABM and the AEMs are included in the list of farming activities.
6.3.3 Market parameters and scenarios (link to WP1) Land use pattern is influenced by the market condition, which in turn is influenced by policy- and climate-related changes in price and supply. In the ABM, farmers adapt their land use decisions on the changes in the market. Market parameters are thus an important input to the application of the model for land use analysis. These are income-related parameters including output prices, input prices or costs, and yields. The farmer agents in the model thus compute and compare income for possible alternative land uses and make decisions on the basis of these computations. To simulate how farmers will adapt to the
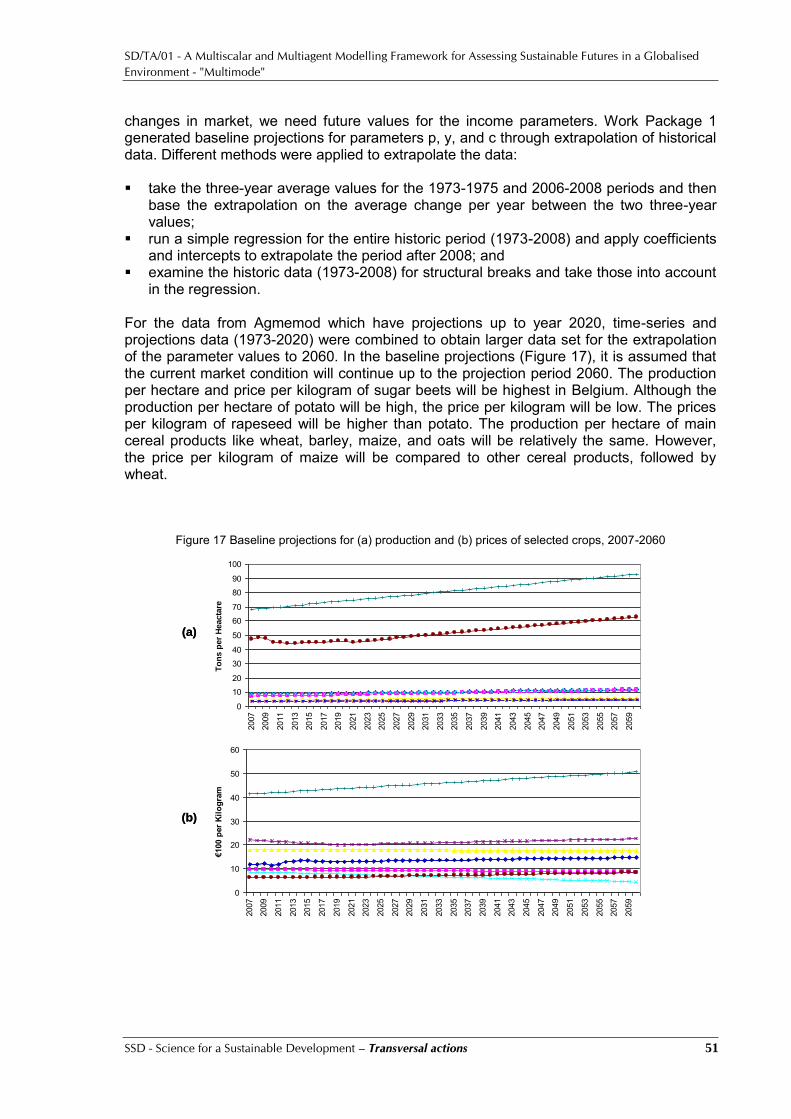
SD/TA/01 - A Multiscalar and Multiagent Modelling Framework for Assessing Sustainable Futures in a Globalised
Environment - "Multimode"
SSD - Science for a Sustainable Development – Transversal actions 51
changes in market, we need future values for the income parameters. Work Package 1 generated baseline projections for parameters p, y, and c through extrapolation of historical data. Different methods were applied to extrapolate the data: take the three-year average values for the 1973-1975 and 2006-2008 periods and then
base the extrapolation on the average change per year between the two three-year values;
run a simple regression for the entire historic period (1973-2008) and apply coefficients and intercepts to extrapolate the period after 2008; and
examine the historic data (1973-2008) for structural breaks and take those into account in the regression.
For the data from Agmemod which have projections up to year 2020, time-series and projections data (1973-2020) were combined to obtain larger data set for the extrapolation of the parameter values to 2060. In the baseline projections (Figure 17), it is assumed that the current market condition will continue up to the projection period 2060. The production per hectare and price per kilogram of sugar beets will be highest in Belgium. Although the production per hectare of potato will be high, the price per kilogram will be low. The prices per kilogram of rapeseed will be higher than potato. The production per hectare of main cereal products like wheat, barley, maize, and oats will be relatively the same. However, the price per kilogram of maize will be compared to other cereal products, followed by wheat.
Figure 17 Baseline projections for (a) production and (b) prices of selected crops, 2007-2060
0
10
20
30
40
50
60
70
80
90
100
2007
2009
2011
2013
2015
2017
2019
2021
2023
2025
2027
2029
2031
2033
2035
2037
2039
2041
2043
2045
2047
2049
2051
2053
2055
2057
2059
To
ns p
er
Heacta
re
wheat barley maize oats rapeseed potato sugar protein
0
10
20
30
40
50
60
2007
2009
2011
2013
2015
2017
2019
2021
2023
2025
2027
2029
2031
2033
2035
2037
2039
2041
2043
2045
2047
2049
2051
2053
2055
2057
2059
€100 p
er
Kil
og
ram
wheat barley maize oats rapeseed potato sugar protein
(a)
(b)
0
10
20
30
40
50
60
70
80
90
100
2007
2009
2011
2013
2015
2017
2019
2021
2023
2025
2027
2029
2031
2033
2035
2037
2039
2041
2043
2045
2047
2049
2051
2053
2055
2057
2059
To
ns p
er
Heacta
re
wheat barley maize oats rapeseed potato sugar protein
0
10
20
30
40
50
60
2007
2009
2011
2013
2015
2017
2019
2021
2023
2025
2027
2029
2031
2033
2035
2037
2039
2041
2043
2045
2047
2049
2051
2053
2055
2057
2059
€100 p
er
Kil
og
ram
wheat barley maize oats rapeseed potato sugar protein
(a)
(b)
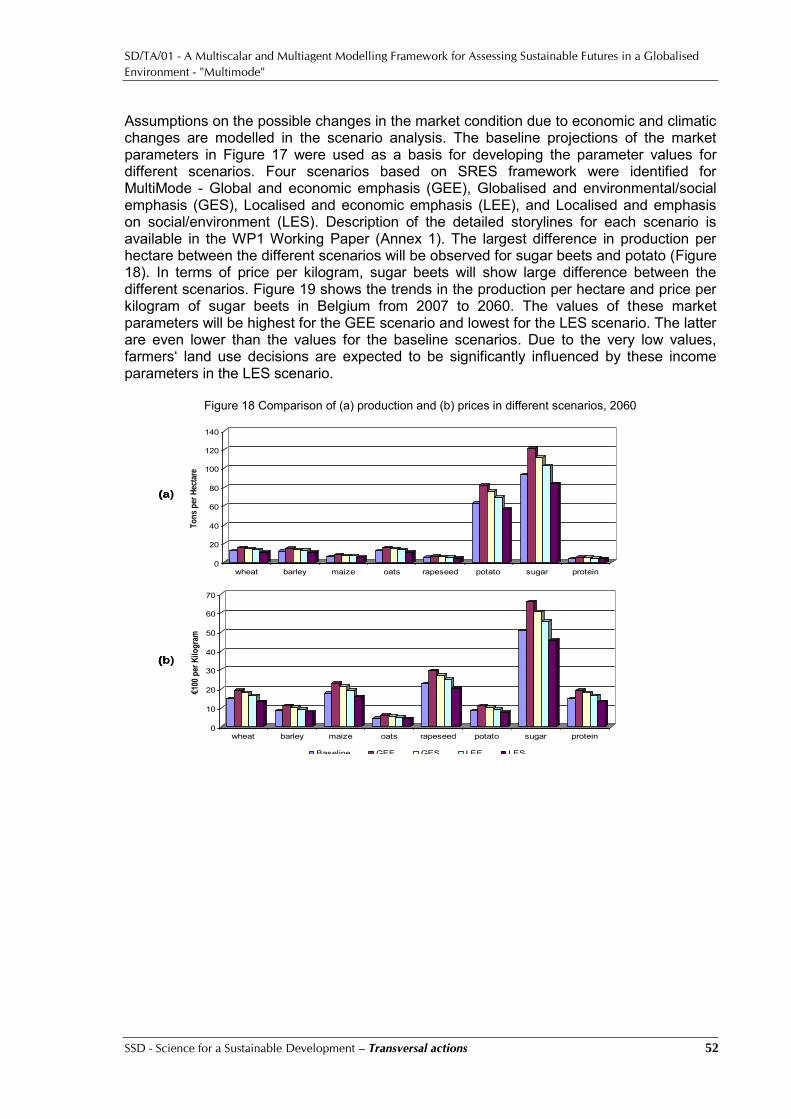
SD/TA/01 - A Multiscalar and Multiagent Modelling Framework for Assessing Sustainable Futures in a Globalised
Environment - "Multimode"
SSD - Science for a Sustainable Development – Transversal actions 52
Assumptions on the possible changes in the market condition due to economic and climatic changes are modelled in the scenario analysis. The baseline projections of the market parameters in Figure 17 were used as a basis for developing the parameter values for different scenarios. Four scenarios based on SRES framework were identified for MultiMode - Global and economic emphasis (GEE), Globalised and environmental/social emphasis (GES), Localised and economic emphasis (LEE), and Localised and emphasis on social/environment (LES). Description of the detailed storylines for each scenario is available in the WP1 Working Paper (Annex 1). The largest difference in production per hectare between the different scenarios will be observed for sugar beets and potato (Figure 18). In terms of price per kilogram, sugar beets will show large difference between the different scenarios. Figure 19 shows the trends in the production per hectare and price per kilogram of sugar beets in Belgium from 2007 to 2060. The values of these market parameters will be highest for the GEE scenario and lowest for the LES scenario. The latter are even lower than the values for the baseline scenarios. Due to the very low values, farmers‘ land use decisions are expected to be significantly influenced by these income parameters in the LES scenario.
Figure 18 Comparison of (a) production and (b) prices in different scenarios, 2060
0
20
40
60
80
100
120
140
To
ns
per
Hec
tare
wheat barley maize oats rapeseed potato sugar protein
Baseline GEE GES LEE LES
0
10
20
30
40
50
60
70
€100
per
Kil
og
ram
wheat barley maize oats rapeseed potato sugar protein
Baseline GEE GES LEE LES
(a)
(b)
0
20
40
60
80
100
120
140
To
ns
per
Hec
tare
wheat barley maize oats rapeseed potato sugar protein
Baseline GEE GES LEE LES
0
10
20
30
40
50
60
70
€100
per
Kil
og
ram
wheat barley maize oats rapeseed potato sugar protein
Baseline GEE GES LEE LES
(a)
(b)

SD/TA/01 - A Multiscalar and Multiagent Modelling Framework for Assessing Sustainable Futures in a Globalised
Environment - "Multimode"
SSD - Science for a Sustainable Development – Transversal actions 53
Figure 19 Future trends in (a) production and (b) prices of sugar beets in different scenarios
6.3.4 Land use parameters and scenarios (link to WP2) Farmers will have to adapt not only to the changes in market, but also in spatial environment. Agricultural landscape changes because population growth increases urbanisation and economic growth promotes industrialisation. Expansion of urban and industrial areas puts pressure on agriculture due to land competition. Such a problem is evident in the case study areas due to its vicinity to a large and growing city of Brussels. It is thus important to take into account the spatial constraints brought about by the economic and demographic dynamics both within and outside the region. WP2 models these dynamics at various administrative levels in Belgium using cellular automata (CA). The CA model is implemented consisting of sub-models operating at three linked levels: national, regional, and finally, cellular: the National level, representing Belgium as one entity subjected to influences from
abroad as quantified in scenario‘s, not in the least those developed in WP1; the Regional level, representing Belgium in terms of its 43 arrondissements. The level of
the arrondissements is a good modelling-technical compromise between municipalities and provinces providing sufficient regional differentiation while avoiding technical complication.
the Cellular level, representing Belgium as consisting of a regular grid of cells measuring 9 ha each (300 m by 300 m). From a modelling-technical point of view, this resolution is appropriate for the CA-algorithm applied (50 m < 300 m < 1000 m), it permits to work with dominant land uses present in the cells and the spatial extent of its CA-neighbourhood (8 cells x 300 m = 2400 m) sufficiently incorporates local spatial interactions.
48
58
68
78
88
98
108
118
128
2007
2010
2013
2016
2019
2022
2025
2028
2031
2034
2037
2040
2043
2046
2049
2052
2055
2058
To
ns p
er
Hecta
re
Baseline GEE GES LEE LES
30
35
40
45
50
55
60
65
70
2007
2010
2013
2016
2019
2022
2025
2028
2031
2034
2037
2040
2043
2046
2049
2052
2055
2058
€100 p
er
kil
og
ram
Baseline GEE GES LEE LES
(a)
(b)

SD/TA/01 - A Multiscalar and Multiagent Modelling Framework for Assessing Sustainable Futures in a Globalised
Environment - "Multimode"
SSD - Science for a Sustainable Development – Transversal actions 54
The CA model in particular at the cellular level generated a detailed map of land use pattern showing how non-agricultural land uses changes the agricultural landscape. Figure 20 presents the detailed land use in Belgium that was generated from the CA model for the baseline 2000. The relevant spatial data for the ABM model is however only those areas that correspond to the case study areas in Walloon and Flemish regions.
Figure 20 Raster layer of land use in Belgium for the baseline, 2000 In addition to modifying spatial coverage, the type of spatial layer was converted from raster layer of the CA to vector layer of the ABM. The vectors correspond to the different parcels with assigned farm ownership. This conversion was necessary to reflect farmers‘ decision-making of the farmers, which is usually carried out at the parcel level. We followed the following steps in converting the CA raster maps to ABM vector maps: Matching of projection system is necessary because the raster datasets (i.e. CA model)
are projected in ETRS 1989 Lambert Conformal Conic, whilst the vector datasets (i.e. ABM model) are projected in Belge Lambert 1972;
Extracting the raster datasets that correspond to the spatial coverage of the ABM model;
Converting the raster datasets extracted from the Belgium map into vectors that correspond to the parcel definition of the 2007 land use.
The converted parcel maps served as spatial constraints to land use decisions of the farmers. For example, the parcels that shifted from arable to discontinuous urban fabric and industrial or commercial units are not available anymore for arable cultivation to the farmers. Figure 21 presents the simulated land use for the 2010 baseline scenario and which was converted into vector layers. Only the parcels representing agriculture and forest cultivations were extracted and converted. In 2007, most of the parcels are planted to maize, wheat, barley, and pasture. Production of maize for grain and silage tends to concentrate in the southern parts of the case study area and barley in the southern parts. Figure 22 presents the simulation results for the different scenarios in year 2060. Relative to the 2010 baseline, most changes in land use pattern in the case study area will be observed in the LES scenario. This corresponds to the analysis from WP2 where the loss of agricultural land remains closer to the urban centres, in this case Brussels, in 2060 for the LES scenario (Figure 8). The availability of land for arable cultivation for this scenario
Forests
Scrub and/or herbaceous vegetation associations
Arable land
Permanent crops
Pastures
Complex cultivation patterns
Land principally occupied by agriculture with natural vegetation
Continuous urban fabric
Discontinuous urban fabric
Industrial or commercial units
Artificial, non-agricultural vegetated areas
Road and rail networks and associated land
Port areas
Airports
Mineral extraction sites
Dump sites
Forests reserves
Other nature reserves
Beaches, dunes, sands
Inland wetlands
Maritime wetlands
Water bodies
Case study areas
Forests
Scrub and/or herbaceous vegetation associations
Arable land
Permanent crops
Pastures
Complex cultivation patterns
Land principally occupied by agriculture with natural vegetation
Continuous urban fabric
Discontinuous urban fabric
Industrial or commercial units
Artificial, non-agricultural vegetated areas
Road and rail networks and associated land
Port areas
Airports
Mineral extraction sites
Dump sites
Forests reserves
Other nature reserves
Beaches, dunes, sands
Inland wetlands
Maritime wetlands
Water bodies
Case study areas

SD/TA/01 - A Multiscalar and Multiagent Modelling Framework for Assessing Sustainable Futures in a Globalised
Environment - "Multimode"
SSD - Science for a Sustainable Development – Transversal actions 55
will be mainly affected by land use conversion into discontinuous urban fabric and complex cultivation patterns. Figure 23 shows the decline in production area for selected crops due to these land use conversions in LES scenario. The communities in the Flemish case study area will be more affected by these conversions. Areas planted to other cereals such as oats, tritical, and spelt will be mostly affected with a decline in land area of more than 60 percent and 120 percent in 2010 and 2060 respectively. Winter barley and maize for grain are the other crops that will be largely affected by land use conversions in 2010 and 2060 in the LES scenario. The changes in land use will be further affected by the changes in income parameters, which are lowest in the LES scenario.
Figure 21 Vector layers of (a) 2010 CA-simulated land use and (b) 2007 actual land use
(a) CA-simulated land use 2010 (b) Actual land use 2007(a) CA-simulated land use 2010 (b) Actual land use 2007
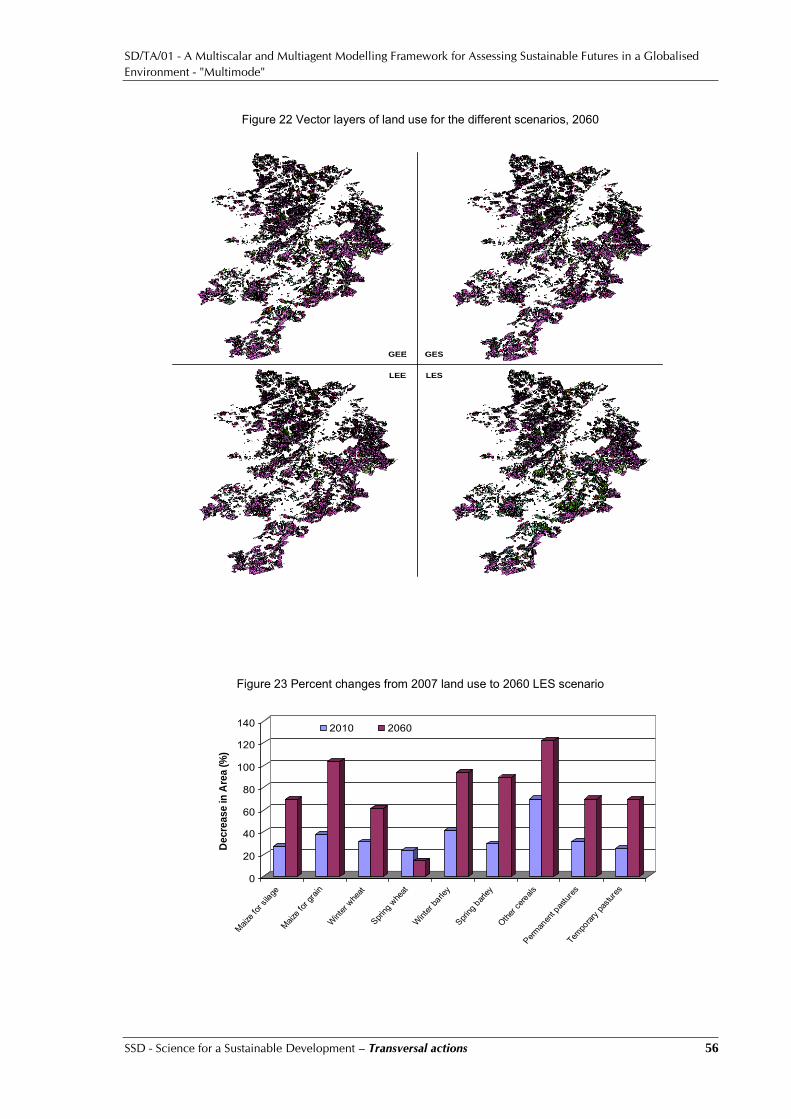
SD/TA/01 - A Multiscalar and Multiagent Modelling Framework for Assessing Sustainable Futures in a Globalised
Environment - "Multimode"
SSD - Science for a Sustainable Development – Transversal actions 56
Figure 22 Vector layers of land use for the different scenarios, 2060
Figure 23 Percent changes from 2007 land use to 2060 LES scenario
0
20
40
60
80
100
120
140
De
cre
as
e in
Are
a (
%)
Maize fo
r sila
geMaiz
e for g
rain
Winter
wheat
Spring
whe
atWint
er ba
rley
Spring
barley
Other c
ereals
Perman
ent p
astur
esTem
porar
y pas
tures
2010 2060
GEE GES
LEE LES
GEE GES
LEE LES

SD/TA/01 - A Multiscalar and Multiagent Modelling Framework for Assessing Sustainable Futures in a Globalised
Environment - "Multimode"
SSD - Science for a Sustainable Development – Transversal actions 57
6.4 WP4: Stakeholder Dialogue and Feedbacks 6.4.1 Introduction to WP4 For the stakeholder dialogue with individual agents, WP4 takes an agency-oriented approach to analysing sustainable land use practices and decision-making in agriculture. Both institutional agents and farmers were involved in the research process. The focus was on agri-environmental management. Agri-environment programmes or ‗schemes‘ – each comprising a series of ‗measures‘ – have been introduced across the European Union to support specific farming practices that help protect and enhance the rural environment. The agri-environment programmes are based on the idea of mutual reciprocity: farmers deliver certain environmental services for which society pays. Agri-environment measures (henceforth called AEMs) are contractual agreements between the member state (or the regional authority) and individual farmers. WP4 adopts a multi-methods design, combining numerical/quantitative and narrative/qualitative methods of data collection and analysis (Tashakkori and Teddlie, 2003). The main data sources include: Personal interviews with institutional agents involved in AEMs; Personal interviews with farmers adopting AEMs; and A mail survey on land use decision-making among farmers.
Data from interviews with institutional agents and farmers were used in Actor-Network analysis to examine how the AEMs take shape, get diffused and taken up in, by and through networks or relations (Study 1: section 5.4.4). Furthermore, data from interviews with farmers were used both in pre-pilot work to provide content for the survey questionnaire and to obtain a detailed picture of the farmers‘ decision-making in relation to AEMs (Study 2: section 5.4.5). Finally, data from the mail survey were used to build a priority ranking of separate motivations for participation in AEMs with different degrees of complexity (also section 5.4.5) and to develop social behavioural models in WP3 (section 5.3). Detailed discussion of WP4 results are available in Van Herzele et al. 20112 but some highlights are presented below. The following information is taken from these two papers. 6.4.2 Data collection Case study area The study area is the larger area of the river Dyle‘s catchment located in the provinces of Vlaams Brabant (Flanders, 13 municipalities ) and Brabant Wallon (Walloon region, 14 municipalities ), in the centre of Belgium; a few kilometres to the East of Brussels. The main soil types are silt loams and sandy loams, favourable to agriculture. Farming is production oriented and most often takes place in family owned farms. The average farm size is around 50 ha. Cropland is located on the loamy plateau whilst grassland occurs on the slopes or in wetter valley bottoms and is used for dairy and meat production. The main crops are (in decreasing importance) winter wheat, sugar beets, barley, maize (for cattle), and potatoes. A relatively large proportion of the area (> 20 %) is built, and the average population density exceeds 300 inhabitants per square kilometre. Housing is relatively dispersed, with the highest densities in Leuven, and in the municipalities closest to Brussels. The region is 2 Ann Van Herzele, Nicolas Dendoncker, and Lilibeth Acosta-Michlik (2011) Mobilisation capacity for agri-
environmental management, Journal of Environmental Management 92:1023-1032.
SD/TA/01 - A Multiscalar and Multiagent Modelling Framework for Assessing Sustainable Futures in a Globalised
Environment - "Multimode"
SSD - Science for a Sustainable Development – Transversal actions 58
fast growing, both in economic terms and in terms of population. In general, there is a high pressure on the land from the building sector, which results in fast urbanisation. The particular morphology of the landscape in relation to the topography and land use creates frequent problems of flooding and erosion (Verstraeten and Poesen, 1999). This has been recognised as one of the main environmental issues for which AEMs have been designed in both regions. Other environmental issues that AEMs try to tackle relate to improving water quality, and maintaining or restoring biodiversity. Personal interviews Semi-structured interviews were conducted with 13 experts involved in AEM implementation (2008), as well as 43 farmers who have practical experience with AEMs (2008, 2011). Two broad categories of experts were selected: those who were responsible for the design and evaluation of AEM-packages and procedures (7), and those who were in contact with farmers for advice and support (6). In some instances, however, the two tasks overlapped. We used two ways to locate the farmer informants. First, technical advisors in each region were asked to provide an initial list of farmers in the study area whom we could contact. As criteria for selection we asked them to include farmers with different types of farming systems, sizes of agricultural holding, and types of AEMs applied. Second, selected farmers from the list were asked during the interview to refer another farmer who may have a different opinion. Using this method, we aimed to select farmer respondents who represent a broad spectrum of viewpoints and experiences. The semi-structured interview protocols were designed to trace the multiple linkages or relationships through which AEMs take form and become applied. The experts were asked to tell about their activities in relation to AEMs, especially those that ‗make a difference‘, such as prescribing rules, employing officers, promoting AEMs, and the methods or strategies they used to perform these tasks. Special attention was given to recent changes or innovations (and how these came about), and any further changes they would strive for in future. Those who were in contact with farmers were also asked about the way they approach and communicate with them. The interviews with the farmers focused on their motivations to enter (or not to enter) particular AEMs, their practical experiences with, and eventual suggestions for improving AEMs, the role of communications with advisors, other farmers, the public at large, etc., and their future intentions with regard to the application of AEMs. All of the interviews were held at the offices or farms of the interviewees and lasted from one to two hours. With the consent of the interviewees, the interviews were tape-recorded. Mail survey The survey population consisted of occupational farmers having parcels within the study area. The farmers were identified from the database Belgian Paying Agencies (BELPA), which holds the Belgian Integrated Administration and Control System (IACS) data of the European Union. To ensure full coverage of the occupational farmers the BELPA database was upgraded using administrative and survey data sources. In Flanders, the administration of the Flemish Land Agency (VLM) completes the database with farmers having 1) parcels under the AEM and 2) parcels registered within the framework of the European Nitrate Directive (―Eenmalige Perceelsregistratie‖ – EPR). For Brabant Wallon the database was completed with data obtained from previous farmer surveys in the study area (Université Catholique de Louvain). A total of 1,171 farmers were sampled (574 in Vlaams-Brabant, 597 in Brabant-Wallon). Self-completion questionnaires were sent to all farmers in August 2010, a French version to the farmers in Brabant Wallon, and a Dutch version to those in Vlaams Brabant. The
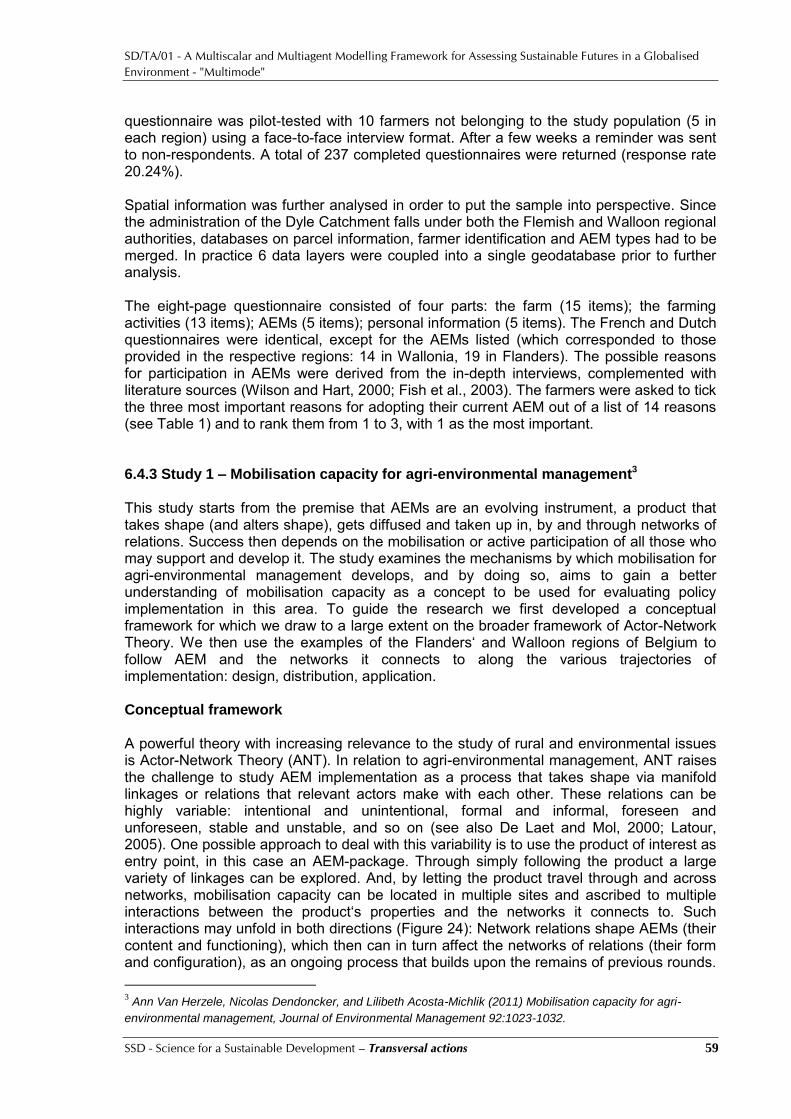
SD/TA/01 - A Multiscalar and Multiagent Modelling Framework for Assessing Sustainable Futures in a Globalised
Environment - "Multimode"
SSD - Science for a Sustainable Development – Transversal actions 59
questionnaire was pilot-tested with 10 farmers not belonging to the study population (5 in each region) using a face-to-face interview format. After a few weeks a reminder was sent to non-respondents. A total of 237 completed questionnaires were returned (response rate 20.24%). Spatial information was further analysed in order to put the sample into perspective. Since the administration of the Dyle Catchment falls under both the Flemish and Walloon regional authorities, databases on parcel information, farmer identification and AEM types had to be merged. In practice 6 data layers were coupled into a single geodatabase prior to further analysis. The eight-page questionnaire consisted of four parts: the farm (15 items); the farming activities (13 items); AEMs (5 items); personal information (5 items). The French and Dutch questionnaires were identical, except for the AEMs listed (which corresponded to those provided in the respective regions: 14 in Wallonia, 19 in Flanders). The possible reasons for participation in AEMs were derived from the in-depth interviews, complemented with literature sources (Wilson and Hart, 2000; Fish et al., 2003). The farmers were asked to tick the three most important reasons for adopting their current AEM out of a list of 14 reasons (see Table 1) and to rank them from 1 to 3, with 1 as the most important. 6.4.3 Study 1 – Mobilisation capacity for agri-environmental management3 This study starts from the premise that AEMs are an evolving instrument, a product that takes shape (and alters shape), gets diffused and taken up in, by and through networks of relations. Success then depends on the mobilisation or active participation of all those who may support and develop it. The study examines the mechanisms by which mobilisation for agri-environmental management develops, and by doing so, aims to gain a better understanding of mobilisation capacity as a concept to be used for evaluating policy implementation in this area. To guide the research we first developed a conceptual framework for which we draw to a large extent on the broader framework of Actor-Network Theory. We then use the examples of the Flanders‘ and Walloon regions of Belgium to follow AEM and the networks it connects to along the various trajectories of implementation: design, distribution, application. Conceptual framework A powerful theory with increasing relevance to the study of rural and environmental issues is Actor-Network Theory (ANT). In relation to agri-environmental management, ANT raises the challenge to study AEM implementation as a process that takes shape via manifold linkages or relations that relevant actors make with each other. These relations can be highly variable: intentional and unintentional, formal and informal, foreseen and unforeseen, stable and unstable, and so on (see also De Laet and Mol, 2000; Latour, 2005). One possible approach to deal with this variability is to use the product of interest as entry point, in this case an AEM-package. Through simply following the product a large variety of linkages can be explored. And, by letting the product travel through and across networks, mobilisation capacity can be located in multiple sites and ascribed to multiple interactions between the product‘s properties and the networks it connects to. Such interactions may unfold in both directions (Figure 24): Network relations shape AEMs (their content and functioning), which then can in turn affect the networks of relations (their form and configuration), as an ongoing process that builds upon the remains of previous rounds. 3 Ann Van Herzele, Nicolas Dendoncker, and Lilibeth Acosta-Michlik (2011) Mobilisation capacity for agri-
environmental management, Journal of Environmental Management 92:1023-1032.
SD/TA/01 - A Multiscalar and Multiagent Modelling Framework for Assessing Sustainable Futures in a Globalised
Environment - "Multimode"
SSD - Science for a Sustainable Development – Transversal actions 60
Guided by the conceptual framework, an ANT-based analysis was carried out of the transcribed interviews. The unit of analysis was the linkages and interactions between and AEM-package and the social networks it encounters.
Figure 24 Conceptual framework for implementation chain (Van Herzele et al. 2011)
Results In the next paragraphs, we summarise the main linkages that make up the design of AEMs, those that help move the product from its points of design to its points of use, and the linkages around that usage. For examples across the many types of AEMs we refer to the full paper. The arena of AEM design: AEMs in Belgium are not one single product, rather they form a set of loosely related ‗packages‘ with each package having its own connections that brought it into existence and continue to shape it. The most obvious ties are those with existing policy agendas and the (scientific) knowledge developed in conjunction with these. In both regions, AEMs reflect a wide variety of past and current policies (nature conservation, water protection, erosion control, etc.). In several instances, the participation in AEM design of networks with overlapping policy interests (e.g., rural development and soil conservation) may contribute both content (enlarging the knowledge base) and functioning potential to a particular AEM. However, not all of the ideas and expertise embedded in AEMs can be readily linked back to the dominant policies in place. AEMs also may result from opportunity-based transfer of knowledge (e.g., from another country), rather than being triggered by an immediate problem. Furthermore, much of the opportunity to draw on available knowledge resides in the configuration of everyday administrative practice (durable though informal contacts within and between departments). Finally, the least visible but nonetheless critical connections that make up the design of AEMs are the ones driven by pressure and anticipation. In fact, the officials have always in mind of ‗absent others‘ when they design a particular AEM package. The concerns are here with preventing improper use of it by farmers, sustaining the reputation and position of the department one works in, tackling criticism of nature conservation groups, securing EU-money, etc. In sum, as soon as we trace connections of an AEM in the making we end up with a superposition of many different linkages that may well extend beyond the walls of responsible offices. AEMs do not rely on one stable or centrally established agenda. Rather designers of AEMs flexibly follow the challenges and opportunities in their network environment. Thanks to fluid adaptation, synergies have also grown between networks that
SD/TA/01 - A Multiscalar and Multiagent Modelling Framework for Assessing Sustainable Futures in a Globalised
Environment - "Multimode"
SSD - Science for a Sustainable Development – Transversal actions 61
would otherwise have remained apart. As a result, AEMs can be conceived as fragmentary, a set of bits and pieces taken from other times, places and agencies. In fact, nothing is really ‗invented‘. It is artfully combined or recombined. But what is included (or excluded) is critical for how an AEM is going to function. The arena of AEM distribution: When an AEM-package leaves the confines of its ‗site of production‘, it is being put to test. Is it going to function as expected? Will farmers be interested in the product and ultimately sign the contractual agreement? First and most prominent among the challenges facing the involved departments is the ability to channel the distribution of AEMs in the desired direction. Apparently, much effort goes into ensuring that the AEM-packages attach to the desired client base. In the early years of AEM implementation, quantity, in terms of numbers of farmers and hectares of land enrolled, was high on the agenda, as it was a measure of success. In a political sense, it was considered a good signal that the budgets were spent. Now that the programme has proven successful (many farmers have entered the system) the need for achieving environmental improvement through better targeting the packages to selected users is becoming more manifest. Thus, the need for distribution to be planned and controlled is becoming even more critical with the current emphasis on quality. Apparently, much of the capacity to control the distribution of AEMs is built in the product itself. Not surprisingly, well-paid AEMs that do not require much effort or changes in farm practices are most easy to distribute. Furthermore, eligibility rules and territorial zoning are main examples of attributes that restrict uptake of AEMs to certain types of farms, sensitive areas (water protection, erosion), high value habitats, and so on. In Flanders, a selected distribution of AEMs is being encouraged centrally (active promotion of AEMs in ‗priority areas‘), while in the Walloon region it occurs more as a side-effect of delegating advisory tasks to institutions and organisations working in their areas of interest. Here the distribution of AEMs is also taking advantage of a contracted institution‘s existing networks (contacts with farmers, hunting associations, etc.). Furthermore, a good deal of the distribution can be aligned with other initiatives: a river project, Natura 2000, a municipal erosion control plan, etc. Such a ‗piggy-backing strategy‘ may increase both efficiency and effectiveness through joint efforts. In addition, there is the experience that supporting a local project is something that can be ‗sold‘ more easily to the farmers. In sum, not all distribution can be easily linked back to one or more centres of control and calculation. The arena of AEM application: Once a farmer accepts a given AEM-package and agrees to follow its rules of application, he or she engages in taking up the actions as specified in the contract. However, applying AEMs is not as straightforward as that. The reason is simply that farmers, as any other entity, merge into different networks that surround them. At least three types of network relations are apparent here: farmers and government regulations, farmers and the land they farm, farmers and their social environment. In each of them AEMs are deployed differently. The first set of relationships involves that farmers must consider the wider and ever changing landscape of government rules. So our farmer informants explained how they can use AEMs as a tool to ensure the activation of their ‗payment entitlements‘, to meet the obligation of maintaining the share of permanent pasture area, to pay lower taxes on their income and to compensate for restrictions of fertilisers and pesticides use. Moreover, any navigation through this network of bureaucracy tends to emphasise what is perhaps the weakest entity: money. Farmers express much worry about the finiteness of budgets. Overall, instability of the network is best illustrated by their readiness to plough up all of their AEMs as soon as payments cease. The second network relates to day-to-day farming. Seen as a practice, AEMs may draw farmers into new relationships with the land. Many farmers get acquainted with new elements (erosion strips, beetle banks, etc.) and new

SD/TA/01 - A Multiscalar and Multiagent Modelling Framework for Assessing Sustainable Futures in a Globalised
Environment - "Multimode"
SSD - Science for a Sustainable Development – Transversal actions 62
activities, and as a consequence they start to look at and work their land from a novel perspective. Despite the increased environmental consciousness among farmers, the standardisation of farmers‘ relationship with the land remains a major problem. In both regions most informants expressed the perception that the standards for application are made by bureaucrats with little or no understanding of farming practice. However, the rigidity of prescriptions can also linked back to the farmers themselves. Apparently, the AEM prescriptions provide many farmers with an extra drive for seeking out new ways to secure production within the margins imposed by these prescriptions. This in turns urges designers of AEM to add more specifications and standards to the text. Finally, AEMs interact with farmers‘ social networks. Obviously, farmers use their professional networks to share and develop further the knowledge acquired (which in turn also helps distributing AEMs over a larger group of farmers). But farmers also take care of their environment as neighbours, citizens or members of a political community. Most of our informants see AEMs as contributing to the public image of farming. They have the feeling that many people nowadays do not realise enough that farmers produce food for society and rather associate them with noise, dirt and pollution. Thus, AEMs can be a visible symbol of farmers taking care of the environment. Concluding observations How does this case, and the conceptual framework used to examine it, help in unpacking the mechanisms by which mobilisation for agri-environmental management develops and takes form? Thus, what can the case contribute to our understanding of mobilisation capacity? We wish to make three concluding observations: Firstly, the story of the case highlights the importance of locating mobilisation capacity for agri-environmental management along the various trajectories through which AEMs might pass. Abilities and opportunities for mobilisation are not restricted to a particular point or stage in the implementation process, such as the farmers‘ decision (or any initiatives to encourage them) to take up AEM. Rather, they are an effect of network relations that occur along the way from designing an AEM-package to its distribution and actual implementation on the ground. However, the study shows that such connections are not to be taken as given. The AEM itself - and what it is for that AEM to work or function - also shapes in part the networks it connects to and hence the abilities to support and develop it. Thus, in building mobilisation capacity both the product and the network are important. The conception of the continual interaction between, and mutual constitution of, an AEM on the one hand and the networks it connects to on the other may provide additional insight beyond that available from one location in time or space. Examples of how farmers‘ inventiveness in doing things different has affected the design of AEMs lead us to suggest that, in evaluating success, it is critical to explore what happens with an AEM after it is taken up and how this translates back to its content. Secondly, the case illustrates that mobilisation for agri-environmental management draws upon and emerges from different types of network relations. Most obvious are those formed through contractual agreements and legally established procedures. In fact, every AEM-package represents a ‗script‘, an ideal scenario, prescribing the roles and the specific tasks for the actors and devices that are to be recruited for its support. Farmers, product managers, advisors, and controllers, but also application forms, money, environmental entities and so on, all get their place in the predefined network configuration. The links and relationships are standardised, regularised, and thus predictable. However, all of this does not mean that the capacity to mobilise support for agri-environmental management resides solely in the creation and use of a stable and formalised network. On the contrary, if we focus on the wider arenas of relationships we see that mobilisation is supported by a series of alternative and complementary pathways. So, the design of AEMs relies on scattered,
SD/TA/01 - A Multiscalar and Multiagent Modelling Framework for Assessing Sustainable Futures in a Globalised
Environment - "Multimode"
SSD - Science for a Sustainable Development – Transversal actions 63
often short-lived connections with scientists, politicians, examples from abroad, etc. What appears as formal and standard is the result of many other forms of links: knowledge transfer, competitive pressure, entrepreneurial opportunities, and so on. Likewise, in the distribution arena, we found AEM advisors creating synergies with local, project-based networks. Least visible were the diffuse but often durable connections that develop locally between farmers and their ‗colleagues‘, neighbours, hunters, outside experts, and so on. In short, it appears that many other actors than those formally incorporated may come to extend the reach of the network and help transform farmers‘ enrolment into active support. Thirdly and lastly, the case study shows how people and things are mobilised through mechanisms of inclusion and exclusion. We therefore suggest that mobilisation capacity is highly selective and necessarily incomplete. So it would be virtually impossible to mobilise all of the resources, expertise and networks that are deemed relevant. Not every farmer will want to take up AEMs, and also, taking up an AEM is not the same as accepting all of its underlying assumptions. It appears like farmers do fit and do not fit into the network, the relationship is only partly. As we described, a great deal of selectivity or incompleteness is built into the product. In addition to the product itself there are selective strategies of use. Mobilisation, then, is all about creating synergies by using and maximising the opportunities available, rather than achieving a pre-formulated goal. Note that the stated objectives of AEMs are multiple and by no means restricted to a single policy agenda, but it is just because of this that AEMs can fluidly be adapted to other contexts. In this respect, evaluation should not focus only on intentions and objectives but instead address the opportunities for synergies themselves. Synergies, though selective in their link making, may also add to the completeness and depth of mobilisation. We found especially informal linkages filling some important knowledge gaps within departments, broadening the rhetoric associated with AEMs (to include farmers as active and cooperative citizens), and so on. Overall, the study demonstrates the potential of analysing AEMs, and the networks they connect to, in the midst of development rather than explaining success or failure retrospectively. AEMs are never a finished tool, and the networks of support will never work in perfect unit. In this sense, mobilisation capacity is not another set of ‗factors‘ for explaining success. Rather, mobilisation capacity is and effect produced by the interplay between AEMs and the networks they connect to. So, mobilisation capacity not only lies ‗behind‘ any success of policy implementation, it is gradually built-up and refined along the trajectories of that implementation. In conclusion, we suggest that in evaluating the networks of support one should look at them in an open and fluid manner, that is, not to privilege any particular configuration or form of attachment over the other, not take intentions and objectives as a starting point but instead address the opportunities for synergies, and be aware that any network built around an AEM may change its content and the way it functions. 6.4.4 Study 2 – Farmers' motivations to participate in AEMs with different degrees of complexity4 (link to WP3) This study aims to contribute to the ongoing debate around the payment of farmers for undertaking agri-environmental actions. Much of the current debate appears to focus on the question of whether to go for relatively simple AEMs that can be readily applied by many farers or to ‗raise the bar‘ and give greater focus on complex AEMs that are targeted to deliver well defined environmental benefits within particular contexts. Against this background, we seek to answer the following questions: 4 Van Herzele A., Gobin A., Van Gossum P., Acosta-Michlik L., Waas T., Donnez N., Dendoncker N., Henry de
Frahan B. Effort for money? Farmers’ response to agri-environment measures with different degrees of
complexity. Submitted to Land Use Policy.

SD/TA/01 - A Multiscalar and Multiagent Modelling Framework for Assessing Sustainable Futures in a Globalised
Environment - "Multimode"
SSD - Science for a Sustainable Development – Transversal actions 64
What are farmers‘ motivations or reasons for participating in AEMs? Do these reasons vary across AEMs with different degrees of complexity? What is farmers‘ reasoning behind participation in AEMs, or how do various reasons
combine in different modes of participation? Ranked motivations for AEM participation Data from the mail survey among farmers was used to build priority rankings of separate reasons for participation in AEMs with different degrees of complexity. To classify the AEMs we consulted seven officials involved in the management of AEMs. These experts were presented a list of the AEMs provided in their region to be rated on a 6-point scale of difficulty (very easy, easy, somewhat easy, somewhat difficult, difficult, very difficult), with the most difficult AEMs requiring a greater adaptation effort on the part of the farmers. In case of divergence of opinion, the experts were contacted again to clarify and reach consensus on the scores. As a result, the AEMs were divided into three degrees of complexity: (1) Simple: (very) easy to implement AEMs; (2) Medium: somewhat easy or somewhat difficult AEMs; (3) Complex: AEMs that are (very) difficult to implement. The farmer respondents were subsequently grouped into three categories (C1, C2 and C3 farmers) corresponding to their most complex AEM. For instance, farmers adopting only simple AEM belong to C1 and farmers adopting one simple and one complex AEM belong to C3. Frequency analysis was used to assess the relative importance of the different reasons for these three categories of farmers. Of the 237 farmers who responded to the survey, 128 farmers (54%) adopt AEMs (Table 11). These farmers together implement 319 AEMs on their fields. Many farmers apply more than one type of AEM on their farm, 2.5 on average. According to the survey (the geodatabase in brackets), C1 farmers manage on average 1 (1.7) AEM type, C2 farmers manage 2.3 (3.2) different AEM types and C3 farmers 3.7 (3.4) AEM types. A comparison of geodatabase and suvey data shows an underrepresentation and an overrepresentation of C1 and C3 farmers respectively within the survey data set. Nevertheless, the result is a fairly balanced data set suitable for further motivation analysis using frequency tables.
Table 11 Characterisation of the data set for the analysis of AEM motivations
Item Geodatabase Survey
Farmers with parcels in the area 1,171 237
Farmers with AEMs in the area 630 128
C1 farmers (%) 43.2 25.0
C2 farmers (%) 41.6 39.1
C3 farmers (%) 15.2 35.9
Parcels located in the area 15,255 4,402
Parcels with AEMs 4,937 319
Parcels with simple AEMs (%) 84.6 45.8
Parcels with medium AEMs (%) 11.5 36.0
Parcels with complex AEMs (%) 3.8 18.2
The results of the frequency analyses of the respondents‘ ranked reasons for adopting their current AEMs are discussed in details in WP4 Working paper. Below are the most important observations from these analyses: Increase of revenue is the most important reason for the total sample (79.2% of
respondents), but considerably more for the farmers applying more complex AEMs (C2 and C3): 86.0% and 86.5%, respectively, indicated this as one of the three most important reasons.

SD/TA/01 - A Multiscalar and Multiagent Modelling Framework for Assessing Sustainable Futures in a Globalised
Environment - "Multimode"
SSD - Science for a Sustainable Development – Transversal actions 65
Soil enrichment and nutrient cycling are the most indicated reason by C1 farmers (65.4%).
That AEMs require low investment (34%), and little work (36.8%) are important reasons for all respondents, but most for those applying the more complex AEMs with respectively 32.6% and 44.2% for C2 farmers and 40.5% and 32.4% for C3 farmers.
Good combination with existing farm practice as well as with other regulation is more important for C1 than for other farmers.
The adaptability of AEMs to less favourable soil conditions is of little importance to C1 farmers as compared to C2 and C3 farmers.
Environmental reasons are most important for C3 farmers. C3 farmers are much concerned both with nature (35.1%) and soil erosion (40.5%). C1 farmers are foremost concerned with soil erosion (42.3%), nutrient cycling (65.4%) and much less with positive effects on nature (15.4%). Clearly, concern with nature tends to increase with degree of complexity.
Reasons that refer to social relations are generally of low importance, but they seem slightly higher for farmers adopting more complex AEMs.
AEM participation styles A logical analysis (Williams, 1981a, 1981b) of the interview data was conducted to elicit the informant‘s logic in relation to AEMs. The unit of analysis was the reasoning that farmers used when explaining their motivations for applying (and continuing) their AEMs. In particular, we looked at the significance (and the interplay) of those elements that established the coherence of a farmer‘s reasoning. This has enabled to uncover a number of generalised but distinct lines of reasoning that are used by farmers in relation to AEMs. With this approach we further elaborate on Fish et al.‘s (2003) conceptualisation of styles of participation in UK agri-environment schemes. Six modes or styles of participation in AEMs were identified: Opportunistic; Calculating; Compensatory; Optimising, Catalysing, Engaged. The participation styles are not necessarily exclusive. Farmers can use a different reasoning with respect to different parts of the land and different types of AEMs. However, the large majority of farmers did have a dominant reasoning mode. Opportunistic participation: In the opportunistic line of reasoning AEMs are regarded an opportunity to earn money from existing practices. Most, if not all, of the effort is already undertaken, and the money granted represents an extra income. Various concerns - economic, technical, environmental, aesthetics - can play a role, apart or in combination, but they all function independently of the financial incentives of AEMs. One farmer expressed it like this: ―The subsidies are a plus but not my main motivation because I did it already‖. Opportunistic reasoning is usually at the level of the practice itself. Although opportunistic participation represents a rather simple logic and applies to relatively simple AEMs, it is not widespread among actual adopters. Several farmers had considered adopting AEMs for existing practices – applying winter cover, maintaining hedges or keeping a field margin – but decided not to make use of it, mainly because of the paperwork involved. Calculating participation: Financial gain is central to this style of participation and a condition sine qua non for adopting AEMs. In its most basic form it represents a simple money for effort bargain. The new effort is balanced against the expected financial returns. However, money is more than just the AEM subsidy. Several farmers explained that the subsidy alone does not allow them to generate income. Rather they used AEMs to ensure the activation of their ‗payment entitlements‘, to get a cereal premium, to pay lower taxes on their income or to write down machinery. In most of the cases relatively simple are chosen. Overall, the reasoning is at the level of the whole farm and, as one farmer said: ―It‘s just an accounting balance‖. In several instances, this participation style was clearly

SD/TA/01 - A Multiscalar and Multiagent Modelling Framework for Assessing Sustainable Futures in a Globalised
Environment - "Multimode"
SSD - Science for a Sustainable Development – Transversal actions 66
associated with a calculative attitude more generally: checking the prices of crops everyday on the Internet, joining in price agreements with suppliers, etc. A certain future vision on farming was also apparent here, as one farmer stated: ―The farmer of tomorrow will be a business man before everything else, aware of the market fluctuations, sell even before the crops are harvested‖. Compensatory participation: The starting idea is that the farmer is forced by environmental legal restrictions already in place (the Nitrate Directive; maintaining the share of permanent pasture area, etc.) to adapt certain farming practices or to meet certain obligations. AEMs are then seen as a (small) extra effort whereby the farmer can be compensated for the totality of the effort. For instance: ―I became motivated because it is largely an obligation and if you can get a compensation you do it‖. Farmers also anticipate on potential future legal restrictions. For example, one farmer in a water protection area: ―I entered into AEMs because I‘m sure that in future we will not be allowed anymore to add manure, nor to use pesticides‖. The reasoning is at the level of the practice itself and it appears that they are becoming to accept the environmental logic, for instance: ―Spreading nitrogen close to ditches is bad practice‖. Some assure that taking care of the environment through AEMs helps create a more positive image for farmers. However, they find it should be compensated financially. The compensatory line of reasoning is followed for a number of relatively easy AEMs: reduced fertiliser application (in water protection areas), grass strips (in particular along streams), anti-erosion strips (in dedicated erosion-sensitive areas). However, only a few farmers follow this reasoning for all of their AEMs. Optimising participation: The major concern is to optimise the production potential of the land (―You need to know your land‖; ―Land, local conditions are key!‖). In this line of reasoning the subsidy is important but it is not the starting point. Generally taken, adopting AEMs is seen as the better alternative for marginal land: ―The positive thing of AEMs is that it is on parcels where I cannot get more out of; that is the only place where I put AEMs‖. As this kind of reasoning starts from local physical conditions, it is most evident on a micro level (part of a parcel). Examples of physical conditions that limit production include the effect of woodlots (their shadow and roots), paths (damage), streams (wet soil), sandy soils (low fertility), and parcel headlands. Most of the AEMs are medium-easy and apply to margins along woods, paths and streams. Only a minority apply to whole parcels (probably because in the case study area soil fertility is generally high). Examples are high nature value grassland and hamster preservation on less fertile soils (the latter being a complex AEM). Catalysing participation: This style of participation is centring around a specific and immediate desired environmental effect. It is from this orientation that the farmer shows an interest in specific agri-environmental practices, but he or she does not want to lose or invest money in them. The AEM subsidy then effectively acts as a catalyst for a practice that would not otherwise be undertaken. In particular, it makes possible a practice – i.e. the practice can be done without cost - that would lead to the desired effect. One farmer called this an ‗opération blanche‘, which he found perfect. Another stated: ―I have the pleasure of doing it without losing my money‖. The chosen AEM can be of different degrees of complexity, but have in common that they are directly linked to the effect aimed at: anti-erosion strips (from simple to advanced) to reduce damage from soil erosion, grassy headlands and margins (erosion control, benefit game animals or otherwise, preventing them to enter the fields), beetle bank (favour the indification of pheasants and partridges), winter ground cover (anti-erosion, improving soil in spring), planting hedgerows where the farmer can see them (because they are nice), herbaceous flowered strips (pleasing the public). The desired environmental effects thus relate to different kinds of concerns, but in general the economic viability of the farm is less of an issue. Furthermore, the reasoning is at the level of the practice itself and its tangible impact on the environment.

SD/TA/01 - A Multiscalar and Multiagent Modelling Framework for Assessing Sustainable Futures in a Globalised
Environment - "Multimode"
SSD - Science for a Sustainable Development – Transversal actions 67
Engaged participation: It is the farmer‘s challenge to integrate agri-environmental practices into the overall farm enterprise. As a system AEMs not only provide the means to take up this challenge, they also make tangible, even visible, the farmer‘s engagement and participation in agri-environmental management. These farmers are environmentally conscious, but unlike the other participation styles – within which environmental aspects can be important as well – this relates to the bigger picture (rather than a specific environmental effect, for example). Not only are they aware of the environmental problems that go with contemporary farming, but that the solution lies with them and that they can make a difference. In general, engaged participants also explicitly stress the societal value of AEMs. They usually have regular contacts with the public, for instance through direct selling at the farm or on the market. That AEMs can enhance a farmer‘s standing in the local community is also evident in other participation styles. However, engaged participants are more inclined to think of AEMs as a link-making device. Finally, engaged participants are convinced of the long-term interest of AEMs. They find the spirit of AEMs (―L‘esprit de la mesure‖) important, but often in contradiction with the detailed rules and many constraints. Concluding observations The quantitative analysis suggests that, in general, money is a prime motivator for adopting AEMs. The increase of revenue is given the highest priority by farmers adopting medium and highly complex AEMs (C2 and C3 farmers). These farmers give much more priority to monetary reasons than those only adopting simple AEMs (C1 farmers). Yet it should be noted that increase of revenue is not mentioned at all among the three most important reasons by 13% of the C2 and C3 farmers (and 41% of the C1). Soil enrichment and nutrient cycling are the primary reasons for C1 farmers. Furthermore, that AEMs require low investment and little work are important reasons for all farmers, but most of all for those applying the more complex AEMs (C2 and C3 farmers). This seems somewhat in contrast to the expectation that more complex AEMs require greater adaptation effort on the part of the farmers. However, as we expected, positive effects on nature are of great importance to C3 farmers. That money plays a central role is also clear from the qualitative analysis. Six modes or styles of participation were identified and money is a critical element of the farmers‘ reasoning in each of these styles. What is meant by money, however, is highly variable, and dependent on the role it plays in farmers‘ reasoning. Money is thought of in various terms, which does not always refer to the AEM subsidy itself (e.g., covering one's costs, paying less taxes, getting a cereal premium, avoiding footing a bill, a penalty from control, etc.). And, how a farmer thinks about the AEM subsidy may also fit to a certain extent into his or her overall farming strategy. In short, the logical analysis makes very clear that participation in AEMs is not simply a matter of getting money in return for delivering environmental services. Monetary reasons are usually accompanied by several other considerations. The quantitative analysis suggests that environmental concern (in particular in combination with nature) tends to increase with the complexity of the AEMs that farmers adopt. Conversely, the importance of goodness of fit (both existing farm practice and other regulations) is decreasing with higher levels of complexity. Farmers only applying low demanding AEMs appear in particular motivated through a good match between a measure‘s intended effect and their own aspirations in this respect. Sustaining soil quality (such as soil enrichment, nutrient cycling and preventing soil erosion) is very relevant here. It is also shown from the qualitative analysis that the importance attached to non-monetary concerns can largely differ (for instance, environmental concerns being low with calculating participation and high with engaged participation). But what is more, such concerns - economic, technical,

SD/TA/01 - A Multiscalar and Multiagent Modelling Framework for Assessing Sustainable Futures in a Globalised
Environment - "Multimode"
SSD - Science for a Sustainable Development – Transversal actions 68
environmental, aesthetics, etc. - are related to a certain extent (and in a variable way) with the financial incentives of AEMs. For example, while in the opportunistic style non-monetary concerns are independent of the AEMs, in the catalysing style AEMS are actually a means to achieve a certain desired environmental effect. Figure 25 (right column) summarises farmers‘ aspirations according to participation style. Figure 25 Participation styles: distribution over farmer categories (C1, C2, C3) and respective requirements for
AEMs C1 farmers C2 farmers C3 farmers Requirements for AEMs
Opportunistic Little paperwork
Calculating Farm accounting in balance
Compensatory Little extra legal restriction
Optimising Subsidy higher than production
Catalysing Desired environmental effect
Engaged Support agri-env. farming Finally, styles of participation cannot be readily linked to types of AEMs (that is, similar AEMs may be associated with different participation styles) (Fish et al., 2003, for a similar observation). Grassy headlands and margins, for instance, are applied under most of the participation styles. Nevertheless, our analysis suggests that there are notable differences in that styles of participation do vary between AEMs with different degrees of complexity (Figure 25). Opportunistic, calculating and compensatory styles of participation tend to be restricted to those farmers adopting the simplest AEMs (C1 farmers). Only calculating participants might consider adopting complex AEMs (e.g., hamster preservation to get a cereal premium). The optimising style of participation was most prevalent among C2 farmers. We note here a relationship with linear types of AEMs (many of them apply grassy margins and headlands along woods). In the catalysing style of participation we find all degrees of complexity. However, these farmers have often only one type of AEM, which is the one that will deliver the specific environmental effect aimed at. Engaged participants typically belong to the C3 category. They adopt complex AEMs but, remarkably, they are inclined to adopt more simple AEMs at the same time. Every AEM that can support agri-environmental farming - including economic viability and environmental and societal performance - is a candidate for application. Importantly, this would suggest that the current differentiation in degrees of complexity, that is, between so-called light green and dark green measures, is functional in promoting the uptake of the latter.
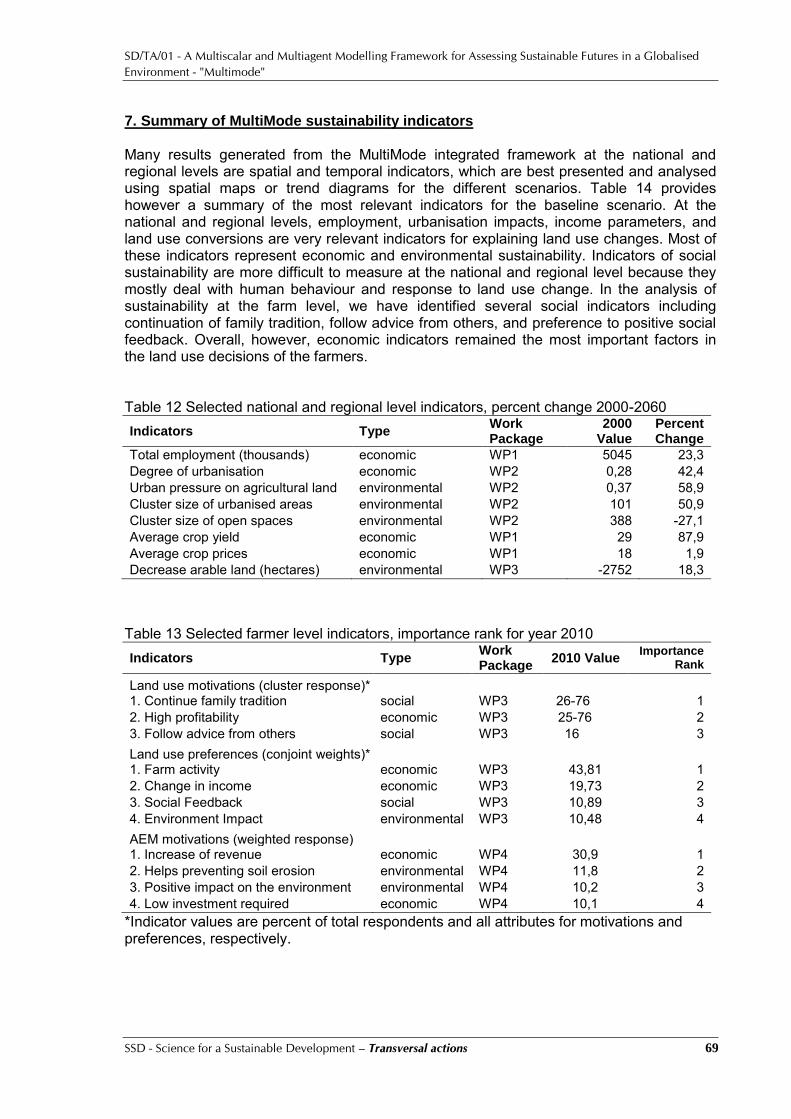
SD/TA/01 - A Multiscalar and Multiagent Modelling Framework for Assessing Sustainable Futures in a Globalised
Environment - "Multimode"
SSD - Science for a Sustainable Development – Transversal actions 69
7. Summary of MultiMode sustainability indicators Many results generated from the MultiMode integrated framework at the national and regional levels are spatial and temporal indicators, which are best presented and analysed using spatial maps or trend diagrams for the different scenarios. Table 14 provides however a summary of the most relevant indicators for the baseline scenario. At the national and regional levels, employment, urbanisation impacts, income parameters, and land use conversions are very relevant indicators for explaining land use changes. Most of these indicators represent economic and environmental sustainability. Indicators of social sustainability are more difficult to measure at the national and regional level because they mostly deal with human behaviour and response to land use change. In the analysis of sustainability at the farm level, we have identified several social indicators including continuation of family tradition, follow advice from others, and preference to positive social feedback. Overall, however, economic indicators remained the most important factors in the land use decisions of the farmers. Table 12 Selected national and regional level indicators, percent change 2000-2060 Indicators Type
Work Package
2000 Value
Percent Change
Total employment (thousands) economic WP1 5045 23,3 Degree of urbanisation economic WP2 0,28 42,4 Urban pressure on agricultural land environmental WP2 0,37 58,9 Cluster size of urbanised areas environmental WP2 101 50,9 Cluster size of open spaces environmental WP2 388 -27,1 Average crop yield economic WP1 29 87,9 Average crop prices economic WP1 18 1,9 Decrease arable land (hectares) environmental WP3 -2752 18,3
Table 13 Selected farmer level indicators, importance rank for year 2010
Indicators Type Work Package
2010 Value Importance
Rank
Land use motivations (cluster response)* 1. Continue family tradition social WP3 26-76 1 2. High profitability economic WP3 25-76 2 3. Follow advice from others social WP3 16 3 Land use preferences (conjoint weights)* 1. Farm activity economic WP3 43,81 1 2. Change in income economic WP3 19,73 2 3. Social Feedback social WP3 10,89 3 4. Environment Impact environmental WP3 10,48 4 AEM motivations (weighted response) 1. Increase of revenue economic WP4 30,9 1 2. Helps preventing soil erosion environmental WP4 11,8 2 3. Positive impact on the environment environmental WP4 10,2 3 4. Low investment required economic WP4 10,1 4
*Indicator values are percent of total respondents and all attributes for motivations and preferences, respectively.


SD/TA/01 - A Multiscalar and Multiagent Modelling Framework for Assessing Sustainable Futures in a Globalised
Environment - "Multimode"
SSD - Science for a Sustainable Development – Transversal actions 71
8. Recommendations in terms of support to the decision The work carried out in the MultiMode project has initiated and supported directly the development and deployment of a nearly identical Cellular Automata Land use model for the Flemish region of Belgium (including Brussels). This model is currently supported and used by three government agencies, namely INBO (Instituut voor Natuur en Bosonderzoek), VMM (Vlaamse Milieumaatschappij) and the Ministerie voor Ruimtelijke Ordening (as the end-user in the Steunpunt Ruimte en Wonen). In a number of projects carried out for these agencies, this model is currently used to analyse the spatial consequences of scenarios related to (1) the development of natural land use (for the NARA-S-2009 report), (2) the evolution of the state of the environment (for the MIRA-S-2009 report), and (3) to carry out analysis aimed at upgrading the Ruimtelijke Structuurplan Vlaanderen. The results of policy analysis and ABM have potential use for VLM and GIREA considering their active involvement in the project. These two institutions, which are responsible for AEM schemes in Flanders and Walloon regions, respectively, have strongly supported the preparation and implementation of the surveys. The project thus aimed to provide them valuable knowledge on how to improve the implementation and increase the acceptance of AEM in both regions in Belgium.


SD/TA/01 - A Multiscalar and Multiagent Modelling Framework for Assessing Sustainable Futures in a Globalised
Environment - "Multimode"
SSD - Science for a Sustainable Development – Transversal actions 73
9. Dissemination of results The following working papers with full documentation of the work carried out, the main results, and recommendations for further analysis are available. H. Brunke, L. Acosta-Michlik, B. Henry de Frahan and M. Rounsevell (2011) Land Use
Change Scenario Development for Belgium in the MultiMode Project, MultiMode Project Working Paper WP1
I. Uljee, R. White, A. Gobin, and G. Engelen (2011) Development and Application of a Multi-scale Constrained Cellular Automata Model for Belgium, MultiMode Project Working Paper WP2
L. Acosta-Michlik, A. Van Herzele, A. Gobin, H. Brunke, MDA Rounsevell, B.H. de Frahan, Tom Waas, and N. Donnez (2011) An agent-based analysis of the impacts of global economic and climatic changes on sustainable agricultural land use in Belgium, MultiMode Project Working Paper WP3
The following articles have been published, accepted or submitted for publication in internationally refereed journals: A. Van Herzele, N. Dendoncker, and L. Acosta-Michlik, Mobilisation capacity for agri-
environmental management, Journal of Environmental Management 92 (2011) 1023-1032
R. White, I. Uljee, and G. Engelen, Integrated Modelling of Population, Employment, and Land Use Change with a Multiple Activity Based Variable Grid Cellular Automaton, International Journal of Geographical Information Science, accepted 2011
A. Van Herzele, A. Gobin, P. Van Gossum, L. Acosta-Michlik, T. Waas, N. Donnez, N. Dendoncker, and B. Henry de Frahan. Effort for money? Farmers‘ response to agri-environment measures with different degrees of complexity, Land Use Policy, submitted 2011
The following articles are scheduled to be submitted as special issue in the journal for Regional Environmental Change in 2011: L. Acosta-Michlik, M.D.A. Rounsevell, and B.H. De Frahan. Editorial article: An
overview on a multiscalar and multiagent modelling (MultiMode) framework for assessing sustainable futures in a globalised environment
L. Acosta-Michlik, M.D.A. Rounsevell, B.H. De Frahan, G. Engelen, A. Van Herzele, R.
White, H. Brunke, and I. Uljee. Developing sustainability indicators using a multiscalar and multiagent modelling approach: The case of Belgium
R. White, I. Uljee, and G. Engelen. Modelling the spatial dynamics of population,
economic activity, and land use: The MultiMode activity based, variable grid cellular automaton approach
L. Acosta-Michlik, A. Van Herzele, D. Murray-Rust, N. Dendoncker, M.D.A. Rounsevell,
B.H. De Frahan, N. Donnez, T. Waas, Anne Gobin and H. Brunke. Assessing land use decisions of agents in a globalised environment: The MultiMode landscape agent-based approach
A. Gobin, L. Acosta-Michlik, A. Van Herzele, Nicolas Donnez, Tom Waas, B.H. De
Frahan, and N. Dendoncker. Farm typology and factors affecting land use and agri-environmental decisions


SD/TA/01 - A Multiscalar and Multiagent Modelling Framework for Assessing Sustainable Futures in a Globalised
Environment - "Multimode"
SSD - Science for a Sustainable Development – Transversal actions 75
10. Follow-up Committee We acknowledge the valuable support of the following Follow-up Committee Members who have been very supportive of the MultiMode project: Jean Marie Bouquiaux and André Bauche
Division de la Politique agricole, Direction générale de l‘Agriculture Ministere de la Region Wallonne Chaussée de Louvain 14, B-5000 Namur, Belgium Email: [email protected], [email protected]
Alain Henry Task Force Développement durable, Bureau fédéral du Plan Avenue des Arts 47-49, 1000 Bruxelles, Belgium Email: [email protected]
Noelle Aarts Communication Science, Wageningen University and Research Centre Hollandseweg 1, 6706 KN Wageningen, The Netherlands Email: [email protected]
Lucien Hoffmann Département Environnement et Agro-biotechnologies (EVA) Centre de Recherche Public-Gabriel Lippmann 41, rue du Brill, L-4422 Belvaux, Grand-Duché du Luxembourg Email: [email protected]
Ludwig Lauwers and Marchand Fleur Instituut voor landbouw en Visserij Onderzoek (ILVO), Eenheid Socio-Economie Burg. Van Gansberghelaan 109, 9820 MERELBEKE, Belgium E-mail : [email protected], [email protected]
Karolien Michiel Vlaamse Landmaatschappij, Afdeling platteland, Dienst Steun- en beheermaatregelen Gulden Vlieslaan 72 - 1060 Brussel, Belgium E-mail: [email protected]
Hans Roosen Bedrijfsplanner, VLM Vlaams-Brabant Diestsevest 25, 3000 Leuven, Belgium E-mail: [email protected]
Thierri Walot, Alain Leroi and Séverine Paque Université catholique de Louvain, Unité d'écologie et de biogéographie Croix du Sud, 4-5 (Carnoy), B-1348 Louvain-La-Neuve, Belgium E-mails: [email protected], [email protected], [email protected]

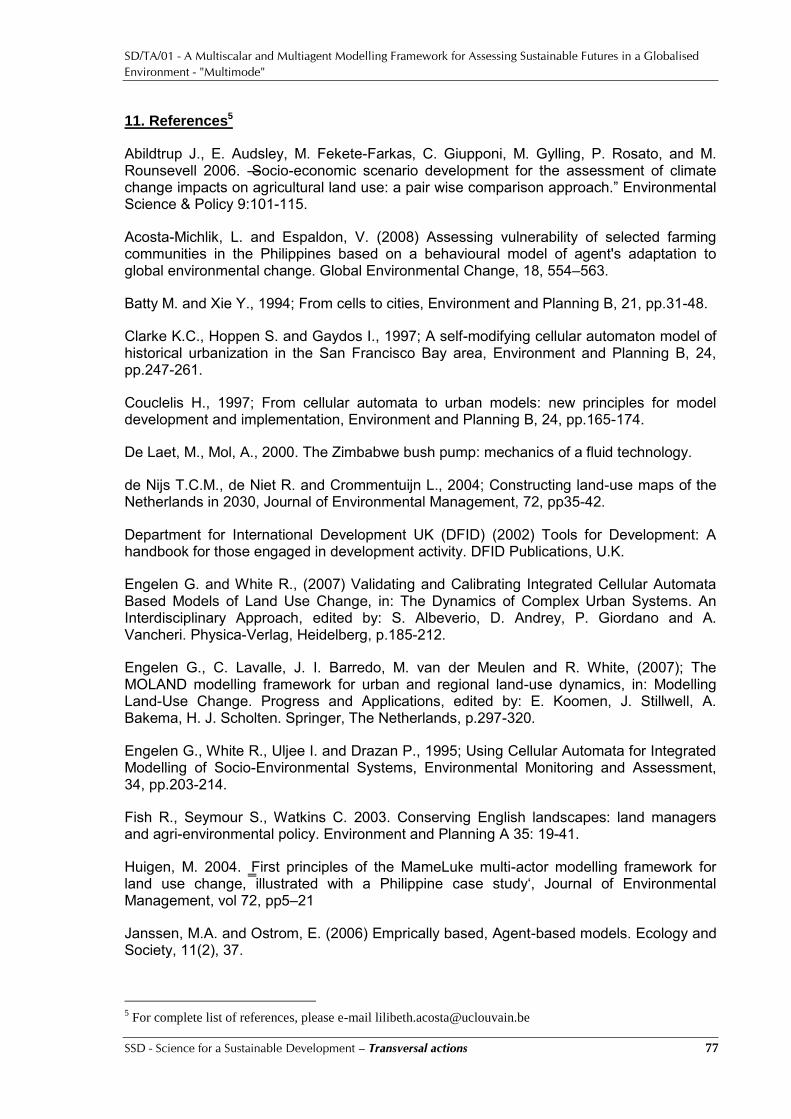
SD/TA/01 - A Multiscalar and Multiagent Modelling Framework for Assessing Sustainable Futures in a Globalised
Environment - "Multimode"
SSD - Science for a Sustainable Development – Transversal actions 77
11. References5
Abildtrup J., E. Audsley, M. Fekete-Farkas, C. Giupponi, M. Gylling, P. Rosato, and M. Rounsevell 2006. ―Socio-economic scenario development for the assessment of climate change impacts on agricultural land use: a pair wise comparison approach.‖ Environmental Science & Policy 9:101-115.
Acosta-Michlik, L. and Espaldon, V. (2008) Assessing vulnerability of selected farming communities in the Philippines based on a behavioural model of agent's adaptation to global environmental change. Global Environmental Change, 18, 554–563.
Batty M. and Xie Y., 1994; From cells to cities, Environment and Planning B, 21, pp.31-48.
Clarke K.C., Hoppen S. and Gaydos I., 1997; A self-modifying cellular automaton model of historical urbanization in the San Francisco Bay area, Environment and Planning B, 24, pp.247-261.
Couclelis H., 1997; From cellular automata to urban models: new principles for model development and implementation, Environment and Planning B, 24, pp.165-174.
De Laet, M., Mol, A., 2000. The Zimbabwe bush pump: mechanics of a fluid technology.
de Nijs T.C.M., de Niet R. and Crommentuijn L., 2004; Constructing land-use maps of the Netherlands in 2030, Journal of Environmental Management, 72, pp35-42.
Department for International Development UK (DFID) (2002) Tools for Development: A handbook for those engaged in development activity. DFID Publications, U.K.
Engelen G. and White R., (2007) Validating and Calibrating Integrated Cellular Automata Based Models of Land Use Change, in: The Dynamics of Complex Urban Systems. An Interdisciplinary Approach, edited by: S. Albeverio, D. Andrey, P. Giordano and A. Vancheri. Physica-Verlag, Heidelberg, p.185-212.
Engelen G., C. Lavalle, J. I. Barredo, M. van der Meulen and R. White, (2007); The MOLAND modelling framework for urban and regional land-use dynamics, in: Modelling Land-Use Change. Progress and Applications, edited by: E. Koomen, J. Stillwell, A. Bakema, H. J. Scholten. Springer, The Netherlands, p.297-320.
Engelen G., White R., Uljee I. and Drazan P., 1995; Using Cellular Automata for Integrated Modelling of Socio-Environmental Systems, Environmental Monitoring and Assessment, 34, pp.203-214.
Fish R., Seymour S., Watkins C. 2003. Conserving English landscapes: land managers and agri-environmental policy. Environment and Planning A 35: 19-41.
Huigen, M. 2004. ‗First principles of the MameLuke multi-actor modelling framework for land use change, illustrated with a Philippine case study‘, Journal of Environmental Management, vol 72, pp5–21
Janssen, M.A. and Ostrom, E. (2006) Emprically based, Agent-based models. Ecology and Society, 11(2), 37.
5 For complete list of references, please e-mail [email protected]
SD/TA/01 - A Multiscalar and Multiagent Modelling Framework for Assessing Sustainable Futures in a Globalised
Environment - "Multimode"
SSD - Science for a Sustainable Development – Transversal actions 78
Latour, B., 2005. Reassembling the Social. An Introduction to Actor-Network-Theory.
Li X. and Yeh A. Gar-on, 2000; Modelling sustainable urban development by the integration of constrained cellular automata and GIS, International Journal of Geographical Information Science, 14, 2, pp.131-152.
Poelmans L. and Van Rompaey A. (2010). Complexity and performance of urban expansion models, Computers, Environment, and Urban Systems, vol. 34, 17-27.
Polhill, J.G., Sutherland, L., and Gotts, N.M., 2010. Using Qualitative Evidence to Enhance an Agent-Based Modelling System for Studying Land Use Change. Journal of Artificial Societies and Social Simulation 13 (2).
Rounsevell, M. D. A., Ewert, F., Reginster, I., Leemans, R. and Carter, T. R. 2005. ‗Future scenarios of European agricultural land use. II: Projecting changes in cropland and grassland‘, Agriculture, Ecosystems and Environment, vol 107, pp117–135
Rounsevell, M.D.A., I. Reginster, M.B. Araujo, T.R. Carter, N. Dendoncker, F. Ewert, J.I. House, S.Kankaanpaeae, R. Leemans, M.J. Metzger, C. Schmit, P.Smith, G. Tuck 2006a. ―A Coherent Set of Future Land Use Scenarios for Europe Agriculture, Ecosystems and the Environment 114:57-68
Tashakkori A., Teddlie C. 2003. Handbook of mixed methods in social and behavioral research. Sage, Thousand Oaks.
Valbuena, D. Verburg, P.H. and Bregt, A.K. (2008) A Method to Define a Typology for Agent-based Analysis in Regional Land-us Research. Agriculture, Ecosystems and Environment 128, 27–36.
Valbuena, D., Verburg, P.H., Bregt, A.K., and Ligtenberg, A. (2009) An agent-based approach to model land-use change at a regional scale. Landscape Ecology, DOI 10.1007/s10980-009-9380-6
van Delden et. al, 2005. ‗PRELUDE Quantification and Spatial Modelling of Land use / Land cover Changes, Research Institute for Knowledge Systems, Maastricht, the Netherlands.
van Delden H., Luja P. and Engelen G., 2007; Integration of Multi-Scale Dynamic Spatial Models of Socio-Economic and Physical Processes for River Basin Management, Environmental Modelling & Software, 22, pp.223-238.
Verstraeten G., Poesen J. The nature of small-scale flooding, muddy floods and retention pond sedimentation in central Belgium. Geomorphology 29: 275-292.
White R. and Engelen G., 1997; Cellular Automata as the Basis of Integrated Dynamic Regional Modelling, Environment and Planning B, 24, pp.235-246.
White R., B. Straatman and G. Engelen, 2004; Planning Scenario Visualization and Assessment: A Cellular Automata Based Integrated Spatial Decision Support System, in: Spatially Integrated Social Science, edited by: M. F. Goodchild and D. Janelle, Oxford University Press, New York, USA, p.420-442. White R., Uljee I. and Engelen G..(submitted) Integrated Modelling of Population, Employment, and Land Use Change with a Multiple Activity Based Variable Grid Cellular Automaton
SD/TA/01 - A Multiscalar and Multiagent Modelling Framework for Assessing Sustainable Futures in a Globalised
Environment - "Multimode"
SSD - Science for a Sustainable Development – Transversal actions 79
ANNEXES
The annexes are available on our website
http://www.belspo.be/belspo/ssd/science/pr_transversal_en.stm