multimodal traffic impact study for - city of pasadena at colorado project -multimodal traffic...
TRANSCRIPT

Multimodal Traffic Impact Study for:
The Lake at Colorado Project Pasadena, California
Prepared for:
City of Pasadena
Submitted by:
180 Grand Avenue Suite 250 Oakland, CA 94612 Phone: (510) 839-1742 Uwww.dowlinginc.com U Contact: Bill Cisco or Aaron Elias
February 15, 2011

S - 1
EXECUTIVE SUMMARY
A multimodal traffic impact study was performed by Dowling Associates to assess the impacts of the proposed Lake at Colorado development project on the four primary modes of travel: auto, transit, pedestrian, and bicycle. The project is located on Colorado Boulevard (Historic Route 66) between Lake Avenue and Mentor Avenue in downtown Pasadena, California and is proposed to contain the following at build out: a 156-room hotel, 5 multi-family residential units, 14,400 square feet of retail, 37,860 square feet of restaurant, 103,410 square feet of office, and 8,010 square feet of bank space0F
1. Existing, 2015, and 2015 + Project conditions were all analyzed using the CompleteStreetsLOS™ 1F
2 software. This multimodal software analysis allowed Dowling Associates to quantify the LOS for all primary modes of travel along a roadway; whereas traditional analysis has typically focused exclusively on the automobile mode for any quantitative assessments. Table ES-1 and Table ES-2 present summary tables of each analysis corridor’s overall facility LOS score and letter grade for Lake Avenue and Colorado Boulevard, respectively. These scores are based on combining the intersection and segment scores using the equations from the multimodal LOS methodology documented in NCHRP Report 616: Multimodal Level of Service for Urban Streets2F
3, the precursor for the new urban streets segment chapter in the upcoming 2010 Highway Capacity Manual (HCM). In addition to reporting the results for each of the four principle modes, these tables also give an overall weighted average for all four modes using the facility. This weighted average was determined assuming all four modes are equally important to the City of Pasadena3F
4.
1 Final Transportation Study for the Lake at Colorado Project DEIR, Raju Associates, May 24, 2010.
2 The CompleteStreetsLOS™ software is authored and distributed by Dowling Associates, Inc. Please see www.CompleteStreetsLOS.com for more information.
3 R. Dowling, et al. National Highway Cooperative Research Program Report 616: Multimodal Level of Service Analysis for Urban Streets. Transportation Research Board, 2008.
4 The weighted average of all modes could be calculated differently, with varying weights given to each of the modes based on City preference.

S - 2
Table ES-1 Summary of Facility Scores by Mode and Overall Score for Lake Avenue
Direction Mode AM Peak PM Peak
Existing 2015 2015 + Proj Existing 2015 2015 + Proj
Northbound
Auto 2.75 (B) 2.76 (C) 2.76 (C) 2.78 (C) 2.80 (C) 2.80 (C)
Transit 1.48 (A) 1.51 (A) 1.52 (A) 1.54 (A) 1.60 (A) 1.62 (A)
Pedestrian 2.84 (C) 2.89 (C) 2.90 (C) 2.92 (C) 2.98 (C) 3.00 (C)
Bicycle 4.06 (D) 4.10 (D) 4.11 (D) 4.10 (D) 4.15 (D) 4.16 (D)
Overall 2.78 (C) 2.82 (C) 2.82 (C) 2.84 (C) 2.88 (C) 2.90 (C)
Southbound
Auto 2.78 (C) 2.81 (C) 2.81 (C) 2.81 (C) 2.85 (C) 2.86 (C)
Transit 1.27 (A) 1.33 (A) 1.33 (A) 1.62 (A) 1.70 (A) 1.70 (A)
Pedestrian 2.92 (C) 2.99 (C) 2.99 (C) 2.96 (C) 3.03 (C) 3.04 (C)
Bicycle 3.97 (D) 4.03 (D) 4.03 (D) 4.01 (D) 4.09 (D) 4.10 (D)
Overall 2.74 (B) 2.79 (C) 2.79 (C) 2.85 (C) 2.92 (C) 2.93 (C)
Source: Dowling Associates, Inc. Table ES-2 Summary of Facility Scores by Mode and Score for Colorado Boulevard
Direction Mode AM Peak PM Peak
Existing 2015 2015 + Proj Existing 2015 2015 + Proj
Eastbound
Auto 2.97 (C) 2.99 (C) 2.99 (C) 3.04 (C) 3.08 (C) 3.09 (C)
Transit 1.29 (A) 1.32 (A) 1.32 (A) 1.36 (A) 1.43 (A) 1.44 (A)
Pedestrian 2.46 (B) 2.52 (B) 2.54 (B) 2.65 (B) 2.77 (C) 2.79 (C)
Bicycle 3.39 (C) 3.42 (C) 3.42 (C) 3.47 (C) 3.50 (C) 3.51 (D)
Overall 2.53 (B) 2.56 (B) 2.57 (B) 2.63 (B) 2.70 (B) 2.71 (B)
Westbound
Auto 3.02 (C) 3.05 (C) 3.05 (C) 3.02 (C) 3.06 (C) 3.06 (C)
Transit 1.26 (A) 1.32 (A) 1.33 (A) 1.47 (A) 1.54 (A) 1.54 (A)
Pedestrian 2.58 (B) 2.67 (B) 2.68 (B) 2.61 (B) 2.71 (B) 2.72 (B)
Bicycle 3.29 (C) 3.32 (C) 3.32 (C) 3.30 (C) 3.33 (C) 3.33 (C)
Overall 2.54 (B) 2.59 (B) 2.60 (B) 2.60 (B) 2.66 (B) 2.66 (B)
Source: Dowling Associates, Inc. Auto scores reflect LOS C conditions on Colorado Boulevard for all three scenarios (Existing, 2015, and 2015 + Project). Lake Avenue performs a little better with a mix of LOS B and LOS C scores throughout all three scenarios. The auto methodology used is based on the predicted number of stops a vehicle is likely to make while driving along the corridor. These analysis corridors have fairly good signal progression, and few access points along the main streets. This leads to few stops on these two roadways today.

S - 3
The auto intersection scores were analyzed using the ICU method as stipulated by the City of Pasadena. This analysis was originally performed by Raju Associates4F
5, the consultants who prepared the traditional traffic impact study for the project. They determined that the intersection of Lake Avenue and Walnut Street would be significantly impacted by project trips. Their proposed mitigation measure was additional transit service in the area and reduced transit fares for those utilizing the new project. The City of Pasadena has established significant impact criteria for the automobile mode at intersection; however, the guidelines of significance for transit, pedestrian and bicycle modes are currently under development. For the purposes of this analysis, we have selected LOS C as the threshold criteria for the non-auto modes. Any increase in LOS score with the addition of project trips that either pushes the LOS from LOS C or better to LOS D or worse, or that further degrades conditions that are already in the LOS D or worse range without the project without the project, would constitute a significant impact. The existing transit scores on these two corridors are excellent due to the many operational routes with frequent bus arrivals. This results in an LOS score of LOS A for both facilities. The Lake at Colorado project would not cause significant changes to the average speed along the corridor or the loss of bus routes; therefore, this development would not affect the transit score significantly. Pedestrian LOS on Lake Avenue is LOS C for all scenarios. Colorado Boulevard with its lighter traffic and better pedestrian facilities operates in the LOS B and LOS C range. Since none of these scores were worse than LOS C, the project would not have a significant impact on pedestrian LOS. The bicycle LOS score was the worst of the four major modes for the two roadways. Lake Avenue was generally operating at LOS D while Colorado Boulevard was mostly operating at LOS C for the Existing conditions. Lake Avenue was the worst of the two because it does not provide much accommodation for bicyclists. Colorado Boulevard has a fairly wide shoulder that is not much more than 50% occupied by parked cars, which provides a better segment LOS score due to the extra room bicyclists have which provides a better perception of the roadway. Since most of Lake Avenue is already operating at LOS D or worse, the addition of the project trips would cause a significant impact requiring mitigation. The mitigation measure proposed by Dowling Associates to improve bicycle LOS is to restrict on-street parking on Lake Avenue south of Colorado Boulevard during the AM and PM peak period (detailed in the Segment LOS Analysis section of the report). This mitigation measure would significantly improve the bicycle LOS while
5 Final Transportation Study for the Lake at Colorado Project DEIR, Raju Associates, Inc., May 24, 2010.

S - 4
only slightly affecting the other modes. However, there would be secondary effects of the loss of on-street parking during the peak hours to the adjacent merchants and property owners along this stretch of roadway.
Lake at Colorado Project -Multimodal Traffic Impact Study i
Dowling Associates, Inc.Transportation Engineering Planning Research Education
TABLE OF CONTENTS
1. INTRODUCTION ..................................................................................................................................... 1
Project Description .................................................................................................................................... 1
Project Location and Circulation Network ................................................................................................. 1
Existing Conditions .................................................................................................................................... 3
2. METHODOLOGIES AND DATA ACQUISITION .................................................................................... 5
Multimodal Level of Service Methodology ................................................................................................. 5
ICU Level of Service Methodology ............................................................................................................ 7
Data Collection .......................................................................................................................................... 7
Field Observations and Satellite Imagery .............................................................................................. 8
Traffic and Signal Information ................................................................................................................ 8
Transit Information ................................................................................................................................. 9
Other Information ................................................................................................................................... 9
Impact Threshold Criteria .......................................................................................................................... 9
3. TRAFFIC ANALYSIS ............................................................................................................................ 10
Traffic Volumes ........................................................................................................................................ 10
Segment LOS Analysis............................................................................................................................ 16
Lake Avenue Segment LOS ................................................................................................................ 16
Colorado Boulevard Segment LOS ..................................................................................................... 18
Intersection LOS Analysis ....................................................................................................................... 21
Lake Avenue Intersection Scores ........................................................................................................ 22
Colorado Boulevard Intersection Scores ............................................................................................. 24
4. IMPACTS AND MITIGATION MEASURES .......................................................................................... 30
Lake Avenue Segment LOS Mitigations .................................................................................................. 30
Lake Avenue Intersection LOS Mitigations ............................................................................................. 32
Suggestions Regarding Setting Significance Criteria .............................................................................. 34
APPENDIX A – DETAILED SEGMENT LOS CALCULATIONS
APPENDIX B – DETAILED INTERSECTION LOS CALCULATIONS
APPENDIX C – CompleteStreetsLOS™ OUTPUTS

Lake at Colorado Project -Multimodal Traffic Impact Study ii
Dowling Associates, Inc.Transportation Engineering Planning Research Education
LIST OF FIGURES
Figure 1 – Analyzed Segments and Intersections ........................................................................................ 2
Figure 6 – Existing Peak Hour Traffic Volumes .......................................................................................... 12
LIST OF TABLES
Table 1 – Threshold Values for Each LOS Letter Grade (All Modes) ........................................................... 6
Table 2 – LOS Definitions for ICU Methodology ........................................................................................... 7
Table 3 – Pasadena ICU Significant Impact Criteria .................................................................................. 10
Table 4 – LOS for the Worst Direction of Each Segment on Lake Avenue during the AM Peak ............... 17
Table 5 – LOS for the Worst Direction of Each Segment on Lake Avenue during the PM Peak ............... 18
Table 6 – LOS for the Worst Direction of Each Segment on Colorado Boulevard during the AM Peak .... 20
Table 7 – LOS for the Worst Direction of Each Segment on Colorado Boulevard during the PM Peak .... 21
Table 8 – LOS for the Worst Approach to Each Intersection on Lake Avenue during the AM Peak .......... 23
Table 9 – LOS for the Worst Approach to Each Intersection on Lake Avenue during the PM Peak .......... 24
Table 10 – LOS for the Worst Approach to Each Intersection on Colorado Boulevard during the AM Peak26
Table 11 – LOS for the Worst Approach to Each Intersection on Colorado Boulevard during the PM Peak27
Table 12 – Segment LOS Results of the Proposed Mitigations on Lake Avenue during the AM Peak ...... 31
Table 13 – Segment LOS Results of Proposed Mitigations on Lake Avenue during the PM Peak ............ 32
Table 14 – Intersection LOS Results of Proposed Mitigations on Lake Avenue during the AM Peak ....... 33
Table 15 – Intersection LOS Results of the Proposed Mitigations on Lake Avenue during the PM Peak . 34

Lake at Colorado Project -Multimodal Traffic Impact Study 1
Dowling Associates, Inc.Transportation Engineering Planning Research Education
MULTIMODAL TRAFFIC IMPACT STUDY Lake at Colorado Project
PASADENA, CALIFORNIA February 15, 2011
1. INTRODUCTION
The purpose of this multimodal traffic analysis is to estimate the impacts of the Lake at Colorado Project on the auto, transit, bicycle, and pedestrian modes during the AM and PM peak hour traffic conditions.
Project Description
The Lake at Colorado Project is proposed to be a commercial development consisting of a hotel, bank, specialty retail, and restaurants. Off-street parking, including a surface lot and a parking structure, would also be a part of this project. This project is planned to be built out in three phases. However, this assessment will analyzes the final completed build out which includes: a 156-room hotel, 5 multi-family residential units, 14,400 square feet of retail, 37,860 square feet of restaurant, 103,410 square feet of office, and 8,010 square feet of bank space5F
6.
Project Location and Circulation Network
The proposed project location is in downtown Pasadena, California at the intersection of Colorado Boulevard (Historic Route 66) and Lake Avenue. Colorado Boulevard is a primary east-west arterial providing access from the Ventura Freeway (SR134) to the west to downtown Pasadena. Lake Avenue runs north-south and is the primary arterial providing access to downtown Pasadena from Interstate 210. The limits of this study determined by the City of Pasadena and Dowling Associates are from Walnut Street to Cordova Street on Lake Avenue and from El Molino Avenue to Wilson Avenue on Colorado Boulevard. Figure 1 provides an overview of the segments and intersections studied for this multimodal impact analysis.
6 Final Transportation Study for the Lake at Colorado Project DEIR, Raju Associates, May 24, 2010.

ProjectSite
E Union St
E Walnut St
E Colorado Blvd
E Green St
Cordova St
ElM
olin
oA
ve
Oa
kK
no
llA
ve
Hu
dso
nA
ve
Lake
Ave
Me
nto
rA
ve
Ca
talin
aA
ve
Wils
on
Av
e
Oa
kla
nd
Av
e
Los
Ro
ble
sA
ve
NC
he
ste
rA
ve
SC
he
ste
rA
ve
NM
ich
iga
nA
ve
Ma
rV
ista
Av
e
SM
ich
iga
nA
ve
Project Site & Study IntersectionsFigure 1
Project Site & Study IntersectionsFigure 1
City of Pasadena Multimodal LOS Development Impact Analysis
Colorado Ave Study Intersection
Not to Scale
N
S
W E
Lake Avenue Study Intersection
LEGEND
Project Site

Lake at Colorado Project -Multimodal Traffic Impact Study 3
Dowling Associates, Inc.Transportation Engineering Planning Research Education
Existing Conditions
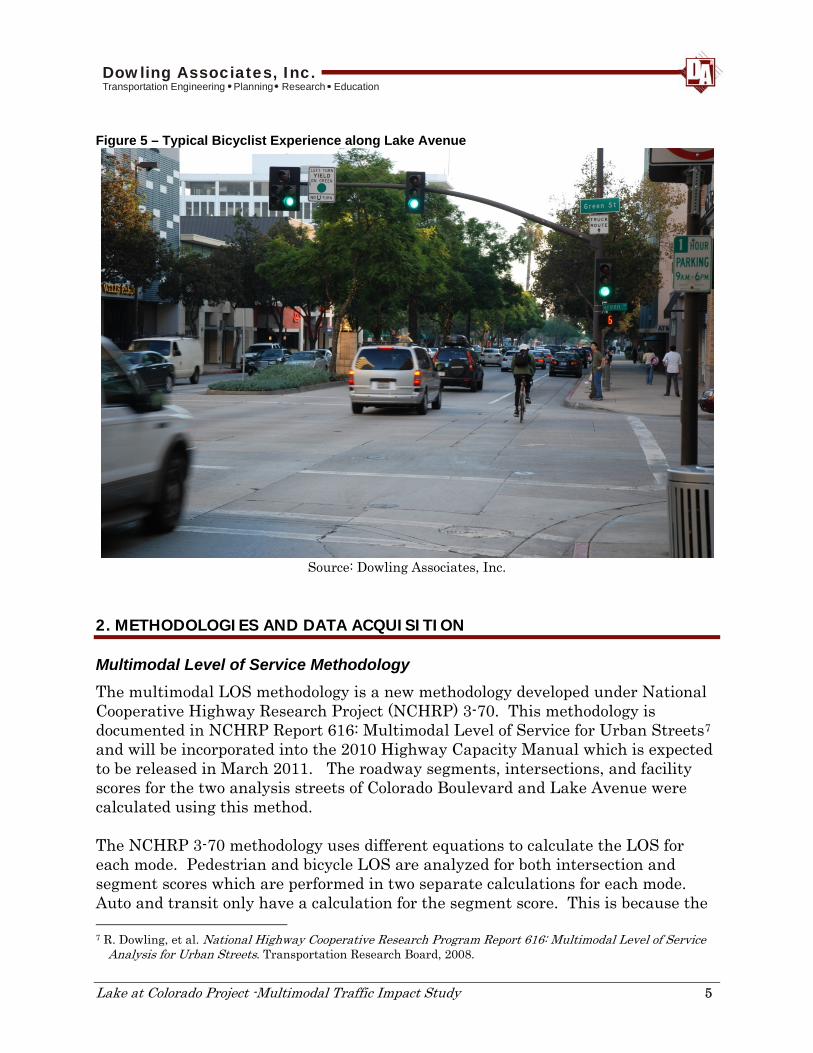
Figure 2 and Figure 3 show typical cross sectional views of Colorado Boulevard and Lake Avenue respectively. Within the study area Colorado Boulevard is typically a four lane facility with a center painted median and parking on both sides. Lake Avenue is typically six lanes north of Colorado Boulevard and four lanes south of Colorado Boulevard in the study area. Parking is allowed in the four lane sections of Lake Avenue (south of Colorado Boulevard) but not in the six lane sections (north of Colorado Boulevard). Figure 4 and Figure 5 show the typical pedestrian and bicyclist views respectively. The pedestrians usually have about a 6-10 foot clear width of sidewalk (unobstructed) with a 4-5 foot buffer zone (physical separation between traffic and the sidewalk). As Figure 5 shows, bicyclists do not have a dedicated bike lane, forcing them to use the sidewalk, parking lane, or street. Figure 2 – Typical Cross Sectional View of Colorado Boulevard
Source: Dowling Associates, Inc.

Lake at Colorado Project -Multimodal Traffic Impact Study 4
Dowling Associates, Inc.Transportation Engineering Planning Research Education
Figure 3 – Typical Cross Sectional View of Lake Avenue
Source: Dowling Associates, Inc.
Figure 4 – Typical Pedestrian Experience along Colorado Boulevard
Source: Dowling Associates, Inc.
Lake at Colorado Project -Multimodal Traffic Impact Study 5
Dowling Associates, Inc.Transportation Engineering Planning Research Education
Figure 5 – Typical Bicyclist Experience along Lake Avenue
Source: Dowling Associates, Inc.
2. METHODOLOGIES AND DATA ACQUISITION
Multimodal Level of Service Methodology
The multimodal LOS methodology is a new methodology developed under National Cooperative Highway Research Project (NCHRP) 3-70. This methodology is documented in NCHRP Report 616: Multimodal Level of Service for Urban Streets6F
7 and will be incorporated into the 2010 Highway Capacity Manual which is expected to be released in March 2011. The roadway segments, intersections, and facility scores for the two analysis streets of Colorado Boulevard and Lake Avenue were calculated using this method. The NCHRP 3-70 methodology uses different equations to calculate the LOS for each mode. Pedestrian and bicycle LOS are analyzed for both intersection and segment scores which are performed in two separate calculations for each mode. Auto and transit only have a calculation for the segment score. This is because the 7 R. Dowling, et al. National Highway Cooperative Research Program Report 616: Multimodal Level of Service
Analysis for Urban Streets. Transportation Research Board, 2008.

Lake at Colorado Project -Multimodal Traffic Impact Study 6
Dowling Associates, Inc.Transportation Engineering Planning Research Education
auto intersection analysis can be handled by other methods (HCM, ICU, Circular 212) and transit LOS is better captured at the broader segment level rather than for each intersection. The full details of the calculation equations and required inputs for the intersection and segment LOS methodologies can be found in the NCHRP 616 report. Investigating these equations will show varying sensitivities for each mode described here. The auto mode is most sensitive to saturation flow rate, AADT, segment length, and the arrival type. Transit is the other motorized mode that has a strong relationship with how the autos are progressing on the analysis segment. The four most important factors for transit include: leeway for which a bus is considered on time, bus frequency, auto speed, and on-time percentage. When looking at the non-motorized modes, bicycles are affected by the number of right side driveways, segment length, parking and lane width, pavement condition, and the parking occupancy percentage. A good pedestrian LOS would result from segments where there is a large separation between traffic and the sidewalk (buffer zone). Large physical barriers separating pedestrians from traffic is also important to maintaining an excellent pedestrian LOS score. Once output scores from the methodology equations are calculated, they are assigned a letter grade based on the threshold values shown in Table 1. As this table shows, higher scores mean a worse LOS. Therefore, improvements in LOS will show up as negative differences while worsening LOS will show a positive difference between scenarios. Table 1 – Threshold Values for Each LOS Letter Grade (All Modes)
To assist in implementing the multimodal methodology, Dowling Associates utilized a new software program called CompleteStreetsLOS™ which was created to implement this procedure. The only deviation from the use of the multimodal LOS methodology was to use the ICU method to provide an intersection auto LOS since this is the intersection LOS method used currently by the City of Pasadena for traditional traffic impact studies. Otherwise, the same procedures recommended in NCHRP Report 616 and the 2010 Highway Capacity Manual were used to evaluate the LOS of the four primary modes.

Lake at Colorado Project -Multimodal Traffic Impact Study 7
Dowling Associates, Inc.Transportation Engineering Planning Research Education
ICU Level of Service Methodology
The Intersection Capacity Utilization (ICU) method is the method stimulated by the City of Pasadena requirements for analyzing intersection conditions. The calculations for the auto intersection LOS reported in this multimodal analysis were performed by Raju Associates who performed the original transportation study on this project. Their report7F
8 on this development was finished in May of 2010 and has the details of these ICU calculations. Typically a capacity of 1,600 vehicles per lane per hour is assumed in the capacity calculations of the ICU method. However, Raju Associates met with the City and since all of the study intersections are currently connected to the City’s Traffic Management Center (TMC), a capacity of 1,700 vehicles per lane per hour was utilized in their analysis. Table 2 – LOS Definitions for ICU Methodology
Level of Service
Volume/Capacity Ratio Definition
A 0.000 – 0.600 EXCELLENT. No Vehicle waits longer than one red light and no approach phase is fully used.
B >0.600 – 0.700 VERY GOOD. An occasional approach phase is fully utilized; many drivers begin to feel somewhat restricted within groups of vehicles.
C >0.700 – 0.800 GOOD. Occasionally drivers may have to wait through more than one red light; backups may develop behind turning vehicles.
D >0.800 – 0.900
FAIR. Delays may be substantial during portions of the rush hours, but enough lower volume periods occur to permit clearing of developing lines, preventing excessive backups.
E >0.900 – 1.000 POOR. Represents the most vehicles intersection approaches can accommodate; may be long lines of waiting vehicles through several signal cycles.
F >1.000
FAILURE. Backups from nearby locations or on cross streets may restrict or prevent movement of vehicles out of the intersection approaches. Tremendous delays with continuously increasing queue lengths
Source: Transportation Study for the Lake at Colorado Project DEIR performed by Raju Associates Inc
Data Collection
A field visit was performed by Dowling Associates on November 18, 2010 to observe the local conditions and verify the validity of satellite imagery and camera car surveys of Lake Avenue and Colorado Boulevard. Traffic counts and signal
8 Final Transportation Study for the Lake at Colorado Project DEIR, Raju Associates, Inc., May 24, 2010.

Lake at Colorado Project -Multimodal Traffic Impact Study 8
Dowling Associates, Inc.Transportation Engineering Planning Research Education
information data were obtained from the City of Pasadena. Additionally, transit information was obtained from local transit agency websites.
Field Observations and Satellite Imagery
Field observations and readily available satellite imagery were used to determine most of the information required to perform a multimodal LOS analysis. This information included:
Crosswalk Widths Segment Lengths Number of Lanes Speed Limits Number of Bus Stops on
Each Segment Presence of Right Turn
Islands Median Type
Number of Large Barrier Objects
Cross Sectional Widths Number of left/right access
points along the segment Bus Stop Amenities Pavement Condition Presence of Left Turn
Pockets Spot check measurements of lengths/widths were taken in the field and then compared with Google Earth8F
9 measured values at the same location. These spot checks all yielded the same values, allowing Dowling Associates to verify the accuracy of the satellite collected measurements throughout the study area. Traffic and Signal Information
City staff provided traffic counts and signal information for all the signalized intersections on Lake Avenue and all the major signalized intersections on Colorado Boulevard. This information was used to get the following input data items: g/C Ratio for Through Movement Walk Phase Timing Peak hour factor(PHF) “K” Factor
Cycle Length Whether Signal System is
Coordinated Peak Hour 2-way volumes Directional Volume Distribution
The intersection turn movement counts were used to generate the turn percentages and two-way directional flows for each segment for all three analysis scenarios (Existing, 2015, 2015 + Project). City staff did not have traffic counts on Colorado Boulevard at the Oak Knoll Avenue, Hudson Avenue, and Wilson Avenue intersections. The turn movements at these intersections were synthesized using a combination of tube counts and traffic flow patterns of the closest available
9 Google Inc. (2010). Google Earth (Version 5.2.1.1588) [Software]. Available from
http://www.google.com/earth/index.html.

Lake at Colorado Project -Multimodal Traffic Impact Study 9
Dowling Associates, Inc.Transportation Engineering Planning Research Education
intersection with actual counts. The results of the two-way directional volumes are reported in Figure 6 through Figure 9.
Transit Information
Transit information was gathered from the internet by visiting the sites of the three transit agencies serving this corridor (LA’s Metro, Foothill Transit, and the City of Pasadena’s ARTS system). This information included which routes served the corridor, frequency, and schedule speed of each route.
Other Information
Since this study lacked a full data collection effort, some information required for a multimodal analysis was estimated using standard defaults and engineering judgment. These data included:
On-street parking: the complete segment length available to parked cars was divided by total segment length to obtain percent of street occupied by on-street parking, since on-street parking was highly utilized during the field observation.
Pedestrian volumes: set at 100 pedestrians per hour Adjusted saturation flow rates: taken from base default values recommended
in HCM 2000 depending on the movements allowed from the through lanes The bus load factor: assumed to be 80% for all transit routes Transit on-time performance: assumed to be 75% Average passenger trip length: used the national average of 3.7 miles The percentage of heavy vehicles was assumed to be 2%
Impact Threshold Criteria
This subsection describes the criteria used to determine if the proposed project’s traffic impacts are significant and therefore require mitigation. The City of Pasadena has established the thresholds in Table 3 for the auto intersection ICU method. An example of its application would be that if the 2015 No Project conditions were operating at LOS D, then the project would not cause a significant impact as long as the V/C ratio of the intersection did not change by more than 0.03. If the V/C ratio change is greater than 0.03, it is a significant impact that requires mitigation.

Lake at Colorado Project -Multimodal Traffic Impact Study 10
Dowling Associates, Inc.Transportation Engineering Planning Research Education
Table 3 – Pasadena ICU Significant Impact Criteria
Intersection LOS Project-related increase Project Conditions in V/C Ratio
A 0.06 B 0.05 C 0.04 D 0.03 E 0.02 F 0.01
Source: Transportation Study for the Lake at Colorado Project DEIR performed by Raju Associates Inc
The City of Pasadena has not yet developed impact criteria for the new multimodal LOS methodology. For the purposes of this illustrative analysis, Dowling Associates has selected LOS C as the threshold criteria for multimodal analysis. Any increase in LOS score with the addition of project trips that either pushes the LOS from LOS C or better to LOS D or worse, or that further degrades the LOS that is already in the LOS D or worse range without the project, would constitute a significant impact. While this may be considered a conservative LOS criterion, it would reflect Pasadena striving to provide high functioning facilities for all users.
3. TRAFFIC ANALYSIS
Traffic Volumes
Traffic volumes for this multimodal traffic impact study were collected from a number of sources. The main source was the final transportation study for this development that was completed by Raju Associates9F
10. This report included all of the major intersection and most of the smaller ones. These counts were collected in April and May 2008. Project Trip Generation The project’s trip generation would result in a net total of approximately 4,900 daily trips of which 289 (210 inbound, 79 outbound) would occur during the morning peak hour and 488 trips (225 inbound, 263 outbound) during the evening peak hour10F
11. Transit trip generation was estimated to be approximately 598 daily transit trips including 32 morning peak hour transit trips and 58 evening peak hour transit trips11F
12, assuming assume an Average Vehicle Occupancy (AVO) of 1.40 and a 10 Final Transportation Study for the Lake at Colorado Project DEIR, Raju Associates, Inc., May 24, 2010.
11 Ibid, p. 58.
12 Ibid, p. 127.
Lake at Colorado Project -Multimodal Traffic Impact Study 11
Dowling Associates, Inc.Transportation Engineering Planning Research Education
maximum of 7% reduction in auto trips resulting in 7% of the total person trips using transit, per Los Angeles County Congestion Management Program guidelines. No estimates of pedestrian or bicycle trips were given in the Raju study. However, the multimodal analysis does not utilize the number of bicycle trips in its calculations. Additionally, the pedestrian component of the multimodal analysis is based either on an extremely high density of pedestrian activity (e.g., New York City) or on the multimodal street characteristics. Since pedestrian density was not extremely high, the growth in pedestrians from the project did not need to be accounted for when utilizing the multimodal method in this location. Project Trip Distribution The generalized distribution of project trips is:
To and from the North: 20% To and from the South: 18% To and from the East: 27% To and from the West: 35%
The specific assignment of project trips was taken from the Raju study12F
13. The traffic data at intersections that were not included in this report were either collected from City staff or synthesized based on upstream and downstream intersections where volumes were known. The final result was to convert these intersection turn movement counts into peak hour direction volumes which are needed for the multimodal method. Figure 6 through Figure 9 show the resulting segment directional flows for Existing, 2015, Project only, and 2015 + Project volumes respectively.
13 Ibid, p. 45.

ProjectSite
E Union St
E Walnut St
E Colorado Blvd
E Green St
Cordova St
ElM
olin
oA
ve
Oa
kK
no
llA
ve
Hu
dso
nA
ve
Lake
Ave
Me
nto
rA
ve
Ca
talin
aA
ve
Wils
on
Av
e
Oa
kla
nd
Av
e
Los
Ro
ble
sA
ve
Del Mar Blvd
NC
he
ste
rA
ve
SC
he
ste
rA
ve
NM
ich
iga
nA
ve
Ma
rV
ista
Av
e
SM
ich
iga
nA
ve
AM (PM) Existing VolumesFigure 6
AM (PM) Existing VolumesFigure 6
City of Pasadena Multimodal LOS Development Impact Analysis
Not to Scale
N
S
W E
AM (PM) Directional Volumes
LEGEND
Project Site# (#)
#
(#)
480 (950) 513 (1,035) 471 (909) 430 (940) 480 (1,010) 470 (970)
965 (832)880 (895)910 (900)855 (950)840 (932)571 (997)
980
(925)
900
(1,010)
1,065
(1,210)
875
(1,295)
1,045
(1,230)
1,165
(1,120)
1,285
(1,445)
1,410
(1,495)

ProjectSite
E Union St
E Walnut St
E Colorado Blvd
E Green St
Cordova St
ElM
olin
oA
ve
Oa
kK
no
llA
ve
Hu
dso
nA
ve
Lake
Ave
Me
nto
rA
ve
Ca
talin
aA
ve
Wils
on
Av
e
Oa
kla
nd
Av
e
Los
Ro
ble
sA
ve
Del Mar Blvd
NC
he
ste
rA
ve
SC
he
ste
rA
ve
NM
ich
iga
nA
ve
Ma
rV
ista
Av
e
SM
ich
iga
nA
ve
AM (PM) 2015 VolumesFigure 7
AM (PM) 2015 VolumesFigure 7
City of Pasadena Multimodal LOS Development Impact Analysis
Not to Scale
N
S
W E
LEGEND
Project SiteAM (PM) Directional Volumes# (#)
#
(#)
625 (1,229) 671 (1,344) 608 (1,182) 541 (1,147) 600 (1,214) 592 (1,175)
1,197 (1,013)1,084 (1,082)1,115 (1,090)1,121 (1,171)1,031 (1,151)723 (1,242)
1,128
(1,074)
1,048
(1,164)
1,278
(1,454)
1,003
(1,494)
1,185
(1,400)
1,310
(1,295)
1,486
(1,634)
1,631
(1,709)

ProjectSite
E Union St
E Walnut St
E Colorado Blvd
E Green St
Cordova St
ElM
olin
oA
ve
Oa
kK
no
llA
ve
Hu
dso
nA
ve
Lake
Ave
Me
nto
rA
ve
Ca
talin
aA
ve
Wils
on
Av
e
Oa
kla
nd
Av
e
Los
Ro
ble
sA
ve
Del Mar Blvd
NC
he
ste
rA
ve
SC
he
ste
rA
ve
NM
ich
iga
nA
ve
Ma
rV
ista
Av
e
SM
ich
iga
nA
ve
AM (PM) Project Only VolumesFigure 8
AM (PM) Project Only VolumesFigure 8
Not to Scale
N
S
W E
City of Pasadena Multimodal LOS Development Impact AnalysisLEGEND
Project SiteAM (PM) Directional Volumes# (#)
#
(#)
15 (21) 15 (21) 15 (21) 79 (88) 5 (16) 8 (25)
15 (21)21 (28)0 (0)14 (44)14 (44)14 (44)
27
(36)
52
(66)
27
(101)
27
(101)
0
(0)
0
(0)
59
(51)
59
(51)

ProjectSite
E Union St
E Walnut St
E Colorado Blvd
E Green St
Cordova St
ElM
olin
oA
ve
Oa
kK
no
llA
ve
Hu
dso
nA
ve
Lake
Ave
Me
nto
rA
ve
Ca
talin
aA
ve
Wils
on
Av
e
Oa
kla
nd
Av
e
Los
Ro
ble
sA
ve
Del Mar Blvd
NC
he
ste
rA
ve
SC
he
ste
rA
ve
NM
ich
iga
nA
ve
Ma
rV
ista
Av
e
SM
ich
iga
nA
ve
AM (PM) 2015 + Project VolumesFigure 9
AM (PM) 2015 + Project VolumesFigure 9
City of Pasadena Multimodal LOS Development Impact Analysis
Not to Scale
N
S
W E
LEGEND
Project SiteAM (PM) Directional Volumes# (#)
#
(#)
640 (1,250) 686 (1,365) 623 (1,203) 620 (1,235) 605 (1,230) 600 (1,200)
1,212 (1,034)1,105 (1,110)1,115 (1,090)1,135 (1,215)1,045 (1,195)737 (1,286)
1,155
(1,110)
1,100
(1,230)
1,305
(1,555)
1,030
(1,595)
1,185
(1,400)
1,310
(1,295)
1,545
(1,685)
1,690
(1,760)

Lake at Colorado Project - Multimodal Traffic Impact Study 16
Dowling Associates, Inc.Transportation Engineering Planning Research Education
Segment LOS Analysis
Segment scores are calculated for each of the four modes (auto, transit, pedestrian, bicycle) along the streets between the different intersections. These scores look only at the LOS scores between intersections and not the intersection scores themselves, which are reported in the next section. The multimodal methodology reports segment scores for each direction along all segments. However, to simplify the reporting of segment LOS, this section only reports the worst directional LOS score for each segment. The detailed LOS scores for each direction are included in Appendix A. Figure 10 and Figure 11 at the end of the traffic analysis section show a graphical representation of the 2015 + Project LOS in the AM and PM peak hour.
Lake Avenue Segment LOS
Table 4 and Table 5 show the worst direction segment LOS scores for each mode in the AM and PM peak, respectively. The worst direction auto LOS was generally LOS C in both the AM and PM peak period for all three scenarios. Lake Avenue between Colorado Boulevard and Union Street was the only segment that operated at LOS B and that was for Existing conditions in the AM and PM peak. This segment was also at LOS B during the AM peak for 2015 + Project but this is most likely due to rounding issues and that the score is right on the border between LOS B and LOS C. As none of the auto segments were operating worse than LOS C this project would have no significant impact on the auto segment LOS on Lake Avenue. Transit service along Lake Avenue is very frequent with multiple bus lines serving the corridor. There are roughly 7 buses per hour for each segment yielding an existing transit LOS score of A for all but the segment between Green Street and Colorado Boulevard, which is at LOS B in Existing conditions. The added traffic volume for 2015 and 2015 + Project were not significant enough to change any of the LOS grades. Only the elimination of bus routes or significant changes to average speed along the corridor would greatly affect the transit LOS score. Since none of these transit scores were worse than LOS C, the project would not have a significant effect on transit segment LOS on Lake Avenue. Pedestrian LOS scores were LOS B in all segments and peak periods for the Existing conditions. Adding in the 2015 and 2015 + Project volumes was enough to change the LOS of the two segments between Colorado Boulevard and Walnut Street to LOS C in the PM peak. This project would not greatly affect the segment LOS pedestrian score. With high LOS grades currently and only a small amount of additional traffic, the pedestrian LOS on Lake Avenue is not significantly affected by the Lake at Colorado project. The segment bicycle LOS scores for Lake Avenue were poor, with the worst direction for each segment at LOS D in all three scenarios. As LOS D is an unacceptable LOS, any additional traffic that causes the LOS bicycle segment score

Lake at Colorado Project - Multimodal Traffic Impact Study 17
Dowling Associates, Inc.Transportation Engineering Planning Research Education
to worsen is a significant impact. The grey highlighted cells in Table 4 and Table 5 show where the project volumes would cause a significant impact on the bicycle segment LOS. Bicycles need wide shoulders or bike lanes to have an acceptable LOS score. Since Lake Avenue has no shoulder/bike lane north of Colorado and the southern portion has on-street parking, the bicyclists are not comfortable on this facility, resulting in the poor LOS. Table 4 – LOS for the Worst Direction of Each Segment on Lake Avenue during the AM Peak
Lake Avenue ‐ Worst Direction AM Segment LOS
Segment Mode Direction Existing 2015 2015 + Proj Difference % Change
Cordova St. to Green St.
Auto NB 2.87 (C) 2.89 (C) 2.89 (C) 0.00 0.0%
Transit NB 1.54 (A) 1.61 (A) 1.61 (A) 0.00 0.0%
Pedestrian SB 2.21 (B) 2.43 (B) 2.42 (B) ‐0.01 ‐0.4%
Bicycle SB 3.61 (D) 3.67 (D) 3.67 (D) 0.00 0.0%
Green St. to Colorado Blvd.
Auto SB 2.94 (C) 2.99 (C) 2.99 (C) 0.00 0.0%
Transit NB 1.76 (A) 1.78 (A) 1.78 (A) 0.00 0.0%
Pedestrian SB 2.50 (B) 2.70 (B) 2.71 (B) 0.01 0.4%
Bicycle NB 3.74 (D) 3.79 (D) 3.80 (D) 0.01 0.3%
Colorado Blvd. to Union St.
Auto SB 2.72 (B) 2.76 (C) 2.75 (B) ‐0.01 ‐0.4%
Transit NB 1.34 (A) 1.37 (A) 1.38 (A) 0.01 0.7%
Pedestrian SB 2.44 (B) 2.63 (B) 2.65 (B) 0.02 0.8%
Bicycle NB 3.91 (D) 3.99 (D) 4.00 (D) 0.01 0.3%
Union St. to Walnut St.
Auto SB 2.91 (C) 2.92 (C) 2.92 (C) 0.00 0.0%
Transit NB 1.34 (A) 1.36 (A) 1.37 (A) 0.01 0.7%
Pedestrian SB 2.58 (B) 2.74 (B) 2.75 (B) 0.01 0.4%
Bicycle SB 4.12 (D) 4.19 (D) 4.20 (D) 0.01 0.2%
= significant impact. Source: Dowling Associates, Inc.

Lake at Colorado Project - Multimodal Traffic Impact Study 18
Dowling Associates, Inc.Transportation Engineering Planning Research Education
Table 5 – LOS for the Worst Direction of Each Segment on Lake Avenue during the PM Peak
Lake Avenue ‐ Worst Direction PM Segment LOS
Segment Mode Direction Existing 2015 2015 + Proj Difference % Change
Cordova St. to Green St.
Auto NB 2.91 (C) 2.96 (C) 2.96 (C) 0.00 0.0%
Transit SB 1.78 (A) 1.83 (A) 1.83 (A) 0.00 0.0%
Pedestrian SB 2.14 (B) 2.35 (B) 2.35 (B) 0.00 0.0%
Bicycle SB 3.58 (D) 3.64 (D) 3.64 (D) 0.00 0.0%
Green St. to Colorado Blvd.
Auto SB 3.04 (C) 3.19 (C) 3.21 (C) 0.02 0.6%
Transit SB 2.13 (B) 2.24 (B) 2.25 (B) 0.01 0.4%
Pedestrian SB 2.52 (B) 2.75 (B) 2.76 (C) 0.01 0.4%
Bicycle NB 3.79 (D) 3.85 (D) 3.86 (D) 0.01 0.3%
Colorado Blvd. to Union St.
Auto SB 2.72 (B) 2.76 (C) 2.76 (C) 0.00 0.0%
Transit SB 1.49 (A) 1.59 (A) 1.59 (A) 0.00 0.0%
Pedestrian NB 2.64 (B) 2.82 (C) 2.88 (C) 0.06 2.1%
Bicycle SB 3.93 (D) 3.97 (D) 3.99 (D) 0.02 0.5%
Union St. to Walnut St.
Auto SB 2.93 (C) 2.94 (C) 2.95 (C) 0.01 0.3%
Transit NB 1.48 (A) 1.51 (A) 1.52 (A) 0.01 0.7%
Pedestrian SB 2.74 (B) 2.93 (C) 2.97 (C) 0.04 1.4%
Bicycle SB 4.14 (D) 4.20 (D) 4.21 (D) 0.01 0.2%
= significant impact. Source: Dowling Associates, Inc.
Colorado Boulevard Segment LOS
The results for each segment LOS score along Colorado Boulevard are shown in Table 6 and Table 7 for the AM and PM peak respectively. The Existing auto LOS for all segments in both the AM and PM peak is LOS C. The auto LOS remains LOS C even after adding the 2015 and 2015 + Project volumes. Since this street has generally lower volume-to-capacity ratios and good signal progression, the addition of project trips does not cause a large change in the LOS calculations. The Lake at Colorado project’s impact on auto segment LOS along Colorado Boulevard would not be significant since all segments are LOS C. As with Lake Avenue, Colorado Boulevard has excellent transit service, with many bus routes operating at frequent intervals. This leads to all segments but one segment in the PM peak (Catalina Avenue to Wilson Avenue) having an LOS A in all three analysis scenarios. Colorado Boulevard between Catalina Avenue and Wilson Avenue has three bus lines serving it rather than four or more as the other segments do and therefore operates at LOS B. Since none of the LOS scores are worse than LOS B with the addition of the project volumes, the project would not significantly affect the transit segment LOS score along Colorado Boulevard.

Lake at Colorado Project - Multimodal Traffic Impact Study 19
Dowling Associates, Inc.Transportation Engineering Planning Research Education
The pedestrian mode operates at LOS A for all segments for Existing conditions. Pedestrians currently have a number of physical barriers such as parked vehicles, trees, and other large objects that provide a physical barrier between them and traffic. This provides a more comfortable walking environment and an excellent LOS. 2015 conditions, with its higher traffic volumes, results in all but one segment (Mentor Avenue to Catalina Avenue) going from LOS A to LOS B in either the AM or PM peak. Adding in the project trips to the 2015 conditions alters the LOS segment score by less than 3%, but remains at LOS B or better. The project would not have a significant impact to the pedestrian mode on Colorado Boulevard. The bicycle LOS segment score for most segments are in the LOS B to LOS C range for Existing conditions. These LOS scores along Colorado Boulevard are the result of good pavement, few driveway conflicts, and shoulder parking that even when occupied, still leaves a substantial amount of the segment length with a wide shoulder for bicyclists. 2015 conditions show that a couple of segments go from LOS B to LOS C due to the increase in overall traffic. However, when the project trips are added to the 2015 volumes the LOS scores and letter grades are not changed much. With all bicycle segment scores at LOS C or better, the project’s impact on bicycles would not be significant.

Lake at Colorado Project - Multimodal Traffic Impact Study 20
Dowling Associates, Inc.Transportation Engineering Planning Research Education
Table 6 – LOS for the Worst Direction of Each Segment on Colorado Boulevard during the AM Peak
Colorado Boulevard ‐ Worst Direction AM Segment LOS
Segment Mode Direction Existing 2015 2015 + Proj
Diff. % Change
El Molino Ave to Oak Knoll Ave
Auto WB 2.84 (C) 2.86 (C) 2.86 (C) 0.00 0.0%
Transit WB 1.35 (A) 1.39 (A) 1.39 (A) 0.00 0.0%
Pedestrian WB 1.38 (A) 1.61 (A) 1.62 (A) 0.01 0.6%
Bicycle WB 2.57 (B) 2.69 (B) 2.70 (B) 0.01 0.4%
Oak Knoll Ave to Hudson Ave
Auto WB 3.09 (C) 3.12 (C) 3.13 (C) 0.01 0.3%
Transit EB 1.45 (A) 1.48 (A) 1.48 (A) 0.00 0.0%
Pedestrian WB 1.62 (A) 1.89 (A) 1.91 (A) 0.02 1.1%
Bicycle WB 2.60 (B) 2.71 (B) 2.71 (B) 0.00 0.0%
Hudson Ave to Lake Ave
Auto WB 3.16 (C) 3.20 (C) 3.21 (C) 0.01 0.3%
Transit EB 1.77 (A) 1.81 (A) 1.81 (A) 0.00 0.0%
Pedestrian WB 1.87 (A) 2.19 (B) 2.20 (B) 0.01 0.5%
Bicycle EB 2.33 (B) 2.47 (B) 2.49 (B) 0.02 0.8%
Lake Ave to Mentor Ave
Auto EB 3.13 (C) 3.15 (C) 3.14 (C) ‐0.01 ‐0.3%
Transit WB 1.35 (A) 1.40 (A) 1.41 (A) 0.01 0.7%
Pedestrian WB 1.77 (A) 2.01 (B) 2.07 (B) 0.06 3.0%
Bicycle WB 2.33 (B) 2.44 (B) 2.46 (B) 0.02 0.8%
Mentor Ave to Catalina Ave
Auto WB 3.00 (C) 3.04 (C) 3.04 (C) 0.00 0.0%
Transit EB 1.73 (A) 1.76 (A) 1.76 (A) 0.00 0.0%
Pedestrian WB 1.64 (A) 1.89 (A) 1.90 (A) 0.01 0.5%
Bicycle EB 2.65 (B) 2.76 (C) 2.78 (C) 0.02 0.7%
Catalina Ave to Wilson Ave
Auto WB 3.06 (C) 3.12 (C) 3.12 (C) 0.00 0.0%
Transit WB 1.79 (A) 1.88 (A) 1.88 (A) 0.00 0.0%
Pedestrian WB 1.51 (A) 1.79 (A) 1.79 (A) 0.00 0.0%
Bicycle WB 3.20 (C) 3.27 (C) 3.27 (C) 0.00 0.0%
Source: Dowling Associates, Inc.

Lake at Colorado Project - Multimodal Traffic Impact Study 21
Dowling Associates, Inc.Transportation Engineering Planning Research Education
Table 7 – LOS for the Worst Direction of Each Segment on Colorado Boulevard during the PM Peak
Colorado Boulevard ‐ Worst Direction PM Segment LOS
Segment Mode Direction Existing 2015 2015 + Proj Diff. %
Change
El Molino Ave to Oak Knoll Ave
Auto EB 2.88 (C) 2.90 (C) 2.91 (C) 0.01 0.3%
Transit WB 1.54 (A) 1.61 (A) 1.61 (A) 0.00 0.0%
Pedestrian EB 1.80 (A) 2.16 (B) 2.21 (B) 0.05 2.3%
Bicycle EB 2.98 (C) 3.10 (C) 3.12 (C) 0.02 0.6%
Oak Knoll Ave to Hudson Ave
Auto EB 3.10 (C) 3.17 (C) 3.19 (C) 0.02 0.6%
Transit EB 1.44 (A) 1.53 (A) 1.54 (A) 0.01 0.7%
Pedestrian EB 1.83 (A) 2.19 (B) 2.24 (B) 0.05 2.3%
Bicycle EB 2.68 (B) 2.80 (C) 2.81 (C) 0.01 0.4%
Hudson Ave to Lake Ave
Auto WB 3.16 (C) 3.21 (C) 3.21 (C) 0.00 0.0%
Transit EB 1.75 (A) 1.80 (A) 1.82 (A) 0.02 1.1%
Pedestrian WB 1.92 (A) 2.22 (B) 2.24 (B) 0.02 0.9%
Bicycle EB 2.64 (B) 2.76 (C) 2.77 (C) 0.01 0.4%
Lake Ave to Mentor Ave
Auto EB 3.19 (C) 3.25 (C) 3.24 (C) ‐0.01 ‐0.3%
Transit WB 1.53 (A) 1.58 (A) 1.59 (A) 0.01 0.6%
Pedestrian EB 1.94 (A) 2.21 (B) 2.27 (B) 0.06 2.7%
Bicycle WB 2.34 (B) 2.44 (B) 2.46 (B) 0.02 0.8%
Mentor Ave to Catalina Ave
Auto EB 3.02 (C) 3.07 (C) 3.08 (C) 0.01 0.3%
Transit EB 1.72 (A) 1.78 (A) 1.78 (A) 0.00 0.0%
Pedestrian EB 1.73 (A) 2.00 (A) 2.03 (B) 0.03 1.5%
Bicycle EB 2.99 (C) 3.09 (C) 3.10 (C) 0.01 0.3%
Catalina Ave to Wilson Ave
Auto EB 3.09 (C) 3.14 (C) 3.15 (C) 0.01 0.3%
Transit WB 2.03 (B) 2.10 (B) 2.10 (B) 0.00 0.0%
Pedestrian EB 1.93 (A) 2.20 (B) 2.23 (B) 0.03 1.4%
Bicycle WB 3.16 (C) 3.23 (C) 3.23 (C) 0.00 0.0%
Source: Dowling Associates, Inc.
Intersection LOS Analysis
Intersection scores are calculated in the multimodal methodology for the pedestrian and bicycle mode. The auto and transit modes do not have a specific intersection LOS score in the multimodal methodology due to the amount of additional data required for an auto intersection analysis. This section details the pedestrian and bicycle intersection LOS scores determined from the multimodal LOS analysis. Additionally, it also utilizes the V/C ratios for the automobiles determined by Raju Associates Inc. in their traffic study of this project using the ICU method.

Lake at Colorado Project - Multimodal Traffic Impact Study 22
Dowling Associates, Inc.Transportation Engineering Planning Research Education
Since the Transit segment LOS incorporates the effects of the intersection, the segment results are redisplayed in the tables but are not discussed as they were discussed earlier under the segments section. The results reported here are for the worst approach to the intersection but the full details for all approaches can be viewed in Appendix B. Figure 10 and Figure 11 at the end of the traffic analysis section show a graphical representation of the 2015 + Project LOS in the AM and PM peak hour.
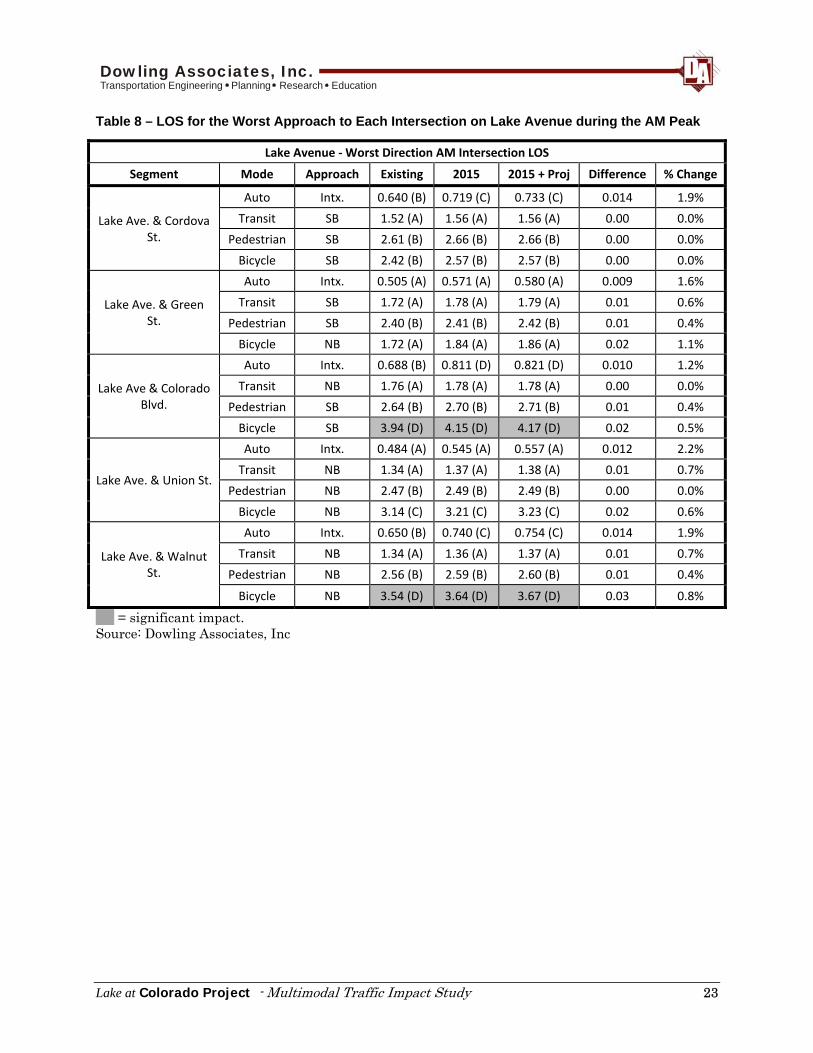
Lake Avenue Intersection Scores
Table 8 and Table 9 present the intersection LOS scores during the AM & PM peak hour for the four analysis modes. The auto intersection LOS is generally at LOS A or LOS B for the Existing conditions except for Lake Avenue & Colorado Boulevard and Lake & Walnut Avenues which are both currently operating at LOS D in the PM peak hour. Traffic conditions in 2015 generally result in at least a one letter grade decline LOS and in some cases a two letter grade reduction. Adding in the project volumes to 2015 conditions caused a significant impact on the intersection of Lake Avenue & Walnut Street which went from LOS E to LOS F in the PM peak hour. This was the only intersection to show a significant impact according to the ICU method and City of Pasadena criteria. Pedestrian LOS is at LOS B for all intersections and peak hours for Existing conditions except for the Lake & Walnut Avenues in the PM peak hour which is at LOS C. The cycle lengths on this corridor are less than 100 seconds and there is a high g/C ratio, leading to minimal pedestrian delay and excellent pedestrian LOS in the Existing conditions. The 2015 conditions (modeled with the same signal information as Existing conditions) show only one intersection worsening to LOS C (Lake Avenue & Colorado Boulevard in the PM peak). The addition of the project volumes resulted in only a small difference in LOS scores; and since none were worse than LOS C, the project would not have a significant effect on the pedestrian intersection scores along Lake Avenue. The bicycle intersection LOS varies between LOS A and LOS D for the various intersections in the Existing conditions. This large difference is due to the various streets that bicyclists have to cross. Narrower streets like Green Street (LOS A) are easier to cross than wider streets like Colorado Boulevard (LOS D), and therefore bicyclists perceive a better level of service for the intersection. The addition of 2015 and 2015 + Project volumes changed the bicycle intersection LOS at Lake Avenue & Colorado Boulevard to LOS E in the PM peak. Since the intersections of Lake Avenue & Colorado Boulevard and Lake Avenue & Walnut Street operate at LOS D or LOS E in 2015, any worsening as a result of project volumes would be a significant impact. The grey highlighted cells in Table 8and Table 9 represent intersections with significant impacts.
Lake at Colorado Project - Multimodal Traffic Impact Study 23
Dowling Associates, Inc.Transportation Engineering Planning Research Education
Table 8 – LOS for the Worst Approach to Each Intersection on Lake Avenue during the AM Peak
Lake Avenue ‐ Worst Direction AM Intersection LOS
Segment Mode Approach Existing 2015 2015 + Proj Difference % Change
Lake Ave. & Cordova St.
Auto Intx. 0.640 (B) 0.719 (C) 0.733 (C) 0.014 1.9%
Transit SB 1.52 (A) 1.56 (A) 1.56 (A) 0.00 0.0%
Pedestrian SB 2.61 (B) 2.66 (B) 2.66 (B) 0.00 0.0%
Bicycle SB 2.42 (B) 2.57 (B) 2.57 (B) 0.00 0.0%
Lake Ave. & Green St.
Auto Intx. 0.505 (A) 0.571 (A) 0.580 (A) 0.009 1.6%
Transit SB 1.72 (A) 1.78 (A) 1.79 (A) 0.01 0.6%
Pedestrian SB 2.40 (B) 2.41 (B) 2.42 (B) 0.01 0.4%
Bicycle NB 1.72 (A) 1.84 (A) 1.86 (A) 0.02 1.1%
Lake Ave & Colorado Blvd.
Auto Intx. 0.688 (B) 0.811 (D) 0.821 (D) 0.010 1.2%
Transit NB 1.76 (A) 1.78 (A) 1.78 (A) 0.00 0.0%
Pedestrian SB 2.64 (B) 2.70 (B) 2.71 (B) 0.01 0.4%
Bicycle SB 3.94 (D) 4.15 (D) 4.17 (D) 0.02 0.5%
Lake Ave. & Union St.
Auto Intx. 0.484 (A) 0.545 (A) 0.557 (A) 0.012 2.2%
Transit NB 1.34 (A) 1.37 (A) 1.38 (A) 0.01 0.7%
Pedestrian NB 2.47 (B) 2.49 (B) 2.49 (B) 0.00 0.0%
Bicycle NB 3.14 (C) 3.21 (C) 3.23 (C) 0.02 0.6%
Lake Ave. & Walnut St.
Auto Intx. 0.650 (B) 0.740 (C) 0.754 (C) 0.014 1.9%
Transit NB 1.34 (A) 1.36 (A) 1.37 (A) 0.01 0.7%
Pedestrian NB 2.56 (B) 2.59 (B) 2.60 (B) 0.01 0.4%
Bicycle NB 3.54 (D) 3.64 (D) 3.67 (D) 0.03 0.8%
= significant impact. Source: Dowling Associates, Inc

Lake at Colorado Project - Multimodal Traffic Impact Study 24
Dowling Associates, Inc.Transportation Engineering Planning Research Education
Table 9 – LOS for the Worst Approach to Each Intersection on Lake Avenue during the PM Peak
Lake Avenue ‐ Worst Direction PM Intersection LOS
Segment Mode Approach Existing 2015 2015 + Proj Difference % Change
Lake Ave. & Cordova St.
Auto Intx. 0.658 (B) 0.737 (C) 0.752 (C) 0.015 2.0%
Transit SB 1.78 (A) 1.83 (A) 1.83 (A) 0.00 0.0%
Pedestrian SB 2.64 (B) 2.69 (B) 2.69 (B) 0.00 0.0%
Bicycle SB 2.36 (B) 2.52 (B) 2.51 (B) ‐0.01 ‐0.4%
Lake Ave. & Green St.
Auto Intx. 0.574 (A) 0.652 (B) 0.663 (B) 0.011 1.7%
Transit SB 2.13 (B) 2.24 (B) 2.25 (B) 0.01 0.4%
Pedestrian SB 2.59 (B) 2.63 (B) 2.63 (B) 0.00 0.0%
Bicycle NB 1.83 (A) 1.97 (A) 1.99 (A) 0.02 1.0%
Lake Ave & Colorado Blvd.
Auto Intx. 0.817 (D) 0.848 (D) 0.877 (D) 0.029 3.4%
Transit NB 1.71 (A) 1.74 (A) 1.75 (A) 0.01 0.6%
Pedestrian SB 2.75 (B) 2.82 (C) 2.83 (C) 0.01 0.4%
Bicycle SB 4.13 (D) 4.36 (E) 4.41 (E) 0.05 1.1%
Lake Ave. & Union St.
Auto Intx. 0.545 (A) 0.603 (B) 0.615 (B) 0.012 2.0%
Transit NB 1.47 (A) 1.54 (A) 1.56 (A) 0.02 1.3%
Pedestrian NB 2.46 (B) 2.48 (B) 2.48 (B) 0.00 0.0%
Bicycle NB 3.27 (C) 3.40 (C) 3.44 (C) 0.04 1.2%
Lake Ave. & Walnut St.
Auto Intx. 0.885 (D) 0.988 (E) 1.010 (F) 0.022 2.2%
Transit NB 1.48 (A) 1.51 (A) 1.52 (A) 0.01 0.7%
Pedestrian NB 2.77 (C) 2.83 (C) 2.84 (C) 0.01 0.4%
Bicycle NB 3.73 (D) 3.85 (D) 3.90 (D) 0.05 1.3%
= significant impact. Source: Dowling Associates, Inc
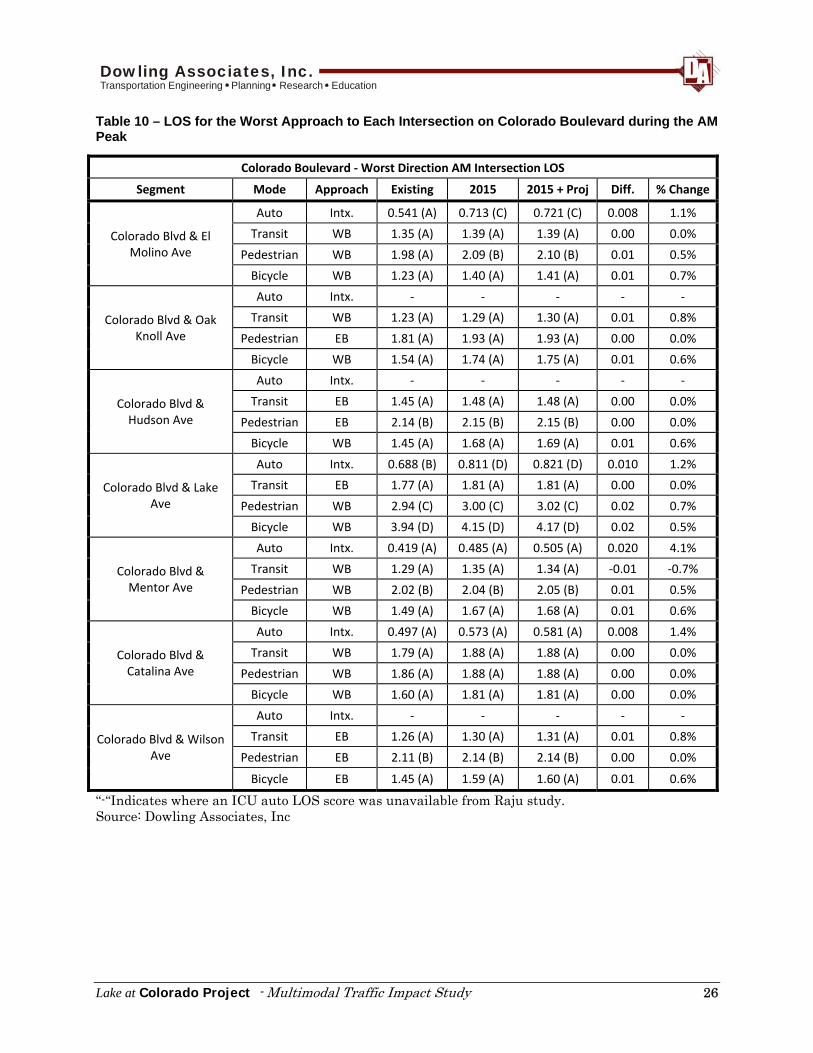
Colorado Boulevard Intersection Scores
The intersection scores along Colorado Boulevard are generally a little better than the ones found on Lake Avenue due to smaller cross streets, less overall traffic, and shorter cycle lengths which decrease delay. The LOS scores and letter grades for the AM peak hour and PM peak hour are shown in Table 10 and Table 11 respectively. Some of the intersections were not analyzed in the Raju Associates study, so the intersections with unknown auto intersection scores are shown as “-“. Where auto LOS grades were available, they were between LOS A and LOS C in the Existing conditions. Adding in the 2015 volumes showed some effect, but none of the intersections operated worse than LOS D. The addition of project volumes to 2015 conditions did not result in significant changes to the V/C ratio based on the significance criteria adopted by the City of Pasadena for the ICU method.

Lake at Colorado Project - Multimodal Traffic Impact Study 25
Dowling Associates, Inc.Transportation Engineering Planning Research Education
Pedestrians on Colorado Boulevard in Existing conditions generally experience intersection LOS scores in the LOS A to LOS B range, except for the larger intersection at Colorado Boulevard and Lake Avenue which is LOS C. This is a larger intersection, and results in more pedestrian delay and therefore a worse LOS. Looking at 2015 conditions shows little affect on the pedestrian LOS. Likewise, adding the project trips to the peak hour also shows a small effect that is not significant since pedestrian intersection LOS is at LOS C or better. The bicycle LOS score for Existing conditions is at LOS A for all intersections except for Colorado Boulevard & Lake Avenue which is LOS B, because it is a much larger intersection to cross. The 2015 conditions show little effect on bicycle intersection LOS score due to the increased traffic. The addition of project traffic does not change the bicycle LOS except at the intersection of Colorado Boulevard & Wilson Avenue, where it changes from LOS A to LOS B in the PM peak hour. As with the auto and pedestrian score, the high LOS grades and small changes to LOS score result in the Lake at Colorado project not having a significant impact on bicycle intersection LOS.
Lake at Colorado Project - Multimodal Traffic Impact Study 26
Dowling Associates, Inc.Transportation Engineering Planning Research Education
Table 10 – LOS for the Worst Approach to Each Intersection on Colorado Boulevard during the AM Peak
Colorado Boulevard ‐ Worst Direction AM Intersection LOS
Segment Mode Approach Existing 2015 2015 + Proj Diff. % Change
Colorado Blvd & El Molino Ave
Auto Intx. 0.541 (A) 0.713 (C) 0.721 (C) 0.008 1.1%
Transit WB 1.35 (A) 1.39 (A) 1.39 (A) 0.00 0.0%
Pedestrian WB 1.98 (A) 2.09 (B) 2.10 (B) 0.01 0.5%
Bicycle WB 1.23 (A) 1.40 (A) 1.41 (A) 0.01 0.7%
Colorado Blvd & Oak Knoll Ave
Auto Intx. ‐ ‐ ‐ ‐ ‐
Transit WB 1.23 (A) 1.29 (A) 1.30 (A) 0.01 0.8%
Pedestrian EB 1.81 (A) 1.93 (A) 1.93 (A) 0.00 0.0%
Bicycle WB 1.54 (A) 1.74 (A) 1.75 (A) 0.01 0.6%
Colorado Blvd & Hudson Ave
Auto Intx. ‐ ‐ ‐ ‐ ‐
Transit EB 1.45 (A) 1.48 (A) 1.48 (A) 0.00 0.0%
Pedestrian EB 2.14 (B) 2.15 (B) 2.15 (B) 0.00 0.0%
Bicycle WB 1.45 (A) 1.68 (A) 1.69 (A) 0.01 0.6%
Colorado Blvd & Lake Ave
Auto Intx. 0.688 (B) 0.811 (D) 0.821 (D) 0.010 1.2%
Transit EB 1.77 (A) 1.81 (A) 1.81 (A) 0.00 0.0%
Pedestrian WB 2.94 (C) 3.00 (C) 3.02 (C) 0.02 0.7%
Bicycle WB 3.94 (D) 4.15 (D) 4.17 (D) 0.02 0.5%
Colorado Blvd & Mentor Ave
Auto Intx. 0.419 (A) 0.485 (A) 0.505 (A) 0.020 4.1%
Transit WB 1.29 (A) 1.35 (A) 1.34 (A) ‐0.01 ‐0.7%
Pedestrian WB 2.02 (B) 2.04 (B) 2.05 (B) 0.01 0.5%
Bicycle WB 1.49 (A) 1.67 (A) 1.68 (A) 0.01 0.6%
Colorado Blvd & Catalina Ave
Auto Intx. 0.497 (A) 0.573 (A) 0.581 (A) 0.008 1.4%
Transit WB 1.79 (A) 1.88 (A) 1.88 (A) 0.00 0.0%
Pedestrian WB 1.86 (A) 1.88 (A) 1.88 (A) 0.00 0.0%
Bicycle WB 1.60 (A) 1.81 (A) 1.81 (A) 0.00 0.0%
Colorado Blvd & Wilson Ave
Auto Intx. ‐ ‐ ‐ ‐ ‐
Transit EB 1.26 (A) 1.30 (A) 1.31 (A) 0.01 0.8%
Pedestrian EB 2.11 (B) 2.14 (B) 2.14 (B) 0.00 0.0%
Bicycle EB 1.45 (A) 1.59 (A) 1.60 (A) 0.01 0.6%
“-“Indicates where an ICU auto LOS score was unavailable from Raju study. Source: Dowling Associates, Inc

Lake at Colorado Project - Multimodal Traffic Impact Study 27
Dowling Associates, Inc.Transportation Engineering Planning Research Education
Table 11 – LOS for the Worst Approach to Each Intersection on Colorado Boulevard during the PM Peak
Colorado Boulevard ‐ Worst Direction PM Intersection LOS
Segment Mode Approach Existing 2015 2015 + Proj Diff. % Change
Colorado Blvd & El Molino Ave
Auto Intx. 0.610 (B) 0.835 (D) 0.842 (D) 0.007 0.8%
Transit WB 1.54 (A) 1.61 (A) 1.61 (A) 0.00 0.0%
Pedestrian WB 1.99 (A) 2.12 (B) 2.13 (B) 0.01 0.5%
Bicycle WB 1.45 (A) 1.68 (A) 1.70 (A) 0.02 1.2%
Colorado Blvd & Oak Knoll Ave
Auto Intx. ‐ ‐ ‐ ‐ ‐
Transit WB 1.43 (A) 1.51 (A) 1.52 (A) 0.01 0.7%
Pedestrian WB 1.94 (A) 2.06 (B) 2.06 (B) 0.00 0.0%
Bicycle WB 1.60 (A) 1.84 (A) 1.85 (A) 0.01 0.5%
Colorado Blvd & Hudson Ave
Auto Intx. ‐ ‐ ‐ ‐ ‐
Transit WB 0.90 (A) 0.97 (A) 0.98 (A) 0.01 1.0%
Pedestrian WB 1.81 (A) 1.87 (A) 1.87 (A) 0.00 0.0%
Bicycle WB 1.48 (A) 1.70 (A) 1.71 (A) 0.01 0.6%
Colorado Blvd & Lake Ave
Auto Intx. 0.718 (C) 0.848 (D) 0.877 (D) 0.029 3.4%
Transit WB 1.53 (A) 1.58 (A) 1.59 (A) 0.01 0.6%
Pedestrian WB 2.97 (C) 3.03 (C) 3.05 (C) 0.02 0.7%
Bicycle WB 4.13 (D) 4.36 (E) 4.41 (E) 0.05 1.1%
Colorado Blvd & Mentor Ave
Auto Intx. 0.517 (A) 0.594 (A) 0.642 (B) 0.048 8.1%
Transit WB 1.48 (A) 1.55 (A) 1.54 (A) ‐0.01 ‐0.6%
Pedestrian WB 2.07 (B) 2.10 (B) 2.11 (B) 0.01 0.5%
Bicycle WB 1.55 (A) 1.72 (A) 1.73 (A) 0.01 0.6%
Colorado Blvd & Catalina Ave
Auto Intx. 0.569 (A) 0.652 (B) 0.675 (B) 0.023 3.5%
Transit WB 2.03 (B) 2.10 (B) 2.10 (B) 0.00 0.0%
Pedestrian WB 1.85 (A) 1.87 (A) 1.87 (A) 0.00 0.0%
Bicycle WB 1.53 (A) 1.70 (A) 1.70 (A) 0.00 0.0%
Colorado Blvd & Wilson Ave
Auto Intx. ‐ ‐ ‐ ‐ ‐
Transit EB 1.35 (A) 1.44 (A) 1.46 (A) 0.02 1.4%
Pedestrian EB 2.12 (B) 2.17 (B) 2.17 (B) 0.00 0.0%
Bicycle EB 1.81 (A) 2.00 (A) 2.03 (B) 0.03 1.5%
“-“Indicates where an ICU auto LOS score was unavailable from Raju study. Source: Dowling Associates, Inc

ProjectSite
E Union St
E Walnut St
E Colorado Blvd
E Green St
Cordova St
ElM
olin
oA
ve
Oa
kK
no
llA
ve
Hu
dso
nA
ve
Lake
Ave
Me
nto
rA
ve
Ca
talin
aA
ve
Wils
on
Av
e
Oa
kla
nd
Av
e
Los
Ro
ble
sA
ve
Del Mar Blvd
NC
he
ste
rA
ve
SC
he
ste
rA
ve
NM
ich
iga
nA
ve
Ma
rV
ista
Av
e
SM
ich
iga
nA
ve
AM 2015 + Project LOSFigure10
AM 2015 + Project LOSFigure10
City of Pasadena Multimodal LOS Development Impact AnalysisLEGEND
Segment Level of Service
Not to Scale
N
S
W E
Intersection Level of Service
ABAC
C A
BA
Project Site
CABA
ABAC
C A
BD
BADB
CADB
BDAB
BDAB
A A
BC
D A
CB
CAAB
BDAC
BADB
BCAC
A A
BA
C A
BB
CABA
ABAC
CABA
BAAC
CAAA
BBAC
CACA
ABAC
CABA
ACAC
C A
BA
A
AA
A
BA
A A
BA
A A
AA
A
BA

ProjectSite
E Union St
E Walnut St
E Colorado Blvd
E Green St
Cordova St
ElM
olin
oA
ve
Oa
kK
no
llA
ve
Hu
dso
nA
ve
Lake
Ave
Me
nto
rA
ve
Ca
talin
aA
ve
Wils
on
Av
e
Oa
kla
nd
Av
e
Los
Ro
ble
sA
ve
Del Mar Blvd
NC
he
ste
rA
ve
SC
he
ste
rA
ve
NM
ich
iga
nA
ve
Ma
rV
ista
Av
e
SM
ich
iga
nA
ve
PM 2015 + Project LOSFigure 11
PM 2015 + Project LOSFigure 11
Not to Scale
N
S
W E
City of Pasadena Multimodal LOS Development Impact Analysis
Segment Level of Service
Intersection Level of Service
ABAC
C A
BA
LEGEND
Project Site
CACB
BCAC
F A
CD
CADC
CADC
CDAB
CDAB
B A
BC
D A
CE
CBAC
BDAC
BADB
BCAC
B B
BA
C A
BB
CACB
BCAC
CACB
BAAC
CABB
BBAC
CACB
ABAC
CABB
ACBC
D A
BA
A
BA
A
AA
B A
BA
B B
AA
A
BB

Lake at Colorado Project - Multimodal Traffic Impact Study 30
Dowling Associates, Inc.Transportation Engineering Planning Research Education
4. IMPACTS AND MITIGATION MEASURES
Lake Avenue Segment LOS Mitigations
This multimodal study has shown that the bicycle segment LOS would be significantly affected on three of the four analysis segments (Green Street to Colorado Boulevard, Colorado Boulevard to Union Street, and Union Street to Walnut Street) as a result of the Lake at Colorado project, as the LOS scores would increase within the LOS D range. Two potential mitigation measures that would mitigate the bicycle LOS would include:
1. Prohibiting on-street parking on Lake Avenue south of Colorado Boulevard in the study area during the AM and PM peak periods.
2. Providing bicycle lanes through a lane reduction on Lake Avenue north of
Colorado Boulevard in the study area. Prohibiting on-street parking on Lake Avenue south of Colorado Boulevard during the AM and PM peak period would greatly improve the segment LOS score of the bicyclists while only slightly affecting the other modes. However, there would be secondary effects of the loss of on-street parking during the peak hours to the adjacent merchants and property owners along this stretch of roadway. Providing bike lanes through implementing a lane reduction along Lake Avenue between Walnut Street and Colorado Boulevard would greatly improve the bicycle segment LOS. However, this would require converting this section of Lake Avenue from six (6) lanes to four (4) 12 foot wide travel lanes with two (2) 8 foot wide bike lanes. It was determined that reducing the travel lanes would result in a significant impact to the automobile mode, so this mitigation measure would not be feasible. Therefore, the bicycle impact would be significant and unavoidable for Lake Avenue north of Colorado Boulevard in the study area based on the illustrative multimodal LOS significance criteria presented in this report. The resulting LOS scores reflecting the mitigation of prohibiting parking on Lake Avenue south of Colorado Boulevard in the study area are shown in Table 12 and Table 13. The other modes are only slightly affected by this change at the segment level. The pedestrian score would change from LOS B to LOS C in the AM peak hour due to the loss of the parked cars as a physical barrier for the restricted parking section.
Lake at Colorado Project - Multimodal Traffic Impact Study 31
Dowling Associates, Inc.Transportation Engineering Planning Research Education
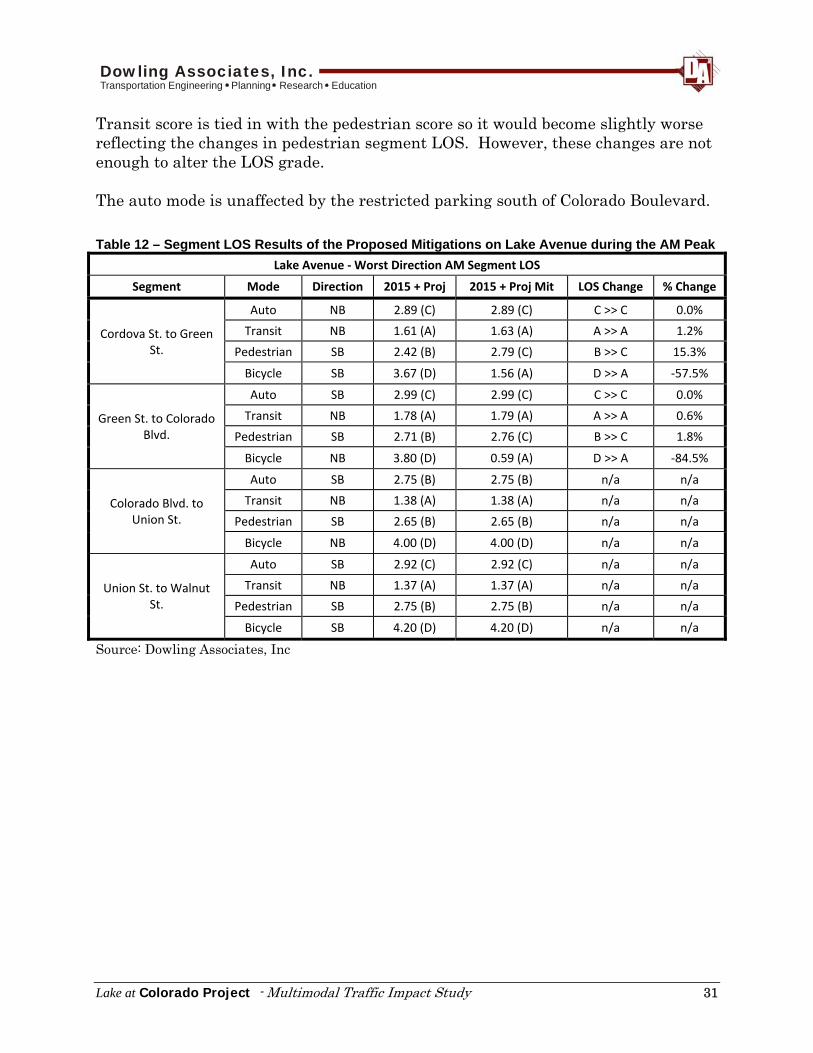
Transit score is tied in with the pedestrian score so it would become slightly worse reflecting the changes in pedestrian segment LOS. However, these changes are not enough to alter the LOS grade. The auto mode is unaffected by the restricted parking south of Colorado Boulevard. Table 12 – Segment LOS Results of the Proposed Mitigations on Lake Avenue during the AM Peak
Lake Avenue ‐ Worst Direction AM Segment LOS
Segment Mode Direction 2015 + Proj 2015 + Proj Mit LOS Change % Change
Cordova St. to Green St.
Auto NB 2.89 (C) 2.89 (C) C >> C 0.0%
Transit NB 1.61 (A) 1.63 (A) A >> A 1.2%
Pedestrian SB 2.42 (B) 2.79 (C) B >> C 15.3%
Bicycle SB 3.67 (D) 1.56 (A) D >> A ‐57.5%
Green St. to Colorado Blvd.
Auto SB 2.99 (C) 2.99 (C) C >> C 0.0%
Transit NB 1.78 (A) 1.79 (A) A >> A 0.6%
Pedestrian SB 2.71 (B) 2.76 (C) B >> C 1.8%
Bicycle NB 3.80 (D) 0.59 (A) D >> A ‐84.5%
Colorado Blvd. to Union St.
Auto SB 2.75 (B) 2.75 (B) n/a n/a
Transit NB 1.38 (A) 1.38 (A) n/a n/a
Pedestrian SB 2.65 (B) 2.65 (B) n/a n/a
Bicycle NB 4.00 (D) 4.00 (D) n/a n/a
Union St. to Walnut St.
Auto SB 2.92 (C) 2.92 (C) n/a n/a
Transit NB 1.37 (A) 1.37 (A) n/a n/a
Pedestrian SB 2.75 (B) 2.75 (B) n/a n/a
Bicycle SB 4.20 (D) 4.20 (D) n/a n/a
Source: Dowling Associates, Inc

Lake at Colorado Project - Multimodal Traffic Impact Study 32
Dowling Associates, Inc.Transportation Engineering Planning Research Education
Table 13 – Segment LOS Results of Proposed Mitigations on Lake Avenue during the PM Peak
Lake Avenue ‐ Worst Direction PM Segment LOS
Segment Mode Direction 2015 + Proj 2015 + Proj Mit LOS Change % Change
Cordova St. to Green St.
Auto NB 2.96 (C) 2.96 (C) C >> C 0.0%
Transit SB 1.83 (A) 1.85 (A) A >> A 1.1%
Pedestrian SB 2.35 (B) 2.72 (B) B >> B 15.7%
Bicycle SB 3.64 (D) 1.54 (A) D >> A ‐57.7%
Green St. to Colorado Blvd.
Auto SB 3.21 (C) 3.21 (C) C >> C 0.0%
Transit SB 2.25 (B) 2.25 (B) B >> B 0.0%
Pedestrian SB 2.76 (C) 2.81 (C) C >> C 1.8%
Bicycle NB 3.86 (D) 0.64 (A) D >> A ‐83.4%
Colorado Blvd. to Union St.
Auto SB 2.76 (C) 2.76 (C) n/a n/a
Transit SB 1.59 (A) 1.59 (A) n/a n/a
Pedestrian NB 2.88 (C) 2.88 (C) n/a n/a
Bicycle SB 3.99 (D) 3.99 (D) n/a n/a
Union St. to Walnut St.
Auto SB 2.95 (C) 2.95 (C) n/a n/a
Transit NB 1.52 (A) 1.52 (A) n/a n/a
Pedestrian SB 2.97 (C) 2.97 (C) n/a n/a
Bicycle SB 4.21 (D) 4.21 (D) n/a n/a
Source: Dowling Associates, Inc
Lake Avenue Intersection LOS Mitigations
The results of the parking restrictions on the intersection LOS for Lake Avenue in the AM and PM peak are shown in Table 14 and Table 15, respectively. The transit score does not have a specific intersection level analysis, as this is built into the segment score. Therefore, the transit score reported here is a repeat of the segment score. The auto intersection score is based on the ICU method, while the pedestrian and bicycle scores are from the multimodal method. Raju Associates determined in their report that the project would cause a significant impact at the intersection of Lake Avenue & Walnut Street. They proposed additional transit service to mitigate this impact. The proposed multimodal mitigation measures would not affect auto intersection LOS south of Lake Avenue & Colorado Boulevard because parking restrictions do not impact intersection LOS.

Lake at Colorado Project - Multimodal Traffic Impact Study 33
Dowling Associates, Inc.Transportation Engineering Planning Research Education
Table 14 – Intersection LOS Results of Proposed Mitigations on Lake Avenue during the AM Peak
Lake Avenue ‐ Worst Direction AM Intersection LOS
Intersection Mode Approach 2015 + Proj 2015 + Proj Mit LOS Change % Change
Lake Ave. & Cordova St.
Auto Intx. 0.733 (C) 0.733 (C) C >> C 0.0%
Transit SB 1.56 (A) 1.58 (A) A >> A 1.3%
Pedestrian SB 2.66 (B) 2.66 (B) B >> B 0.0%
Bicycle SB 2.57 (B) 2.57 (B) B >> B 0.0%
Lake Ave. & Green St.
Auto Intx. 0.580 (A) 0.580 (A) A >> A 0.0%
Transit SB 1.79 (A) 1.79 (A) A >> A 0.0%
Pedestrian SB 2.42 (B) 2.42 (B) B >> B 0.0%
Bicycle NB 1.86 (A) 1.86 (A) A >> A 0.0%
Lake Ave & Colorado Blvd.
Auto Intx. 0.821 (D) 0.821 (D) D >> D 0.0%
Transit NB 1.78 (A) 1.79 (A) A >> A 0.6%
Pedestrian SB 2.71 (B) 2.71 (B) B >> B 0.0%
Bicycle SB 4.17 (D) 4.17 (D) D >> D 0.0%
Lake Ave. & Union St.
Auto Intx. 0.557 (A) 0.557 (A) n/a n/a
Transit NB 1.38 (A) 1.38 (A) n/a n/a
Pedestrian NB 2.49 (B) 2.49 (B) n/a n/a
Bicycle NB 3.23 (C) 3.23 (C) n/a n/a
Lake Ave. & Walnut St.
Auto Intx. 0.754 (C) 0.754 (C) n/a n/a
Transit NB 1.37 (A) 1.37 (A) n/a n/a
Pedestrian NB 2.60 (B) 2.60 (B) n/a n/a
Bicycle NB 3.67 (D) 3.67 (D) n/a n/a
Source: Dowling Associates, Inc

Lake at Colorado Project - Multimodal Traffic Impact Study 34
Dowling Associates, Inc.Transportation Engineering Planning Research Education
Table 15 – Intersection LOS Results of the Proposed Mitigations on Lake Avenue during the PM Peak
Lake Avenue ‐ Worst Direction PM Intersection LOS
Intersection Mode Approach 2015 + Proj 2015 + Proj Mit LOS Change % Change
Lake Ave. & Cordova St.
Auto Intx. 0.752 (C) 0.752 (C) C >> C 0.0%
Transit SB 1.83 (A) 1.85 (A) A >> A 1.1%
Pedestrian SB 2.69 (B) 2.69 (B) B >> B 0.0%
Bicycle SB 2.51 (B) 2.51 (B) B >> B 0.0%
Lake Ave. & Green St.
Auto Intx. 0.663 (B) 0.663 (B) B >> B 0.0%
Transit SB 2.25 (B) 2.25 (B) B >> B 0.0%
Pedestrian SB 2.63 (B) 2.63 (B) B >> B 0.0%
Bicycle NB 1.99 (A) 1.99 (A) A >> A 0.0%
Lake Ave & Colorado Blvd.
Auto Intx. 0.877 (D) 0.877 (D) D >> D 0.0%
Transit NB 1.75 (A) 1.76 (A) A >> A 0.6%
Pedestrian SB 2.83 (C) 2.83 (C) C >> C 0.0%
Bicycle SB 4.41 (E) 4.41 (E) E >> E 0.0%
Lake Ave. & Union St.
Auto Intx. 0.615 (B) 0.615 (B) n/a n/a
Transit NB 1.56 (A) 1.56 (A) n/a n/a
Pedestrian NB 2.48 (B) 2.48 (B) n/a n/a
Bicycle NB 3.44 (C) 3.44 (C) n/a n/a
Lake Ave. & Walnut St.
Auto Intx. 1.010 (F) 0.994 (E) F >> E ‐1.6%
Transit NB 1.52 (A) 1.52 (A) n/a n/a
Pedestrian NB 2.84 (C) 2.84 (C) n/a n/a
Bicycle NB 3.90 (D) 3.90 (D) n/a n/a
Source: Dowling Associates, Inc
Suggestions Regarding Setting Significance Criteria
As mentioned earlier, the significance criteria of LOS C conditions for the non-automobile modes were employed for the multimodal analysis presented in this report. The City may want to consider setting the multimodal impact criteria differently. One suggestion would be for the City to inventory key locations in its street system, including collecting photos and videos along those roadways, and then present that information to a group of stakeholders (City Planning Commissioners, Residents, etc.) to solicit feedback as to which locations are acceptable or unacceptable from the perspective of automobile drivers, transit riders, pedestrians and bicyclists. The City could utilize that feedback from the stakeholders as input for defining its significance criteria for multimodal analysis.