multilevel safety climate and safety performance in the
TRANSCRIPT

International Journal of
Environmental Research
and Public Health
Article
Multilevel Safety Climate and Safety Performance inthe Construction Industry: Development andValidation of a Top-Down Mechanism
Ran Gao *, Albert P.C. Chan, Wahyudi P. Utama and Hafiz ZahoorDepartment of Building and Real Estate, The Hong Kong Polytechnic University, Hung Hom, Kowloon,Hong Kong 999077, China; [email protected] (A.P.C.C.); [email protected] (W.P.U.);[email protected] (H.Z.)* Correspondence: [email protected]; Tel.: +852-5168-7254; Fax: +852-2764-5131
Academic Editor: Paul B. TchounwouReceived: 22 September 2016; Accepted: 3 November 2016; Published: 8 November 2016
Abstract: The character of construction projects exposes front-line workers to dangers and accidents.Safety climate has been confirmed to be a predictor of safety performance in the construction industry.This study aims to explore the underlying mechanisms of the relationship between multilevel safetyclimate and safety performance. An integrated model was developed to study how particular safetyclimate factors of one level affect those of other levels, and then affect safety performance from thetop down. A questionnaire survey was administered on six construction sites in Vietnam. A total of1030 valid questionnaires were collected from this survey. Approximately half of the data were usedto conduct exploratory factor analysis (EFA) and the remaining data were submitted to structuralequation modeling (SEM). Top management commitment (TMC) and supervisors’ expectation (SE)were identified as factors to represent organizational safety climate (OSC) and supervisor safetyclimate (SSC), respectively, and coworkers’ caring and communication (CCC) and coworkers’ rolemodels (CRM) were identified as factors to denote coworker safety climate (CSC). SEM results showthat OSC factor is positively related to SSC factor and CSC factors significantly. SSC factor couldpartially mediate the relationship between OSC factor and CSC factors, as well as the relationshipbetween OSC factor and safety performance. CSC factors partially mediate the relationship betweenOSC factor and safety performance, and the relationship between SSC factor and safety performance.The findings imply that a positive safety culture should be established both at the organizationallevel and the group level. Efforts from all top management, supervisors, and coworkers should beprovided to improve safety performance in the construction industry.
Keywords: construction safety; safety climate; safety performance; structural equation modeling
1. Introduction
The construction industry is recognized as one of the most dangerous industries in the world [1].The complexity of the construction procedures and the temporary character of the projects exposesfront-line workers to dangers and accidents, and makes safety a rather complex issue [2]. At a roughestimate, the construction industry accounts for 30%–40% of fatal injuries, although it employs only 7%of the world’s workforce [3]. A large aggregation of studies have focused on construction safety andcontributed to the improvement of safety performance [4]. A literature review summarized four keytopics about construction safety over the last three decades, which are causes of construction accidents,the influence of management on accidents and accident prevention, safety in design, and safety climateand safety culture [2].
Safety climate is derived from organizational climate, and describes workers’ perceptions ofthe value of safety in their work environment [5]. Originally defined by Zohar in 1980, safety
Int. J. Environ. Res. Public Health 2016, 13, 1100; doi:10.3390/ijerph13111100 www.mdpi.com/journal/ijerph

Int. J. Environ. Res. Public Health 2016, 13, 1100 2 of 14
climate is described as “a unified set of cognitions regarding the safety aspects of the organization”,which “reflects employees’ shared perceptions about the relative importance of safe conduct in theiroccupational behavior”. Safety climate has been confirmed to be a predictor of safety performancein substantial studies [6–8]. Desai et al. [9] identified a positive relationship between safety climateand minor accidents, and no significant relationship was discovered between safety climate and majoraccidents. Clarke [6] conducted a meta-analysis with 32 published papers and identified a positiverelationship between safety climate and safety behaviors. In the construction industry, insufficientsafety precautions and weak safety climate are also deemed to be major causes of the high industrialaccident rates and unsafe behaviors [7,10]. The complicated characteristics of construction providerather complex conditions for the consideration of safety climate and pose challenges to safety climateresearch within this particular industry [11].
Melia et al. [12] split up safety climate in the construction sector into multilevel variables (i.e.,the organizational safety response, the supervisors’ safety response, the coworkers’ safety response,and the workers’ safety response), and examined a psychosocial sequence of relationships amongthese safety responses with regression analysis. Compared to regression analysis, the structuralequation modeling (SEM) method could analyze data with consideration of their structural complexityand permission of study on relationships among each factors concurrently [13]. Based on a similarframework to the study of Melia et al. [12], Brondino et al. [13] used the SEM method to test a modelon the relationships between organizational and group safety climate and safety performance in themanufacturing industry.
Similar to Brondino et al. [13], the current study seeks to explore the underlying mechanisms ofthe relationship between multilevel safety climate and safety performance using the SEM method,but in the construction industry. Distinct from Brondino et al. [13], different safety climate factorseven from the same level are considered to be different constructs in the current study. To be specific,this paper aims to study how particular safety climate factors of one level affect those of other levels,and then affect safety performance from the top down. A model unveiling underlying mechanismsof the relationship between multilevel safety climate and safety performance would be useful forsafety professionals to evaluate, supervise, and improve safety performance in construction projects.This model supposes sequent effects of safety climate factors of the organizational level on safetyperformance through safety climate factors at the supervisors’ and coworkers’ level. The followinghypotheses were proposed according to the research of Melia et al. [12] and Brondino et al. [13], andthe proposed relationships among factors are shown in Figure 1.
H1: Organizational safety climate (OSC) factors are positively related to supervisor safety climate(SSC) factors and coworker safety climate (CSC) factors.
H2: SSC factors mediate the relationship between OSC factors and CSC factors.H3: SSC factors mediate the relationship between OSC factors and safety performance (SP).H4: CSC factors mediate the relationship between OSC factors and SP.H5: CSC factors mediate the relationship between SSC factors and SP.
Int. J. Environ. Res. Public Health 2016, 13, 1100 2 of 14
Safety climate is derived from organizational climate, and describes workers’ perceptions of the
value of safety in their work environment [5]. Originally defined by Zohar in 1980, safety climate is
described as “a unified set of cognitions regarding the safety aspects of the organization ”, which
“reflects employees’ shared perceptions about the relative importance of safe conduct in their
occupational behavior”. Safety climate has been confirmed to be a predictor of safety performance in
substantial studies [6–8]. Desai et al. [9] identified a positive relationship between safety climate and
minor accidents, and no significant relationship was discovered between safety climate and major
accidents. Clarke [6] conducted a meta-analysis with 32 published papers and identified a positive
relationship between safety climate and safety behaviors. In the construction industry, insufficient
safety precautions and weak safety climate are also deemed to be major causes of the high industrial
accident rates and unsafe behaviors [7,10]. The complicated characteristics of construction provide
rather complex conditions for the consideration of safety climate and pose challenges to safety climate
research within this particular industry [11].
Melia et al. [12] split up safety climate in the construction sector into multilev el variables (i.e.,
the organizational safety response, the supervisors ’ safety response, the coworkers’ safety response,
and the workers’ safety response), and examined a psychosocial sequence of relationships among
these safety responses with regression analysis. Compared to regression analysis, the structural
equation modeling (SEM) method could analyze data with consideration of their structur al
complexity and permission of study on relationships among each factors concurrently [13]. Based on
a similar framework to the study of Melia et al. [12], Brondino et al. [13] used the SEM method to test
a model on the relationships between organizational and group safety climate and safety
performance in the manufacturing industry.
Similar to Brondino et al. [13], the current study seeks to explore the underlying mechanisms of
the relationship between multilevel safety climate and safety performance using the SEM method,
but in the construction industry. Distinct from Brondino et al. [13], different safety climate factors
even from the same level are considered to be different constructs in the current study. To be specific,
this paper aims to study how particular safety climate factors of one level affect those of other levels,
and then affect safety performance from the top down. A model unveiling underlying mechanisms
of the relationship between multilevel safety climate and safety performance would be useful for
safety professionals to evaluate, supervise, and improve safety performance in construction projects.
This model supposes sequent effects of safety climate factors of the organizational level on safety
performance through safety climate factors at the supervisors’ and coworkers’ level. The following
hypotheses were proposed according to the research of Melia et al. [12] and Brondino et al. [13], and
the proposed relationships among factors are shown in Figure 1.
H1: Organizational safety climate (OSC) factors are positively related to supervisor safety
climate (SSC) factors and coworker safety climate (CSC) factors.
H2: SSC factors mediate the relationship between OSC factors and CSC factors.
H3: SSC factors mediate the relationship between OSC factors and safety performance (SP).
H4: CSC factors mediate the relationship between OSC factors and SP.
H5: CSC factors mediate the relationship between SSC factors and SP.
Figure 1. Research model and hypotheses. OSC: organizational safety climate, SSC: supervisor safety
climate, CSC: coworker safety climate, SP: safety performance.
Figure 1. Research model and hypotheses. OSC: organizational safety climate, SSC: supervisor safetyclimate, CSC: coworker safety climate, SP: safety performance.

Int. J. Environ. Res. Public Health 2016, 13, 1100 3 of 14
2. Literature Review
2.1. Safety Climate in Construction
Among studies on safety climate, many scholars have conducted factor analyses to identifyits distinct structures and dimensions [1,11,14,15]. In the construction industry, the number ofsafety climate dimensions varies from two [15] to fifteen [14]. Management’s commitment to safety,workers’ involvement in safety, and safety rules and procedures are the three most frequent safetyclimate factors in the construction industry [16]. Many studies have considered safety climate as amultilevel concept [12,13,17–19]. Zohar himself extended the original definition of safety climate ina longitudinal manner, by adding a group-level safety climate to the previous organizational safetyclimate [18]. The basic proposition of this development was that regulations were formulated at theorganization level and implemented at the group level, and thus, safety climate could be formed fromtop management’s policy actions as well as front-line supervisors’ practical actions. In the constructionindustry, employees work in small groups and report to an appointed supervisor. Communicationwith supervisors represents to workers the real priority of safety through the practices supervisorsimplement regarding company safety regulations and the resolution of conflicts between safety andproductivity [11], and the supervisor’s safety climate is thus formed. Lingard et al. [20] confirmed theexistence of supervisor’s safety climate within the road construction and maintenance organization,and discovered that supervisory personnel, such as foremen and gangers, played a major role inaffecting safety performance in workgroups. Besides supervisor’s safety climate, another potentialdimension of group-level safety climate is coworkers’ safety climate, which is the extent to whichworkers care about their coworkers’ safety [12,13,21]. Coworkers give information, provide care, andact as role models in the work environment. Their behaviors influence workers’ task performancebeyond supervisors’ behaviors [13]. Compared to managers and supervisors, coworkers are closer andlarger in number. Workers tend to develop clear safety beliefs through exchanges with coworkers.
2.2. Safety Performance
Safety performance mainly includes two categories: safety outcomes and safety behaviors [22].Safety outcomes provide historical information on bottom-line indicators of safety performance, whichis traditionally measured by statistical data such as accidents and injuries [23,24]. Safety performanceis also described as the actual safety behaviors that individuals performed at work, and is classifiedinto safety compliance and safety participation [5,25]. Safety compliance describes safety-relatedbehaviors required by the organization to be carried out by individuals to keep the workplace safe.Safety participation depicts voluntary safety-related behaviors that may not directly work on personalsafety but help to develop an organizational context to support safety [5,26,27].
2.3. Relationship between Safety Climate and Safety Performance
The relationship between safety climate and safety performance has been learnt in substantialstudies [12,13,26,28–30]. Morrow et al. [31] explored the relationship between different facets of safetyclimate and safety behaviors. Three facets including work-safety tension, management, and coworkerswere considered, and the former one was found to be most strongly related to unsafe behaviorswhen compared with the latter two. Siu et al. [28] investigated the relations among safety climate,psychological strains, and accident rates, and found that psychological strains is a mediator of therelationship between safety climate and accident rates. Huang et al. [29] discovered that employeesafety control was a mediator of the relationship between safety climate and self-reported injury. Griffinand Neal [26] identified that safety knowledge and safety motivation mediated the link between safetyclimate and safety performance (i.e., safety compliance and safety participation). Guo et al. [30]extended Griffin and Neal’s research and tested an integrative model in the construction industry tounderstand the mechanisms that explain how particular safety climate factors affect workers’ safetyperformance through individual factors (i.e., safety knowledge and safety motivation).

Int. J. Environ. Res. Public Health 2016, 13, 1100 4 of 14
3. Research Methods
3.1. Questionnaire Design
To test the proposed hypotheses, a questionnaire survey approach was applied for data collection.The questionnaire was composed of three parts. The first part consisted of 19 questions asking thepersonal particulars of the participants. The second part was a 38-item multi-level safety climate scalebased on a similar structure to Melia et al. [12] and Brondino et al. [13]. To conduct data analysisof different levels separately, as well as to carry out an integrated study of the relationships amongthem, the workers’ perceptions of safety climate from various levels including top management level,supervisor level and coworker level were measured in this study. The safety climate related to topmanagement was evaluated with the organizational safety climate scale developed by Zohar andLuria [19] with 16 items which focus on the attitudes and activities of top management regarding safetymanagement. For example, a sample item was “Top management is strict about working safely whenwork falls behind schedule”. The safety climate related to supervisor was measured with a 10-itemscale derived from Zohar [18]. For example, a sample item was “My supervisor says a good wordwhenever he sees a job done according to the safety rules”. The safety climate related to coworkers wasmeasured with a 12-item safety climate scale revised from Brondino et al. [13]. For example, a sampleitem in this scale was “My coworkers emphasize safety procedures when we are working underpressure”. The third part of the questionnaire was the safety performance scale. Safety performance inthis study was considered to be the actual safety behaviors that individuals perform at work. A six-itemsafety performance scale developed from Neal and Griffin [25] was employed to measure these actualsafety behaviors. Within the six items, three items were related to safety compliance, which were “I useall the necessary safety equipment to do my job”, “I use the correct safety procedures for carrying outmy job”, and “I ensure the highest levels of safety when I carry out my job”. The other three items wererelated to safety participation, which were “I promote the safety program within the organization”,“I put in extra effort to improve the safety of the workplace”, and “I voluntarily carry out tasks oractivities that help to improve workplace safety”. A five-point Likert scale was adopted to measure theresponse to each item from 1 to 5, in terms of strongly disagree, disagree, neutral, agree, and stronglyagree, respectively.
The questionnaire was initially designed in English. Chinese versions and Vietnamese versionswere obtained through translation. To guarantee semantic reliability, non-English versions hadsubsequently been translated back into English by a different translator team. Ambiguous translationswere discussed and revised by the two translator teams. A panel of experts, comprising seven scholarsand nine practitioners, were invited to make some suggestions to assure that the research contentwere exactly expressed and in line with practice situations. Several minor revisions were consequentlymade to the expression of the questions and the structure of the questionnaire.
3.2. Participants and Procedure
The data were collected from six construction sites in Vietnam in May 2015. All these projectswere contracted by Chinese international contractors. To guarantee accurate responses from front-lineworkers and to encourage widespread participation from the investigated projects, the researcherswent to the aforesaid construction sites and coordinated with the workers face-to-face with the help ofinterpreters. The research aims and objectives were conveyed to the participants clearly. The workerswere assured that their participation was voluntary, all replies were anonymous and confidential, andno information would be disclosed to their supervisors or coworkers.
3.3. Data Analysis
In the current study, the exploratory factor analysis (EFA) was used to identify the potentialmultilevel safety climate factors. These factors were further verified and relationships among thesefactors were investigated by the SEM. Data were randomly split in two parts in the SPSS 17.0 (IBM,

Int. J. Environ. Res. Public Health 2016, 13, 1100 5 of 14
New York, NY, USA) for Windows software package. Approximately half of the data were used toconduct EFA in the SPSS 17.0 for Windows software package and the remaining data were submittedto SEM in the Analysis of Moment Structures (AMOS) version 17.0 (IBM, New York, NY, USA).
3.3.1. Exploratory Factor Analysis
EFA and confirmatory factor analysis (CFA) are two discrete kinds of factor analysis. The originallydefined factor analysis has now come to be called EFA. It is a powerful method to reduce variablecomplexity to greater simplicity by summarizing a larger quantity of variables to a smaller quantity offactors [32]. EFA allows the analysis to be concentrated on the principal components in order to acquireknowledge about dynamics of their relationships. In the current study, EFA was used to identify thefactor structure of safety climate firstly. With understanding of the factor structure, SEM was thenconducted in order to investigate the relationship among different safety climate factors and safetyperformance. Before EFA, both the Kaiser-Mayer-Olkin (KMO) measure of sampling accuracy andBarlett’s test of sphericity were conducted to evaluate the appropriateness of using the EFA method inthis study. As a frequently-used extraction method whenever EFA are conducted, principal componentanalysis (PCA) was selected for data extraction in the current research. In this method, variablesare put together according to their mutual correlations and then combined to a certain number ofcomponents [33]. To find out the number of factors that should be extracted and interpreted, parallelanalysis was conducted in addition to Kaiser’s criterion and scree test. According to Pallant [34],parallel analysis is more accurate for determining the number of factors to be interpreted as the othertwo methods have a tendency to overrate the number of factors. The Oblimin oblique rotation methodwas used to interpret latent variables underlying a factor due to the potential correlations among thesefactors. The threshold of 0.50 was considered to be the minimum factor loading when determining anitem to load on a latent factor [35].
3.3.2. Structural Equation Modelling
SEM was conducted to test the potential theoretical relationships among different safety climatefactors and safety performance in the current study. SEM usually contains a measurement modelthat defines latent variables with several observed variables, and a structural model that studies therelationships between latent variables. The SEM method was chosen because it could estimate thetheoretical relationships among latent variables more accurately by considering measurement error, andexamine several interdependent multiple regressions concurrently. In the current study, safety climateand safety performance factors are latent variables that could not be directly observed. With SEM,a proposed measurement model composed of several safety climate and safety performance factorswas examined, and a hypothetical structural model considering their relationships was developedand examined. AMOS version 17.0 was used in the current study. For model estimation, maximumlikelihood method was applied. The SEM model was tested in two stages of verifying the measurementmodel and verifying the structural model. Internal validity and reliability of the model was assessedwith calculating average variance extracted (AVE) and construct reliability (CR). A value over 0.50 ofAVE and a value over 0.70 of CR suggest good validity and reliability, respectively [36]. Because of themodel complexity, internal validity and reliability was firstly accessed within every construct, andthen in an aggregated measurement model [37]. For model evaluation, a number of frequently-used fitindices were adopted in the current study, including the ratio of model chi-square to the degrees offreedom (χ2/df), root mean square error of approximation (RMSEA), goodness-of-fit (GFI), adjustedgoodness-of-fit (AGFI), Tucker–Lewis index (TLI) and comparative fit index (CFI). A χ2/df value lessthan 5 indicates an acceptable model fit to the data. RMESA values of less than 0.05 indicate a good fit,whereas values ranging from 0.05 to 0.08 are acceptable. GFI, AGFI, TLF, and CFI all range from 0 to 1.Values over 0.80 are considered to be acceptable model fit to the data. Mediations were also consideredin SEM. The bootstrap method was selected in AMOS version 17.0. The mediation effect exists if the

Int. J. Environ. Res. Public Health 2016, 13, 1100 6 of 14
bias-corrected interval for the indirect effect does not include zero. If the bias-corrected interval for thedirect effect includes zero, full mediation effect exists; if not, partial mediation effect exists [38].
4. Results
4.1. The Samples
A total of 1490 questionnaires were distributed; 1120 completed questionnaires were returnedfor a response rate of 75.2%. After deleting the extreme and missing values, 1030 questionnaires wereused for analysis. Overall, approximately 20.4% of the participants were Chinese while the otherswere Vietnamese (79.6%). Approximately 83.7% of the participants were male and 71.0% were married.The largest group among the participants in terms of age was individuals from 21 to 30 years old(62.2%), while the most common number of family members supported was two (26.0%). Most of theparticipants had a junior middle school level (31.4%). The range of 1 to 5 years was generally common(64.0%) for the participants’ job tenure. Approximately 39.0% of the participants had a smoking habit,while 42.5% had a drinking habit.
4.2. Exploratory Factor Analysis
Around half of the data were used to conduct EFA in the SPSS 17.0 for Windows software package.For EFA on safety climate, the results showed that Kaiser-Mayer-Olkin (KMO) measure of samplingaccuracy was 0.891 and Barlett’s test of sphericity was significant (p < 0.001), indicating that the datawere appropriate for factor analysis [39]. The 38 safety climate items were subjected to a factor analysiswith PCA extraction and Oblimin rotation method. This yielded an interpretable result of four factorsusing the parallel analysis and explained 56.93% of variance. Factors 1, 2, 3, and 4 explained 23.19%,16.09%, 10.84% and 6.81% of the variance, respectively.
As shown in Table 1, the final result includes 27 items with factor loadings above 0.50 on one ofthese factors. The factor loadings of each item and the percentage of variance explained by each factorare also shown in this table. The first factor was interpreted as top management commitment (TMC)and it consisted of 10 items from OSC indicating the attitude to safety of top management level in theorganization. The explanation of the second factor was coworkers’ caring and communication (CCC)and it included eight items from CSC which reflect coworkers’ opinion on communicating with otherworkers and their willingness to help other workers. The third factor was explained as coworkers’ rolemodels (CRM) since it comprised four items from CSC indicating coworkers’ safety behaviors thatcould provide a fine example to other workers. The interpretation of the fourth factor was supervisors’expectation (SE) and it contained five items from SSC focusing on supervisor’s attitude to constructionsafety. All the factors included more than four items, and the Cronbach’s alpha coefficients for thesefour factors were 0.961, 0.887, 0.897, and 0.890, respectively, which were all above 0.70 and consideredto be acceptable [40,41]. In summary, TMC and SE were identified to be factors that represent OSC andSSC, respectively, while CCC and CRM were identified as factors to denote CSC. That is to say, OSCand SSC were explained by one factor each, while CSC was explained by two factors.
Table 1. Exploratory factor analysis of safety climate.
Construct Code Factor Loading Cronbach’s Alpha Variance Explained (%)
Top Management Commitment(TMC)
OSC2 0.886
0.961 23.19
OSC1 0.873OSC6 0.872
OSC15 0.866OSC12 0.853OSC7 0.852
OSC16 0.850OSC3 0.846OSC8 0.809OSC5 0.807

Int. J. Environ. Res. Public Health 2016, 13, 1100 7 of 14
Table 1. Cont.
Construct Code Factor Loading Cronbach’s Alpha Variance Explained (%)
Coworkers’ Caring andCommunication (CCC)
CSC10 0.795
0.887 16.09
CSC11 0.780CSC6 0.749CSC7 0.745CSC9 0.745CSC4 0.728CSC5 0.726CSC3 0.662
Coworkers’ Role Models (CRM)
CSC8 0.834
0.897 10.84CSC2 0.830CSC12 0.814CSC1 0.699
Supervisors’ Expectation (SE)
SSC9 0.874
0.890 6.81SSC10 0.869SSC6 0.799SSC8 0.786SSC7 0.701
OSC: organizational safety climate, CSC: coworker safety climate, SSC: supervisor safety climate.
For EFA on safety performance, the results showed Kaiser-Mayer-Olkin (KMO) measure ofsampling accuracy was 0.860 and Barlett’s test of sphericity was significant (p < 0.001). The safetyperformance (SP) items were also subjected to a factor analysis with PCA extraction and Obliminrotation method. This yielded an interpretable result of one factor and explained 56.04% of variance.As shown in Table 2, the final result includes six items with factor loadings above 0.50 on this factor.
As CCC and CRM are two separate safety climate factors on the CSC level, the proposed researchmodel in Figure 1 could be further developed as Figure 2.
Table 2. Exploratory factor analysis of safety performance.
Construct Code Factor Loading Variance Explained (%)
Safety Performance (SP)
SPart.1 0.777
56.04
SComp.3 0.777SComp.2 0.759SComp.1 0.758SPart.3 0.743SPart.2 0.673
Int. J. Environ. Res. Public Health 2016, 13, 1100 7 of 14
Coworkers ’ Caring and
Communication (CCC)
CSC11 0.780
CSC6 0.749
CSC7 0.745
CSC9 0.745
CSC4 0.728
CSC5 0.726
CSC3 0.662
Coworkers ’ Role Models
(CRM)
CSC8 0.834
0.897 10.84 CSC2 0.830
CSC12 0.814
CSC1 0.699
Supervisors ’ Expectation
(SE)
SSC9 0.874
0.890 6.81
SSC10 0.869
SSC6 0.799
SSC8 0.786
SSC7 0.701
OSC: organizational safety climate, CSC: coworker safety climate, SSC: supervisor safety climate.
For EFA on safety performance, the results showed Kaiser -Mayer-Olkin (KMO) measure of sampling
accuracy was 0.860 and Barlett ’s test of sphericity was significant (p < 0.001). The safety performance
(SP) items were also subjected to a factor analysis with PCA extraction and Oblimin rotation method.
This yielded an interpretable result of one factor and explained 56.04% of variance. As shown in Table 2,
the final result includes six items with factor loadings above 0.50 on this factor.
As CCC and CRM are two separate safety climate factors on the CSC level, the proposed research
model in Figure 1 could be further developed as Figure 2.
Table 2. Exploratory factor analysis of safety performance.
Construct Code Factor Loading Variance Explained (%)
Safety Performance (SP)
SPart.1 0.777
56.04
SComp.3 0.777
SComp.2 0.759
SComp.1 0.758
SPart.3 0.743
SPart.2 0.673
Figure 2. Further development of research model and hypotheses. TMC: top management
commitment, SE: supervisors’ expectations, CRM: coworkers’ role models, CCC: coworkers’ caring
and communication, SP: safety performance.
Figure 2. Further development of research model and hypotheses. TMC: top managementcommitment, SE: supervisors’ expectations, CRM: coworkers’ role models, CCC: coworkers’ caringand communication, SP: safety performance.

Int. J. Environ. Res. Public Health 2016, 13, 1100 8 of 14
4.3. Measurement Model Assessment
A proposed measurement model composed of TMC, SE, CCC, CRM, and SP was examined inthe current study. The remaining half of the data was submitted to SEM in the Analysis of MomentStructures (AMOS) version 17.0. Table 3 shows the empirically tested results of the multilevel safetyclimate and safety performance measurement model with standardized parameter estimates. Theanalysis retained items with factor loadings larger than 0.50 [36]. OSC1, OSC6, OSC7, and OSC15were thus removed from the factor of TMC. CSC7 and CSC3 were removed from the factor of CCC,and CSC1 was removed from the factor of CRM. SPart. 2 and SPart. 3 were removed from the factorof SP. The results showed that all values of CR for the four constructs were more than 0.70, therebyadvising a satisfactory level of construct reliability. The values of AVE were all around or higher than0.50, suggesting a satisfactory level of construct validity [36]. According to Table 4, the selected modelfit indices were all at the acceptable level for the measurement model (χ2/df = 4.091, GFI = 0.879,AGFI = 0.849, RMSEA = 0.073, TLI = 0.898, and CFI = 0.911). All paths from the observed variables tothe latent factors were significant.
Table 3. Measurement model evaluation.
Construct Code Loading AVE (Average Variance Extracted) Composite Reliability
TMC (OSC)
OSC2 0.743
0.704 0.934
OSC3 0.873OSC5 0.863OSC8 0.868
OSC12 0.845OSC16 0.836
SE (SSC)
SSC6 0.651
0.635 0.895SSC7 0.699SSC8 0.805SSC9 0.877SSC10 0.919
CCC (CSC-Factor 1)
CSC4 0.696
0.504 0.859
CSC5 0.709CSC6 0.708CSC9 0.679CSC10 0.736CSC11 0.729
CRM (CSC-Factor 2)CSC2 0.793
0.525 0.766CSC8 0.602CSC12 0.765
SP
SComp. 1 0.677
0.492 0.794SComp. 2 0.727SComp. 3 0.766SPart. 1 0.627
Table 4. Goodness-of-fit indexes for measurement and structural models.
Model χ2 χ2/DF GFI AGFI RMSEA TLI CFI
Measurement 989.918 4.091 0.879 0.849 0.073 0.898 0.911Structural 1116.697 4.595 0.864 0.833 0.079 0.882 0.896
DF: degrees of freedom, GFI: goodness-of-fit, AGFI: adjusted goodness-of-fit, RMSEA: root mean square errorof approximation, TLI: Tucker–Lewis index, CFI: comparative fit index.
4.4. Structural Model Assessment
According to Table 4, the model fit indices of the whole structural model were at the acceptablelevel (χ2/df = 4.595, GFI = 0.864, AGFI = 0.833, RMSEA = 0.079, TLI = 0.882, and CFI = 0.896).
Int. J. Environ. Res. Public Health 2016, 13, 1100 9 of 14
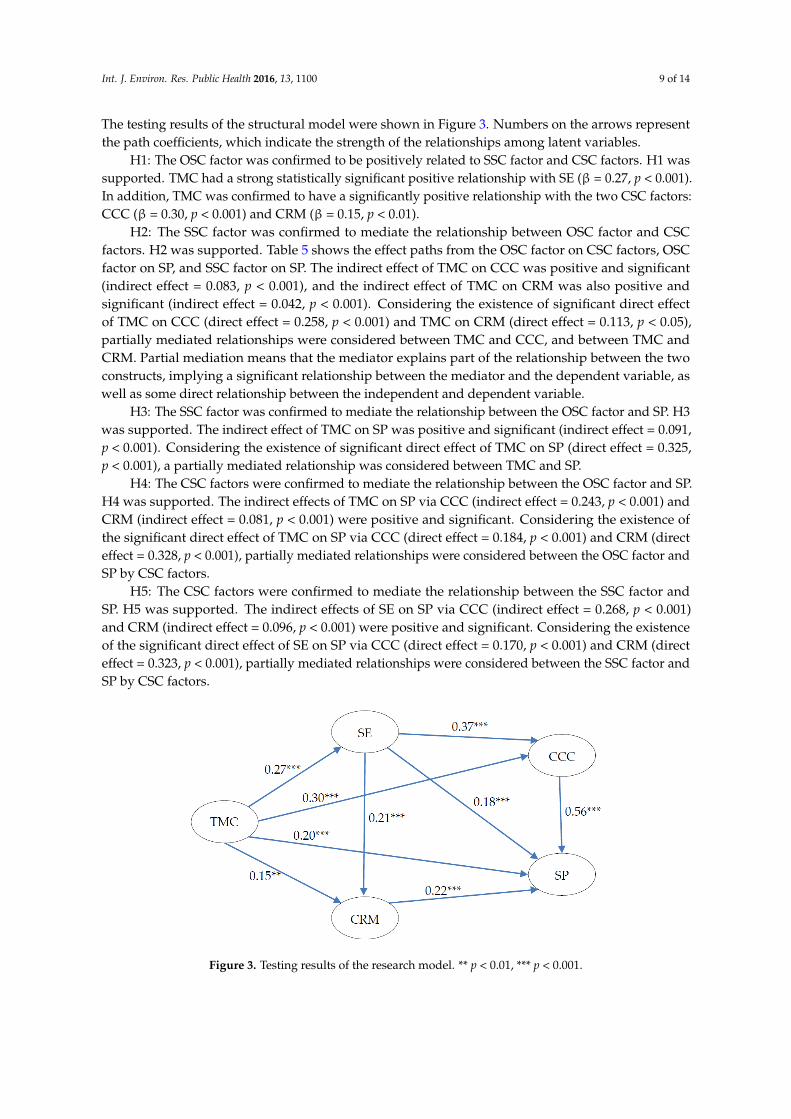
The testing results of the structural model were shown in Figure 3. Numbers on the arrows representthe path coefficients, which indicate the strength of the relationships among latent variables.
H1: The OSC factor was confirmed to be positively related to SSC factor and CSC factors. H1 wassupported. TMC had a strong statistically significant positive relationship with SE (β = 0.27, p < 0.001).In addition, TMC was confirmed to have a significantly positive relationship with the two CSC factors:CCC (β = 0.30, p < 0.001) and CRM (β = 0.15, p < 0.01).
H2: The SSC factor was confirmed to mediate the relationship between OSC factor and CSCfactors. H2 was supported. Table 5 shows the effect paths from the OSC factor on CSC factors, OSCfactor on SP, and SSC factor on SP. The indirect effect of TMC on CCC was positive and significant(indirect effect = 0.083, p < 0.001), and the indirect effect of TMC on CRM was also positive andsignificant (indirect effect = 0.042, p < 0.001). Considering the existence of significant direct effectof TMC on CCC (direct effect = 0.258, p < 0.001) and TMC on CRM (direct effect = 0.113, p < 0.05),partially mediated relationships were considered between TMC and CCC, and between TMC andCRM. Partial mediation means that the mediator explains part of the relationship between the twoconstructs, implying a significant relationship between the mediator and the dependent variable, aswell as some direct relationship between the independent and dependent variable.
H3: The SSC factor was confirmed to mediate the relationship between the OSC factor and SP. H3was supported. The indirect effect of TMC on SP was positive and significant (indirect effect = 0.091,p < 0.001). Considering the existence of significant direct effect of TMC on SP (direct effect = 0.325,p < 0.001), a partially mediated relationship was considered between TMC and SP.
H4: The CSC factors were confirmed to mediate the relationship between the OSC factor and SP.H4 was supported. The indirect effects of TMC on SP via CCC (indirect effect = 0.243, p < 0.001) andCRM (indirect effect = 0.081, p < 0.001) were positive and significant. Considering the existence ofthe significant direct effect of TMC on SP via CCC (direct effect = 0.184, p < 0.001) and CRM (directeffect = 0.328, p < 0.001), partially mediated relationships were considered between the OSC factor andSP by CSC factors.
H5: The CSC factors were confirmed to mediate the relationship between the SSC factor andSP. H5 was supported. The indirect effects of SE on SP via CCC (indirect effect = 0.268, p < 0.001)and CRM (indirect effect = 0.096, p < 0.001) were positive and significant. Considering the existenceof the significant direct effect of SE on SP via CCC (direct effect = 0.170, p < 0.001) and CRM (directeffect = 0.323, p < 0.001), partially mediated relationships were considered between the SSC factor andSP by CSC factors.
Int. J. Environ. Res. Public Health 2016, 13, 1100 9 of 14
results of the structural model were shown in Figure 3. Numbers on the arrows represent the path
coefficients, which indicate the strength of the relationships among latent variables.
H1: The OSC factor was confirmed to be positively related to SSC factor and CSC factors. H1
was supported. TMC had a strong statistically significant positive relationship with SE (β = 0.27, p <
0.001). In addition, TMC was confirmed to have a significantly positive relationship with the two CSC
factors: CCC (β = 0.30, p < 0.001) and CRM (β = 0.15, p < 0.01).
H2: The SSC factor was confirmed to mediate the relationship between OSC factor and CSC factors.
H2 was supported. Table 5 shows the effect paths from the OSC factor on CSC factors, OSC factor on
SP, and SSC factor on SP. The indirect effect of TMC on CCC was positive and significant (indirect
effect = 0.083, p < 0.001), and the indirect effect of TMC on CRM was also positive and significant
(indirect effect = 0.042, p < 0.001). Considering the existence of significant direct effect of TMC on CCC
(direct effect = 0.258, p < 0.001) and TMC on CRM (direct effect = 0.113, p < 0.05), partially mediated
relationships were considered between TMC and CCC, and between TMC and CRM. Partial
mediation means that the mediator explains part of the relationship between the two constructs,
implying a significant relationship between the mediator and the dependent variable, as well as some
direct relationship between the independent and dependent variable.
H3: The SSC factor was confirmed to mediate the relationship between the OSC factor and SP.
H3 was supported. The indirect effect of TMC on SP was positive and significant (indirect effect =
0.091, p < 0.001). Considering the existence of significant direct effect of TMC on SP (direct effect =
0.325, p < 0.001), a partially mediated relationship was considered between TMC and SP.
H4: The CSC factors were confirmed to mediate the relationship between the OSC factor and SP.
H4 was supported. The indirect effects of TMC on SP via CCC (indirect effect = 0.243, p < 0.001) and
CRM (indirect effect = 0.081, p < 0.001) were positive and significant . Considering the existence of the
significant direct effect of TMC on SP via CCC (direct effect = 0.184, p < 0.001) and CRM (direct effect
= 0.328, p < 0.001), partially mediated relationships were considered between the OSC factor and SP
by CSC factors.
H5: The CSC factors were confirmed to mediate the relationship between the SSC factor and SP.
H5 was supported. The indirect effects of SE on SP via CCC (indirect effect = 0.268, p < 0.001) and
CRM (indirect effect = 0.096, p < 0.001) were positive and significant. Considering the existence of the
significant direct effect of SE on SP via CCC (direct effect = 0.170, p < 0.001) and CRM (direct effect =
0.323, p < 0.001), partially mediated relationships were considered between the SSC factor and SP by
CSC factors.
Figure 3. Testing results of the research model. ** p < 0.01, *** p < 0.001.
Figure 3. Testing results of the research model. ** p < 0.01, *** p < 0.001.

Int. J. Environ. Res. Public Health 2016, 13, 1100 10 of 14
Table 5. Breakdown of effect paths.
Effect Paths Total Effect Indirect Effect Direct Effect Type
Effect of OSC on CSC
TMC→SE→CCC 0.341 ***,(0.249, 0.440)
0.083 ***,(0.047, 0.128)
0.258 ***,(0.176, 0.354) Partial Mediation
TMC→SE→CRM 0.155 ***,(0.079, 0.229)
0.042 ***,(0.014, 0.079)
0.113 *,(0.031, 0.192) Partial Mediation
Effect of OSC on SP
TMC→SE→SP 0.416 ***,(0.328, 0.522)
0.091 ***,(0.055, 0.136)
0.325 ***,(0.244, 0.417) Partial Mediation
TMC→CCC→SP 0.427 ***,(0.339, 0.529)
0.243 ***,(0.173, 0.337)
0.184 ***,(0.118, 0.257) Partial Mediation
TMC→CRM→SP 0.409 ***,(0.319, 0.512)
0.081 ***,(0.042, 0.128)
0.328 ***,(0.249, 0.431) Partial Mediation
Effect of SSC on SP
SE→CCC→SP 0.438 ***,(0.336, 0.561)
0.268 ***,(0.188, 0.364)
0.170 ***,(0.089, 0.259) Partial Mediation
SE→CRM→SP 0.419 ***,(0.317, 0.532)
0.096 ***,(0.050, 0.155)
0.323 ***,(0.234, 0.421) Partial Mediation
* p < 0.05, *** p < 0.001.
5. Discussion
As hypothesized, the OSC factor (TMC) is positively and significantly related to the SSC factor(SE) and CSC factors (CCC and CRM). The SSC factor (SE) could partially mediate the relationshipbetween the OSC factor (TMC) and CSC factors (CCC and CRM), as well as the relationship betweenthe OSC factor (TMC) and SP. CSC factors (CCC and CRM) play a statistically significant partialmediation role in the relationship between the OSC factor (TMC) and SP, and the relationship betweenthe SSC factor (SE) and SP.
Top management commitment to safety is crucial for enhancing safety management inconstruction projects [16,42,43]. Management commitment plays an important role in creating apositive safety culture by considering safety as an integrated component of the production systemfrom the top, rather than thinking of it as an independent part of the production process [44]. Topmanagement commitment could be explained as the management of allocating resources and time,site inspections and risk assessments, and participation in safety meetings [42]. Participation of topmanagement in safety committees and the empowerment of safety officers are deemed to be criticallyimportant [44]. The management should ‘walk the talk’ and make efforts to actively and consistentlysupport safety. The workers tend to perceive the real attitude from the management layer, and followthe example and actions of them accordingly. The management is thus incumbent on establishing apositive and practical safety standard for the workers [45]. In construction projects, top managementshould make special efforts to overcome the particularly hazardous environment and make up for thephysical and psychological distance between the headquarters and projects [12].
The identified SSC factor (SE) was confirmed to mediate the relationship between the OSC factor(TMC) and safety performance. This result is similar to the results of Zohar and Luria [19]. Safetypolicies, procedures, and regulations, which are formulated at the organization level, provide strategicand tactical rules for safety management. Safety practices, which relate to the implementation ofthese policies, procedures, and regulations, are put into action at the group level. Safety climatecould both be formed from top management’s policy actions and front-line supervisors’ practicalactions. Communicating with supervisors shows workers the true priority of safety through handling

Int. J. Environ. Res. Public Health 2016, 13, 1100 11 of 14
conflicting demands between productivity and safety [11]. In construction projects, the site is fullof continuous changes and immediate actions, and subcontracting is extremely common. Theprojects might be distant from headquarters and the front-line workers may often hardly see thetop management. The temporary nature of construction projects, the characteristics of constructionprocedures, and the physical distance from headquarters could further reduce the direct impactof organizational factors on safety performance [2]. On the commitment of top managementcommitment to safety climate could be formed through site supervisors’ practical attitudes andactions. As such, effective communication between site supervisors and front-line workers should beset up to make workers understand company safety regulations more easily and to improve safetyperformance accordingly.
CSC factors (CCC and CRM) were confirmed to partially mediate the relationship between theOSC factor (TMC) and safety performance, and the relationship between the SSC factor (SE) and safetyperformance. The mediation effect of CCC was relatively stronger than SE for the relationship betweenTMC and SP, and this result echoed the study of Tucker et al. [46] and Chiaburu and Harrison [47],which suggested that coworker support could predict many employee performances better than leadersupport could. Coworkers caring and communication and the effect of role models have great effectson ensuring workers’ safety performance. Coworkers’ attitudes and actions to safety are supposedto influence safety performance because they provide beliefs about what kind of actions are sociallyacceptable within a workgroup or organization. CSC factors mediated the relationship between SEand SP, as well as TMC and SP for the following reasons. For SE, which is an SSC factor, coworkerssupport supervisors to reduce pressures to communicate and access to resources, as well as enhancesupervisors’ awareness of self-efficacy to engage in safety leadership [48]. For TMC, which is anOSC factor, attitudes and actions regarding safety may also originate from their own perceptions ofmanagement’s commitment to safety [31]. It is thus important to create a friendly relationship amongcoworkers. Beyond taking personal responsibility, workers should also be educated to promote a senseof responsibility for coworkers’ safety in order to create a safer work environment. Workers shouldbe supported to remind their coworkers of safety by caring, communicating, and playing the part ofrole models.
6. Conclusions
The current study explores the underlying mechanisms of the relationship between safety climateand safety performance. To be specific, it investigates how particular safety climate factors of onelevel affect those of other levels, and then affect safety performance from the top down. According tothe EFA results, TMC and SE were identified as factors to represent OSC and SSC, respectively, andCCC and CRM were identified as factors to denote CSC. After verifying these identified factors in anintegrated model in SEM, all five proposed hypotheses were tested and supported. The OSC factor(TMC) is positively and significantly related to the SSC factor (SE) and CSC factors (CCC and CRM).The SSC factor (SE) could partially mediate the relationship between the OSC factor (TMC) and CSCfactors (CCC and CRM), as well as the relationship between the OSC factor (TMC) and SP. CSC factors(CCC and CRM) play a statistically significant partial mediation role in the relationship between theOSC factor (TMC) and SP, and the relationship between the SSC factor (SE) and SP.
The findings of this study provide practical implications. A positive safety culture should beestablished both at the organizational level and the group level. Efforts from top management,supervisors, and coworkers should be provided to safety management. First, the top managementshould ‘walk the talk’ and make efforts to actively and consistently support safety. Second, effectivecommunication between site supervisors and front-line workers should be set up to make workersunderstand company safety regulations more easily and to improve safety performance accordingly.Third, workers should be educated to promote a sense of responsibility for coworkers’ safety tocreate a safer work environment and be supported to remind their coworkers of safety by caring,communicating, and playing their part as role models.
Int. J. Environ. Res. Public Health 2016, 13, 1100 12 of 14
This study has several limitations. First, similar to any other self-reported survey, common methodbiases may exist in the current research. To control and alleviate their effects, several techniques havebeen adopted. At the questionnaire design stage, a number of reverse-coded items were included in thescales to reduce the possible effects of response pattern bias. At the questionnaire administration stage,the participants were notified that their responses were anonymous and confidential, and answerswere not right or wrong, and therefore they should answer questions as frankly as possible. Second,this study used self-reported questionnaires to measure safety performance. It could obtain objectivemeasures of safety performance to find out how the integrated multilevel safety climate works on themin the future. Third, the current study does not consider some of the important personal particulars ofworkers (e.g., trade information). Future research should consider additional information of workers(e.g., trade types) to further improve the research findings. Future work should also validate theresearch findings in the current study by getting data from a larger number of organizations.
Acknowledgments: This study has been supported by the Hong Kong PhD Fellowship Scheme established bythe Research Grants Council in Hong Kong. The authors gratefully acknowledge the Department of Buildingand Real Estate at Hong Kong Polytechnic University for providing technical support to conduct this research.The contributions of all construction industry practitioners involved in the study are also highly appreciated.The authors also acknowledge the anonymous reviewers for their comments.
Author Contributions: Ran Gao designed the research, collected, and analyzed the data, and drafted the paper;Ran Gao, Albert P.C. Chan, Wahyudi P. Utama, and Hafiz Zahoor contributed in reviewing the final work toenhance/improve the outcomes.
Conflicts of Interest: The authors declare no conflict of interest.
References
1. Mohamed, S. Safety Climate in Construction Site Environments. J. Constr. Eng. Manag. 2002, 128, 375–384.[CrossRef]
2. Swuste, P.; Frijters, A.; Guldenmund, F. Is it possible to influence safety in the building sector? A literaturereview extending from 1980 until the present. Saf. Sci. 2012, 50, 1333–1343. [CrossRef]
3. Sunindijo, R.Y.; Zou, P.X.W. Political Skill for Developing Construction Safety Climate. J. Constr. Eng. Manag.2012, 138, 605–612. [CrossRef]
4. Huang, X.; Hinze, J. Owner’s role in construction safety. J. Constr. Eng. Manag. 2006, 132, 164–173. [CrossRef]5. Neal, A.; Griffin, M.A.; Hart, P.M. The impact of organizational climate on safety climate and individual
behavior. Saf. Sci. 2000, 34, 99–109. [CrossRef]6. Clarke, S. The relationship between safety climate and safety performance: A meta-analytic review. J. Occup.
Health Psychol. 2006, 11, 315. [CrossRef] [PubMed]7. Hon, C.K.H.; Chan, A.P.C.; Yam, M.C.H. Relationships between safety climate and safety performance
of building repair, maintenance, minor alteration, and addition (RMAA) works. Saf. Sci. 2014, 65, 10–19.[CrossRef]
8. Barbaranelli, C.; Petitta, L.; Probst, T.M. Does safety climate predict safety performance in Italy and theUSA? Cross-cultural validation of a theoretical model of safety climate. Accid. Anal. Prev. 2015, 77, 35–44.[CrossRef] [PubMed]
9. Desai, V.M.; Roberts, K.H.; Ciavarelli, A.P. The relationship between safety climate and recent accidents:Behavioral learning and cognitive attributions. Hum. Factors 2006, 48, 639–650. [CrossRef] [PubMed]
10. Pinto, A. QRAM a Qualitative Occupational Safety Risk Assessment Model for the construction industrythat incorporate uncertainties by the use of fuzzy sets. Saf. Sci. 2014, 63, 57–76. [CrossRef]
11. Sparer, E.H.; Murphy, L.A.; Taylor, K.M.; Dennerlein, J.T. Correlation between safety climate and contractorsafety assessment programs in construction. Am. J. Ind. Med. 2013, 56, 1463–1472. [CrossRef] [PubMed]
12. Meliá, J.L.; Mearns, K.; Silva, S.A.; Lima, M.L. Safety climate responses and the perceived risk of accidents inthe construction industry. Saf. Sci. 2008, 46, 949–958. [CrossRef]
13. Brondino, M.; Silva, S.A.; Pasini, M. Multilevel approach to organizational and group safety climate andsafety performance: Co-workers as the missing link. Saf. Sci. 2012, 50, 1847–1856. [CrossRef]
14. Fang, D.; Chen, Y.; Wong, L. Safety climate in construction industry: A case study in Hong Kong. J. Constr.Eng. Manag. 2006, 132, 573–584. [CrossRef]

Int. J. Environ. Res. Public Health 2016, 13, 1100 13 of 14
15. Dedobbeleer, N.; Béland, F. A safety climate measure for construction sites. J. Saf. Res. 1991, 22, 97–103.[CrossRef]
16. Hon, C.K.H.; Chan, A.P.C.; Yam, M.C.H. Determining Safety Climate Factors in the Repair, Maintenance,Minor Alteration, and Addition Sector of Hong Kong. J. Constr. Eng. Manag. 2013, 139, 519–528. [CrossRef]
17. Lingard, H.C.; Cooke, T.; Blismas, N. Properties of group safety climate in construction: The developmentand evaluation of a typology. Constr. Manag. Econ. 2010, 28, 1099–1112. [CrossRef]
18. Zohar, D. A Group-Level Model of Safety Climate: Testing the Effect of Group Climate on Microaccidents inManufacturing Jobs. J. Appl. Psychol. 2000, 85, 587–596. [CrossRef] [PubMed]
19. Zohar, D.; Luria, G. A multilevel model of safety climate: Cross-level relationships between organizationand group-level climates. J. Appl. Psychol. 2005, 90, 616–628. [CrossRef] [PubMed]
20. Lingard, H.C.; Cooke, T.; Blismas, N. Group-level safety climate in the Australian construction industry:Within-group homogeneity and between-group differences in road construction and maintenance.Constr. Manag. Econ. 2009, 27, 419–432. [CrossRef]
21. Lingard, H.; Cooke, T.; Blismas, N. Coworkers’ response to occupational health and safety: An overlookeddimension of group-level safety climate in the construction industry? Eng. Constr. Archit. Manag. 2011, 18,159–175. [CrossRef]
22. Christian, M.S.; Bradley, J.C.; Wallace, J.C.; Burke, M.J. Workplace safety: A meta-analysis of the roles ofperson and situation factors. J. Appl. Psychol. 2009, 94, 1103–1127. [CrossRef] [PubMed]
23. Grabowski, M.; Ayyalasomayajula, P.; Merrick, J. Denise Mccafferty Accident precursors and safety nets:Leading indicators of tanker operations safety. Marit. Policy Manag. 2007, 34, 405–425. [CrossRef]
24. Johnson, S.E. The predictive validity of safety climate. J. Saf. Res. 2007, 38, 511–521. [CrossRef] [PubMed]25. Neal, A.; Griffin, M.A. A study of the lagged relationships among safety climate, safety motivation, safety
behavior, and accidents at the individual and group levels. J. Appl. Psychol. 2006, 91, 946. [CrossRef][PubMed]
26. Griffin, M.A.; Neal, A. Perceptions of safety at work: A framework for linking safety climate to safetyperformance, knowledge, and motivation. J. Occup. Health Psychol. 2000, 5, 347–358. [CrossRef] [PubMed]
27. Neal, A.; Griffin, M.A. Safety Climate and Safety at Work; American Psychological Association: Washington,DC, USA, 2004.
28. Siu, O.-L.; Phillips, D.R.; Leung, T.-W. Safety climate and safety performance among construction workers inHong Kong. Accid. Anal. Prev. 2004, 36, 359–366. [CrossRef]
29. Huang, Y.H.; Ho, M.; Smith, G.S.; Chen, P.Y. Safety climate and self-reported injury: Assessing the mediatingrole of employee safety control. Accid. Anal. Prev. 2006, 38, 425–433. [CrossRef] [PubMed]
30. Guo, B.H.W.; Yiu, T.W.; González, V.A. Predicting safety behavior in the construction industry: Developmentand test of an integrative model. Saf. Sci. 2016, 84, 1–11. [CrossRef]
31. Morrow, S.L.; McGonagle, A.K.; Dove-Steinkamp, M.L.; Walker, C.T.; Marmet, M.; Barnes-Farrell, J.L.Relationships between psychological safety climate facets and safety behavior in the rail industry:A dominance analysis. Accid. Anal. Prev. 2010, 42, 1460–1467. [CrossRef] [PubMed]
32. Thompson, B. Exploratory and Confirmatory factor Analysis: Understanding Concepts and Applications; AmericanPsychological Association: Washington, DC, USA, 2004.
33. Choudhry, R.; Fang, D.; Lingard, H. Measuring Safety Climate of a Construction Company. J. Constr.Eng. Manag. 2009, 135, 890–899. [CrossRef]
34. Pallant, J. A Step by Step Guide to Data Analysis Using SPSS for Windows Version 15; Open University Press:Milton Keynes, UK, 2007.
35. Lingard, H.; Sublet, A. The impact of job and organizational demands on marital or relationship satisfactionand conflict among Australian civil engineers. Constr. Manag. Econ. 2002, 20, 507–521. [CrossRef]
36. Hair, J.F., Jr.; Black, W.C.; Babin, B.J.; Anderson, R.E. Multivariate Data Analysis, 7th ed.; Pearson Prentice Hall:Upper Saddle River, NJ, USA, 2010.
37. Shen, Y. An Investigation of Safety Climate on Hong Kong Construction Sites. Ph.D. Thesis, University ofHong Kong, Hong Kong, China, January 2013.
38. Shrout, P.E.; Bolger, N. Mediation in experimental and nonexperimental studies: New procedures andrecommendations. Psychol. Methods 2002, 7, 422–445. [CrossRef] [PubMed]
39. Kaiser, H.F. An index of factorial simplicity. Psychometrika 1974, 39, 31–36. [CrossRef]
Int. J. Environ. Res. Public Health 2016, 13, 1100 14 of 14
40. Litwin, M.S. How to Measure Survey Reliability and Validity; Sage Publications: New York, NY, USA, 1995;Volume 7.
41. Zhou, Q.; Fang, D.; Mohamed, S. Safety climate improvement: Case study in a Chinese construction company.J. Constr. Eng. Manag. 2010, 137, 86–95. [CrossRef]
42. Choudhry, R.M.; Fang, D.; Mohamed, S. The nature of safety culture: A survey of the state-of-the-art. Saf. Sci.2007, 45, 993–1012. [CrossRef]
43. Lingard, H.; Cooke, T.; Blismas, N. Do Perceptions of Supervisors’ Safety Responses Mediate the Relationshipbetween Perceptions of the Organizational Safety Climate and Incident Rates in the Construction SupplyChain? J. Constr. Eng. Manag. 2012, 138, 234–241. [CrossRef]
44. Zohar, D. Safety climate in industrial organizations: Theoretical and applied implications. J. Appl. Psychol.1980, 65, 96–102. [CrossRef] [PubMed]
45. Aksorn, T.; Hadikusumo, B.H.W. Critical success factors influencing safety program performance in Thaiconstruction projects. Saf. Sci. 2008, 46, 709–727. [CrossRef]
46. Tucker, S.; Chmiel, N.; Turner, N.; Hershcovis, M.S.; Stride, C.B. Perceived organizational support for safetyand employee safety voice: The mediating role of coworker support for safety. J. Occup. Health Psychol. 2008,13, 319–330. [CrossRef] [PubMed]
47. Chiaburu, D.S.; Harrison, D.A. Do peers make the place? Conceptual synthesis and meta-analysis ofcoworker effects on perceptions, attitudes, OCBs, and performance. J. Appl. Psychol. 2008, 93, 1082.[CrossRef] [PubMed]
48. Conchie, S.M.; Moon, S.; Duncan, M. Supervisors’ engagement in safety leadership: Factors that help andhinder. Saf. Sci. 2013, 51, 109–117. [CrossRef]
© 2016 by the authors; licensee MDPI, Basel, Switzerland. This article is an open accessarticle distributed under the terms and conditions of the Creative Commons Attribution(CC-BY) license (http://creativecommons.org/licenses/by/4.0/).