multilevel product differentiation in the smartphone market
TRANSCRIPT
3
Journal of Strategic Management StudiesVol. 11, No. 1, 3–18 (November 2019)
Copyright © 2019 by International Academy of Strategic Management
Multilevel Product Differentiation in The Smartphone Market
KENTARO TAKAKUWAGroup Manager, Research & Consulting Group of REASON Corp.
Abstract
Apple enjoys only 15% of industry unit sales but garners over 80% of the industry’s operating profit. However, almost of all Android smartphone vendors suffer from low profitability. This situa-tion seems to break the rule of both the winner-take-all competition in the network goods market and economies of scale. In this paper, I unveil why asymmetrical profitability exists in the smartphone industry, by analyzing a consumer survey to discover both the horizontal competition between operat-ing systems and the vertical competition between Android handsets.
Keywords:multi-sided platform, platform operator, complements’ supplier, network effect, horizontal differentia-tion, brand power, reserve price
INTRODUCTION
After the product component architecture be-comes a modular system, the rules of the business game change. Christensen, Raynor, and Verlinden (2001) stated that profit resources move from prod-uct design or manufacturing to other sectors of the value-added system under modular architecture. Firms such as Nokia and Motorola, the leading ven-dors during the early stages of the smartphone in-dustry, faced decreasing profitability, having already sold their hardware businesses to other companies, a phenomenon that happens in the smartphone indus-try.
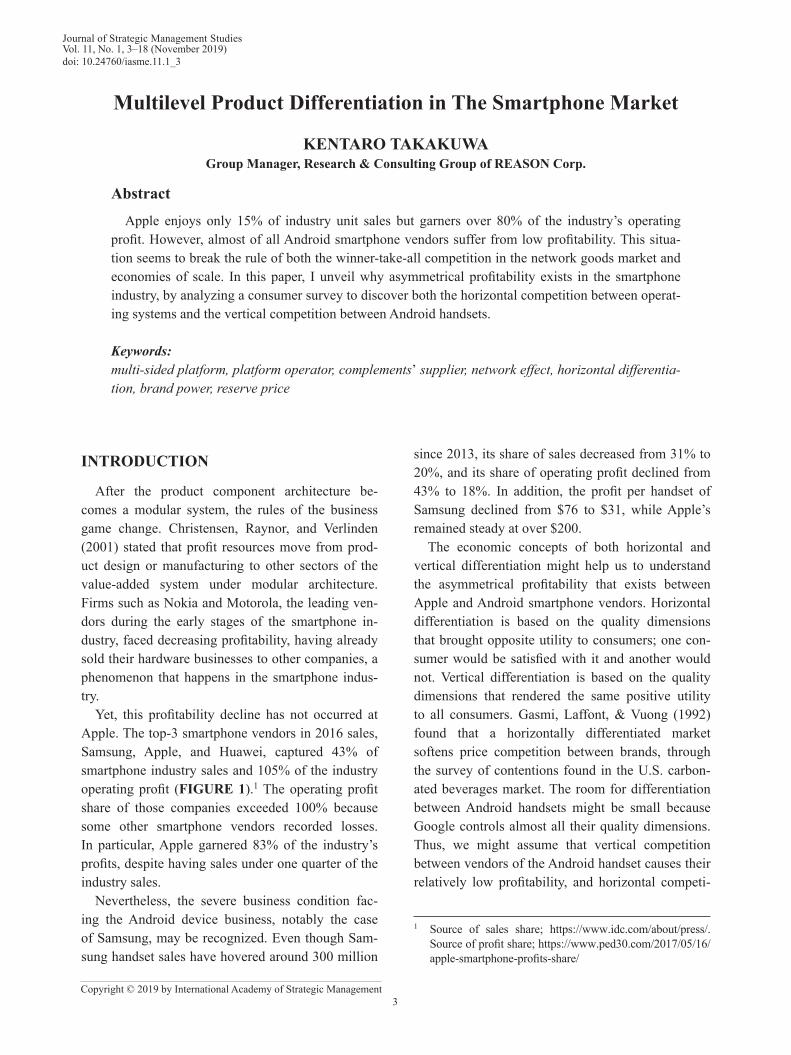
Yet, this profitability decline has not occurred at Apple. The top-3 smartphone vendors in 2016 sales, Samsung, Apple, and Huawei, captured 43% of smartphone industry sales and 105% of the industry operating profit (FIGURE 1).1 The operating profit share of those companies exceeded 100% because some other smartphone vendors recorded losses. In particular, Apple garnered 83% of the industry’s profits, despite having sales under one quarter of the industry sales.
Nevertheless, the severe business condition fac-ing the Android device business, notably the case of Samsung, may be recognized. Even though Sam-sung handset sales have hovered around 300 million
since 2013, its share of sales decreased from 31% to 20%, and its share of operating profit declined from 43% to 18%. In addition, the profit per handset of Samsung declined from $76 to $31, while Apple’s remained steady at over $200.
The economic concepts of both horizontal and vertical differentiation might help us to understand the asymmetrical profitability that exists between Apple and Android smartphone vendors. Horizontal differentiation is based on the quality dimensions that brought opposite utility to consumers; one con-sumer would be satisfied with it and another would not. Vertical differentiation is based on the quality dimensions that rendered the same positive utility to all consumers. Gasmi, Laffont, & Vuong (1992) found that a horizontally differentiated market softens price competition between brands, through the survey of contentions found in the U.S. carbon-ated beverages market. The room for differentiation between Android handsets might be small because Google controls almost all their quality dimensions. Thus, we might assume that vertical competition between vendors of the Android handset causes their relatively low profitability, and horizontal competi-
doi: 10.24760/iasme.11.1_3
1 Source of sales share; https://www.idc.com/about/press/. Source of profit share; https://www.ped30.com/2017/05/16/apple-smartphone-profits-share/
4
Vol. 11, No. 1 (November 2019)
tion between Apple and the other Android handsets causes the asymmetrical profitability between them. As I confirmed the possibility of handset brand level horizontal differentiation in Japan (Takakuwa, 2017a), and added the US market analysis (Takaku-wa, 2017b), I deepen the discussion in this paper by adding the analysis of the Germany market, where iOS have a minor market share, and the Operating System (OS) level comparison.
Two objections to this set of research questions being the cause of asymmetrical profitability might arise from two perspectives. First, many might ob-ject that the profit resources of the iPhone include not only the handset but also the iOS Operating System. Although this objection might be rejected because Google charges no OS license fee to An-droid smartphone vendors, but instead the company
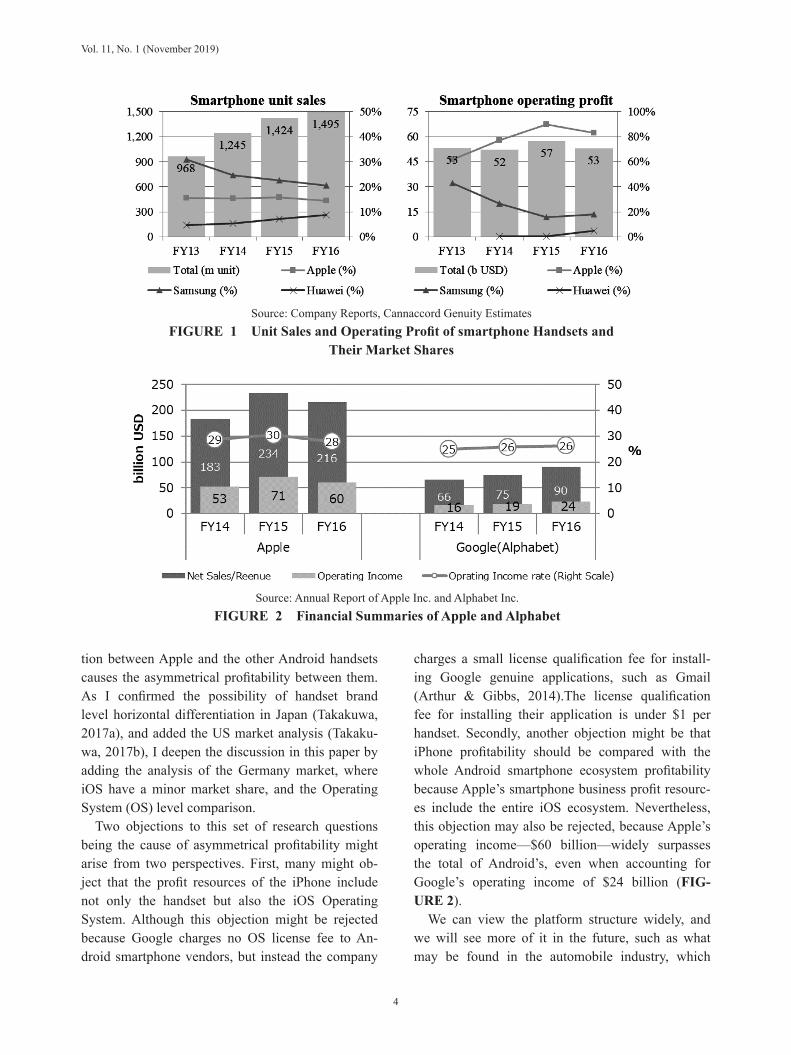
charges a small license qualification fee for install-ing Google genuine applications, such as Gmail (Arthur & Gibbs, 2014).The license qualification fee for installing their application is under $1 per handset. Secondly, another objection might be that iPhone profitability should be compared with the whole Android smartphone ecosystem profitability because Apple’s smartphone business profit resourc-es include the entire iOS ecosystem. Nevertheless, this objection may also be rejected, because Apple’s operating income—$60 billion—widely surpasses the total of Android’s, even when accounting for Google’s operating income of $24 billion (FIG-URE 2).
We can view the platform structure widely, and we will see more of it in the future, such as what may be found in the automobile industry, which
Source: Annual Report of Apple Inc. and Alphabet Inc.FIGURE 2 Financial Summaries of Apple and Alphabet
Source: Company Reports, Cannaccord Genuity EstimatesFIGURE 1 Unit Sales and Operating Profit of smartphone Handsets and
Their Market Shares
5
Multilevel Product Differentiation in The Smartphone Market
would be restructured as the auto-drive-based trans-portation system platform. Thus, empirically inves-tigating the multi-leveled competition mechanism between platforms is a worthwhile effort. In the en-suing section II, I will review the literatures of both product differentiation and competition between platforms to deduce hypotheses pertaining to asym-metrical profitability. In section III, I will summarize methods, both research and analyses. In section IV, I will discuss the result of consumer research analy-ses conducted in Japan, the U.S., and Germany to explore what types of product differentiation exist between the smartphone brands in each country. In section V, I will verify the hypotheses and expand the discussion.
THEORIES AND HYPOTHESES
The smartphone, PC, and video game industries have a multi-sided market or platform structure, which is constituted of three main parts: the platform operator, the supply-side customer, and the demand-side customer (Rochet & Tirole, 2003, 2006). Plat-form operators, such as Apple and Google, operate platforms that enable both sides’ customers to meet and trade with each other. The supply-side custom-ers—i.e., complementors—provide a platform for complementary goods, such as smartphone handsets or its applications. The demand-side customers—i.e., end users—consume both platforms and complements. An increase in complementary goods increases platform utility gains for end users and increasing end users augments the platform value for complementors. We call this phenomenon the indi-rect network effect.
Platform operators could regulate the comple-ments market, to engender severe competition (Ro-chet & Tirole, 2003; Boudreau & Hagiu, 2009). As I already mentioned, the horizontal specialization of a value system caused the shift of profit resources or brand asset resources from product design and manufacturing to the other divisions, such as key modules or the service sectors (Christensen & Raynor, 2003). The indirect network effect causes both positive feedback to the superior platform and negative feedback to inferior ones, so that only one platform tends to dominate the industry, as Katz and
Shapiro (1985) mentioned. Thus, we should review the literatures of (1) the role of platform operators and (2) the winner-take-all-competition between platforms, in addition to the condition of horizontal product differentiation.
The Effect of Regulations for Competition Set by the Platform Operator
Rocket and Tirole (2003) and Boudreau and Ha-giu (2009) mentioned that platform operators have the power to control the competition levels or profit-ability of complementary markets through their three roles: “price regulator,” “licensing authority,” and “competition authority.”
No use exists for end users having their PCs ar-rive without application software. On the other hand, application vendors derive no value if the software market for the PCs has no users. Thus, the platform operator must set an asymmetrical price to one side, to motivate its users to contribute their platform to ignite the market. Sometimes, a platform operator, such as a video game console manufacturer, might allow application development funds for the ap-plication vendors. This is a kind of negative pricing policy for the supply side “price regulator.” In an-other asymmetric pricing case, the audience builder platform, such as Google, charges no search fee to its audience, but it does charge an advertising fee for advertisers.
We can see some complements’ suppliers harming the market by providing low-quality goods to end users, because this undesirable action seems eco-nomically rational to them (Takakuwa, 2012). “Atari shock” is a famous example of this phenomenon (Akagi, 2005). If the platform operators take no ac-tion to this lemon’s problem, the expected utility of the platform will decrease, and end users will leave them. Thus, platform operators regulate the entry of both sides or the trade between both sides, to keep the expected utilities of platform enough amount for both sides. The audit of an application before the market launch by Apple or Google might be the ac-tions of the licensing authority. In another example, Facebook’s policy limiting participation of famous U.S. university students at startup.
In addition, platform operators may end up mo-tivating the low-end market and end-user consum-
6
Vol. 11, No. 1 (November 2019)
ers to use their platform, by encouraging severing competition between the complements’ suppliers, so as to diminish its price. The platform operators could enhance trade between the supply and demand side, by forcing multiple suppliers to compete for the same customer or provide end users with sales ranking information and customer review informa-tion related to complements. Apple’s App Store or Google’s Play Store are examples of this sort of ac-tion, just as “the competition authority.”
Smile Curve Phenomenon about the Resources of Brand Power
The profit resources in a value system will shift from product design and manufacturing to both edges of those along the frontier with commoditi-zation generally. We call this phenomenon as the “smile curve.” This concept was originally stated by Stan Shih, the founder and former CEO of Acer, to explain the profit structure of his company. Baldwin and Clark (2000) revealed that this is widely seen in the computing industry, and Kimura (2003) found that this is not only applicable within the computing and communication industry but in the Japanese au-tomobile industry, too.
Christensen and Raynor (2003) formulated the generation mechanism driving this phenomenon in an “innovators’ dilemma.” Those final goods manu-facturers, which develop the unique architecture to expand the boundaries of quality, receive enough profit in the early stages of their industry-level prod-uct lifecycle. The quality and features enhancing competition between those companies with the origi-nal product architecture leads to the smile curve phe-nomenon. Such modular architectures spread within the low-end market because firms tend to outsource superficially low-profitable processes to expand their market, such as IBM outsourcing the operating sys-tem to Microsoft. This led to the restructuring of the industry from featuring vertical integration to show-casing horizontal specialization. The resource of brand power moved to the key module, such as In-tel’s MPU, which defined the final good’s quality, or to the service sector, such as the SPA (specialty store retailer of private label apparel), which resolved the customers’ problems.
The Condition of the Winner-take-all-competi-tion Mechanism to Work
Katz and Shapiro (1992) illustrated “Ui,” the utility of network goods “i,” as Equation (1). “Xi” indicates the core product’s utility, and αNi indicates the complementary product’s utility, while “Ni” indi-cates the variety of complements or the size of end users. “α” indicates one unit of expected utility of complementary goods or one person’s expected util-ity of end users.
i i iU X αN= + (1)
We call the utility derived from complements “indirect network effects” and that from end us-ers “direct network effects.” These network effects create a positive feedback loop on the top platform ecosystem in the network effect operations and gen-erate a negative feedback loop on the lower platform ecosystem. As a result of those feedback loops, the winner takes the entire market share. Eisenmann, Parker, and Alstyne (2006) considered the effective condition of this winner-take-all-competition mecha-nism from two angles, as the platform operator and as the customer, from both sides.
Regarding the standpoint of platform operators, establishing the designated platform provides eco-nomic rationality only when the three conditions are applicable. First, they should have a sufficient rela-tionship with affluent potential customers. Second, customers on both sides should have confidence in the triumph of the platform. Third, the platform op-erator should have enough funds.
Regarding the viewpoints of each kind of custom-er, selecting one specific platform has an economic rationality when the three criteria are applicable. First, multi-homing costs should be high enough, at least for one side of the two customer types. Second, the network effect should be large enough, at least for customers with high-multi-homing costs. Third, both sides’ markets should be homogeneous without either customer having some special preference.
In addition, Rochet and Tirole (2006) mentioned that demand-side customers’ tendencies for multi-homing enhances the supply-side customers’ ten-dencies for single homing. Sun and Tse (2007) also stated that with customers on both sides, the multi homing tendency helps multiple platforms survive.
7
Multilevel Product Differentiation in The Smartphone Market
The Market Condition of Horizontal Product Dif-ferentiation
Vertical differentiation is based on the quality dimensions that provide the same positive utility to all consumers. Horizontal differentiation is based on the quality dimensions that provide positive utility to one consumer segment, while providing negative utility to another. Whole manufactures could devel-op high-end handsets by assembling the technologi-cally advanced modules which can be accessed by any manufacturer under the horizontally specialized industry like the smartphone market. Thus, vertical differentiation by handset specifications leads the intensive price competition, whereas horizontal dif-ferentiation softens price competition among brands.
If “the principle of minimal product differen-tiation,” which Hotelling (1929) stated, was taken into effect, manufacturers would find it difficult to horizontally differentiate their products from other brands. Hotelling (1929) argued that two suppliers tend to gravitate to the center of a line-segment-type market with homogeneous consumers residing in equal density. However, the prominent IT analyst Mossberg (2014) mentioned one condition each, similar to the condition where “the principle of mini-mal product differentiation” breaks, for both Apple and Google to continue succeeding as platform op-erators.
Mossberg (2014) stated that Apple still held enough market shares in the premium segment be-cause application vendors support iOS, despite its relatively small market share. Application vendors tend to launch iOS versions first because unfrag-mented iOS enables application vendors to develop software more easily and because iOS users pay more for both initial purchasing and in-app purchas-ing.
The argument of d’Aspremont, Gabszewicz, and Thisse (1979) agrees with this situation. They inten-sively investigated Hotteling’s law to unveil that his model could not reach a Nash equilibrium. Addition-ally, they expanded Hotteling’s model by introduc-ing the distance square transportation cost instead of the distance linear transportation cost. A Nash equilibrium occurs at any price within their model. Companies tend to set their position to both edges of the line segment to maximize their revenues.
The distance square transportation cost means that the total cost for customers increases rapidly if they live far from their companies’ locations. Thus, both companies could earn more revenue by raising the product price, even if they lost some of their custom-ers who live near the center of both companies’ posi-tions, by moving to both ends of the market. This is similar to the condition stated by Mossberg; the cost for optimizing application tends to surge because of both fragmented OS versions and a wide variety of handsets.
Furthermore, Mossberg (2014) pointed out that the subsequent success of Google needs continued support for Google licensed Android by Android device manufacturers. Currently, many Android device manufacturers, including Samsung, are suffering low profitability. Open source Android handset, such as Amazon’s tablet PC or the Xiaomi smartphone, are gaining some sort of market share in the low-end market. The manufacturing cost of the products which fully utilize the capability of the latest OS surges along with the improvement of the OS. Hence, Google was struggling with the Android One program before, and Android Go2 program now which they intend to provide the handset manufac-turers with the official version of Android suitable for low-end products.
We could interpret that Google developed such a policy under the horizontal differentiation condition presented by Economides (1984). They expanded Hotteling’s model by introducing “the reservation price” concept where customers stop purchasing the goods. On the one hand, if the reservation price is low enough, companies’ motivation to move to the center of the market will be depressed. Mov-ing to center of a market generates a losing market for both edges, for companies in this model. On the other hand, leaving the market center leaves a mo-nopolized market segment for both companies. It is thought that the existence of consumers with such low reserve prices motivates Google to sustain hand-set diversifying policies to maintain Android’s share in the low-end market. There’s no need for surging cost.
2 https://www.android.com/versions/go-edition/
8
Vol. 11, No. 1 (November 2019)
Deducing and Inducting Hypotheses for Asym-metrical Profitability Compared with Sales
I confirmed two exemptions of Hotelling’s law at the beginning of the literature review. According to the model used by d’Aspremont, Gabszewicz, and Thisee (1979), if transportation costs surge as a squared distance, horizontal product differentiation becomes a rational decision for companies. We can recognize the company’s geographic location as the company’s market position with tradeoffs, such as software application versus hardware in quality and variety. This contrasts with one condition of the win-ner-take-all-competition that Eisenmann, Parker, and Alstyne (2006) discovered; wherein no consumer has special needs.
Apple announced that iOS 12, the newest version, supports the iPhone 5S launched in 2013.3 On the one hand, this fact means those who own older mod-els of iOS can use almost all of the brand-new ap-plications in the App Store. On the other hand, many old Android model users cannot use such high-quality applications that support the newest features of the Android OS, because 57% of Android handset OSs are older than the marshmallow released in 2015.4 The wide variety of Android handsets cause its OS fragmentation and delays in updates. Hence, we deduce the first hypothesis that the tradeoff of consumer preferences between applications and handsets regarding quality and variety makes hori-zontal differentiation of companies rational.
Hypothesis 1. Differentiation between smartphone OSs is realized on the conflicting axis of purchase criteria that occurs between having hardware di-versity and obtaining better application quality or diversity.
The existence of consumers with low-reservation prices is yet another exception to Hotelling’s law, as confirmed earlier. To expand the use for advertisers, Google must attract a massive number of consum-ers into its Android ecosystem, because their major revenue source is the advertisement media business. Advertisement might have a negative network effect
on consumers (Evans, 2009). Thus, Google must keep new entry barriers low, to keep handset prices low. In fact, Google licensed the Android OS for free as a price regulator, and they released the low-end product version Android to the fragmented handset market, intending to keep the open source Android market share lower as a competition authority. Thus, we deduce the second hypothesis that the exis-tence of low-reservation-price consumers motivates Google to promote vertical differentiation among Android handsets, which in turn enables horizontal differentiation among OSs.
Hypothesis 2. The existence of consumers with low-reservation prices in the Android handset market, motivate Google to sustain handset di-versifying policies which expand the possibility of horizontal product differentiation.
As stated by Gasmi, Laffont, and Voung (1992), the existence of low-reservation price consumers might enable the horizontal differentiation among Android devices. However, because both profit re-sources and source of brand assets are shifted from product design and manufacturing to other sections under a horizontally specialized industry as stated by Christensen and Raynor (2003), there is little room for handset manufacturers to differentiate their prod-ucts horizontally. On the one hand, even Samsung or Sony, which make core modules, such as MPU or CMOS, could only vertically differentiate from each other by the MPU specifications, memory size, cam-era features, etc. On the other hand, Apple can use consumer content experience to build brand assets, because they operate the Apple Store or Apple Shop, the in-store version of Apple Store, and integrate complimentary content stores such as the iTunes Store, App Store, iBook Store into its OS. In addi-tion, they are designing the core modules, such as MPU, GPU, and the machine learning engine chips. Hence, a third hypothesis may be deduced that only Apple can build a brand asset by integrating both edges of the value system in this horizontally spe-cialized industry.
Hypothesis 3 Only Apple, which integrates both ends of its value chain vertically, realizes horizon-
3 https://www.apple.com/jp/ios/ios-12-preview/4 https://developer. Android.com/ about/ dashboards/
9
Multilevel Product Differentiation in The Smartphone Market
tal differentiation by brand power.
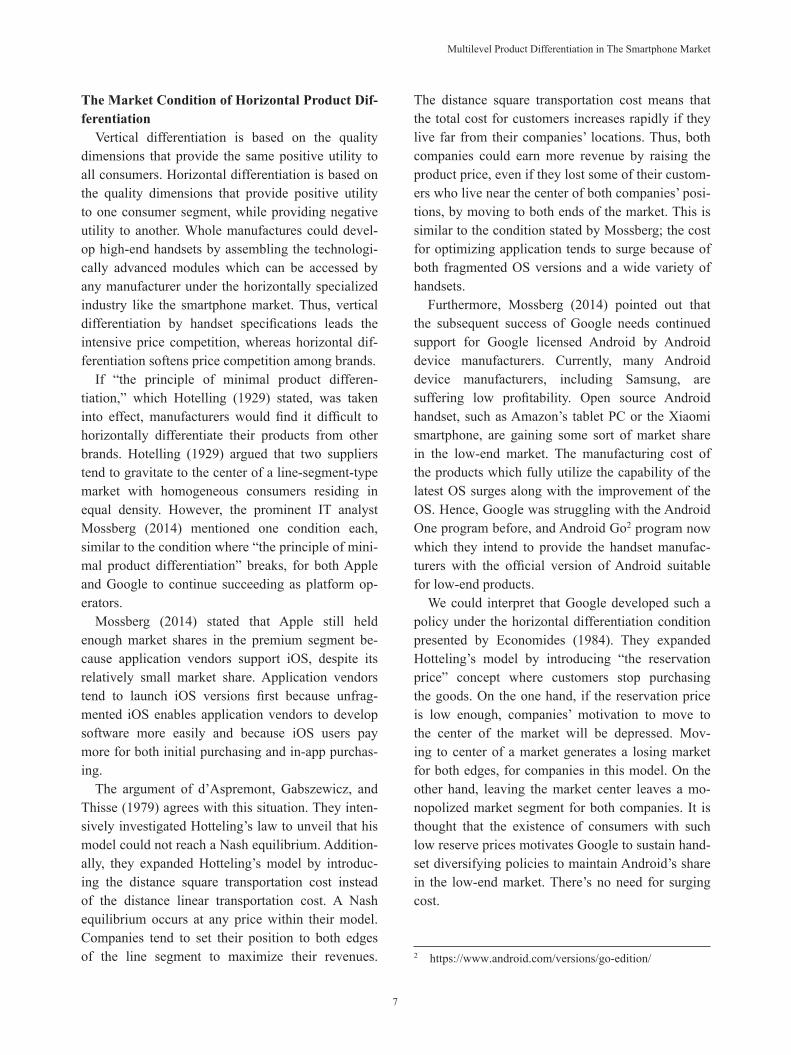
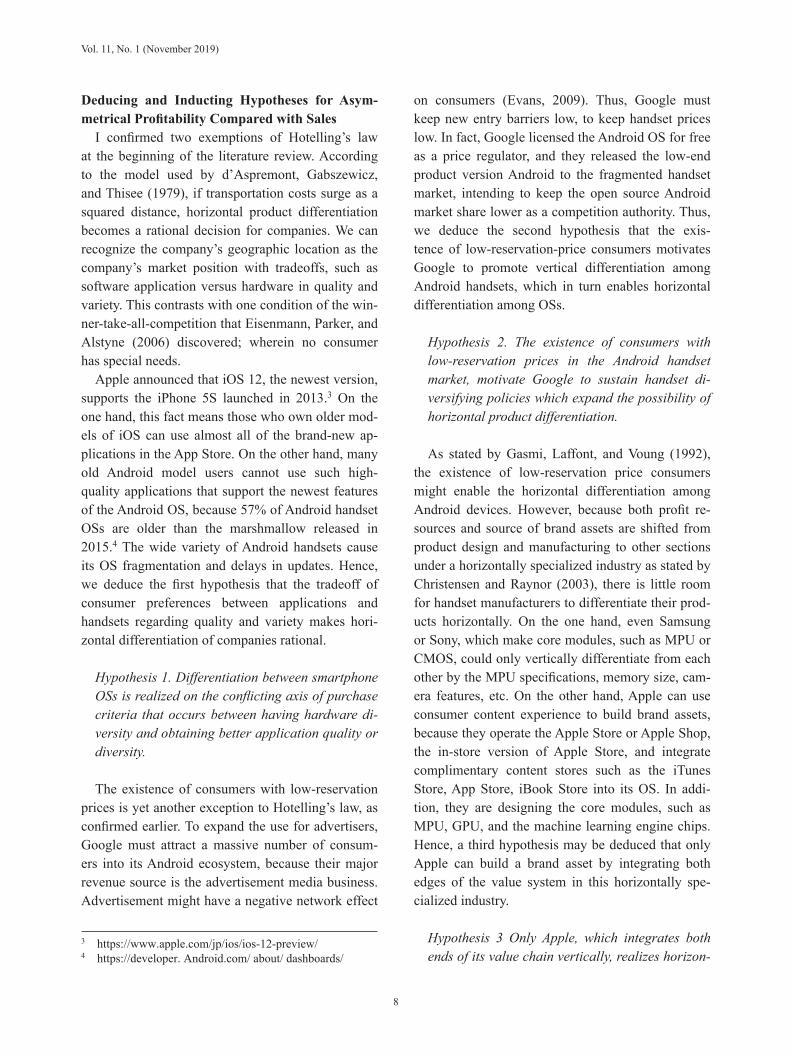
We must confirm the supply side condition of a winner-take-all competition which has yet to be mentioned. The sales share of iPhone has hovered around 15%, as I explained in the first section. Nevertheless, they hold a larger portion of market share in selected countries, such as Japan, the U.S., the U.K., and Australia (FIGURE 3). The total revenue of Apple’s App Store is larger than that of the Google Play Store (FIGURE 4).5 And operating profit of Apple is larger than the sum of Google and Android handset sales. These facts make rational sense not only for Google’s platform development but also for Apple to develop one of their own.
METHODOLOGY
We have to evaluate the influence of the network effect on both handsets and applications, the brand power, and the consumer reservation price in select-ing a handset, to test the three hypotheses. I sum-marize the methodologies of both Internet consumer surveys, conducted in three countries—Japan (JP), the United States (U.S.) and Germany (DE)—and the ensuing analysis.
Outline of the SurveyI took both competitive structures of the Multi-
Sided Platforms (hereinafter referred to as MSPs) and the sorts of network effects into consideration to develop the variables of smartphone utilities.
Platform competition consists of three levels. First, there is competition between platform opera-
Source: KANTER World PanelsFIGURE 3 Smartphone OS Sales Share in Q4 of 2016 and 2017
Source: App Annie ForecastFIGURE 4 Downloads and Revenue of App Markets
5 https://www.appannie.com/en/insights/market-data/app-annie-2017-2022-forecast/
10
Vol. 11, No. 1 (November 2019)
tors which is seen in the video game industry (Ev-ans, Hagiu, & Schemalensee, 2005, 2006). Second, there is competition between platform operators and complements’ suppliers, such as the prior competi-tion between Microsoft and Netscape Communica-tions or Real Networks (Nalebuff, 2004). Finally, there is competition between complements’ suppli-ers, such as that between smartphone manufacturers and application vendors (Boudreau & Hagiu, 2009; Markovich & Moenius, 2009). I introduced the com-petition of the first and third levels into the model.
Matsumura, Kurimoto, and Kobayashi (2000) insisted that not only the variety of complementary goods but also the quality of those goods, such as the existence of killer applications, have much influ-ence on platform goods sales regarding the video game industry. Evans, Hagiu and Schemalensee (2005; 2006) also insisted on the importance of killer applications for success, in which a large por-tion of demand-side users would purchase. Thus, we should introduce both the perceived variety and the quality of complementary goods into the model.
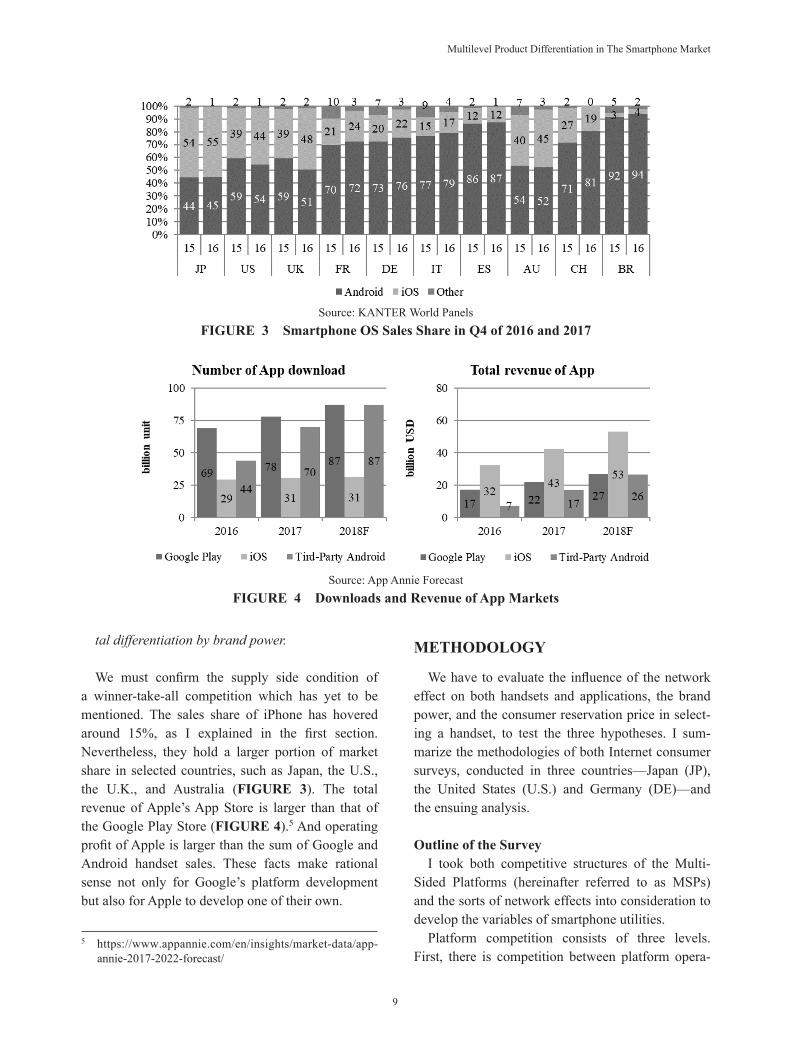
TABLE 1 shows the questionnaire items, which were introduced into the multi-leveled competition concept, along with the two types of network effects. The respondents were asked about their current and most-used handset brand, their least-used handset brand, their next top candidate handset brand to be purchased, their satisfaction level with their cur-rent or most-used brands, the rank ordering of their
purchase criteria, and their comparison of platforms given five quality dimensions.
The survey was conducted through the Internet in the United States (the U.S.), Japan (JP) and Ger-many (DE). I selected the U.S. and JP to represent the market where the iPhone had the largest market share and DE to represent the market where the iPhone had only a minor market share. I collected data from 990 respondents in Japan during Octo-ber 2015, from 600 respondents in the U.S. during March 2017, and from DE during September 2017. The respondents were sampled in equal quotas by gender and 15 age-range groups. Only iOS and An-droid handset users were used for this analysis. The sample size was 663 in JP, 550 in the U.S., and 588 in DE.
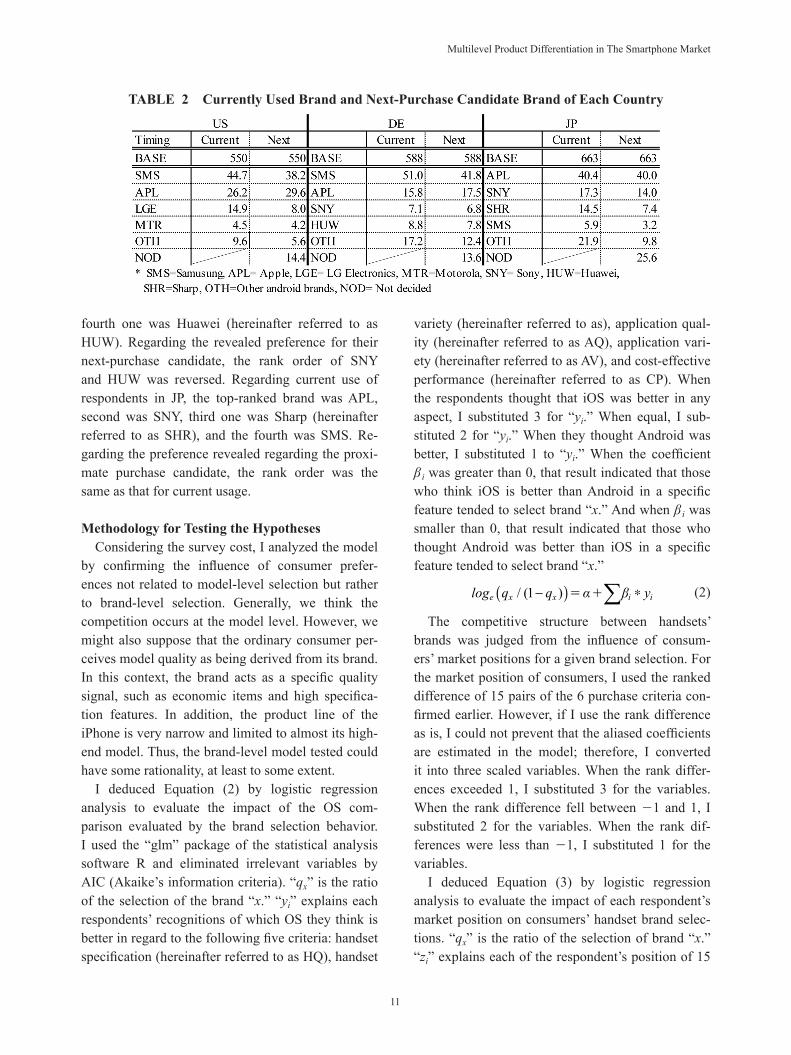
We will confirm the respondents’ preferences for a brand regarding their current choice and their next planned purchase (TABLE 2). Regarding the U.S. current usage rate of respondents, the top-ranked brand was Samsung (hereinafter referred to as SMS), second was Apple (hereinafter referred to as APL), third was LG Electronics (hereinafter referred to as LGE), and the fourth was Motorola (hereinafter referred to as MTR). Regarding the next handset to be purchased by candidates, the rank order was the same as the current usage ranking. In DE, the current usage rate noted by respondents was as follows: the top-ranked brand was SMS, second was APL, third was Sony (hereinafter referred to as SNY), and the
TABLE 1 Outline of Questionnaire
11
Multilevel Product Differentiation in The Smartphone Market
fourth one was Huawei (hereinafter referred to as HUW). Regarding the revealed preference for their next-purchase candidate, the rank order of SNY and HUW was reversed. Regarding current use of respondents in JP, the top-ranked brand was APL, second was SNY, third one was Sharp (hereinafter referred to as SHR), and the fourth was SMS. Re-garding the preference revealed regarding the proxi-mate purchase candidate, the rank order was the same as that for current usage.
Methodology for Testing the HypothesesConsidering the survey cost, I analyzed the model
by confirming the influence of consumer prefer-ences not related to model-level selection but rather to brand-level selection. Generally, we think the competition occurs at the model level. However, we might also suppose that the ordinary consumer per-ceives model quality as being derived from its brand. In this context, the brand acts as a specific quality signal, such as economic items and high specifica-tion features. In addition, the product line of the iPhone is very narrow and limited to almost its high-end model. Thus, the brand-level model tested could have some rationality, at least to some extent.
I deduced Equation (2) by logistic regression analysis to evaluate the impact of the OS com-parison evaluated by the brand selection behavior. I used the “glm” package of the statistical analysis software R and eliminated irrelevant variables by AIC (Akaike’s information criteria). “qx” is the ratio of the selection of the brand “x.” “yi” explains each respondents’ recognitions of which OS they think is better in regard to the following five criteria: handset specification (hereinafter referred to as HQ), handset
variety (hereinafter referred to as), application qual-ity (hereinafter referred to as AQ), application vari-ety (hereinafter referred to as AV), and cost-effective performance (hereinafter referred to as CP). When the respondents thought that iOS was better in any aspect, I substituted 3 for “yi.” When equal, I sub-stituted 2 for “yi.” When they thought Android was better, I substituted 1 to “yi.” When the coefficient β i was greater than 0, that result indicated that those who think iOS is better than Android in a specific feature tended to select brand “x.” And when β i was smaller than 0, that result indicated that those who thought Android was better than iOS in a specific feature tended to select brand “x.”
( )/ (1 )− ∗e x x i ilog q q α β y= + (2)
The competitive structure between handsets’ brands was judged from the influence of consum-ers’ market positions for a given brand selection. For the market position of consumers, I used the ranked difference of 15 pairs of the 6 purchase criteria con-firmed earlier. However, if I use the rank difference as is, I could not prevent that the aliased coefficients are estimated in the model; therefore, I converted it into three scaled variables. When the rank differ-ences exceeded 1, I substituted 3 for the variables. When the rank difference fell between −1 and 1, I substituted 2 for the variables. When the rank dif-ferences were less than −1, I substituted 1 for the variables.
I deduced Equation (3) by logistic regression analysis to evaluate the impact of each respondent’s market position on consumers’ handset brand selec-tions. “qx” is the ratio of the selection of brand “x.” “zi” explains each of the respondent’s position of 15
TABLE 2 Currently Used Brand and Next-Purchase Candidate Brand of Each Country
12
Vol. 11, No. 1 (November 2019)
horizontal markets, and “γi” indicates the impact of the respondents’ market positions in light of their brand selection behavior. If “γ i” is greater than 0, the greater “zi” means that a resulting larger ratio of se-lecting brand “x” will appear. If “γ i” is smaller than 0, the resulting larger “zi” value means that there will be fewer consumers, as indicated by the smaller ratio of selecting brand “x.”
( )/ (1 )− ∗e x x i ilog q q α γ z= + (3)
We have to consider the effect of usage experi-ence on purchase criteria cognition for analysis. I asked to survey respondents with purchase criteria of last purchase of the handset. However, a longer handset usage experience has a stronger impact on the current cognition of the last purchase criteria. Moreover, this paper’s purpose is to clarify the long-term condition which brings asymmetrical profit-ability among handset brands. Thus, I paid attention to the consumer’s position of the purchase criteria comparison which is relevant for both last purchased brand and next purchase candidate.
RESULTS OF THE ANALYSIS
Regarding each market—the U.S., DE, and JP—the impact of brand selection on both consumer OS comparative evaluations and consumer positions in the horizontal market of purchase criteria pairings
are summarized in TABLE 3 through 5. We will confirm the independent variables of each equation that has an influence on the brand selection of both currently used brands and next-purchase candidates.
Background Market Structures Pertaining to Consumers’ Brand Selections in the U.S.
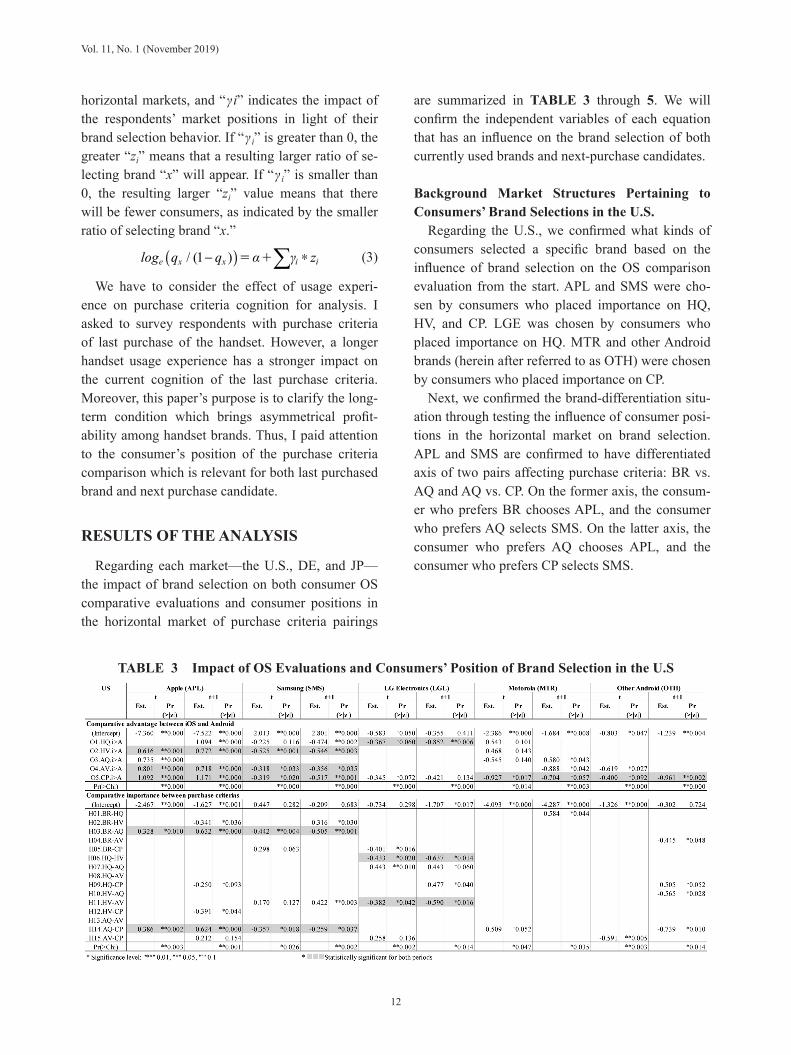
Regarding the U.S., we confirmed what kinds of consumers selected a specific brand based on the influence of brand selection on the OS comparison evaluation from the start. APL and SMS were cho-sen by consumers who placed importance on HQ, HV, and CP. LGE was chosen by consumers who placed importance on HQ. MTR and other Android brands (herein after referred to as OTH) were chosen by consumers who placed importance on CP.
Next, we confirmed the brand-differentiation situ-ation through testing the influence of consumer posi-tions in the horizontal market on brand selection. APL and SMS are confirmed to have differentiated axis of two pairs affecting purchase criteria: BR vs. AQ and AQ vs. CP. On the former axis, the consum-er who prefers BR chooses APL, and the consumer who prefers AQ selects SMS. On the latter axis, the consumer who prefers AQ chooses APL, and the consumer who prefers CP selects SMS.
TABLE 3 Impact of OS Evaluations and Consumers’ Position of Brand Selection in the U.S
13
Multilevel Product Differentiation in The Smartphone Market
Background Market Structures of Consumers’ Brand Selection in DE
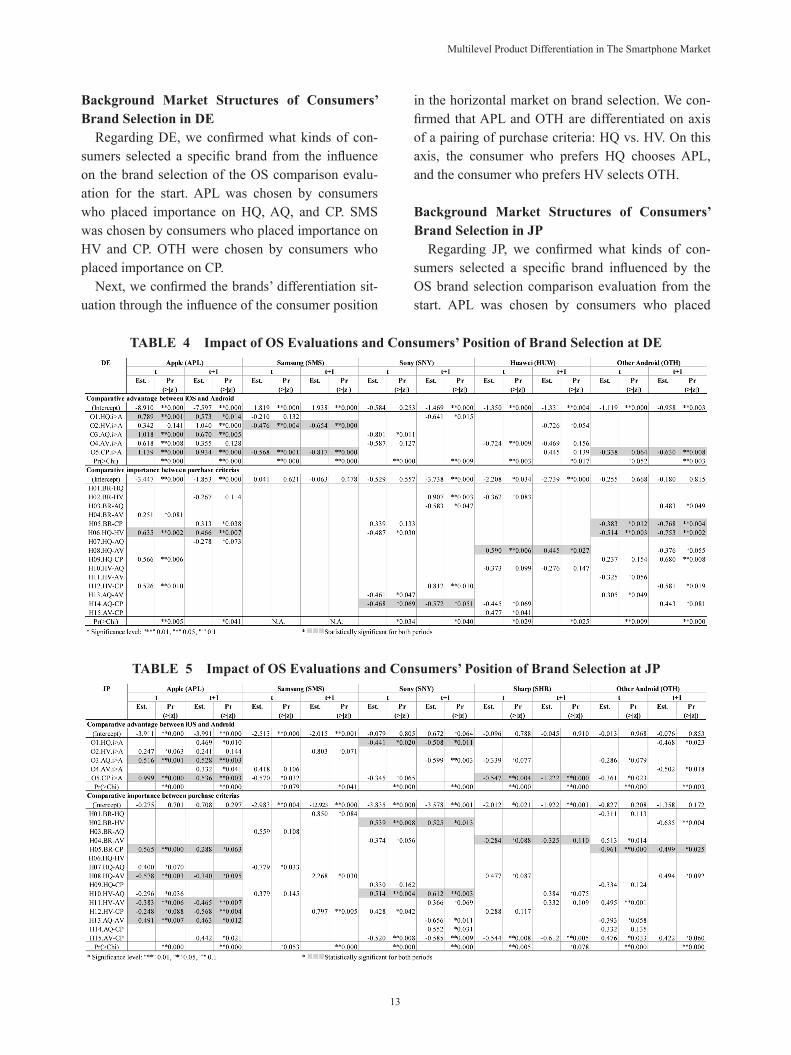
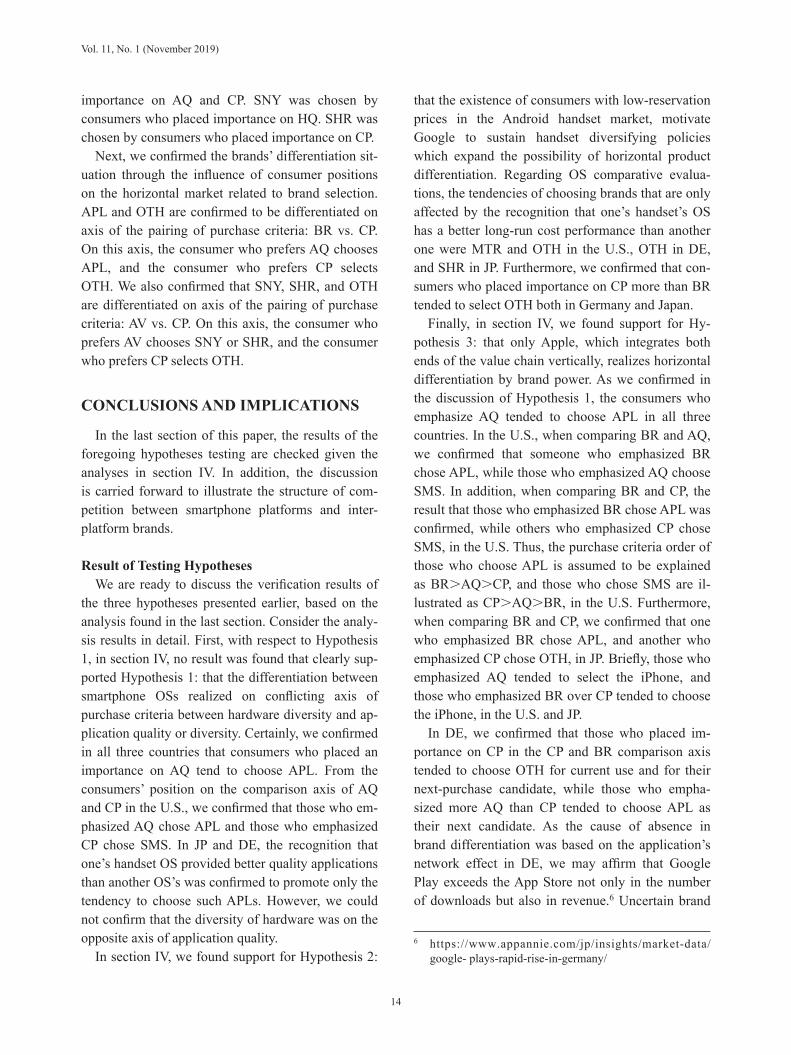
Regarding DE, we confirmed what kinds of con-sumers selected a specific brand from the influence on the brand selection of the OS comparison evalu-ation for the start. APL was chosen by consumers who placed importance on HQ, AQ, and CP. SMS was chosen by consumers who placed importance on HV and CP. OTH were chosen by consumers who placed importance on CP.
Next, we confirmed the brands’ differentiation sit-uation through the influence of the consumer position
in the horizontal market on brand selection. We con-firmed that APL and OTH are differentiated on axis of a pairing of purchase criteria: HQ vs. HV. On this axis, the consumer who prefers HQ chooses APL, and the consumer who prefers HV selects OTH.
Background Market Structures of Consumers’ Brand Selection in JP
Regarding JP, we confirmed what kinds of con-sumers selected a specific brand influenced by the OS brand selection comparison evaluation from the start. APL was chosen by consumers who placed
TABLE 4 Impact of OS Evaluations and Consumers’ Position of Brand Selection at DE
TABLE 5 Impact of OS Evaluations and Consumers’ Position of Brand Selection at JP
14
Vol. 11, No. 1 (November 2019)
importance on AQ and CP. SNY was chosen by consumers who placed importance on HQ. SHR was chosen by consumers who placed importance on CP.
Next, we confirmed the brands’ differentiation sit-uation through the influence of consumer positions on the horizontal market related to brand selection. APL and OTH are confirmed to be differentiated on axis of the pairing of purchase criteria: BR vs. CP. On this axis, the consumer who prefers AQ chooses APL, and the consumer who prefers CP selects OTH. We also confirmed that SNY, SHR, and OTH are differentiated on axis of the pairing of purchase criteria: AV vs. CP. On this axis, the consumer who prefers AV chooses SNY or SHR, and the consumer who prefers CP selects OTH.
CONCLUSIONS AND IMPLICATIONS
In the last section of this paper, the results of the foregoing hypotheses testing are checked given the analyses in section IV. In addition, the discussion is carried forward to illustrate the structure of com-petition between smartphone platforms and inter-platform brands.
Result of Testing HypothesesWe are ready to discuss the verification results of
the three hypotheses presented earlier, based on the analysis found in the last section. Consider the analy-sis results in detail. First, with respect to Hypothesis 1, in section IV, no result was found that clearly sup-ported Hypothesis 1: that the differentiation between smartphone OSs realized on conflicting axis of purchase criteria between hardware diversity and ap-plication quality or diversity. Certainly, we confirmed in all three countries that consumers who placed an importance on AQ tend to choose APL. From the consumers’ position on the comparison axis of AQ and CP in the U.S., we confirmed that those who em-phasized AQ chose APL and those who emphasized CP chose SMS. In JP and DE, the recognition that one’s handset OS provided better quality applications than another OS’s was confirmed to promote only the tendency to choose such APLs. However, we could not confirm that the diversity of hardware was on the opposite axis of application quality.
In section IV, we found support for Hypothesis 2:
that the existence of consumers with low-reservation prices in the Android handset market, motivate Google to sustain handset diversifying policies which expand the possibility of horizontal product differentiation. Regarding OS comparative evalua-tions, the tendencies of choosing brands that are only affected by the recognition that one’s handset’s OS has a better long-run cost performance than another one were MTR and OTH in the U.S., OTH in DE, and SHR in JP. Furthermore, we confirmed that con-sumers who placed importance on CP more than BR tended to select OTH both in Germany and Japan.
Finally, in section IV, we found support for Hy-pothesis 3: that only Apple, which integrates both ends of the value chain vertically, realizes horizontal differentiation by brand power. As we confirmed in the discussion of Hypothesis 1, the consumers who emphasize AQ tended to choose APL in all three countries. In the U.S., when comparing BR and AQ, we confirmed that someone who emphasized BR chose APL, while those who emphasized AQ choose SMS. In addition, when comparing BR and CP, the result that those who emphasized BR chose APL was confirmed, while others who emphasized CP chose SMS, in the U.S. Thus, the purchase criteria order of those who choose APL is assumed to be explained as BR>AQ>CP, and those who chose SMS are il-lustrated as CP>AQ>BR, in the U.S. Furthermore, when comparing BR and CP, we confirmed that one who emphasized BR chose APL, and another who emphasized CP chose OTH, in JP. Briefly, those who emphasized AQ tended to select the iPhone, and those who emphasized BR over CP tended to choose the iPhone, in the U.S. and JP.
In DE, we confirmed that those who placed im-portance on CP in the CP and BR comparison axis tended to choose OTH for current use and for their next-purchase candidate, while those who empha-sized more AQ than CP tended to choose APL as their next candidate. As the cause of absence in brand differentiation was based on the application’s network effect in DE, we may affirm that Google Play exceeds the App Store not only in the number of downloads but also in revenue.6 Uncertain brand
6 https://www.appannie.com/jp/insights/market-data/google- plays-rapid-rise-in-germany/
15
Multilevel Product Differentiation in The Smartphone Market
differentiation of Apple in DE was caused by the relatively smaller gap between the application’s network effect on both OSs, compared to what was seen in the U.S. or JP. In DE, the network effect of the Android application surpassed that of iOS, and it seems that the brand differentiation room based on the application’s network effect has disappeared.
The following two points were confirmed as the hypotheses’ verification results. First, we confirmed that brand power based on an application’s network effect enabled differentiation between the OSs in the U.S. and Japan, where the App Store greatly exceeds Google Play in terms of revenue. Second, we con-firmed that the existence of low-reservation-price consumers enabled the differentiation discovered between Android handset brands.
The Cause of Declining Profitability among An-droid Handset Manufacturers
We confirmed how differentiation between and within platforms is realized in each country from the verification results of the hypotheses.
First, we confirmed the differentiation back-
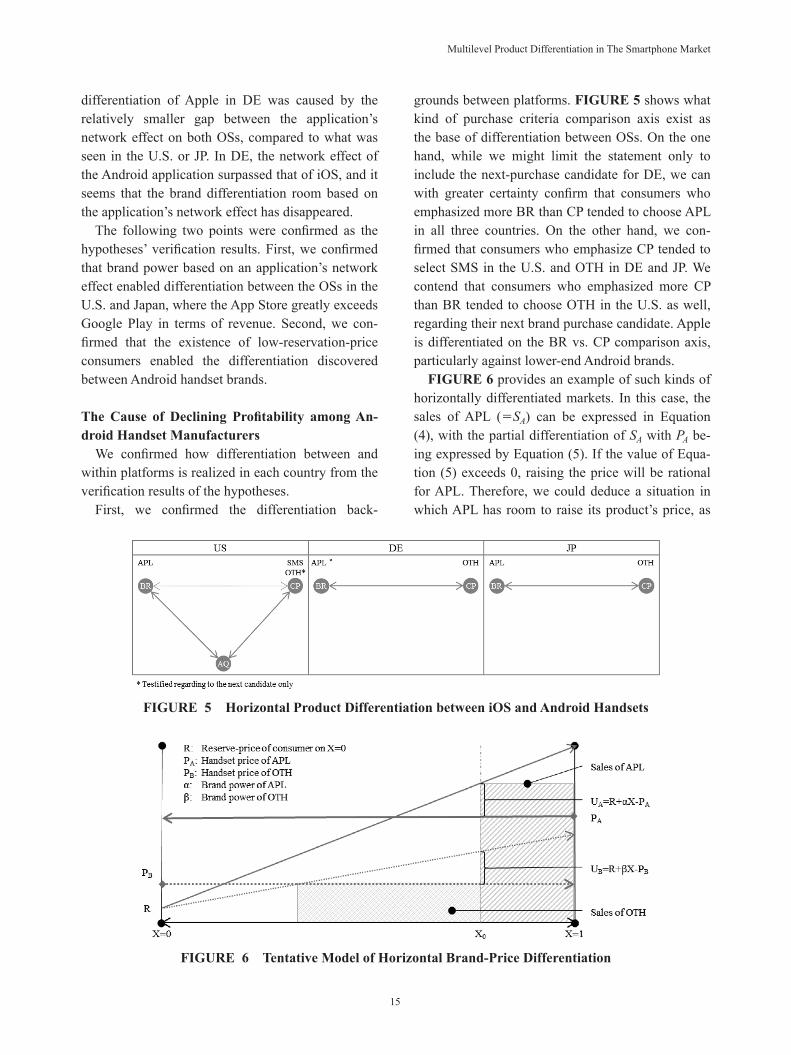
grounds between platforms. FIGURE 5 shows what kind of purchase criteria comparison axis exist as the base of differentiation between OSs. On the one hand, while we might limit the statement only to include the next-purchase candidate for DE, we can with greater certainty confirm that consumers who emphasized more BR than CP tended to choose APL in all three countries. On the other hand, we con-firmed that consumers who emphasize CP tended to select SMS in the U.S. and OTH in DE and JP. We contend that consumers who emphasized more CP than BR tended to choose OTH in the U.S. as well, regarding their next brand purchase candidate. Apple is differentiated on the BR vs. CP comparison axis, particularly against lower-end Android brands.
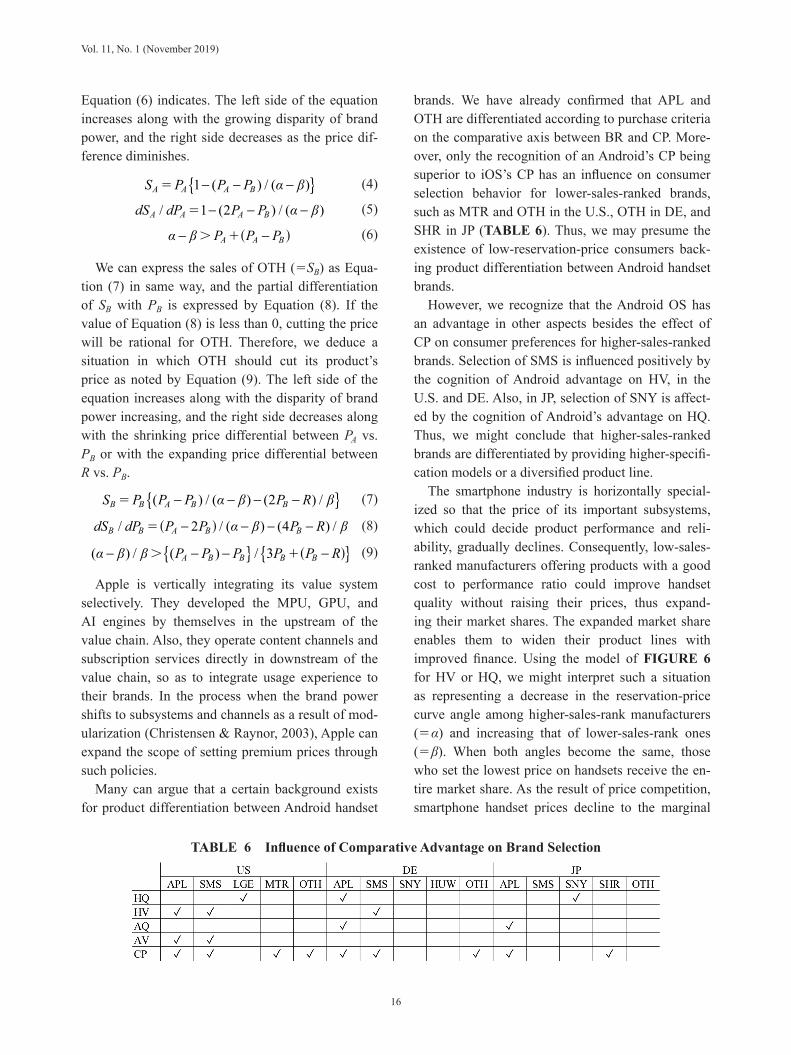
FIGURE 6 provides an example of such kinds of horizontally differentiated markets. In this case, the sales of APL (=SA) can be expressed in Equation (4), with the partial differentiation of SA with PA be-ing expressed by Equation (5). If the value of Equa-tion (5) exceeds 0, raising the price will be rational for APL. Therefore, we could deduce a situation in which APL has room to raise its product’s price, as
FIGURE 5 Horizontal Product Differentiation between iOS and Android Handsets
FIGURE 6 Tentative Model of Horizontal Brand-Price Differentiation
16
Vol. 11, No. 1 (November 2019)
Equation (6) indicates. The left side of the equation increases along with the growing disparity of brand power, and the right side decreases as the price dif-ference diminishes.
{ }1 ( ) / ( )− − −A A A BS P P P α β= (4)
/ 1 (2 ) / ( )− − −A A A BdS dP P P α β= (5)
− −A A Bα β P P P> +( ) (6)
We can express the sales of OTH (=SB) as Equa-tion (7) in same way, and the partial differentiation of SB with PB is expressed by Equation (8). If the value of Equation (8) is less than 0, cutting the price will be rational for OTH. Therefore, we deduce a situation in which OTH should cut its product’s price as noted by Equation (9). The left side of the equation increases along with the disparity of brand power increasing, and the right side decreases along with the shrinking price differential between PA vs. PB or with the expanding price differential between R vs. PB.
{ }( ) / ( ) (2 ) /− − − −B B A B BS P P P α β P R β= (7)
/ 2 / ( ) (4 ) /− − − −B B A B BdS dP P P α β P R β=( ) (8)
{ } { }( ) / ( ) / 3− − − −A B B B Bα β β P P P P P R> +( ) (9)
Apple is vertically integrating its value system selectively. They developed the MPU, GPU, and AI engines by themselves in the upstream of the value chain. Also, they operate content channels and subscription services directly in downstream of the value chain, so as to integrate usage experience to their brands. In the process when the brand power shifts to subsystems and channels as a result of mod-ularization (Christensen & Raynor, 2003), Apple can expand the scope of setting premium prices through such policies.
Many can argue that a certain background exists for product differentiation between Android handset
brands. We have already confirmed that APL and OTH are differentiated according to purchase criteria on the comparative axis between BR and CP. More-over, only the recognition of an Android’s CP being superior to iOS’s CP has an influence on consumer selection behavior for lower-sales-ranked brands, such as MTR and OTH in the U.S., OTH in DE, and SHR in JP (TABLE 6). Thus, we may presume the existence of low-reservation-price consumers back-ing product differentiation between Android handset brands.
However, we recognize that the Android OS has an advantage in other aspects besides the effect of CP on consumer preferences for higher-sales-ranked brands. Selection of SMS is influenced positively by the cognition of Android advantage on HV, in the U.S. and DE. Also, in JP, selection of SNY is affect-ed by the cognition of Android’s advantage on HQ. Thus, we might conclude that higher-sales-ranked brands are differentiated by providing higher-specifi-cation models or a diversified product line.
The smartphone industry is horizontally special-ized so that the price of its important subsystems, which could decide product performance and reli-ability, gradually declines. Consequently, low-sales-ranked manufacturers offering products with a good cost to performance ratio could improve handset quality without raising their prices, thus expand-ing their market shares. The expanded market share enables them to widen their product lines with improved finance. Using the model of FIGURE 6 for HV or HQ, we might interpret such a situation as representing a decrease in the reservation-price curve angle among higher-sales-rank manufacturers (=α) and increasing that of lower-sales-rank ones (=β). When both angles become the same, those who set the lowest price on handsets receive the en-tire market share. As the result of price competition, smartphone handset prices decline to the marginal
TABLE 6 Influence of Comparative Advantage on Brand Selection
17
Multilevel Product Differentiation in The Smartphone Market
production cost. Thus, the profitability of Android handset manufacturers deteriorates accordingly.
Limitations and Prospects for Future ResearchIn this paper, I have attempted to verify empiri-
cally that inter-platform competition is horizontal, and inner-platform competition is vertical, in the smartphone industry. Competition in the smartphone market is played out on three levels: competition be-tween OSs, competition between brands, and com-petition between handsets. I ignored the handset’s level of competition in this paper because of budget constraints. As a result of this finding, I could not find any influence of the consumer’s position on the selection of Samsung in DE. With a broad product line, Samsung holds a large portion of the smart-phone market in DE, preventing the brand-level analysis from working well. Hence, I should carry out a more detailed analysis by dividing Samsung users in terms of each chosen product’s price, etc. Moreover, I might have to update the survey because the JP data is relatively old. Horizontal product differentiation is realized in the e-commerce area between Amazon, “Yahoo auction and shopping,” and the “Rakuten market and Rakuma.” I should generalize this research by investigating these areas further.
REFERENCES
Arthur, C. & Gibbs, S. (2014). How Google Con-trols Android’s Open-Source Software. Re-trieved from https://www.businessinsider.com/how-google-controls-androids-open-source-software-2014-1.
Akagi, M. (2005). Sore wa “pon” kara hajimatta: Ākēdo TV gēmu no naritachi [It started from “pon”: The origins of arcade games]. Kobe, Japan: Amusement Tsushin-Sha.
Baldwin, C. Y. & Clark, K. B. (2000). Design Rules: The Power of Modularity. Academy of Manage-ment Review, 26(1).
Boudreau, K. & Hagiu, A. (2009). Platform rules: Multi-sided platforms as regulators. In A. Gaw-er (Ed.). Platforms, Markets, and Innovations. Cheltenham, UK: Edward Elgar.
Christensen, C., Raynor, M., & Verlinden, M.
(2001). Skate to where the money will be. Har-vard Business Review, 79(10), 72–81.
Christensen, C. M. & Raynor, M. E. (2003). Innova-tor’s Solution: Creating and sustaining suc-cessful. Boston, U.S.: Harvard Business School Press.
d’Aspremont, C., Gabszewicz, J. J., & Thisse, J. F. (1979). On Hotelling’s Stability in Competition. Econometrica, 47(5), 1145–1150.
Eisenmann, T. R., Parker, G., & Van Alstyne, M. (2006). Strategies for Two-sided Markets. Har-vard Business Review, (October), 92–101.
Economides, N. (1984). The principle of minimum differentiation revisited. European Economic Review, 24(3), 345–368.
Evans, D. S., Hagiu, A., & Schemalensee, R. (2005). A survey of the economic role of software plat-forms in computer-based industries. CESifo Economic Studies, 51(2-3), 189–224.
Evans, D. S., Hagiu, A., & Schemalensee, R. (2006). Invisible Engines: How Software Platforms Drive Innovation and Transform Industries. Cambridge, U.S.: The MIT Press.
Evans, D. S. (2009). How catalyst ignite: The eco-nomics of platform-based start-ups. In A. Gaw-er (Ed.). Platforms, Markets, and Innovations. Cheltenham, UK: Edward Elgar.
Gasmi, F., Laffont, J. J., & Vuong, Q. (1992). Econometric analysis of collusive behavior in a soft-drink market. Journal of Economics and Management Strategy, 1(2), 277–311.
Hotelling, H. (1929). Stability in Competition. Eco-nomic Journal, 39(153), 41–57.
Katz, M. L. & Shapiro, C. (1985). Network Exter-nalities, Competition, and Compatibility. Amer-ican Economic Review, 75(3), 424–440.
Katz, M. L. & Shapiro, C. (1992). Product introduc-tion with network externalities. Journal of Po-litical Economy, 94, 822–841.
Kimura, T. (2003). Wagakuni no kakō-kumitate-seizōgyō ni okeru sumairu-cābu gensyō: Kensyō to taiō [The smile curve phenomenon in the Japanese assembly-type manufacturing industry]. Economic Review, 7(4), 62–82.
Markovich, S. & Moenius, J. (2009). Winning while losing: competition dynamics in the presence of indirect network effects. International Journal
18
Vol. 11, No. 1 (November 2019)
of Industrial Organization, 27(3), 346–357.Matsumura, M., Kurimoto, H., & Kobayashi, T.
(2000). Katei-yō gēmu-ki shijyō ni-okeru syōhisya-kōdō bunseki: sofuto-hinshitu toiu kantenkara [An analysis of consumer behavior in the video game market: from the viewpoint of the quality of software]. Osaka Economic Pa-pers, 49, 193–205.
Mossberg, W. (2014). How to Understand the Google-Apple Smartphone War. Retrieved from https://www.vox.com/2014/12/11/11633720/how-to-understand-the-google-apple-smartphone- war/
Nalebuff, B. (2004). Bundling as an entry bar-rier. Quarterly Journal of Economics, 119(1), 159–187.
Rochet, J.-C. & Tirole, J. (2003). Platform Competi-tion in Two-Sided Markets. Journal of Euro-pean Economic Association, 1(4), 990–1029.
Rochet, J.-C. & Tirole, J. (2006). Two-Sided Mar-kets: A Progress Report. RAND Journal of Eco-nomics, 37(3), 645–667.
Sun, M. & Tse, E. (2007). When Does the Winner Take All in Two-Sided Markets? Review of Net-work Economics, 6(1), 16–40.
Takakuwa, K. (2012). Tamen-purattofōmu niyoru hokanzai-shijyō kasseika-saku [Policy for revi-talize the complements’ market by multi-sided platform operators]. Strategic Management
Journal, 1(2), 153–166.Takakuwa, K. (2017a). Kokunai sumātofon no
jyuyō-saido-bunseki wo tsūjita tamenshijyō niokeru suihei-seihin-sabetsuka-jyōken no bun-seki [Analysis of demand-side market of smart-phone: Condition of horizontal differentiation at multi-sided market]. Strategic Management Journal, 5(1), 13–32.
Takakuwa, K. (2017b). Tamen-purattofōmu-kan no suihei-sabetsuka-jyōkenn no kenkyū [The condition of horizontal differentiation between multi-sided platforms]. Academic Journal of the Infosocionomics Society, 12(1), 33–43.
Kentaro Takakuwa works as Manager of REASON Corp., an in-house marketing re-search agency of Sony group. He received his master degree (Economics) and Doctor degree (Policy Studies) from Chuo University, Tokyo, Japan. A member of IASM, his current research interests focus on the competitive strategy be-tween multi-sided platforms (MSPs), between MSP and its partners, between partners on same MSP. He has work experience in marketing re-search and environmental analysis for planning of various kinds businesses.E-mail: [email protected]