multilevel analysis in rural cancer control: a conceptual
TRANSCRIPT

University of South Carolina University of South Carolina
Scholar Commons Scholar Commons
Faculty Publications Biological Sciences, Department of
9-3-2019
Multilevel Analysis in Rural Cancer Control: A Conceptual Multilevel Analysis in Rural Cancer Control: A Conceptual
Framework and Methodological Implications Framework and Methodological Implications
Tine Verreet
Cory J. Weaver
Hiromu Hino
Masahiko Hibi
Fabienne E. Poulain [email protected]
Follow this and additional works at: https://scholarcommons.sc.edu/biol_facpub
Part of the Biology Commons
Publication Info Publication Info Published in eNeuro, Volume 6, Issue 5, 2019. © 2019, Verreet et al. This is an open-access article distributed under the terms of the Creative Commons Attribution 4.0 International license, which permits unrestricted use, distribution and reproduction in any medium provided that the original work is properly attributed.
This Article is brought to you by the Biological Sciences, Department of at Scholar Commons. It has been accepted for inclusion in Faculty Publications by an authorized administrator of Scholar Commons. For more information, please contact [email protected].
Copyright © 2019 Verreet et al.This is an open-access article distributed under the terms of the Creative Commons Attribution4.0 International license, which permits unrestricted use, distribution and reproduction in anymedium provided that the original work is properly attributed.
Research Article: New Research | Development
Syntaphilin-mediated docking of mitochondriaat the growth cone is dispensable for axonelongation in vivo
https://doi.org/10.1523/ENEURO.0026-19.2019
Cite as: eNeuro 2019; 10.1523/ENEURO.0026-19.2019
Received: 19 January 2019Revised: 15 August 2019Accepted: 22 August 2019
This Early Release article has been peer-reviewed and accepted, but has not been throughthe composition and copyediting processes. The final version may differ slightly in style orformatting and will contain links to any extended data.
Alerts: Sign up at www.eneuro.org/alerts to receive customized email alerts when the fullyformatted version of this article is published.

1
Title page 1
1. Manuscript Title 2
Syntaphilin-mediated docking of mitochondria at the growth cone is dispensable for axon elongation in 3 vivo 4
2. Abbreviated title 5
Mitochondria behavior and docking in growth cones 6
3. Author names and affiliations 7
Tine Verreet1,2, Cory J. Weaver1, Hiromu Hino3, Masahiko Hibi3, Fabienne E. Poulain1 8
1 Department of Biological Sciences, University of South Carolina, Columbia, SC 29208, USA. 9
2 Current address: VIB for Brain & Disease Research, KU Leuven, Department of Neurosciences, Leuven, 10 Belgium 11
3 Laboratory of Organogenesis and Organ Function, Bioscience and Biotechnology Center, Nagoya 12 University, Nagoya, Aichi 464-8601, Japan 13
4. Author contributions 14
TV and CJW performed research, analyzed data, and wrote the paper. 15
HH and MH contributed unpublished reagents and tools. 16
FEP designed and performed research, analyzed data and wrote the paper. 17
5. Correspondence 18
Correspondence should be addressed to Fabienne E. Poulain, Department of Biological Sciences, 19
University of South Carolina, 715 Sumter street, CLS room 401, Columbia, SC 29208, USA. 20
email: [email protected]. 21
6. Number of figures: 8 22
7. Number of tables: 2 23
8. Number of multimedia: 8 videos 24

2
9. Number of words for abstract: 172 25
10. Number of words for significance statement: 117 26
11. Number of words for introduction: 592 27
12. Number of words for discussion: 1355 28
13. Acknowledgements 29
We thank Bradley Brodie for performing in situ hybridization experiments and Brian Wheeler for 30
technical assistance and fish husbandry. We thank Drs. Amar N. Kar and Jeffery L. Twiss for their help 31
with RT-ddPCR experiments. We finally thank Olivia Spead, Amar N. Kar, and Jeffery L. Twiss for their 32
helpful comments drafting the manuscript. 33
14. Conflict of interest 34
Authors report no conflict of interest. 35
15. Funding sources 36
This work was supported by the National Institutes of Health (R00NS083714 and R01NS109197 to 37
F.E.P.), the University of South Carolina SmartState Center for Childhood Neurotherapeutics (to F.E.P.), 38
the University of South Carolina (Aspire I grant to T.V.), and the Belgian American Educational 39
Foundation (postdoctoral fellowship to T.V.). 40
3
Abstract 41
Mitochondria are abundantly detected at the growth cone, the dynamic distal tip of developing axons 42
that directs growth and guidance. It is however poorly understood how mitochondrial dynamics relate 43
to growth cone behavior in vivo, and which mechanisms are responsible for anchoring mitochondria at 44
the growth cone during axon pathfinding. Here, we show that in retinal axons elongating along the optic 45
tract in zebrafish, mitochondria accumulate in the central area of the growth cone and are occasionally 46
observed in filopodia extending from the growth cone periphery. Mitochondrial behavior at the growth 47
cone in vivo is dynamic, with mitochondrial positioning and anterograde transport strongly correlating 48
with growth cone behavior and axon outgrowth. Using novel zebrafish mutant lines that lack the 49
mitochondrial anchoring proteins Syntaphilin a and b, we further show that Syntaphilins contribute to 50
mitochondrial immobilization at the growth cone. Syntaphilins are however not required for proper 51
growth cone morphology and axon growth in vivo, indicating that Syntaphilin-mediated anchoring of 52
mitochondria at the growth cone only plays a minor role in elongating axons. 53
Significance statement 54
Proper axon elongation and pathfinding are essential for nervous system wiring. The growth cone, a 55
dynamic structure at the distal end of axons, mediates axonal growth and guidance. Here, we describe 56
for the first time in vivo the behavior of mitochondria at the growth cone of elongating axons. We show 57
that mitochondria accumulate in the growth cone central area and are also present in its periphery. We 58
further provide evidence that Syntaphilin, which immobilizes mitochondria along mature axons, also 59
docks mitochondria at the growth cone. However, loss of Syntaphilin did not cause a complete depletion 60
of mitochondria from the growth cone and did not affect axon elongation, indicating that other 61
mitochondria-docking factors regulate axon growth during development. 62
4
Introduction 63
Nervous system formation and function critically rely on mitochondria. The ability of mitochondria to 64
produce ATP via oxidative phosphorylation and to buffer cytosolic calcium is especially important in 65
neurons that have a high energy demand and require proper ion homeostasis. Mitochondrial dynamics, 66
including transport, fission, and fusion, contribute to the correct distribution of mitochondria in axons 67
and are therefore essential regulators of mitochondrial functions (Trevisan et al., 2018). Mitochondria 68
are targeted to regions distant from the cell body, such as the axonal growth cone and synaptic 69
terminals, through their active transport along microtubules (Melkov and Abdu, 2018). Overall, the 70
importance of mitochondrial dynamics for proper neuronal development and function is emphasized by 71
the large number of neurological disorders caused by mutations affecting mitochondrial proteins (Misko 72
et al., 2010, Bertholet et al., 2016). 73
During development, distal growing axons and growth cones contain higher densities of mitochondria 74
compared to proximal axonal regions (Morris and Hollenbeck, 1993). This asymmetrical distribution is 75
thought to be necessary for axon growth (Smith and Gallo, 2018). For instance, in vitro, increasing 76
mitochondrial density in the distal axon and growth cone by overexpressing the mitochondrial 77
biogenesis regulator PGC-1α was shown to increase axonal length (Vaarmann et al., 2016). Other studies 78
have reported that factors promoting or inhibiting axon growth regulate mitochondrial localization at 79
the growth cone (Beck et al., 2012, Sainath et al., 2017). For example, adding the growth-promoting 80
factor BDNF to cultured neurons increases distal mitochondrial density, whereas adding the repulsive 81
guidance cue ephrin-A5 or using chondroitin sulfate proteoglycans as a non-permissive substrate both 82
cause mitochondria to leave the growth cone (Beck et al., 2012, Sainath et al., 2017). While these in 83
vitro studies have highlighted a significant role for mitochondria in axon extension and growth cone 84

5
morphology, mitochondrial dynamics at the growth cone during axon pathfinding have never been 85
assessed in vivo. 86
The mechanisms responsible for maintaining mitochondria in distal growing axons are not yet fully 87
understood. Mitochondria are able to attach to both microtubule and actin cytoskeletons (Boldogh and 88
Pon, 2006), and could therefore be immobilized on microtubules in the growth cone central area after 89
being transported along developing axons. Such stalling might be mediated by Syntaphilin (Snph), a 90
mitochondrial membrane protein able to directly tether mitochondria to microtubules, thereby stalling 91
mitochondrial transport (Kang et al., 2008). By immobilizing mitochondria, Snph was shown to reduce 92
synaptic plasticity (Kang et al., 2008) and modulate axon branching (Courchet et al., 2013). Snph was 93
further found to prevent mitochondrial transport towards the distal axon and inhibit axon regeneration 94
after injury (Zhou et al., 2016). However, whether Snph also docks mitochondria at the growth cone 95
during axon elongation has never been tested. 96
The zebrafish embryo offers a unique accessibility and transparency to monitor mitochondrial 97
distribution and transport along axons in vivo (Plucinska et al., 2012, Campbell et al., 2014, Drerup et al., 98
2017, Wehnekamp et al., 2019). Here, we used time-lapse imaging of mitochondria in single retinal 99
axons as they elongate along the optic tract in zebrafish to characterize for the first the time in vivo 100
mitochondrial dynamics at the growth cone during axon pathfinding. We show that mitochondrial 101
distribution at the growth cone correlates with axon growth status, and that mitochondrial transport 102
towards the growth cone correlates significantly with axon elongation. We further demonstrate that 103
Snph contributes to mitochondrial docking at the growth cone during axon pathfinding. However, 104
growth cone morphology and axon elongation are unaffected in snph mutants, indicating that the direct 105
anchoring of mitochondria to growth cone microtubules by Snph only plays a minor role in axon 106
elongation. 107

6
Material and Methods 108
Zebrafish husbandry 109
All animal procedures were performed in accordance with the author’s University Institutional Animal 110
Care and Use Committee (IACUC). Zebrafish (Danio rerio) wild-type (WT, AB strain) and lakritz (lak) 111
mutant (Kay et al., 2001) embryos were obtained from natural matings, raised at 28.5 ˚C in E3 medium 112
(5 mM NaCl, 0.17 mM KCl, 0.33 mM CaCl2, and 0.33 mM MgSO4) in the presence of 150 mM 1-phenyl-2-113
thiourea (PTU) (Sigma) to prevent pigment formation, and staged by age and morphology (Kimmel et al., 114
1995). Zebrafish possess a polygenic sex determination system, and sex-associated chromosomal 115
regions are not fixed for the species (Liew et al., 2012). Our experiments were conducted on embryos 116
before the onset of sexual differentiation, which only occurs at about 2.5 months after metamorphosis 117
is complete (Maack and Segner, 2003). 118
TALEN-mediated mutagenesis and genotyping of snph mutants 119
The TALENs to target zebrafish snpha and snphb were designed using TAL Effector Nucleotide Targeter 120
2.0 (https://tale-nt.cac.cornell.edu/node/add/talen) (Cermak et al., 2011). The TALENs for snpha 121
contained the following repeat variable di-residues (RVDs): HD NI HD NN HD HD NI HD NG NN HD NI NN 122
HD NI NN and NI NN HD HD NN NG NN HD NI HD NN NG NI NN NI NG NN HD, which targeted the 123
sequences CACGCCACTGCAGCAG and AGCCGTGCACGTAGATGC, respectively. The TALENs for snphb 124
contained the following RVDs: NN NI NN HD NI NI NG NI HD HD NG HD NI HD HD HD and NN HD HD NG 125
NN NI NG NN HD NI HD NI HD HD NG HD, which targeted GAGCAATACCTCACCC and 126
GCCTGATGCACACCTC, respectively. The TALEN cDNAs were assembled as described previously (Sakuma 127
et al., 2013) and subcloned into pCS2pTAL3DD and pCS2pTALRR (Dahlem et al., 2012). Capped RNAs 128
were synthesized from NotI-digested TALEN expression plasmids using SP6 RNA polymerase (Promega) 129
in the presence of m’G(5’)ppp(5’)G RNA Cap Structure Analog (NEB). One nanoliter of solution 130

7
containing a pair of TALEN RNAs (0.4 μg/μL each) was injected into zebrafish embryos at one-cell stage. 131
Deletion mutations in the target region were detected using heteroduplex mobility analysis (HMA) (Ota 132
et al., 2013). The following primers were used: AGAATCATGGCATTCGTCCTC and 133
TGAAGCCTCTCCACATTTTCTT to detect the 14-bp deletion in snpha; and AATGATAACCATGGCATTCGAC 134
and CTTTAAGCCGTGCTCTCAGGT to detect the 4-bp deletion in snphb. PCR products were separated on 135
12% or 20% TBE (Tris-borate-EDTA) acrylamide gels or on a 4% Metaphor gel (Lonza). The snphb 136
mutation was additionally detected using high-resolution melting analysis (HRMA) (Parant et al., 2009) 137
using the following primers: AGCAATACCTCACTCCACTG and GCCTGATGCACACCTCTTTC. 138
Cloning of snpha and snphb coding sequences 139
mRNA from embryos at 24 hours-post-fertilization (hpf) was isolated using Trizol (ThermoFisher) and the 140
RNeasy mini kit (Qiagen). cDNA was prepared from RNA using SuperScript III First-Strand Synthesis 141
System (ThermoFisher). The following primers were used to amplify zebrafish snpha and snphb cDNA: 142
snpha fw: TGTCCTTCTGCATCCATGTC; snpha rv: TCAGATAGGTGTCGCTCTTTC; snphb fw: 143
ATGTCTTCGCCTTCAAATAAAAG; snphb rv: TCATATATTCATTCCCCCTGG. Amplicons were subcloned into 144
PCRII-TOPO (Invitrogen) and sequenced to verify gene identity and confirm sequence orientation for the 145
generation of sense and antisense RNA probes. 146
DNA plasmid constructs 147
All expression vectors were constructed using the Tol2kit Gateway cloning system (Kwan et al., 2007). 148
We generated a pME-mitoEGFP entry clone by adding the mitochondrial targeting signal of the zebrafish 149
cox8a gene to the 5’ end of EGFP sequence using a BP-compatible forward primer. We generated a 150
pME-Lifeact-TagRFP entry clone by fusing the Lifeact sequence (Riedl et al., 2008) upstream of TagRFP 151
using a BP-compatible forward primer. Lifeact-TagRFP was used to label F-actin in retinal axons and 152
improve the visualization of growth cone filopodia. We generated a pME-TagBFP-snphb by adding the 153
8
coding sequences of TagBFP (Evrogen) and a linker peptide (SGLRSRV) to the 5’ end of snphb. The p3E-154
2A-TagRFPCAAX-pA entry clone that encodes a 2A peptide (Provost et al., 2007) and TagRFP targeted to 155
the plasma membrane by the prenylation motif of Ras (Moriyoshi et al., 1996) was a generous gift from 156
Dr. Kristen Kwan (University of Utah). The p5E-isl2b plasmid that drives specific expression in retinal 157
ganglion cells (RGCs) was described previously (Pittman et al., 2008). Final isl2b:mitoEGFP-2A-158
TagRFPCAAX, isl2b:Lifeact-TagRFP, and isl2b:TagBFP-snphb plasmids were generated using LR reactions 159
with the pDestTol2pA2 backbone (Kwan et al., 2007). 160
RNA isolation and reverse transcriptase (RT)-coupled droplet digital PCR (ddPCR) 161
For RNA isolation from whole embryos, 15 dechorionated WT embryos were lysed and homogenized in 162
500 μL Trizol at cleavage, pharyngula prim-5 (24 hpf), long-pec (48 hpf), protruding mouth (72 hpf), 163
larval day 4 (96 hpf), and larval day 5 (120 hpf). For RNA isolation from eyes at 72 hpf, 50 eyes were 164
manually dissected from WT or lak mutant embryos. Total RNA was isolated using the Direct-zol RNA 165
Miniprep kit (Zymo Research) and eluted into 20 μL nuclease-free water. cDNA was synthesized with 5 166
μg of purified RNA as an input using the SuperScript III System. Digital droplet PCR (ddPCR) was then 167
performed on a QX200 AutoDG instrument (Bio-Rad) using predesigned Taqman primers and probes for 168
zebrafish snpha, sphnb, gapdh, and 18s (Table 1). Briefly, ddPCR reactions were assembled using Bio-Rad 169
2x ddPCR Supermix for Probes (no dUTP) and contained 1 μg of cDNA and 250 nM primers/probe. PCR 170
amplification was performed with the following parameters: 39 cycles of 94°C for 30 seconds and 60°C 171
for 1 minute. 172
In situ hybridization 173
In vitro transcription of digoxigenin-labeled probes was performed using the RNA Labeling Kit (Roche 174
Diagnostics Corporation) according to manufacturer’s instructions. Embryos were dechorionated at the 175
appropriate developmental stages and fixed in 4% paraformaldehyde in phosphate buffered saline (pH 176
9
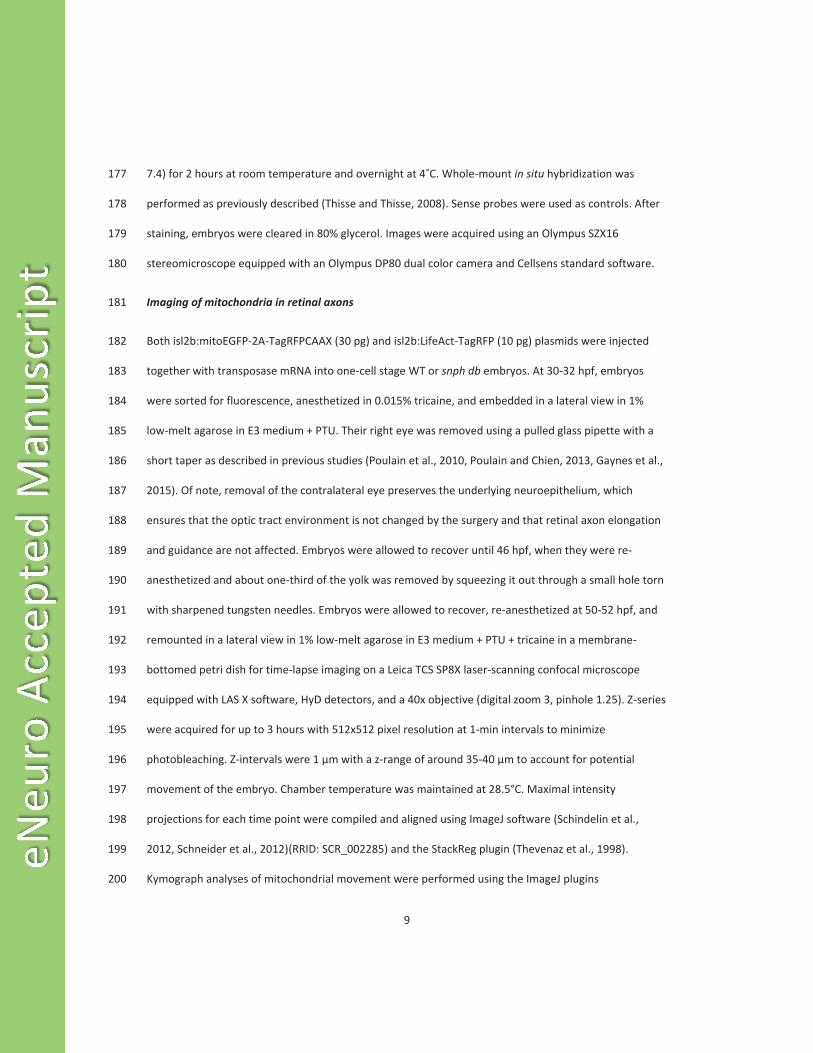
7.4) for 2 hours at room temperature and overnight at 4˚C. Whole-mount in situ hybridization was 177
performed as previously described (Thisse and Thisse, 2008). Sense probes were used as controls. After 178
staining, embryos were cleared in 80% glycerol. Images were acquired using an Olympus SZX16 179
stereomicroscope equipped with an Olympus DP80 dual color camera and Cellsens standard software. 180
Imaging of mitochondria in retinal axons 181
Both isl2b:mitoEGFP-2A-TagRFPCAAX (30 pg) and isl2b:LifeAct-TagRFP (10 pg) plasmids were injected 182
together with transposase mRNA into one-cell stage WT or snph db embryos. At 30-32 hpf, embryos 183
were sorted for fluorescence, anesthetized in 0.015% tricaine, and embedded in a lateral view in 1% 184
low-melt agarose in E3 medium + PTU. Their right eye was removed using a pulled glass pipette with a 185
short taper as described in previous studies (Poulain et al., 2010, Poulain and Chien, 2013, Gaynes et al., 186
2015). Of note, removal of the contralateral eye preserves the underlying neuroepithelium, which 187
ensures that the optic tract environment is not changed by the surgery and that retinal axon elongation 188
and guidance are not affected. Embryos were allowed to recover until 46 hpf, when they were re-189
anesthetized and about one-third of the yolk was removed by squeezing it out through a small hole torn 190
with sharpened tungsten needles. Embryos were allowed to recover, re-anesthetized at 50-52 hpf, and 191
remounted in a lateral view in 1% low-melt agarose in E3 medium + PTU + tricaine in a membrane-192
bottomed petri dish for time-lapse imaging on a Leica TCS SP8X laser-scanning confocal microscope 193
equipped with LAS X software, HyD detectors, and a 40x objective (digital zoom 3, pinhole 1.25). Z-series 194
were acquired for up to 3 hours with 512x512 pixel resolution at 1-min intervals to minimize 195
photobleaching. Z-intervals were 1 μm with a z-range of around 35-40 μm to account for potential 196
movement of the embryo. Chamber temperature was maintained at 28.5°C. Maximal intensity 197
projections for each time point were compiled and aligned using ImageJ software (Schindelin et al., 198
2012, Schneider et al., 2012)(RRID: SCR_002285) and the StackReg plugin (Thevenaz et al., 1998). 199
Kymograph analyses of mitochondrial movement were performed using the ImageJ plugins 200

10
KymoToolBox (Zala et al., 2013)( RRID:SCR_016098) and KymoAnalyzer (Neumann et al., 2017). The 201
number of mitochondria arriving at and leaving the growth cone were counted manually from the time-202
lapse sequences. 203
For the visualization of Snphb at the growth cone, isl2b:mitoEGFP-2A-TagRFPCAAX (15 pg), isl2b:LifeAct-204
TagRFP (10 pg), and isl2b:TagBFP-snphb (25 pg) plasmids were co-injected with transposase mRNA at 205
one-cell stage. Embryos were prepared in the same manner as for time-lapse imaging (described above). 206
Single z-stacks (z-interval of 0.42 μm) were acquired around 50-52 hpf using a 40x objective with digital 207
zoom 4, pinhole 1.0, and 1024x1024 pixel resolution. 208
For the visualization of mitochondria in single mature retinal axons at 120 hpf, embryos were injected 209
with isl2b:mitoEGFP-2A-TagRFPCAAX (15 pg) and transposase mRNA at one-cell stage and selected for 210
fluorescence in the optic tract at 96 hpf, after which the right eye was removed as described above. 211
Larvae were re-anesthetized at 120 hpf and mounted in a lateral view in 1.5% low-melt agarose in E3 212
medium + PTU + tricaine in a membrane-bottomed petri dish. Imaging was performed using a 40x 213
objective with digital zoom 2.5 and pinhole 1.0. Time-lapse recordings were done in 35 z-planes (0.80 214
μm z-interval), allowing acquisition at 1 frame every 15 seconds over 10 min. 215
Time-lapse image analysis 216
Image analysis was carried out using ImageJ (Schindelin et al., 2012, Schneider et al., 2012). For 2D 217
analyses, the TagRFP/TagRFPCAAX signals from stack maximal projections were used to manually 218
segment the growth cone total and central areas. The growth cone central area was determined by 219
tracing the perimeter of the growth cone body, not including filopodia. As such, the central area is an 220
arbitrary outline based on growth cone morphology and fluorescent intensity and presumably 221
corresponds to growth cone central domain and transition zone (it does not necessarily correspond to 222
what is commonly defined as the growth cone central domain based on cytoskeletal components). 223

11
Regions of interest (ROIs) defined as the total and central areas were used to segment the mitoEGFP 224
signals on binary images using the ‘Particle analysis’ tool. Two different thresholds were used to analyze 225
mitochondrial particles: a threshold of 55 was applied to the growth cone central area to segment the 226
main mitochondrial cluster, and a threshold of 20 was applied to the growth cone total area to segment 227
smaller individual mitochondria present in the peripheral area (see Fig. 1B). A threshold of 20 was also 228
applied to analyze pioneering mitochondrial clusters using the `particle analysis’ tool. The number, area, 229
and presence (% time of advance) of pioneering mitochondrial clusters were analyzed in every frame of 230
an advancing growth cone central area. The peripheral area, comprising filopodia, was calculated by 231
subtracting the growth cone central area from the growth cone total area. The number of filopodia was 232
counted manually. We drew a straight line from the mitochondrial cluster boundary to the most distal 233
outline of the growth cone central area where two filopodia join together to measure the distance 234
between the main mitochondrial cluster and the growth cone leading edge. We also defined the 235
proximal growth cone as the most proximal boundary of the growth cone central area, where the 236
growth cone transitions into the axon shaft. A growth cone was classified as advancing when the 237
proximal growth cone advanced > 1 μm after an elongation of the growth cone central area (i.e. major > 238
3 x minor axis length of the best fitting ellipse of the central area). Elongation rates were quantified by 239
measuring the displacement between the proximal growth cone boundaries before and after advance 240
and expressed in μm per min. 241
Visualizations of 3D growth cones and mitochondria were prepared using FluoRender 242
(RRID:SCR_014303) (Wan et al., 2017). For volumetric analysis of mitochondrial occupancy at the growth 243
cone, z-stacks were processed and analyzed with ImageJ. Images were thresholded to the lowest level 244
that excludes the majority of noise pixels to obtain binary z-projections similar to raw z-projections, 245
after which volumes were calculated using the Voxel Counter plugin. Volume data of mitochondria and 246
12
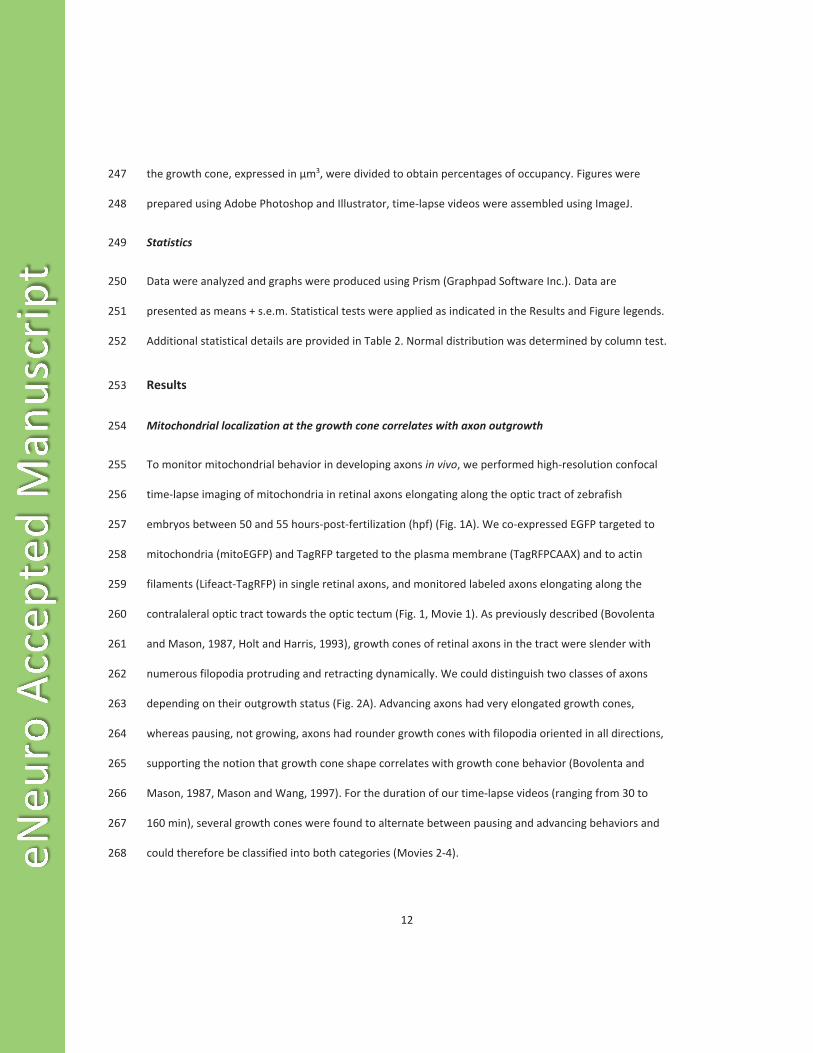
the growth cone, expressed in μm3, were divided to obtain percentages of occupancy. Figures were 247
prepared using Adobe Photoshop and Illustrator, time-lapse videos were assembled using ImageJ. 248
Statistics 249
Data were analyzed and graphs were produced using Prism (Graphpad Software Inc.). Data are 250
presented as means + s.e.m. Statistical tests were applied as indicated in the Results and Figure legends. 251
Additional statistical details are provided in Table 2. Normal distribution was determined by column test. 252
Results 253
Mitochondrial localization at the growth cone correlates with axon outgrowth 254
To monitor mitochondrial behavior in developing axons in vivo, we performed high-resolution confocal 255
time-lapse imaging of mitochondria in retinal axons elongating along the optic tract of zebrafish 256
embryos between 50 and 55 hours-post-fertilization (hpf) (Fig. 1A). We co-expressed EGFP targeted to 257
mitochondria (mitoEGFP) and TagRFP targeted to the plasma membrane (TagRFPCAAX) and to actin 258
filaments (Lifeact-TagRFP) in single retinal axons, and monitored labeled axons elongating along the 259
contralaleral optic tract towards the optic tectum (Fig. 1, Movie 1). As previously described (Bovolenta 260
and Mason, 1987, Holt and Harris, 1993), growth cones of retinal axons in the tract were slender with 261
numerous filopodia protruding and retracting dynamically. We could distinguish two classes of axons 262
depending on their outgrowth status (Fig. 2A). Advancing axons had very elongated growth cones, 263
whereas pausing, not growing, axons had rounder growth cones with filopodia oriented in all directions, 264
supporting the notion that growth cone shape correlates with growth cone behavior (Bovolenta and 265
Mason, 1987, Mason and Wang, 1997). For the duration of our time-lapse videos (ranging from 30 to 266
160 min), several growth cones were found to alternate between pausing and advancing behaviors and 267
could therefore be classified into both categories (Movies 2-4). 268

13
As previously observed in vitro (Morris and Hollenbeck, 1993), mitochondria were abundantly detected 269
at the growth cone (Fig. 2A, Movies 1-4). The majority of mitochondria clustered in the microtubule-rich 270
growth cone central area, whereas smaller mitochondria regularly appeared in the peripheral area along 271
protrusions or actin filopodia (e.g. Movie 3). We analyzed mitochondrial localization and distribution at 272
the growth cone by quantifying mitochondrial occupancy in the growth cone total and central volumes 273
(Fig. 2B,C), peripheral mitochondrial volume (Fig. 2D), mitochondrial occupancy in the growth cone total 274
and central areas (Fig. 2B’,C’), the number of mitochondria in the peripheral area (Fig. 2D’), and the 275
distance between mitochondria and the growth cone leading edge (Fig. 2E, see also Fig. 1B,C). 276
Mitochondrial occupancy was chosen as measure to evaluate mitochondrial density in the growth cone 277
since spatial overlap of mitochondria within the growth cone central zone did not allow the visualization 278
and quantification of single mitochondria. Mitochondrial occupancy in the total and central volumes and 279
areas were similar in advancing versus pausing growth cones (Fig. 2B-C’). We did note that when we 280
exclusively compared growth cones that frequently alternated between pausing and advancing 281
behaviors, a significant decrease in mitochondrial occupancy in the central area of advancing growth 282
cones was observed (paired t-test, P = 0.006, t(6) = 4.2). Furthermore, the distance of the main 283
mitochondrial cluster to the leading edge was significantly different between pausing and advancing 284
growth cones (Fig. 2E). When a growth cone advanced, its central area elongated substantially, but this 285
forward extension was not accompanied with a forward advance of mitochondria (See Fig. 3A, Movie 5). 286
Hence, the distance between them and the leading edge increased two-fold (Fig. 2E). Mitochondria 287
repositioned near the leading edge when the growth cone regained a rounder shape (Fig. 3A), which 288
often indicated a transition to a pausing state. Interestingly, although the majority of mitochondria 289
lagged behind during growth cone extension, a smaller subset of mitochondria was always detected 290
adjacent to the leading edge (Fig. 3, Movie 5). We analyzed the number and area of these ‘pioneering 291
mitochondrial clusters’, as well as the amount of time they were present when a growth cone advanced. 292
14
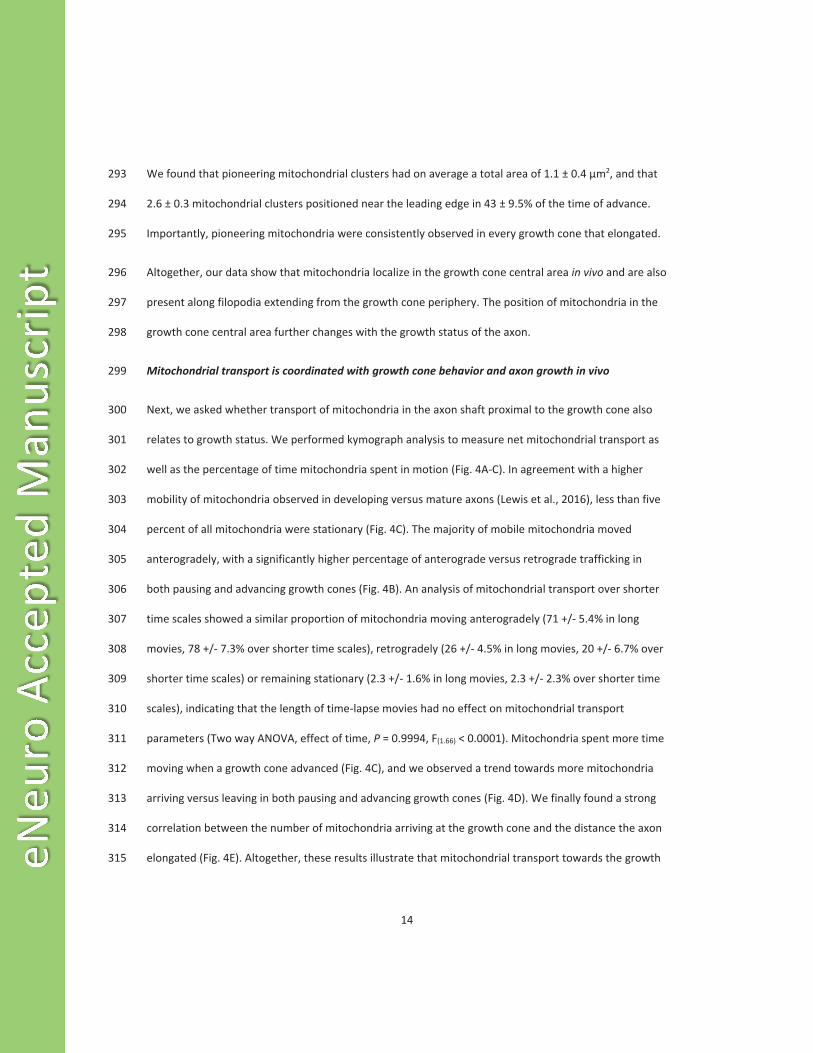
We found that pioneering mitochondrial clusters had on average a total area of 1.1 ± 0.4 μm2, and that 293
2.6 ± 0.3 mitochondrial clusters positioned near the leading edge in 43 ± 9.5% of the time of advance. 294
Importantly, pioneering mitochondria were consistently observed in every growth cone that elongated. 295
Altogether, our data show that mitochondria localize in the growth cone central area in vivo and are also 296
present along filopodia extending from the growth cone periphery. The position of mitochondria in the 297
growth cone central area further changes with the growth status of the axon. 298
Mitochondrial transport is coordinated with growth cone behavior and axon growth in vivo 299
Next, we asked whether transport of mitochondria in the axon shaft proximal to the growth cone also 300
relates to growth status. We performed kymograph analysis to measure net mitochondrial transport as 301
well as the percentage of time mitochondria spent in motion (Fig. 4A-C). In agreement with a higher 302
mobility of mitochondria observed in developing versus mature axons (Lewis et al., 2016), less than five 303
percent of all mitochondria were stationary (Fig. 4C). The majority of mobile mitochondria moved 304
anterogradely, with a significantly higher percentage of anterograde versus retrograde trafficking in 305
both pausing and advancing growth cones (Fig. 4B). An analysis of mitochondrial transport over shorter 306
time scales showed a similar proportion of mitochondria moving anterogradely (71 +/- 5.4% in long 307
movies, 78 +/- 7.3% over shorter time scales), retrogradely (26 +/- 4.5% in long movies, 20 +/- 6.7% over 308
shorter time scales) or remaining stationary (2.3 +/- 1.6% in long movies, 2.3 +/- 2.3% over shorter time 309
scales), indicating that the length of time-lapse movies had no effect on mitochondrial transport 310
parameters (Two way ANOVA, effect of time, P = 0.9994, F(1.66) < 0.0001). Mitochondria spent more time 311
moving when a growth cone advanced (Fig. 4C), and we observed a trend towards more mitochondria 312
arriving versus leaving in both pausing and advancing growth cones (Fig. 4D). We finally found a strong 313
correlation between the number of mitochondria arriving at the growth cone and the distance the axon 314
elongated (Fig. 4E). Altogether, these results illustrate that mitochondrial transport towards the growth 315

15
cone correlates with growth cone advance, suggesting that mitochondrial motility and axon elongation 316
may be functionally linked or co-regulated in vivo. 317
Zebrafish Syntaphilins are expressed in RGCs and localize to the growth cone 318
How mitochondria are maintained in the growth cone remains poorly understood. One possible 319
mechanism involves the attachment, or docking, of mitochondria to microtubules by Snph. Snph was 320
identified as an outer mitochondrial membrane protein able to dock mitochondria directly to 321
microtubules via its microtubule-binding domain (MTB) (Kang et al., 2008) (Fig. 6A). Snph was shown to 322
be important in axons for the regulation of branching (Courchet et al., 2013) and synaptic plasticity 323
(Kang et al., 2008). We decided to test whether Snph also plays a role in docking mitochondria at the 324
growth cone during axon elongation in vivo. Due to the whole-genome duplication that occurred in the 325
teleost lineage (Glasauer and Neuhauss, 2014), two snph genes, snpha and snphb, are present in 326
zebrafish. Both Snpha and Snphb share a high sequence conservation with human SNPH in their MTB 327
and mitochondrial transmembrane domains (TMs), strongly suggesting a conserved mitochondrial 328
anchoring function (Fig. 6A, Extended Data Fig. 6-1). We first analyzed the expression of snpha and 329
snphb during zebrafish development. Quantification of snpha and snphb mRNA levels using reverse 330
transcriptase (RT)-coupled droplet digital PCR (ddPCR) showed that both snpha and snphb are 331
maternally expressed and that mRNA levels for both snphs increase over later developmental periods, 332
albeit at much lower levels for snpha (Fig. 5A). In situ hybridization (ISH) further revealed a high 333
expression of snphb in the nervous system at 48, 72, and 120 hpf (Fig. 5B), whereas snpha expression 334
was not detectable using this approach (data not shown). Importantly, snphb was detected in the RGC 335
layer at the time of retinal axon elongation (Fig. 5B), suggesting a possible role in anchoring 336
mitochondria in retinal growth cones. To further test whether snphb is expressed by RGCs, we 337
performed ISH on WT and RGC-deficient lakritz (lak) mutant embryos (Kay et al., 2001) at 72 hpf (Fig. 338
5C). Snphb expression was strongly reduced in the retina of lak compared to WT, while it appeared 339

16
unchanged in the brain (Fig. 5C). This decreased retinal expression was further confirmed by RT-ddPCR 340
performed on dissected eyes (Fig. 5D). Snphb mRNA levels were highly detected in WT but significantly 341
reduced in lak, indicating that snphb is strongly expressed by RGCs. Interestingly, snpha transcripts were 342
also detected in WT, albeit at much lower levels. Like snphb, snpha eye expression was significantly 343
decreased in lak (Fig. 5D), indicating that both Snphs are present in RGCs at the time of axon elongation. 344
As snphb is highly expressed in RGCs, we finally tested whether Snphb could localize to the growth cones 345
of retinal axons elongating along the tract. As we could not identify an antibody directed against 346
mammalian Snph that would specifically recognize zebrafish Snphs (data not shown), we decided to co-347
express TagBFP-tagged Snphb, mitoEGFP, TagRFPCAAX, and Lifeact-TagRFP in single retinal axons, and 348
monitor labeled growth cones advancing along the contralateral optic tract (Fig. 5E). We detected 349
TagBFP-Snphb in the central area of retinal growth cones, where it appeared to co-localize with the 350
main mitochondrial cluster. Altogether, our results show that Snphs are expressed by RGCs and can 351
localize to the growth cone of developing axons, suggesting they might participate to mitochondria 352
docking at the growth cone during axon elongation in vivo. 353
Syntaphilins contribute to mitochondrial immobilization at the growth cone 354
To test the function of zebrafish Snphs in retinal axons, we generated snpha and snphb mutants using 355
TALEN-mediated genome editing (Fig. 6A,B). We targeted a region upstream the MTB to ensure full loss-356
of-function and obtained two alleles consisting of a 14 and 4 bp deletion for snpha and snphb, 357
respectively, predicted to cause premature termination of translation (Fig. 6B). As both snpha and sphnb 358
are expressed in RGCs (Fig. 5D) and to avoid potential compensation mechanisms, we generated 359
maternal zygotic double mutants (db) and confirmed by RT-PCR and cDNA sequencing that both mutant 360
mRNAs were expressed and contained the corresponding mutations (Fig. 6B). No alternative transcripts 361
were detected in db (data not shown). Db were viable and fertile, and db embryos did not show any 362

17
obvious morphological abnormalities, as was reported for Snph knockout (KO) mice (Kang et al., 2008). 363
To test whether zebrafish Snphs also contribute to mitochondrial anchoring in axons, we quantified 364
mitochondrial transport in mature retinal axons of WT and db embryos at 120 hpf (Fig. 6C), when most 365
mitochondria are known to become immobile (Lewis et al., 2016, Smit-Rigter et al., 2016). As expected, 366
mitochondrial mobility was strongly increased in axons of db (Fig. 6D,E), demonstrating that the 367
mitochondrial docking function of Snph is conserved in zebrafish. 368
We next performed time-lapse imaging of mitochondria in retinal axons elongating along the optic tract 369
of db embryos to test whether Snphs also play a role in mitochondrial tethering at the growth cone of 370
growing axons (Movies 6-8). We compared db with WT embryos that have a similar genetic background 371
(datasets analyzed in Fig. 2-4). Interestingly, mitochondrial distribution at the growth cone was modified 372
in db compared to WT (Fig. 7A-D’). While a same mitochondrial volume and number were observed in 373
the growth cone peripheral volume and area in WT and db (Fig. 7C,C’), mitochondria occupied a smaller 374
proportion of the growth cone total and central volumes and areas in db (Fig. 7A-B’, Movies 6-8). 375
Moreover, mitochondria were located further from the growth cone leading edge in db, which was most 376
pronounced in pausing growth cones (Fig. 7D,D’). Interestingly, the decreased mitochondrial occupancy 377
of the growth cone in db was accompanied with changes in mitochondrial flux. While a similar number 378
of mitochondria arrived at the growth cone, more mitochondria left the growth cone in db versus WT 379
(Fig. 7E), suggesting that Snphs dock mitochondria once they have reached the growth cone. The 380
increased departure of mitochondria from the growth cone of db was associated with changes in net 381
mitochondrial transport proximally to the growth cone. More mitochondria moved retrogradely in snph 382
db, which was accompanied by a decreased percentage of mitochondria moving in the anterograde 383
direction (Fig. 7F). No differences were found between WT and db in the amount of time that 384
mitochondria moved in both directions (Fig. 7G). 385

18
Finally, in addition to the decreased mitochondrial occupancy of the growth cone in db, we observed 386
some changes in pioneering mitochondrial clusters. As in WT, we detected pioneering clusters in every 387
db growth cone that advanced (Fig. 8A-C). The number of clusters (Fig. 8E) and the amount of time they 388
were present at the growth cone (Fig. 8F) did not vary, however the total area occupied by pioneering 389
mitochondrial clusters was significantly decreased in db compared to WT (Fig. 8D). Altogether, these 390
observations demonstrate for the first time that Snphs contribute to mitochondrial clustering at the 391
growth cone in vivo. Snphs play a role in anchoring mitochondria in the growth cone central domain, 392
including both the main cluster and the pioneering mitochondria that dynamically appear along the 393
leading edge of advancing growth cones. 394
Mitochondrial docking at the growth cone by Syntaphilins is not required for axon outgrowth 395
As Snphs contribute to mitochondrial docking at the growth cone (Figs. 7A-G, 8), we then tested 396
whether the loss of Snphs would affect axon elongation. Analysis of the total and central growth cone 397
areas (Fig. 7H) and the number of filopodia (Fig. 7I) did not reveal any differences in growth cone 398
morphology between WT and snph db. Moreover, retinal axon growth rate was similar between WT and 399
db mutants (Fig. 7J), indicating that Snph-mediated mitochondrial docking at the growth cone is 400
dispensable for axon elongation. Thus, we identified Snph as a mediator of mitochondrial docking at the 401
growth cone in elongating axons in vivo, but this function plays only a minor role, if any, in axon growth. 402
Discussion 403
By performing confocal live imaging in the zebrafish embryo, we provide the first detailed 404
characterization of mitochondrial dynamics during growth cone behavior in elongating axons in vivo. We 405
show that mitochondrial distribution at and trafficking towards the growth cone are coordinated with 406
axon outgrowth, which is in agreement with previous in vitro observations (Morris and Hollenbeck, 407
1993, Sainath et al., 2017), and highlights that mitochondria might play a role in axon outgrowth and 408

19
pathfinding. We further provide evidence that Snph contributes to mitochondrial docking at the growth 409
cone. However, growth cone morphology and axon elongation are unaffected in snph db mutants, 410
indicating that the direct anchoring of mitochondria to growth cone microtubules by Snph only plays a 411
minor role in axon elongation. 412
An intriguing finding of our study is the localization of mitochondria along growth cone filopodia that is 413
independent of Snph. Since filopodia dynamics are highly dependent on actin filament polymerization 414
and turnover, this observation suggests that mitochondria might associate with the growth cone actin 415
cytoskeleton. Mitochondria have indeed been shown to be able to attach to actin via the myosin 19 416
molecular motor (Shneyer et al., 2016). Interaction with myosin 19 positioned mitochondria into actin-417
rich filopodia of U-2 OS osteosarcoma cells following stress (Shneyer et al., 2017). A localization of 418
mitochondria to leading edge lamellipodia, filopodia, and invadopodia of cancer cells has further been 419
shown to play an important role in cancer cell migration and metastatic potential (Cunniff et al., 2016, 420
Smith and Gallo, 2018). Whether the interaction between mitochondria, myosin 19, and actin is relevant 421
in the growth cone remains unknown. Interestingly, mitochondria appeared along growth cone filopodia 422
in a transient manner, suggesting that they might also be transported along the dynamic microtubules 423
that explore the growth cone periphery and play an essential role in growth cone adhesion and turning 424
(Buck and Zheng, 2002, Suter et al., 2004). Our observation of pioneering mitochondrial clusters at the 425
leading edge of the growth cone during elongation further supports the hypothesis that mitochondria 426
might frequently attach to the plus-end of microtubules. An intriguing consequence of mitochondrial 427
targeting to microtubule plus ends in filopodia would be the possibility to predict the net direction of 428
axon growth based on mitochondrial appearance. Unfortunately, our imaging conditions did not have 429
the resolution required for correlating mitochondrial peripheral distribution with filopodia protrusion, 430
retraction, or stabilization. It will be important in the future to optimize imaging approaches in order to 431
quantify fine aspects of mitochondrial behavior in vivo and test the possible interaction between 432

20
mitochondria and the cytoskeleton in the growth cone. Interestingly, the presence of pioneering 433
mitochondrial clusters close to the leading edge is at least partially Snph-dependent, suggesting that the 434
targeting of mitochondria to peripheral filopodia and to the leading edge rely on different mechanisms. 435
While mitochondria might be transported on actin filaments or dynamic microtubules in the periphery, 436
they may accumulate on the stable microtubules that “end” in the central area of the growth cone and 437
be captured there by Snph and other factors. 438
The interdependence between mitochondrial transport and axon outgrowth we observed is consistent 439
with in vitro work demonstrating a net anterograde mitochondrial trafficking in growing axons that is 440
abolished when axons encounter a physical barrier (Morris and Hollenbeck, 1993). We now establish 441
such a correlation for the first time in vivo by comparing various parameters of mitochondrial transport 442
in pausing versus advancing retinal axons. Together with the observation of a growth status-dependent 443
mitochondrial distribution at the growth cone, our data indicate that mitochondrial dynamics in the 444
distal axon and growth cone are coordinated with growth cone behavior and axon outgrowth in vivo. 445
Vaarmann et al. (2016) previously showed that axon length could be increased by overexpressing PGC-446
1α, a central inducer of mitochondrial biogenesis, supporting the notion that mitochondria provide 447
energy for axon growth. In line with this, pharmacological and genetic disturbance of the mitochondrial 448
fission-fusion balance in cultured retinal neurons affected neurite length and caused neurite guidance 449
errors (Steketee et al., 2012). On the other hand, other studies hinted at the ability of axons to grow 450
with dysfunctional mitochondria (Yoon et al., 2012, Campbell et al., 2014). While depletion of the 451
intermediate filament protein Lamin B2 caused defects in mitochondrial membrane potential, 452
morphology, and transport, it did not affect retinal axon initial growth and guidance along the optic tract 453
in vivo (Yoon et al., 2012). In a similar manner, lack of Kif5Aa, which transports mitochondria 454
anterogradely into axons, causes a lack of mitochondria in distal peripheral axons that leads to 455
degeneration. Yet, axons grow normally in kif5Aa zebrafish mutant embryos (Campbell et al., 2014). As it 456

21
remains unclear which cellular processes are specifically dependent on mitochondrial respiration (Smith 457
and Gallo, 2018), it might be conceivable that ATP production through glycolysis can, at least partially, 458
sustain axon growth. Previous studies have even suggested that embryonic neurons predominantly rely 459
on glycolytic ATP (Surin et al., 2012). As growth cone turning is regulated by local calcium levels 460
(Gasperini et al., 2017), the ability of growth cone mitochondria to buffer calcium might be more 461
important than its capacity to generate energy. Future work analyzing mitochondrial calcium dynamics 462
at the growth cone in vivo might thus be highly interesting. 463
We identified Snph as a mediator of mitochondrial docking at the growth cone in elongating axons in 464
vivo. This function is consistent with its previously established role in axonal mitochondrial stalling (Kang 465
et al., 2008, Chen and Sheng, 2013). Yet, our data suggest that Snph does not play an important role in 466
stalling mitochondria along the axon at this early developmental stage. The lack of difference in the 467
number of mitochondria arriving at the growth cone in WT versus snph db axons suggests that Snph 468
does not inhibit mitochondrial anterograde transport towards the growth cone as it does in the context 469
of axon regeneration (Zhou et al., 2016). An increased halting of mitochondria along the axon over time 470
is instead consistent with an increased expression of Snph in the brain during development, both in 471
zebrafish in our study and in the mouse (Das et al., 2003, Kang et al., 2008). Alternatively, Snph 472
localization and functions might be differently regulated in the axon shaft versus growth cone during 473
development. 474
While the loss of Snphs reduced the number of mitochondria at the growth cone, it did not cause a 475
complete depletion of mitochondria and did not affect axon growth. The remaining mitochondria at the 476
growth cone might thus compensate for a lower density by increasing their activity. In this regard, it is 477
noteworthy that Snph KO mice sciatic nerves show enhanced regrowth capacity after injury (Zhou et al., 478
2016). Cultured cortical neurons from these Snph KO mice displayed increased ATP content upon 479
axotomy (Zhou et al., 2016), but this difference in energy production was not observed in baseline 480

22
conditions. Alternatively, the number of mitochondria remaining at the growth cone in absence of Snph 481
might be enough for normal axon development, especially considering that glycolytic ATP might have an 482
important role in sustaining axon growth (Surin et al., 2012). These remaining mitochondria are likely 483
stabilized at the growth cone central domain by other anchoring factors, of which the outer 484
mitochondrial membrane GTPases Miro1 and 2 are especially good candidates. Miro proteins are indeed 485
involved in mitochondrial trafficking along microtubules (Devine et al., 2016) and can arrest 486
mitochondrial movement in a calcium-dependent manner (Saotome et al., 2008), which is particularly 487
relevant at the growth cone where calcium signaling regulates pausing, extension, and turning 488
(Sutherland et al., 2014, Gasperini et al., 2017). In that context, an elegant study recently demonstrated 489
that growth inhibiting substrates such as MAG or CSPGs decrease mitochondrial axonal transport by 490
promoting the deacetylation of Miro1 by HDAC6 in a calcium-dependent manner (Kalinski et al., 2019). 491
Finally, Miros have also been discovered to play a role in mitochondrial trafficking and positioning along 492
actin filaments (Lopez-Domenech et al., 2018), which might regulate mitochondrial positioning along 493
filopodia in the growth cone peripheral area. Future studies examining the role of Miros in 494
mitochondrial docking at the growth cone in vivo might thus be a great interest to decipher how 495
mitochondrial positioning is regulated during axonal development. 496
497
498
499
500
501
502

23
References 503
Beck H, Flynn K, Lindenberg KS, Schwarz H, Bradke F, Di Giovanni S, Knoll B (2012) Serum Response 504 Factor (SRF)-cofilin-actin signaling axis modulates mitochondrial dynamics. Proc Natl Acad Sci 505 109: E2523-2532. 506
Bertholet AM, Delerue T, Millet AM, Moulis MF, David C, Daloyau M, Arnaune-Pelloquin L, Davezac N, 507 Mils V, Miquel MC, Rojo M, Belenguer P (2016) Mitochondrial fusion/fission dynamics in 508 neurodegeneration and neuronal plasticity. Neurobiol Dis 90: 3-19. 509
Boldogh IR, Pon LA (2006) Interactions of mitochondria with the actin cytoskeleton. Biochim Biophys 510 Acta 1763: 450-462. 511
Bovolenta P, Mason C (1987) Growth cone morphology varies with position in the developing mouse 512 visual pathway from retina to first targets. J Neurosci 7: 1447-1460. 513
Buck KB, Zheng JQ (2002) Growth cone turning induced by direct local modification of microtubule 514 dynamics. J Neurosci 22: 9358-9367. 515
Campbell PD, Shen K, Sapio MR, Glenn TD, Talbot WS, Marlow FL (2014) Unique function of Kinesin Kif5A 516 in localization of mitochondria in axons. J Neurosci 34: 14717-14732. 517
Cermak T, Doyle EL, Christian M, Wang L, Zhang Y, Schmidt C, Baller JA, Somia NV, Bogdanove AJ, Voytas 518 DF (2011) Efficient design and assembly of custom TALEN and other TAL effector-based 519 constructs for DNA targeting. Nucleic Acids Res 39: e82. 520
Chen Y, Sheng ZH (2013) Kinesin-1-syntaphilin coupling mediates activity-dependent regulation of 521 axonal mitochondrial transport. J Cell Biol 202: 351-364. 522
Courchet J, Lewis TL, Jr., Lee S, Courchet V, Liou DY, Aizawa S, Polleux F (2013) Terminal axon branching 523 is regulated by the LKB1-NUAK1 kinase pathway via presynaptic mitochondrial capture. Cell 153: 524 1510-1525. 525
Cunniff B, McKenzie AJ, Heintz NH, Howe AK (2016) AMPK activity regulates trafficking of mitochondria 526 to the leading edge during cell migration and matrix invasion. Mol Biol Cell 27: 2662-2674. 527
Dahlem TJ, Hoshijima K, Jurynec MJ, Gunther D, Starker CG, Locke AS, Weis AM, Voytas DF, Grunwald DJ 528 (2012) Simple methods for generating and detecting locus-specific mutations induced with 529 TALENs in the zebrafish genome. PLoS Genet 8: e1002861. 530
Das S, Boczan J, Gerwin C, Zald PB, Sheng ZH (2003) Regional and developmental regulation of 531 syntaphilin expression in the brain: a candidate molecular element of synaptic functional 532 differentiation. Brain Res Mol Brain Res 116: 38-49. 533
Devine MJ, Birsa N, Kittler JT (2016) Miro sculpts mitochondrial dynamics in neuronal health and 534 disease. Neurobiol Dis 90: 27-34. 535
Drerup CM, Herbert AL, Monk KR, Nechiporuk AV (2017) Regulation of mitochondria-dynactin 536 interaction and mitochondrial retrograde transport in axons. Elife 6. 537
Gasperini RJ, Pavez M, Thompson AC, Mitchell CB, Hardy H, Young KM, Chilton JK, Foa L (2017) How 538 does calcium interact with the cytoskeleton to regulate growth cone motility during axon 539 pathfinding? Mol Cell Neurosci 84: 29-35. 540
Gaynes JA, Otsuna H, Campbell DS, Manfredi JP, Levine EM, Chien CB (2015) The RNA Binding Protein 541 Igf2bp1 Is Required for Zebrafish RGC Axon Outgrowth In Vivo. PLoS One 10: e0134751. 542
Glasauer SM, Neuhauss SC (2014) Whole-genome duplication in teleost fishes and its evolutionary 543 consequences. Mol Genet Genomics 289: 1045-1060. 544
Holt CE, Harris WA (1993) Position, guidance, and mapping in the developing visual system. J Neurobiol 545 24: 1400-1422. 546
Kalinski AL, Kar AN, Craver J, Tosolini AP, Sleigh JN, Lee SJ, Hawthorne A, Brito-Vargas P, Miller-Randolph 547 S, Passino R, Shi L, Wong VSC, Picci C, Smith DS, Willis DE, Havton LA, Schiavo G, Giger RJ, 548

24
Langley B, Twiss JL (2019) Deacetylation of Miro1 by HDAC6 blocks mitochondrial transport and 549 mediates axon growth inhibition. J Cell Biol 218: 1871-1890. 550
Kang JS, Tian JH, Pan PY, Zald P, Li C, Deng C, Sheng ZH (2008) Docking of axonal mitochondria by 551 syntaphilin controls their mobility and affects short-term facilitation. Cell 132: 137-148. 552
Kay JN, Finger-Baier KC, Roeser T, Staub W, Baier H (2001) Retinal ganglion cell genesis requires lakritz, a 553 Zebrafish atonal Homolog. Neuron 30: 725-736. 554
Kimmel CB, Ballard WW, Kimmel SR, Ullmann B, Schilling TF (1995) Stages of embryonic development of 555 the zebrafish. Dev Dyn 203: 253-310. 556
Kwan KM, Fujimoto E, Grabher C, Mangum BD, Hardy ME, Campbell DS, Parant JM, Yost HJ, Kanki JP, 557 Chien CB (2007) The Tol2kit: a multisite gateway-based construction kit for Tol2 transposon 558 transgenesis constructs. Dev Dyn 236: 3088-3099. 559
Lewis TL, Jr., Turi GF, Kwon SK, Losonczy A, Polleux F (2016) Progressive Decrease of Mitochondrial 560 Motility during Maturation of Cortical Axons In Vitro and In Vivo. Curr Biol 26: 2602-2608. 561
Liew WC, Bartfai R, Lim Z, Sreenivasan R, Siegfried KR, Orban L (2012) Polygenic sex determination 562 system in zebrafish. PLoS One 7: e34397. 563
Lopez-Domenech G, Covill-Cooke C, Ivankovic D, Halff EF, Sheehan DF, Norkett R, Birsa N, Kittler JT 564 (2018) Miro proteins coordinate microtubule- and actin-dependent mitochondrial transport and 565 distribution. EMBO J 37: 321-336. 566
Maack G, Segner H (2003) Morphological development of the gonads in zebrafish. J Fish Biol 62: 895-567 906. 568
Mason CA, Wang LC (1997) Growth cone form is behavior-specific and, consequently, position-specific 569 along the retinal axon pathway. J Neurosci 17: 1086-1100. 570
Melkov A, Abdu U (2018) Regulation of long-distance transport of mitochondria along microtubules. Cell 571 Mol Life Sci 75: 163-176. 572
Misko A, Jiang S, Wegorzewska I, Milbrandt J, Baloh RH (2010) Mitofusin 2 is necessary for transport of 573 axonal mitochondria and interacts with the Miro/Milton complex. J Neurosci 30: 4232-4240. 574
Moriyoshi K, Richards LJ, Akazawa C, O'Leary DD, Nakanishi S (1996) Labeling neural cells using 575 adenoviral gene transfer of membrane-targeted GFP. Neuron 16: 255-260. 576
Morris RL, Hollenbeck PJ (1993) The regulation of bidirectional mitochondrial transport is coordinated 577 with axonal outgrowth. J Cell Sci 104 ( Pt 3): 917-927. 578
Neumann S, Chassefeyre R, Campbell GE, Encalada SE (2017) KymoAnalyzer: a software tool for the 579 quantitative analysis of intracellular transport in neurons. Traffic 18: 71-88. 580
Ota S, Hisano Y, Muraki M, Hoshijima K, Dahlem TJ, Grunwald DJ, Okada Y, Kawahara A (2013) Efficient 581 identification of TALEN-mediated genome modifications using heteroduplex mobility assays. 582 Genes Cells 18: 450-458. 583
Parant JM, George SA, Pryor R, Wittwer CT, Yost HJ (2009) A rapid and efficient method of genotyping 584 zebrafish mutants. Dev Dyn 238: 3168-3174. 585
Pittman AJ, Law MY, Chien CB (2008) Pathfinding in a large vertebrate axon tract: isotypic interactions 586 guide retinotectal axons at multiple choice points. Development 135: 2865-2871. 587
Plucinska G, Paquet D, Hruscha A, Godinho L, Haass C, Schmid B, Misgeld T (2012) In vivo imaging of 588 disease-related mitochondrial dynamics in a vertebrate model system. J Neurosci 32: 16203-589 16212. 590
Poulain FE, Chien CB (2013) Proteoglycan-mediated axon degeneration corrects pretarget topographic 591 sorting errors. Neuron 78: 49-56. 592
Poulain FE, Gaynes JA, Stacher Horndli C, Law MY, Chien CB (2010) Analyzing retinal axon guidance in 593 zebrafish. Methods Cell Biol 100: 3-26. 594
Provost E, Rhee J, Leach SD (2007) Viral 2A peptides allow expression of multiple proteins from a single 595 ORF in transgenic zebrafish embryos. Genesis 45: 625-629. 596

25
Riedl J, Crevenna AH, Kessenbrock K, Yu JH, Neukirchen D, Bista M, Bradke F, Jenne D, Holak TA, Werb Z, 597 Sixt M, Wedlich-Soldner R (2008) Lifeact: a versatile marker to visualize F-actin. Nat Methods 5: 598 605-607. 599
Sainath R, Armijo-Weingart L, Ketscheck A, Xu Z, Li S, Gallo G (2017) Chondroitin sulfate proteoglycans 600 negatively regulate the positioning of mitochondria and endoplasmic reticulum to distal axons. 601 Dev Neurobiol 77: 1351-1370. 602
Sakuma T, Hosoi S, Woltjen K, Suzuki K, Kashiwagi K, Wada H, Ochiai H, Miyamoto T, Kawai N, Sasakura 603 Y, Matsuura S, Okada Y, Kawahara A, Hayashi S, Yamamoto T (2013) Efficient TALEN construction 604 and evaluation methods for human cell and animal applications. Genes Cells 18: 315-326. 605
Saotome M, Safiulina D, Szabadkai G, Das S, Fransson A, Aspenstrom P, Rizzuto R, Hajnoczky G (2008) 606 Bidirectional Ca2+-dependent control of mitochondrial dynamics by the Miro GTPase. Proc Natl 607 Acad Sci 105: 20728-20733. 608
Schindelin J, Arganda-Carreras I, Frise E, Kaynig V, Longair M, Pietzsch T, Preibisch S, Rueden C, Saalfeld 609 S, Schmid B, Tinevez JY, White DJ, Hartenstein V, Eliceiri K, Tomancak P, Cardona A (2012) Fiji: an 610 open-source platform for biological-image analysis. Nat Methods 9: 676-682. 611
Schneider CA, Rasband WS, Eliceiri KW (2012) NIH Image to ImageJ: 25 years of image analysis. Nat 612 Methods 9: 671-675. 613
Shneyer BI, Usaj M, Henn A (2016) Myo19 is an outer mitochondrial membrane motor and effector of 614 starvation-induced filopodia. J Cell Sci 129: 543-556. 615
Shneyer BI, Usaj M, Wiesel-Motiuk N, Regev R, Henn A (2017) ROS induced distribution of mitochondria 616 to filopodia by Myo19 depends on a class specific tryptophan in the motor domain. Sci Rep 7: 617 11577. 618
Smit-Rigter L, Rajendran R, Silva CA, Spierenburg L, Groeneweg F, Ruimschotel EM, van Versendaal D, 619 van der Togt C, Eysel UT, Heimel JA, Lohmann C, Levelt CN (2016) Mitochondrial dynamics in 620 visual cortex are limited in vivo and not affected by axonal structural plasticity. Curr Biol 26: 621 2609-2616. 622
Smith GM, Gallo G (2018) The role of mitochondria in axon development and regeneration. Dev 623 Neurobiol 78: 221-237. 624
Steketee MB, Moysidis SN, Weinstein JE, Kreymerman A, Silva JP, Iqbal S, Goldberg JL (2012) 625 Mitochondrial dynamics regulate growth cone motility, guidance, and neurite growth rate in 626 perinatal retinal ganglion cells in vitro. Invest Ophthalmol Vis Sci 53: 7402-7411. 627
Surin AM, Khiroug S, Gorbacheva LR, Khodorov BI, Pinelis VG, Khiroug L (2012) Comparative analysis of 628 cytosolic and mitochondrial ATP synthesis in embryonic and postnatal hippocampal neuronal 629 cultures. Front Mol Neurosci 5: 102. 630
Suter DM, Schaefer AW, Forscher P (2004) Microtubule dynamics are necessary for SRC family kinase-631 dependent growth cone steering. Curr Biol 14: 1194-1199. 632
Sutherland DJ, Pujic Z, Goodhill GJ (2014) Calcium signaling in axon guidance. Trends Neurosci 37: 424-633 432. 634
Thevenaz P, Ruttimann UE, Unser M (1998) A pyramid approach to subpixel registration based on 635 intensity. IEEE Trans Image Process 7: 27-41. 636
Thisse C, Thisse B (2008) High-resolution in situ hybridization to whole-mount zebrafish embryos. Nat 637 Protoc 3: 59-69. 638
Trevisan T, Pendin D, Montagna A, Bova S, Ghelli AM, Daga A (2018) Manipulation of Mitochondria 639 Dynamics Reveals Separate Roles for Form and Function in Mitochondria Distribution. Cell Rep 640 23: 1742-1753. 641
Vaarmann A, Mandel M, Zeb A, Wareski P, Liiv J, Kuum M, Antsov E, Liiv M, Cagalinec M, Choubey V, 642 Kaasik A (2016) Mitochondrial biogenesis is required for axonal growth. Development 143: 643 1981-1992. 644
26
Wan Y, Otsuna H, Holman HA, Bagley B, Ito M, Lewis AK, Colasanto M, Kardon G, Ito K, Hansen C (2017) 645 FluoRender: joint freehand segmentation and visualization for many-channel fluorescence data 646 analysis. BMC Bioinformatics. 18:280. 647
Wehnekamp F, Plucinska G, Thong R, Misgeld T, Lamb DC (2019) Nanoresolution real-time 3D orbital 648 tracking for studying mitochondrial trafficking in vertebrate axons in vivo. Elife 8. 649
Yoon BC, Jung H, Dwivedy A, O'Hare CM, Zivraj KH, Holt CE (2012) Local translation of extranuclear lamin 650 B promotes axon maintenance. Cell 148: 752-764. 651
Zala D, Hinckelmann MV, Yu H, Lyra da Cunha MM, Liot G, Cordelieres FP, Marco S, Saudou F (2013) 652 Vesicular glycolysis provides on-board energy for fast axonal transport. Cell 152: 479-491. 653
Zhou B, Yu P, Lin MY, Sun T, Chen Y, Sheng ZH (2016) Facilitation of axon regeneration by enhancing 654 mitochondrial transport and rescuing energy deficits. J Cell Biol 214: 103-119. 655
656

27
Figure legends 657
Figure 1. Live imaging approach and analysis. (A) Individual retinal axons and mitochondria were 658
mosaically labeled by co-injecting isl2b:mitoEGFP-2A-TagRFPCAAX and isl2b:Lifeact-TagRFP plasmids at 659
one-cell stage. isl2b:Lifeact-TagRFP was used to improve the visualization of single axons and growth 660
cone (GC) filopodia (see Main text and Materials and Methods for more details). After removal of the 661
contralateral eye, axons growing along the optic tract towards the optic tectum (OT) and their 662
mitochondria were imaged in a lateral view between 50 and 54 hpf (Δt = 1 min). A: anterior, D: dorsal, 663
hpf: hours post fertilization, OT: optic tectum, P: posterior, V: ventral. (B) Growth cone total and central 664
areas visualized with TagRFP/TagRFPCAAX were manually segmented and used as ROIs for segmenting 665
mitochondrial signals using the particle analysis tool in ImageJ. Two different thresholds were used to 666
analyze mitochondrial particles: a threshold of 55 was applied to the growth cone central area to 667
segment the main mitochondrial cluster, and a threshold of 20 was applied to the growth cone total 668
area to segment smaller individual mitochondria present in the peripheral area (red arrowheads). Time-669
lapse recordings were classified according to growth cone behavior. Growth cone leading edge and 670
proximal growth cone are indicated in the merged image, see Materials and Methods for definitions. 671
Lateral view, confocal maximal projections. Scale bar: 5 μm. (C) Volumes of mitochondria and GC total 672
and central volumes were calculated using 3D analysis. GC total and central volumes visualized with 673
TagRFP/TagRFPCAAX were calculated on binary z-projections and used as VOIs for segmenting 674
mitochondrial volumes using the voxel counter plugin in ImageJ (see also Movie 1). 675
Figure 2. Mitochondrial distribution changes with growth cone behavior. (A) Representative time-lapse 676
images of mitochondria (mitoEGFP, white) in distal retinal axons and growth cones (labeled with TagRFP, 677
delineated in orange and shown in left panels) classified as pausing or advancing (see Movies 2-4). Most 678
growth cones alternate periods of pausing and advancing/elongating, resulting in net axon growth, as 679

28
shown in the lower panels. The red asterisk indicates mitochondria in neighboring axons. Scale bar: 5 680
μm. (B-C’) Quantification of the mitochondrial occupancy (in %) of the growth cone total volume (B), 681
total area (B’), central volume (C) and central area (C’). (D-D’) Quantification of the mitochondrial 682
volume in the peripheral growth cone (D), and of the number of mitochondria in the growth cone 683
peripheral area (D’). (E) Quantification of the distance between the largest mitochondrial cluster and the 684
growth cone leading edge. When growth cones elongate, the distance to the growth cone leading edge 685
increases significantly. Data from 12 independent experiments (pausing: n = 11, advancing: n = 8) are 686
shown as mean + s.e.m. Statistical analysis (B-E): unpaired t-test, ***P < 0.001. 687
Figure 3. Pioneering mitochondrial clusters localize near the leading edge in advancing growth cones. (A) 688
Representative time-lapse images of mitochondria (mitoEGFP, white) in an advancing growth cone (see 689
Movie 5). While the main mitochondrial cluster (green arrow) lags behind during growth cone advance, 690
some small pioneering mitochondrial clusters (blue arrows) appear in close proximity to the leading 691
edge. Lateral view, confocal maximal projections. Scale bar: 3 μm. (B,C) EGFP intensity profiles 692
calculated along a line between the initial proximal growth cone and final leading edge to analyze the 693
distribution of mitochondria along the advancing growth cone at successive time points shown in panel 694
A. (C) The orange and green lines correspond to the fluorescent intensities of mitochondria in the 695
growth cone and at the proximal growth cone, respectively (see panel B: Analysis). 696
Figure 4. Anterograde mitochondrial transport correlates with axonal outgrowth. (A) Representative 697
kymograph of mitochondria (mitoEGFP, white) in a distal axon whose growth cone alternates between 698
advancing and pausing. The first and last frames of the time-lapse recording (Movie 4) are shown with 699
axon and growth cone delineated in orange. Confocal maximal projections. Scale bar: 5 μm. The growth 700
cone leading edge and proximal growth cone (green line) are indicated on the kymograph and 701
kymograph analysis panels. (B) Quantification of net transport, analyzed by counting the number of 702
mitochondria moving anterogradely or retrogradely. Data from 12 independent experiments (pausing: n 703

29
= 11, advancing: n = 8) are shown as mean + s.e.m. Statistical analysis: Two-way ANOVA with post-hoc 704
Bonferroni test, ** P < 0.01, ***P < 0.001. (C), Quantification of the percentage of time mitochondria 705
spent in a mobile or stationary state. A significant increase in time spent in motion (C) is observed 706
proximally to growth cones that are advancing (P = 0.013). Data from 12 independent experiments 707
(pausing: n = 11, advancing: n = 8) are shown as mean + s.e.m. Statistical analysis: unpaired t-test. (D) 708
Quantification of mitochondrial flux, showing a trend towards more mitochondria arriving versus leaving 709
the growth cone in both pausing and advancing growth cones. Data from 12 independent experiments 710
(pausing: n = 11, advancing: n = 8) are shown as mean + s.e.m. Statistical analysis: unpaired t-test. (E) 711
Linear regression analysis between the number of mitochondria arriving at a growth cone and growth 712
cone advance (n = 12). 713
Figure 5. Zebrafish Syntaphilins are expressed in RGCs during development. (A) Quantification of snpha 714
and snphb mRNA levels during embryonic development by RT-ddPCR. mRNA levels were normalized to 715
that of gapdh used as a control. Data from 3 independent experiments are shown as mean + s.e.m. (B) 716
Lateral views of whole embryos stained for snphb by ISH show predominant expression in the brain at 717
48, 72, and 120 hpf. Snphb is also increasingly expressed in the RGC layer over time. Scale bar: 400 μm 718
(whole embryos) and 200 μm (eyes). (C) Dorsal views of WT and RGC-deficient lak mutant embryos 719
stained for snphb by ISH at 72 hpf. Expression of snphb is decreased in the retina of lak embryos 720
(arrows). Scale bar: 200 μm. (D) Quantification of snpha and snphb mRNA levels in the eyes of WT and 721
lak embryos at 72 hpf analyzed by RT-ddPCR. Transcripts levels were normalized to that of 18s used as a 722
control. Data from 3 experiments are shown as mean + s.e.m. Statistical analysis: unpaired t-test, ***P < 723
0.001. (E) TagBFP-Snphb localizes to the growth cone of elongating axons in vivo. Isl2b:TagBFP-snphb, 724
isl2b:mitoEGFP-2A-TagRFPCAAX, and isl2b:Lifeact-TagRFP were co-expressed in individual RGCs. TagBFP-725
Snphb and mitochondria are both present in the growth cone (arrow in merged image). Lateral view, 726
confocal maximal projections. Scale bar: 5 μm. 727

30
Figure 6. Zebrafish Syntaphilins anchor mitochondria in mature retinal axons. (A) Domain structure of 728
human SNPH. Both the microtubule-binding domain (MTB) and transmembrane domains (TMs) are 729
highly conserved in zebrafish Snpha and Snphb (see also extended data Figure 6-1). The red asterisk 730
indicates the position of the TALEN target region. (D) Mutations in snpha and snphb were introduced by 731
TALEN mutagenesis. Red lines indicate the deleted sequences. Changes in amino acids are shown in red. 732
RT-PCR analysis of snpha and snphb in WT and db embryos demonstrate the presence of shorter 733
transcripts in the mutants. (C) Individual retinal axons and mitochondria were mosaically labeled by 734
injecting isl2b:mitoEGFP-2A-TagRFPCAAX at one-cell stage. After removal of the contralateral eye, 735
mature axons of the optic tract and their mitochondria were imaged in a lateral view at 120 hpf (Δt = 15 736
sec). (D,E) Quantification of the percentage of stationary mitochondria using kymograph analysis shows 737
a reduction in stalled mitochondria in axons from snph db mutants. Data from 2 independent 738
experiments (WT: n = 7, db: n = 8) are shown as mean + s.e.m. Statistical analysis: unpaired t-test, **P < 739
0.01. 740
Extended Data Figure 6-1. Zebrafish Syntaphilins have a highly conserved microtubule-binding domain 741
and mitochondrial attachment sites. (A) Depiction of the domain structure of human SNPH and zebrafish 742
Snpha and Snphb. The microtubule-binding domain (MTB) and transmembrane domains (TMs) are 743
indicated in orange and green, respectively. (B) Sequence alignment of human SNPH and zebrafish 744
Snpha and Snphb. The MTB (orange) and TMs (green) are highly conserved, suggesting a conserved 745
function in anchoring mitochondria to microtubules. 746
Figure 7. Syntaphilins participate in mitochondrial docking at the growth cone but do not regulate axon 747
elongation. (A-B’) Quantification of the mitochondrial occupancy (in %) of the growth cone total volume 748
(A), total area (A’), central volume (B) and central area (B’) in WT and snph db. Mitochondrial occupancy 749
is decreased in snph db. (C-C’) Quantification of the mitochondrial volume in the peripheral growth cone 750
(C), and of the number of mitochondria in the growth cone peripheral area (C’) in WT and snph db. 751
31
(D,D’) Quantification of the distance between the largest mitochondrial cluster and the growth cone 752
leading edge in WT and snph db. We quantified the distance from the leading edge separately in pausing 753
and advancing growth cones as it varies depending on growth cone status (see Fig. 2E). Mitochondria 754
are located further from the leading edge in retinal growth cones of db compared to WT. (E-G) Reduced 755
mitochondrial occupancy in the growth cone of snph db is accompanied by an increased removal of 756
mitochondria from the growth cone. More mitochondria leave the growth cone per minute in db, while 757
no difference is detected for arriving mitochondria (E). Quantification of net mitochondrial transport 758
proximally to the growth cone (F) shows more mitochondria moving retrogradely in snph db, which is 759
accompanied by a decreased percentage of mitochondria moving in the anterograde direction. No 760
differences in percentage time in anterograde or retrograde motion were found (G). (H,I) Quantification 761
of growth cone morphology shows no differences in growth cone total and central areas (H) and number 762
of filopodia (I) between db and WT embryos. (J) Axon elongation is not statistically different between db 763
and WT embryos. Data from 12 independent experiments per genotype are shown as mean + s.e.m. 764
Statistical analysis: unpaired t-test, **P < 0.01, ***P < 0.001. 765
Figure 8. Syntaphilin contributes to the localization of pioneering mitochondrial clusters near the leading 766
edge in advancing growth cones. (A) Representative time-lapse images of mitochondria (mitoEGFP, 767
white) in an advancing growth cone (delineated in orange) in a db embryo. Like in WT (Fig. 3), the main 768
mitochondrial cluster lags behind during growth cone advance while some pioneering mitochondria 769
appear in close proximity to the leading edge. Lateral view, confocal maximal projections. Scale bar: 3 770
μm. (B,C) Fluorescent intensity profiles show the distribution of mitoEGFP fluorescence at various time 771
points along the advancing growth cone shown in panel A. Orange and green lines correspond to 772
fluorescent intensities of mitochondria in the growth cone and the proximal growth cone, respectively. 773
Arrows show peaks of fluorescence corresponding to localizations of mitochondria in the growth cone 774
(see panel A). (D-F) Quantification of pioneering mitochondrial cluster total area (D), number (E), and 775

32
dynamics (% of time present during advance) (F). Pioneering mitochondrial clusters occupy a reduced 776
area in snph db embryos compared to WT. Data from 12 independent experiments per genotype are 777
shown as mean + s.e.m. Statistical analysis: unpaired t-test. 778
Multimedia legends 779
Movie 1. Representative 3D visualization of mitochondria in a pausing growth cone. Video 780
corresponding to Figure 1C showing mitochondria (green) in a distal retinal axon and growth cone (red) 781
pausing along the optic tract. Scale bar: 5 μm. 782
Movie 2. Representative time-lapse recording of mitochondrial dynamics in a pausing growth cone. 783
Time-lapse video corresponding to Figure 2A showing mitochondria (green, white) in a distal retinal 784
axon and growth cone (red) pausing along the optic tract. Images were acquired at 1 min intervals for 48 785
min. Each frame is a confocal image stack maximal projection, lateral view, and anterior is on the left. 786
Time stamp format: hr:min. Scale bar: 5 μm. 787
Movie 3. Representative time-lapse recording of mitochondrial dynamics in an advancing growth cone. 788
Time-lapse video corresponding to Figure 2A showing mitochondria (green, white) in a distal retinal 789
axon and growth cone (red) elongating along the optic tract. Images were acquired at 1 min intervals for 790
48 min. Each frame is a confocal image stack maximal projection, lateral view, and anterior is on the left. 791
Time stamp format: hr:min. Scale bar: 5 μm. 792
Movie 4. Representative time-lapse recording of mitochondrial dynamics in a growth cone that 793
combines pausing and advancing. Time-lapse video corresponding to Figure 2A showing mitochondria 794
(green, white) in a distal retinal axon and growth cone (red) that alternates between pausing and 795
elongating behaviors. The growth cone is pausing during the majority of the recording, but advances 796
intermittently (e.g. from 00:00 to 00:18, 01:39 to 01:55, and 02:24 to 02:39). Images were acquired at 1 797

33
min intervals for 160 min. Each frame is a confocal image stack maximal projection, lateral view, and 798
anterior is on the left. Time stamp format: hr:min. Scale bar: 5 μm. 799
Movie 5. A subset of mitochondria localizes to the leading edge of the growth cone during elongation. 800
Representative time-lapse video corresponding to Figure 3A showing mitochondria (green, white) in a 801
distal retinal axon and growth cone (red) elongating along the optic tract. Images were acquired at 1 min 802
intervals for 36 min. Note that the growth cone is elongating from 00:10 to 00:25. During this 803
elongation, most mitochondria lag behind, but a subset of smaller mitochondria localizes adjacent to the 804
leading edge. Each frame is confocal image stack maximal projection, lateral view, and anterior is on the 805
left. Time stamp format: hr:min. Scale bar: 3 μm. 806
Movie 6. Representative 3D visualization of mitochondria in a pausing growth cone of a snph db mutant 807
embryo. Video showing mitochondria (green) in a distal retinal axon and growth cone (red) pausing 808
along the optic tract. Scale bar: 5 μm. 809
Movie 7. Representative time-lapse recording of mitochondrial dynamics in a growth cone of a snph db 810
mutant embryo. Time-lapse video showing mitochondria (green, white) in a distal retinal axon and 811
growth cone (red) elongating along the optic tract of a snph db embryo. Images were acquired at 1 min 812
intervals for 120 min. Note that the growth cone is pausing during the first minutes (00:00 to 00:47), 813
after which it advances. Each frame is a confocal image stack maximal projection, lateral view, and 814
anterior is on the left. Time stamp format: hr:min. Scale bar: 5 μm. 815
Movie 8. Representative time-lapse recording of mitochondrial dynamics in a growth cone of a snph db 816
mutant embryo. Time-lapse video showing mitochondria (green, white) in a distal retinal axon and 817
growth cone (red) elongating along the optic tract of a snph db embryo. Images were acquired at 1 min 818
intervals for 96 min. Note that the growth cone is combining periods of pausing with advancing (from 819

34
00:00 to 00:10 and 00:53 till end). Each frame is a confocal image stack maximal projection, lateral view, 820
and anterior is on the left. Time stamp format: hr:min. Scale bar: 5 μm. 821
Tables 822
Table 1. Primers and probes used for ddPCR. 823
Gene Forward primer Reverse primer Taqman probe Amplicon size
snpha GCAGCAGTTACTCAGCATCA TGCCATGATTCTCACCACAG TCCTGCAAGTGCACAGAGAGCATT 117
snphb CACCTGTCAGTAACCGTGAT TATGTGACGCCTATGGGTTG AGCAGCAGTAGCAATTCAGGGTCA 107
gapdh CCAAGGCTGTAGGCAAAGTA GACTGTCAGATCCACAACAGAG ACACGGAAGGCCATACCAGTAAGC 101
18s GCCGCTAGAGGTGAAATTCT TCGGAACTACGACGGTATCT CAAGACGGACGAAAGCGAAAGCAT 129
824
Table 2. Summary of statistical analyses. 825
Figure Measurement Data structure Type of test Comparison Statistical value
Fig. 2B Mitochondrial occupancy
(GC total volume)
Normal
Unpaired t-test
Pausing vs. advancing GC P = 0.4065
t(17) = 0.8511
Fig. 2B’
Mitochondrial occupancy
(GC total area)
Normal
Unpaired t-test
Pausing vs. advancing GC
P = 0.4310
t(17) = 0.8067
Fig. 2C Mitochondrial occupancy
(GC central volume)
Normal
Unpaired t-test
Pausing vs. advancing GC P = 0.2829
t(17) = 1.109

35
Fig. 2C’
Mitochondrial occupancy
(GC central area)
Normal
Unpaired t-test
Pausing vs. advancing GC
P = 0.2325
t(17) = 1.238
Fig. 2D Mitochondrial volume
(peripheral volume)
Normal
Unpaired t-test
Pausing vs. advancing GC P = 0.4444
t(17) = 0.7831
Fig. 2D’
Number of mitochondria
in GC peripheral area
Normal
Unpaired t-test
Pausing vs. advancing GC
P = 0.7028
t(15) = 0.3889
Fig. 2E Distance from leading
edge
Normal
Unpaired t-test
Pausing vs. advancing GC P < 0.0001
t(17) = 6.740
Fig. 4B % Net mitochondrial
transport
Normal Two-way ANOVA
(post-hoc Bonferroni)
Pausing vs. advancing GC P = 0.9955
F(1,34) = 0.00003
Fig. 4C % Time mitochondria
spent mobile
Normal
Unpaired t-test
Pausing vs. advancing GC P = 0.0131
t(17) = 2.772
Fig. 4C
% Time mitochondria
spent stationary
Normal
Unpaired t-test
Pausing vs. advancing GC
P = 0.0075
t(17) = 3.034
Fig. 4D Mitochondrial flux
(arriving mitochondria)
Normal
Unpaired t-test
Pausing vs. advancing GC P = 0.4666
t(17) = 0.7448
Fig. 4D
Mitochondrial flux
(leaving mitochondria)
Normal
Unpaired t-test
Pausing vs. advancing GC
P = 0.3617
t(17) = 0.9374
Fig. 4E
Number of arriving
mitochondria vs. axon
growth
Normal
Linear regression
P = 0.0071
r² = 0.5324

36
Fig. 5D
snpha expression
Normal
Unpaired t-test
WT vs. lak
P < 0.0001
t(4) = 18.33
Fig. 5D
snphb expression
Normal
Unpaired t-test
WT vs. lak
P < 0.0001
t(4) = 17.84
Fig. 6E % Stationary
mitochondria
Normal
Unpaired t-test
WT vs. snph db P = 0.0074
t(13) = 3.168
Fig. 7A
GC total occupancy
(% volume)
Normal
Unpaired t-test
WT vs. snph db P = 0.0023
t(22) = 3.446
Fig. 7A’
GC total occupancy
(% area)
Normal
Unpaired t-test
WT vs. snph db
P = 0.0178
t(22) = 2.562
Fig. 7B
GC central occupancy
(% volume)
Normal
Unpaired t-test
WT vs. snph db
P = 0.0184
t(22) = 2.543
Fig. 7B’
GC central occupancy
(% area)
Normal
Unpaired t-test
WT vs. snph db
P = 0.0071
t(22) = 2.967
Fig. 7C Peripheral mitochondrial
volume
Normal
Unpaired t-test
WT vs. snph db P = 0.2765
t(22) = 1.116
Fig. 7C’ Number of mitochondria
in peripheral area
Normal
Unpaired t-test
WT vs. snph db P = 0.6030
t(21) = 0.5278
Fig. 7D Distance from leading
edge (pausing GC)
Normal
Unpaired t-test
WT vs. snph db P = 0.0003
t(20) = 4.403

37
Fig. 7D’ Distance from leading
edge (advancing GC)
Normal
Unpaired t-test
WT vs. snph db P = 0.1080
t(16) = 1.703
Fig. 7E Mitochondrial flux
(arriving mitochondria)
Normal
Unpaired t-test
WT vs. snph db P = 0.4976
t(22) = 0.6904
Fig. 7E
Mitochondrial flux
(leaving mitochondria)
Normal
Unpaired t-test
WT vs. snph db
P = 0.0412
t(22) = 2.168
Fig. 7F % Net mitochondrial
transport (anterograde)
Normal
Unpaired t-test
WT vs. snph db P = 0.0178
t(22) = 2.561
Fig. 7F
% Net mitochondrial
transport (retrograde)
Normal
Unpaired t-test
WT vs. snph db
P = 0.0529
t(22) = 2.046
Fig. 7G
% Time mitochondria
spent in motion
(anterograde)
Normal
Unpaired t-test
WT vs. snph db
P = 0.3330
t(22) = 0.9900
Fig. 7G
% Time mitochondria
spent in motion
(retrograde)
Normal
Unpaired t-test
WT vs. snph db
P = 0.5596
t(22) = 0.5924
Fig. 7H
GC total area
Normal
Unpaired t-test
WT vs. snph db
P = 0.2904
t(22) = 1.083
Fig. 7H
GC central area
Normal
Unpaired t-test
WT vs. snph db
P = 0.3869
t(22) = 0.8829
Fig. 7I
Number of filopodia
Normal
Unpaired t-test
WT vs. snph db
P = 0.6775
t(22) = 0.42154

38
Fig. 7J
Growth rate
Normal
Unpaired t-test
WT vs. snph db
P = 0.8256
t(15) = 0.2243
Fig. 8D
Pioneering cluster area
Normal
Unpaired t-test
WT vs. snph db
P = 0.0166
t(15) = 2.697
Fig. 8E
Number of pioneering
clusters
Normal
Unpaired t-test
WT vs. snph db
P = 0.1865
t(15) = 1.385
Fig. 8F Mitochondria presence
(% time)
Normal
Unpaired t-test
WT vs. snph db P = 0.1994
t(15) = 1.343
826

A
Eye removal30 - 32 hpf
OT
One-cell stage injection50 - 54 hpfLive growth cone imaging
D
V
A P
A P
OT
BConfocal image
TagR
FP/T
agR
FPC
AAX
mito
EGFP
2D image segmentation
GC
cen
tral a
rea
delin
eatio
n
Tota
l GC
del
inea
tion
Threshold 1 applied toGC central area for
mitochondrial cluster
GC classification
Pausing GC
Advancing GC
Dorsal view
Lateral view
Leading edge
Proximal GCThreshold 2 applied to
GC total area for peripheral mitochondria
C3D volume segmentation: binary projections
TagRFP/TagRFPCAAX mitoEGFP
Mitochondrial volume in central GC
Mitochondrial volume in peripheral GC

A mitoEGFP00:00
00:00
00:12
00:12
00:24
00:24
00:36
00:36
Paus
ing
GC
Adva
ncin
g G
C
B C DGC total volume GC central volume GC peripheral volume
00:06 00:33 01:43 02:06
*
TagRFP00:00
00:00
00:06
Pausing Advancing
Adva
ncin
g G
C
Pausing Advancing Pausing Advancing
B’ C’ D’GC total area GC central area GC peripheral area
E
Pausing Advancing Pausing Advancing Pausing Advancing
Pausing Advancing
P = 0.44P = 0.28P = 0.41
P = 0.43 P = 0.23 P = 0.70

A mitoEGFP00:10 00:13 00:16 00:19 00:22 00:25
AnalysisFluorescent intensity
profile along lines over time
BmitoEGFP
Background
C
Initial mitochondrial cluster
Final mitochondrial cluster
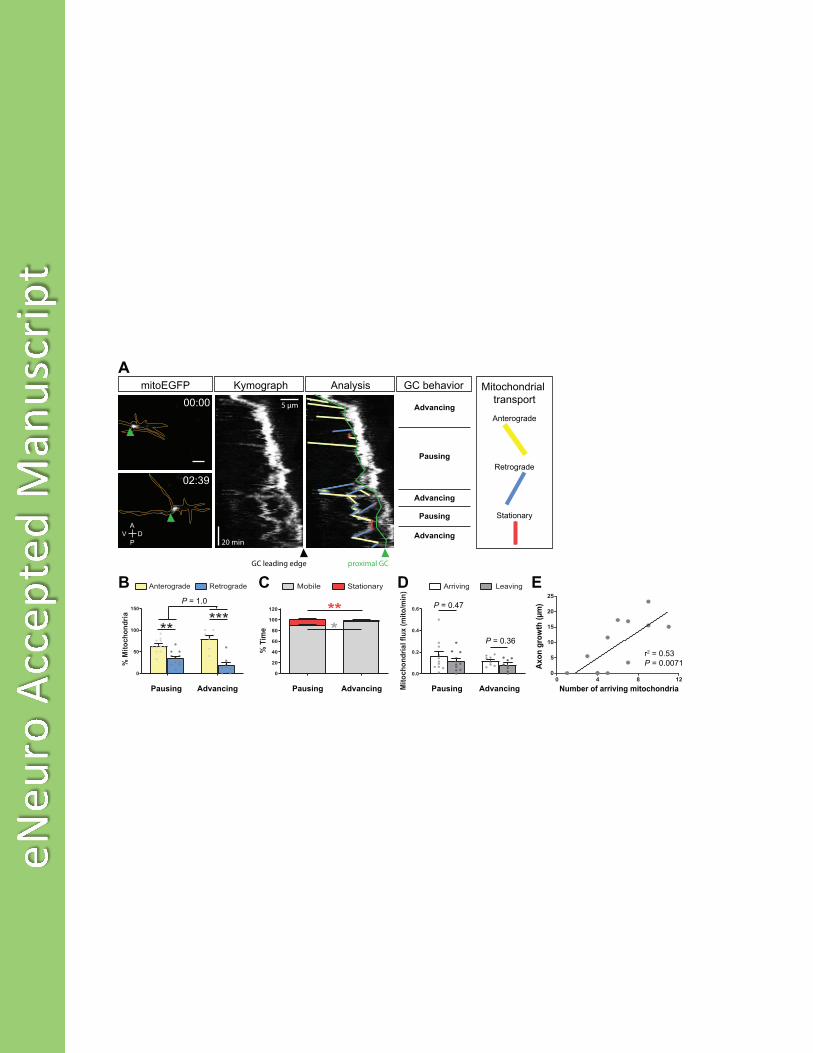
A
00:00
02:39
mitoEGFP Kymograph Analysis GC behavior
Anterograde
Retrograde
5 μm
20 min
GC leading edge proximal GC
B C
AD
PV
D E
Mitochondrial transport
Stationary
Pausing
Pausing
Advancing
Advancing
Advancing
Pausing AdvancingPausing Advancing Pausing Advancing
0
50
100
150
Anterograde Retrograde
*****
%M
itoch
ondr
ia
0
20
40
60
80
100
120
Mobile Stationary
*
%Ti
me
**
0.0
0.2
0.4
0.6
Arriving Leaving
Mito
chon
dria
lflu
x(m
ito/m
in)
P = 0.47
P = 0.36
P = 1.0
r2 = 0.53P = 0.0071
Number of arriving mitochondria
Axon
gro
wth
(μm
)

WT
48 h
pf72
hpf
120
hpf
snphb
D
V
A PD
V
A P
RGC layer
A
D
B
C
72 h
pf
snphb
WT lak
E
A
P
TagBFP-SnphB mitoEGFP TagRFP

WT snph db
WT
snph
db
2 min
5 μm
D
E
120 hpf
Mitochondrial transport in mature retinal axons
D
V
A P
C
Live imaging
A1 538
MTB TM1&2Human SNPH
hSNPH 130 IRHLKARLKDTQDRLQDRDTEIDDLKTQLSRMQEDWIEEECHRVEAQLALKEARKEIKQLKQVIDTVKNNLIDK 203zSnpha 91 IRHLRARLKENVERLHDRDSEIEELRMQLTRMQEDWIEEECHRIEAQLALKEARMEIRQLQHTVETVRSNLGPH 164zSnphb 123 IRHLRARLKETIERLQDRDSEIDELRTQLTRMQEDWIEEECHRVEAQLALKEARREIHQLKEVVDVVKSSLGDT 196 ****:****:. :**:***:**::*: **:*************:********** **:**:..::.*:..*
hSNPH 470 IVDLLAVVVPAVPTVAWLC 488zSnpha 478 LIDLLAVAVPVVPTLAWLC 496zSnphb 618 LVDLLAVVVPVVPTVAWFC 636 ::*****.**.***:**:*
hSNPH 497 IYNISSLLRGCCTVALHSI 516zSnpha 505 MYNMGSLLRGCCAVALHSL 524zSnphb 645 IYHIGSLLRGCCTVALHSL 664 :*::.*******:*****:
MTB
TM1
TM2
*
WT ACGCCACTGCAGCAGAAGGAAGTGTGTATTCGGCATCTACGTGCACGGCTAAAAGA ACGCCACTGCAGCAGAAGGAA--------------TCTACGTGCACGGCTAAAAGA
WT 83 P L Q Q K E V C I S T C
WT R H L R A R L K E NT A K R K C G E A S
WT V E R L H D R D S 109R P R L - - - - -
WT CTCCTGAGCAATACCTCACCCCACTGCAACAGAAAGAGGTGTGCATCAGGCACCTG CTCCTGAGCAATACCTCACCCCACTG----AGAAAGAGGTGTGCATCAGGCACCTG
WT 109 P E Q Y L T P L QR
WT Q K E V C I R H L 126K R C A S G T - -
Bsnpha
WT db
snphb
WT db

A
WT snph db
C
A’ B’ C’
Mitochondrial transport
Mitochondrial distribution
Growth cone morphology
JH IAxon growth
B
D D’
WT snph db WT snph db
WT snph dbWT snph dbWT snph db
Advancing GC
WT snph db
Pausing GC
WT snph db
WT snph db WT snph dbWT snph db
Total GC (T) Central area (C)
P = 0.018 P = 0.28
P = 0.018 P = 0.60
P = 0.11
GCtotalo
ccup
ancy
(%area)
GCtotalo
ccup
ancy
(%vo
lume)
Distance
fromleadinged
ge(μm)
Distance
fromleadinged
ge(μm)
Perip
heralm
itoch
ondrial
volume(μm3)
Numbe
rofm
itochon
dria
inpe
ripheralarea
E F G
Arriving Leaving0.0
0.1
0.2
0.3
WT snph db
Mito
chon
drialflux(m
ito/min)
Anterograde Retrograde0
50
100
150
WT snph db
%Mito
chon
dria
Anterograde Retrograde0
20
40
60
80
100
WT snph db
%Time
P = 0.50P = 0.041
P = 0.018 P = 0.053P = 0.33
P = 0.56
P = 0.29 (T), 0.39 (C)
Area
(μm2)
P = 0.68 P = 0.83
Numbero
ffilopo
dia
Grow
thrate(μm/m
in)

A mitoEGFP
snph
db
C
00:01 00:05 00:09 00:13 00:17 00:21
AnalysisFluorescent intensity
profile along lines over time
BmitoEGFP
D E F
WT snph db0
2
4
6
Num
bero
fpioneering
clusters
WT snph db0
40
80
120
Mito
chon
drialp
resenc
e(%
time)
WT
P = 0.017 P = 0.19 P = 0.20