multigrade,………………… multivariable,……. … · multigrade, multivariable, cusum qc...
TRANSCRIPT

Multigrade,………………… Multivariable,…….
Cusum…… Quality Control
Ken W Day

Multigrade, Multivariable, Cusum QC
In October last year I gave a paper ‘Concrete in the 22nd Century’ to the Concrete Institute of Australia Biennial, trying to look as far as possible into the future.
• Now however I have chosen to look into the past because my largest contribution to concrete technology is evidently still not universally understood.

Multigrade, Multivariable, Cusum QC
• It took 25 years from the early 1950s to the late 1970s to perfect my technique for analysing concrete compression test data.
• In the 25 years since then, the technique has spread widely as part of the ConAd QC program
• but still not fully incorporated in any national or international code of practice.
• So I want to take this opportunity to present its exact basic concepts.

Multigrade, Multivariable, Cusum QC I need to present each of the three major
components: • Multigrade, • Multivariable • Cusum and to add to them one further item: • Prediction from early age tests. I will take the three major components in reverse order:

Cusum cumulative sum analysis I did not invent cusum, • It was developed in the UK chemical
industry (Woodward and Goldsmith, 1964) • first used for concrete QC in the UK in the
1970s (Testing Services, 1970). • I started to apply it some six months later
(independently of the Testing Services development).

Cusum cumulative sum analysis • Cusum involves subtracting a target value from
each result and maintaining a cumulative sum of the remainders.
• Its main value is that it detects a change in a string of results about three times as quickly as a normal Shewhart Chart.
• Detection can be by mathematical analysis of the string of cumulative sums, or by graphing the cumulative sums.
• The graphical method is preferable because it is easier to detect and eliminate false changes due to testing error or abnormal circumstances.

Cusum (cumulative sum analysis) • My major contribution is to use the
continuously updated current average of a variable as the target.
• This focuses the cusum on detection of change rather than adherence to a selected target.
• It also has huge significance for the ease of combining very large numbers of grades of concrete in a single cusum analysis.

Cusum chart
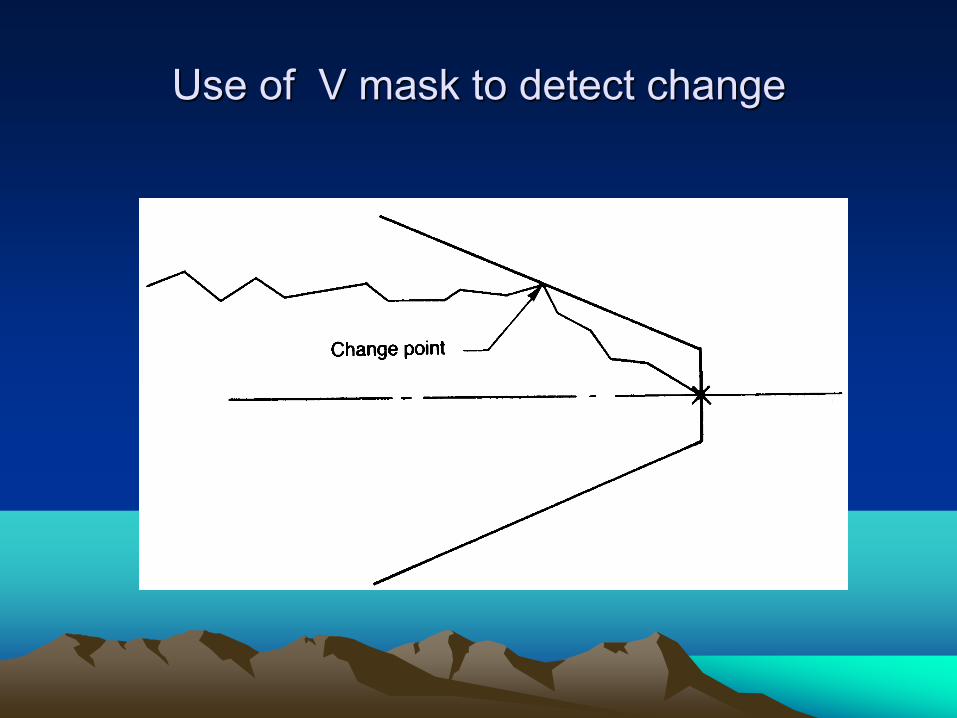
Use of V mask to detect change
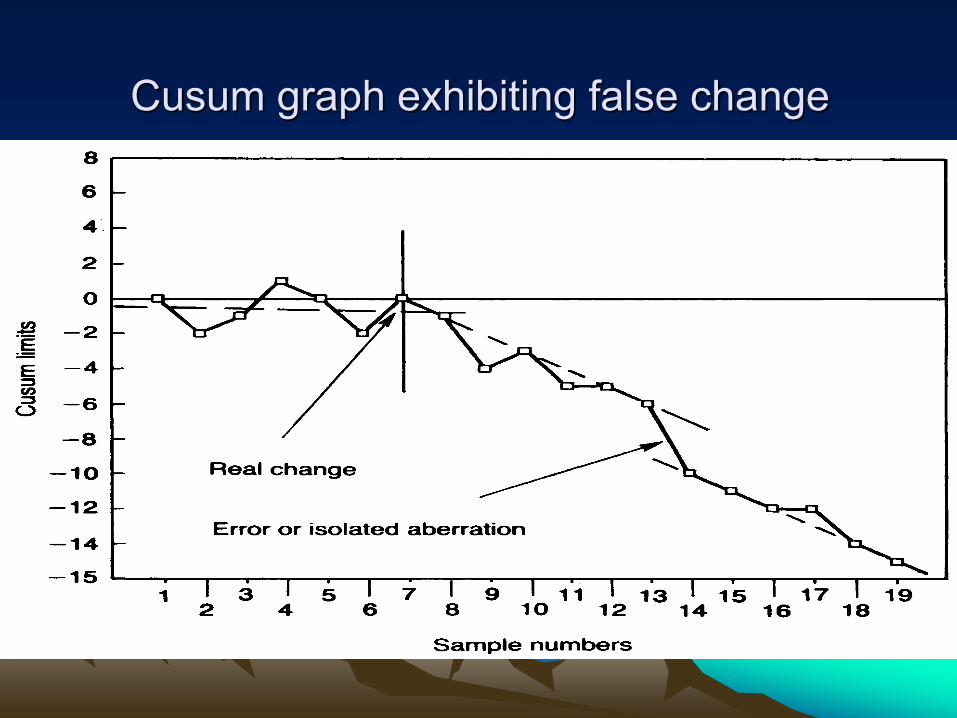
Cusum graph exhibiting false change

Multivariable • Multivariable relates to including graphs of other
variables such as: • density, • workability, • temperature, • tests on constituent materials such as cement
strength and sand grading, • also average pair difference of 28day results
(to detect any deterioration in testing quality) all on the same sheet as concrete strength.

Multivariable • I started to do this in my first year in the concrete
business (1952) • but the idea still does not seem to have been
fully accepted by the UK QSRMC (Quality Scheme for Ready Mix Concrete), even though I have presented papers there on two occasions.
• The concept is that changes in concrete strength will be mirrored in, and so confirmed and explained by, changes in one or more of the other variables.

Multigrade • Multigrade relates to combining the results
of several (or many) grades of concrete in a single analysis.
• If done effectively, this gives an equivalent effect to increasing the frequency of testing many times over.

Multigrade • EN206, the European quality scheme, does this
to a limited extent but makes hard work of it and has to limit it to a few similar grades of concrete.
• EN206 combines grades by adjusting or converting the results of other grades so that they can be analysed as though from a selected control grade.
• This requires initial and continued effort to set up and continually adjust the conversion process to be fully effective.

Multigrade • I have been happily applying my version to combining
the results from hundreds of grades of widely different character with no human effort required (the computer does it all) for more than 20 years.
• My technique is to cusum departures from the various current average values as though these were all from the same average value.
• While I was initially dubious of this, I have found that it works beautifully for strengths of 20MPa or less to strengths of 100MPa or more, and including normal dense and structural lightweight concrete in the same analysis.

Multigrade, Multivarible Cusum

Early Age Prediction • Normally ‘early age’ means something of the
order of 3 to 7days • My contribution for normal results has been to
recognize that a more useful prediction is obtained by adding the average gain to the early result than by assuming a percentage increase.
• This is because the early age result tends to be of a single specimen and to be subject to more than usual error. Applying a percentage increase multiplies the effect of any error.


The free QC program

Free Programs
• I should warn you that the free programs are not likely to remain free permanently (other than on a demonstration basis) owing to a recent partnership between Contek, Shilstone and myself:

Early Age Prediction • For very early results it is necessary to have a
temperature history record and to express the age as an Arrhenius Equivalent Age (EA) rather than a physical age.
• The concept (and a competing but less accurate concept of temperature x time maturity) is well known but the usual technique is to construct a strength v maturity (or EA) graph, measure the maturity (or EA), and read off the strength.

Early Age Prediction
• Construction of the calibration graph requires substantial effort
• A more serious fault is that this technique assumes that the concrete is the same as that used to construct the graph and so cannot react to changes in concrete quality and cannot be used for QC.

Early Age Prediction I have devised a simple program that continuously
and automatically feeds back and corrects the Arrhenius constants so that predictions of 28day strength (and any other desired age) based on the actual concrete in question can be obtained within a few hours.
Such results can be used for QC where the additional expense of temperature monitoring is considered justified

Combined Effect • The real power of my overall system lies in the
way that these separate elements combine together.
• It is the way I do cusum that enables such widespread multigrading,
• the use of cusum that links multivariables, and • the use of multivariables to confirm and explain
the detection of change. • these features enable the detection and cause of
change to be established several weeks earlier than most (all?) other control systems.
Combined Effect
• The earlier detection and trend rectification itself reduces the overall variability of the concrete being produced –
• and I have demonstrated that the number of results required to detect a given change is directly proportional to their basic variability.

Availability of the Technique • The technique was made substantially available
as a Lotus spreadsheet in a series of 10 articles appearing bi-monthly in Concrete International in 1988-89.
• Apart from this it has only been available as part of the ConAd computer program, marketed by the author’s company, Concrete Advice Pty. Ltd. in the 1990s, and now, since the sale of that company, by Command Alkon Inc.

Availability of the Technique • To enable the basic technique to become a
standard item, available to all, there is now a free program available on my website www.kenday.id.au.
• This program falls far short of ConAd in many respects but it does enable all the features presented here to be employed,
• with the exception that the ‘multivariables’ available are limited to strength, density, slump, and temperature and only eight cusum graphs can be drawn.

Specification of Concrete • While not the subject of the current address, a few words
on this subject may be helpful. Although it has taken 50 years in some cases, it seems that the whole world is coming to accept a view I have been presenting since the early 1950s. In 1958 I wrote:
• ‘The only rational objective for any but 100% testing is not to discover and reject faulty products but to ascertain the minimum quality level of the production’.

Specification of Concrete • The article went on to assert that: ‘the only
really fair and effective basis for quality regulation is the imposition of a cash penalty for marginally defective concrete based on a statistical analysis of test data’.
• I am still of that opinion, even though (so far!) it does not appear to be shared by anyone else in the world.
– maybe another 50 years?

Specification of Concrete An effective control system must have two quite
separate and to some extent opposing features. One is to form a very accurate view of the mean
strength and variability of the concrete supplied to date (no hurry).
The other is to detect as quickly as possible when the quality of the concrete being supplied changes (no requirement for accuracy or infallibility).
Any attempt to combine the two is likely to fail to accomplish either.

Summary and Conclusion
1) Test data (including specimen density) should be entered in the system on the day it is obtained and visually assessed daily using automatically generated multigrade, multivariable, cusum graphs.

Summary and Conclusion
2) Cusum analyses should use the constantly updated average values of all variables as a target rather than a specified target.
Summary and Conclusion
3) Data should ‘multigraded’ by cusuming these differences as though from the same mean rather than transforming results to a control grade.

Summary and Conclusion
4) Data should include strength at 7days or earlier transformed into a 28day strength prediction by adding the current average gain. Prediction should NOT involve any assumption that a low early age result is likely to also show a lower subsequent gain.

Summary and Conclusion
5) The daily assessment should include at least the first few rows of a table ranking all grades in order of departure of current and predicted mean strengths from their target values.
6) Cusums should include average pair difference of 28day results as an indication of testing quality.