multifamily market steve woodyard woodyard realty corp woodyard realty corp
TRANSCRIPT

Multi family Market
Steve WoodyardWoodyard Realty Corp.

Jobs
Interest Rates
Financing
Low supply of new housing
New home owner credit and desire
Changing demographics
Technology
What drives the market?

Timeline of Woodyard Realty Corp.’s Sales to Out-of-State Investors Versus Local Investors
Out of State10% Out of State
Investors
53%
LocalInvestors
47%
Local Investors
90%
1984 – 20002001 – Oct 5, 2014

Memphis SubmarketsBartlett 38134, 38135, 38133 Collierville/Germ 38017, 38138, 38139Cordova/Lakeland 38016, 38018, 38002Downtown 38103, 38105, 38157 East 38119, 38120, 38122, 38117 Frayser 38127 Midtown 38104, 38107, 38111, 38112 North Mississippi 38632, 38637, 38654, 38671,
38664, 38680, 38676Raleigh 38108, 38128Southeast 38115, 38118, 38125, 38141 Southwest 38106, 38109, 38114, 38116,
38126,38132, 38131
as defined by Apartment Association of Greater Memphis

*Distressed assets are defined as properties with unusually low occupancy (less than 65% occupancy).
June 30, 2013; Information not been verified
Sub Market # Prop Units Occ % Units Occ % Rent Sq.ft Avg Sq.ftMarket
RentEffective
Rent
Bartlett 17 4,409 94.83% 0 94.83% $0.67 962 $645 $673
Collierville/Germantown 11 2,357 92.15% 252 95.72% $0.98 1042 $1,026 $1,027
Cordova/Lakeland 20 8,115 94.05% 0 94.05% $0.85 1022 $873 $853
Downtown 22 3,934 92.25% 199 93.73% $1.13 901 $1,017 $1,017
East 17 3,058 93.98% 0 93.98% $0.81 992 $799 $788
Frayser 13 1,805 87.92% 252 95.17% $0.64 839 $536 $536
Jackson, TN 6 753 93.89% 0 93.89% $0.69 966 $671 $671
Mid-town 34 3,814 89.77% 272 92.21% $0.80 790 $633 $633
North Mississippi 15 3,653 94.39% 0 94.39% $0.79 1034 $816 $804
Raleigh 10 2,208 83.29% 335 86.60% $0.71 844 $600 $554
Southeast 33 9,139 92.64% 134 93.46% $0.77 972 $747 $728
Southwest 18 3,000 91.60% 12 91.73% $0.58 955 $551 $744
Total 216 46,245 92.35% 1456 93.51% $0.80 956 $767 $771
Including Distressed*
Excluding Distressed*
Overall

Local Multifamily Market: 2014 Review (Jan-Oct 5, 2014)
Normal 22
REO/Distressed6
Type of Transaction28 Sales plus 7 Foreclosures
Frayser - 3
Raleigh - 1
Southwest- 1
Foreclosures by Submarket 7 Foreclosures
Foreclosures7East - 2
30+ apartment units in Greater Memphis Metropolitan Area

Local Multifamily Market: 2014 Sales (Jan-Oct 5, 2014)
28 Sales Transactions32 total sales in 2013
$219.4 Gross Sales Volume (in Millions) $239.3 total gross sales volume in 2013
5,487 Units Sold6,513 total units sold in 2013
$39,977 Average Price per Unit$36,757 total avg. price/unit in 2013
Southwest - 14%
Bartlett7% Cordova/
Lakeland 7%
East 7%
Midtown -39%
Southeast - 14%
Raleigh 4%
Germ./Collierville 4%
Frayser 4%
30+ apartment units in Greater Memphis Metropolitan Area

2001 2002 2003 2004 2005 2006 2007 2008 2009 2010 2011 2012 2013 Jan-Oct 5, '14
$0
$50
$100
$150
$200
$250
$300
$350
$400
24 35 33 41 59 68 61 27 28 29 38 40 32 28
Vol
ume
in M
illio
ns
Local Multifamily Market: 2001-Oct. 5, 2014 Sales in Review
$59
$125
$188
$293
$370$345
$105
$65 $55
13-Yr Average*$195.9 Million
13-Yr Average*40 Transactions
$174
$323
$206$219
30+ apartment units in Greater Memphis Metropolitan Area * Does not include 2014
$239
2010 2011 2012 2013$0
$50
$100
$150
$200
$250
$300
$350
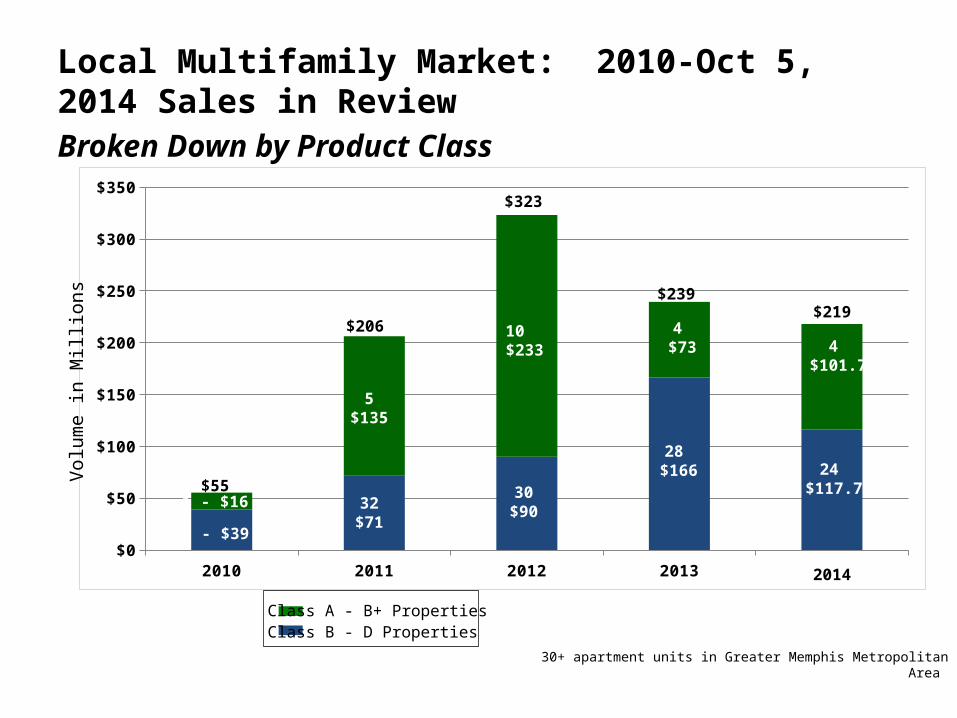
Local Multifamily Market: 2010-Oct 5, 2014 Sales in ReviewBroken Down by Product Class
$55
$323
$206
$239
28 - $39
1 - $16 32$71
5$135
30$90
10$233
28 $166
4 $73
Volu
me
in M
illio
ns
Class A - B+ Properties Class B - D Properties
30+ apartment units in Greater Memphis Metropolitan Area
$219
24 $117.7
4 $101.7
2014

2001 2002 2003 2004 2005 2006 2007 2008 2009 2010 2011 2012 2013 2014 20150
500
1000
1500
2000
2500
3000
3500
4000
4500
Local Multifamily Market: 2001 – 2014 Construction
14-Yr Average1176 Units
# of
Uni
ts
30+ apartment units in Greater Memphis Metropolitan Area

Local Multifamily Market: New Construction
University of Memphis AreaGather on Southern 74 CP3595 Southern 64 UCHighland Row 354 PLMidland Apts 120 PLDoyle Apts 127 PL
Downtown AreaPrinter’s Alley & Annex 54 UCSouth Junction Apts 197 UCToof Apts 50 UCThe Chisca Apts 165 UCCrescent Bluff 172 UCHarbor Isle 134 UCArtspace Memphis 44 PLUptown Apts 90 PL362 S Second 64 PLFrench Fort 67 PL
Collierville AreaWestbrook Crossing 227 CPCarrington Apts 112 CPSignature Apts 251 UC
Under Construction
Apts – Planning Stages
CP – Completed ProjectUC – Under ConstructionPL - Planned

Trends Improving the Rental DemandBaby Boomers Scaling Down, Entering Rental Market
In the United States, the baby boom generation represents 76 million people.
On January 1, 2011, as the baby boomers began to celebrate their 65th birthdays, 10,000 people turned 65 every day— this will continue for next 16 years.

Trends Improving the Rental DemandMore Renters Entering the Market - Generation Y
• Generation Y, the echo boom of the baby boomers, born from 1977-2001 (estimated majority are between 18-30 years old)
• Nearly 80 million in population (larger than the baby boomer population of 72 million)
27%Live withRelatives 60% Rent
13%Own

2006 2007 2008 2009 2010 2011 2012 2013 Mid Year 2014
86%
88%
90%
92%
94%
91%90%
89% 89%90% 90%
91% 92%
94%
2006 2007 2008 2009 2010 2011 2012 2013 Mid Year 2014
$600
$650
$700
$750
$800
$685 $690 $689 $694 $693 $713
$728 $748
$771
Local Multifamily Market: Mid Year 2014
*
* Apartment Association of Greater Memphis includes foreclosures and out of service apartments for the first time
Rent Trend
Occupancy Trend
*

Market Cycle as Projected by Integra Realty Resources
Out of State
LocalInvestors
Local Investors
2
1
3
2
1
3
2
1
3
2
1
3
Recovery PhaseDecreasing Vacancy RatesLow New ConstructionModerate AbsorptionLow/Moderate Employment GrowthNeg/Low Rental Rate Growth
Expansion PhaseDecreasing Vacancy RatesModerate/High New ConstructionHigh AbsorptionModerate/High Employment GrowthMed/High Rental Rate Growth
Hyper Supply PhaseIncreasing Vacancy RatesModerate/High New ConstructionLow/Negative AbsorptionModerate/Low Employment GrowthMed/Low Rental Rate Growth
Recession PhaseIncreasing Vacancy RatesModerate/Low New ConstructionLow AbsorptionLow/Neg Employment GrowthLow/Neg Rental Rate Growth
Recovery Expansion Hyper Supply Recession
2
1
3
1st Stage of the Phase
2nd Stage of the Phase
3rd Stage of the PhaseIntegra
Memphis
IRR - Memphis Metro- Decreasing Vacancy- Moderate/High New Construction- High Absorption- Moderate/High Employment Growth- Medium/High Rental Rate Growth
WRC30+ units
Woodyard Realty - Memphis Metro- Decreasing Vacancy- Low to Moderate New Construction- Moderate/High Absorption- Low/Moderate Employment Growth- Low/Medium Rental Rate Growth

Woodyard Realty Corp.’s 2015 Forecast
Each submarket will have improving conditions
Similar and slightly declining levels of foreclosures
Increasing levels of new construction
Modestly increasing rents that are gaining momentum
Improving Occupancy
Prices have hit bottom and are improving
Two possibly three years left to find value-add opportunities