multidecadal meta-analysis of ... - spo.nmfs.noaa.gov · 38 fishery bulletin 117(1–2) lications...
TRANSCRIPT
37
Multidecadal meta-analysis of reproductive parameters of female red snapper (Lutjanus campechanus) in the northern Gulf of Mexico
Nancy J. Brown-Peterson (contact author)1
Christopher R. Peterson2 Gary R. Fitzhugh3
Email address for contact author: [email protected]
1 Center for Fisheries Research and Development School of Ocean Science and Engineering University of Southern Mississippi 703 East Beach Dr. Ocean Springs, Mississippi 395642 Department of Integrative Biology The University of Texas at Austin 2415 Speedway #C0930 Austin, Texas 78712 3 Southeast Fisheries Science Center National Marine Fisheries Service 3500 Delwood Beach Rd. Panama City, Florida 32408
Manuscript submitted 19 July 2018.Manuscript accepted 10 December 2018.Fish. Bull. 117:37–49 (2019).Online publication date: 19 December 2018.doi: 10.7755/FB.117.1.5
The views and opinions expressed or implied in this article are those of the author (or authors) and do not necessarily reflect the position of the National Marine Fisheries Service, NOAA.
Abstract—Stocks of red snapper (Lutjanus campechanus) exhibited a dramatic decline in abundance in the northern Gulf of Mexico (GOM) between 1960 and 1991; manage-ment regulations implemented since 1991 have resulted in a mod-est recovery. To examine potential temporal and regional changes in reproductive parameters of female red snapper during recovery of the stock, we used meta-analytical mod-els to analyze data collected during 1991–2017 throughout the north-eastern (Florida, Alabama, Missis-sippi) and northwestern (Louisiana and Texas) GOM; no data were available for 2003–2008. Peak red snapper spawning occurred from June through August throughout the time period, and a high probability (>75%) of spawning occurred during May from 1995 through 2017. The reproductive season was estimated to average 4.5 months from 1994 through 2017. Increases in spawn-ing interval were estimated across time in the northwestern region (2.3–4.7 days between spawnings from 1992 through 2015) and for re-gions combined (2.4–2.9 days from 1991 through 2017) but showed no changes in the northeastern region (2.3–2.4 days from 1991 through 2017). Relative batch fecundity gen-erally decreased from 1991 through 2017 for all models; however, this decrease was more notable in the northwestern GOM than in the northeastern GOM after 2013. Our analyses suggest evidence of repro-ductive compensation, particularly because the estimated changes in reproductive parameters were more pronounced in the northwestern GOM.
Red snapper (Lutjanus campecha-nus) is one of the most popular rec-reational and commercial species throughout the northern Gulf of Mexico (GOM). This popularity has resulted in high fishing pressure on the species, resulting in dramatic de-clines in the stocks since the 1960s and reaching a low point in 1990 (SEDAR 52, 2018). The first stock assessment for red snapper, conduct-ed in 1988, concluded that the stock was overfished and continues to be overfished (i.e., is undergoing “over-fishing”; Goodyear, 1988). A series of regulations have been implemented since that time, including bag limits, size limits, gear restrictions, limits on the length of the commercial and recreational fishing seasons, and the institution of an individual fishing quota (IFQ) program. In 2005, new, stricter regulations were put into place in an effort to end overfishing
of red snapper by 2009 or 2010 (GM-FMC, 2007). The most recent stock assessment, completed in April 2018, concluded that red snapper stocks are in recovery and that they are not overfished and are not in the process of being overfished on a gulf-wide ba-sis (SEDAR 52, 2018). The stock is expected to continue to increase and should be within a few percentage points of the target spawning stock biomass (26%) by 2028 (SEDAR 52, 2018).
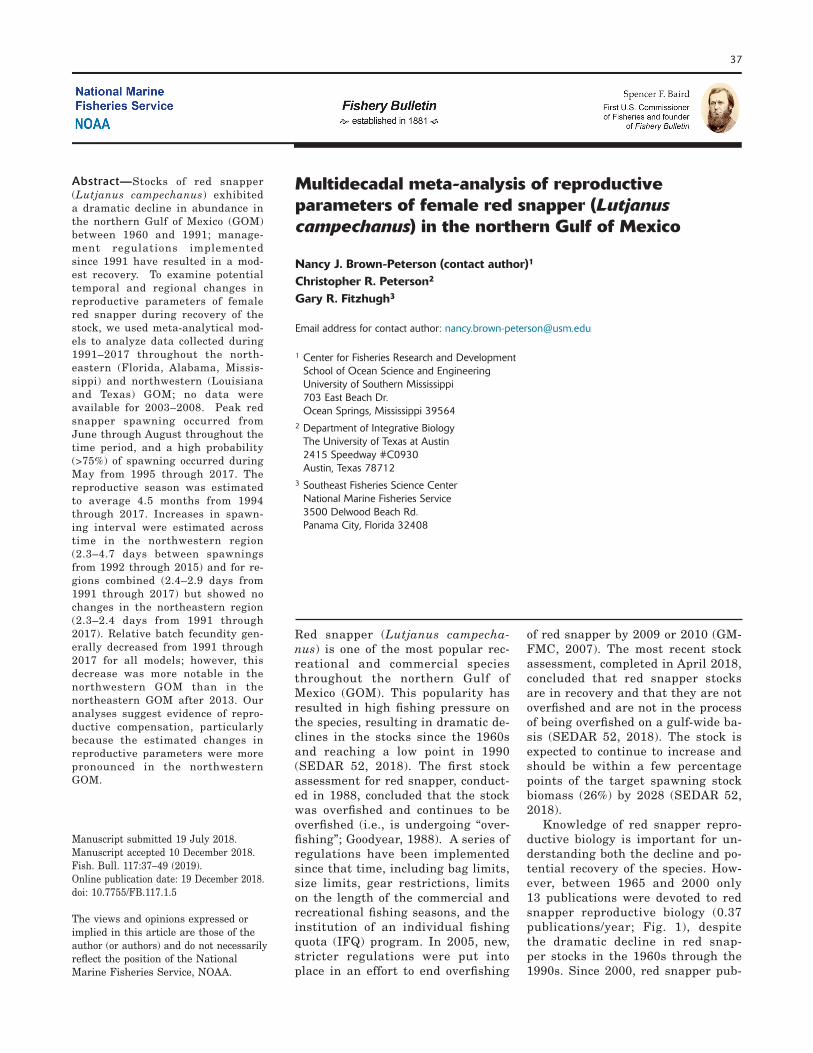
Knowledge of red snapper repro-ductive biology is important for un-derstanding both the decline and po-tential recovery of the species. How-ever, between 1965 and 2000 only 13 publications were devoted to red snapper reproductive biology (0.37 publications/year; Fig. 1), despite the dramatic decline in red snap-per stocks in the 1960s through the 1990s. Since 2000, red snapper pub-
38 Fishery Bulletin 117(1–2)
lications on reproductive biology have in-creased to 2.16/year according to a search of the internet with Google Scholar (Fig. 1). It is well documented that red snap-per have an extended spawning season in the GOM, generally ranging from May through October, and peak spawning oc-curs from June through mid-September (SEDAR 31, 2013). Female red snapper are batch spawners with indeterminate fecundity, and the spawning interval, or number of days between consecutive spawnings, decreases with increasing fe-male size or age (Porch et al., 2015). Fe-male red snapper can reach sexual matu-rity as early as age-2 (SEDAR 31, 2013, Porch et al., 2015).
The reproductive potential of female red snapper has been shown to vary with region, habitat, and time. Red snapper from the east coast of the United States were more fecund and had a shorter spawning interval than those from off the Dry Tortugas in the Gulf of Mexico, although spawning seasonality appeared similar in both areas (Brown-Peterson et al., 2009). Recent modeling of red snap-per biomass and fecundity has indicated that both estimates are higher for the northwestern GOM than for the north-eastern GOM (Porch et al., 2015, Karnauskas et al., 2017). These reported differences are likely related to the higher proportion of larger, older individuals in the northwestern GOM than in the northeastern GOM (Porch et al., 2015). Reproductive potential has also been hypothesized to be related to habitat; fish captured on natural reef banks reproduce earlier, at a smaller size, more frequently, and with a higher fecun-dity than fish captured on artificial reefs in Louisiana (Glenn et al., 2017). However, small sample sizes and differences in depth between the natural reefs and ar-tificial reefs reported in Glenn et al. (2017) may con-found the conclusions from this article. For example, no difference was found in spawning behavior or fe-cundity of female red snapper captured from oil plat-forms or natural hard bottom in Texas within the same depth zone (Downey et al., 2018). However, female red snapper captured on nearshore artificial reefs in Texas exhibited more active spawning and higher fecundity than those taken from offshore artificial reefs (Alexan-der, 2015), despite similarities in depth between near-shore and offshore reefs. Finally, female red snapper showed a decrease in fecundity and spawning frequen-cy, as well as a slower progression to sexual maturity between 2000 and 2010, and these results were more pronounced in fish from the northwestern GOM than in the northeastern GOM (Kulaw et al., 2017). However, the conclusions of Kulaw et al. (2017) may have been influenced by small sample sizes during 2009–2010, particularly from the northeastern GOM.
To further examine potential temporal and spatial changes in reproductive parameters of GOM female red snapper, we conducted an expanded meta-analysis of several reproductive parameters from 1991 through 2017. This 27-year period represents a time during which red snapper stocks have increased from historic low levels despite undergoing relatively high levels of fishing pressure. Specifically, we evaluated differences in spawning seasonality, batch fecundity, and spawn-ing interval across time. Additionally, we modeled dif-ferences in spawning interval and batch fecundity be-tween eastern and western subgroups of red snapper in the northern GOM.
Materials and methods
Data sources
We searched Google Scholar for “red snapper reproduc-tion” and “Lutjanus campechanus reproduction” and selected articles published between 1991 and 2018 containing information on any of the following terms: spawning, spawning seasonality, fecundity, spawning interval/frequency, spawning behavior, and gonadal histology. Additional relevant papers not found in the search were included on the basis of those with expert knowledge. The relatively few articles published on red snapper reproduction before 1991 that contained us-able data resulted in large gaps in the time series of
Figure 1Number of publications related to red snapper (Lutjanus campecha-nus) reproductive biology from 1965 through 2017. Each bar repre-sents a 5-year bin, with the exception of 2015, which represents 3 years. Figure includes all publications from the Gulf of Mexico and the Atlantic Ocean.
Year
No.
of p
ublic
atio
ns o
n re
prod
uctiv
e bi
olog
y
Brown-Peterson et al.: Meta-analysis of reproductive parameters of Lutjanus campechanus in the Gulf of Mexico 39
data, and therefore no papers published before 1991 were included in the analyses. Although Render (1995) contains information on spawning seasonality and spawning interval, insufficient details were provided to be able to use the data in our analyses.
When possible and necessary, we contacted the authors of articles to receive their original data. In all other cases, the data provided within the articles themselves were used in the meta-analysis. Addition-ally, data from an ongoing, unpublished study by the first author were included in the analyses. All data sources used for analyses are shown in Table 1 and in-clude peer-reviewed, published manuscripts, graduate theses, and final or interim reports.
Data collection—2016 and 2017 samples
Red snapper were collected monthly in Mississippi waters from April through November 2016 and from April through October 2017 during daylight hours by using vertical longlines baited with Atlantic mackerel (Scomber scomber). Sampling gear consisted of 3 elec-tric reels rigged with an 8-m vertical mainline that was outfitted with ten 45.7-cm leaders spaced 0.67-m apart
and a 4.5-kg weight at the terminal end. All leaders on each line were rigged with one hook size (8/0, 11/0 or 15/0 circle hooks of 0 offset). Lines were fished just off the bottom for 5 min/set. Habitats sampled included permitted fishing zones around artificial reefs, oil and gas platforms, and rigs-to-reef sites at 3 depth zones (< 20 m, 20–49 m, 50–100 m). Sites at reefs were fished at the 2 shallowest depth zones, whereas rigs-to-reef sites were fished only at the deepest depth zone. Three 5-min sets were made at platforms and at reef zones where fishing was permitted at each depth zone, and two 5-min sets were made at rigs-to-reefs sites. All fish were stored on ice immediately upon capture.
Fish were measured (FL, mm) and weighed (0.01 kg). Gonadal tissue was removed, weighed (0.1 g) and macroscopically assessed to determine reproduc-tive phase (Brown-Peterson et al., 2011). A section of ovary from each fish was preserved in 10% neutral buffered formalin within 15 hours of capture for histo-logical analysis and assignment of reproductive phase (Brown-Peterson et al., 2011). A portion (1–4 g) of the ovary of all females macroscopically identified in the actively spawning subphase was weighed (0.01 g) and preserved for a minimum of 3 months in Gilson’s solu-
Table 1
Data sources and parameters used for analysis of female red snapper reproduction in the northern Gulf of Mexico (GOM); E=northeastern GOM; W=northwestern GOM; R=raw data; S=summary data.
Reproductive parameter
Relative Spawning batch Year Region GSI interval fecundity Reference
1991–1992 E R R R SEDAR 7, 20051993–1995 E, W R R R SEDAR 7, 20051998–2002 E, W R R R SEDAR 7, 20051999–2001 E, W R R R Kulaw et al., 20171999 E R Szedlmayer and Furman, 2000a
2004 E R Brown-Peterson et al., 20092007–2010 R SEDAR 31, 20132009 E S Lowerre-Barbieri et al., 20122009–2010 W S R Cowan et al., 20122009–2010 E, W R R R Kulaw et al., 20172011 E, W R R R Fitzhugh et al., 2012a2012 E, W R Lang and Falterman, 20172012–2013 W R R R Glenn et al., 20172012–2016 E, W R R R SEDAR 52, 20182013–2014 W S S Alexander, 20152013–2015 W S S R Downey et al., 20182016–2017 E R R R Brown-Peterson, current study
a Szedlmayer, S. T., and C. Furman. 2000. Estimation of abundance, mortality, fecundity, age frequency, and growth rates of red snapper, Lutjanus campechanus, from a fishery-independent stratified random survey. Report to the Gulf and South Atlantic Fisheries Foundation, Inc. Na-tional Oceanographic and Atmospheric Administration, Department of Commerce Cooperative agreement NA87FM0221.
40 Fishery Bulletin 117(1–2)
tion for fecundity analysis. Batch fecundity was deter-mined volumetrically for 6 subsamples per individual for fish histologically verified in the actively spawning subphase (Bagenal and Braum, 1971).
Reproductive parameters
Reproductive parameters were calculated from original data when available. When only summary data were available, the mean, standard error, and number of samples were taken or calculated from tables or graphs provided in the publication. Spawning seasonality was defined on the basis of the Gonadosomatic Index (GSI), with
GSI = (gonad weight/gonad-free weight) × 100. (1)
Fish were considered reproductively active if their GSI was ≥1.0, and reproductively inactive if their GSI was <1.0. This GSI threshold was based on histological as-sessments of developing and spawning-capable fish. Spawning interval (estimated days between spawn-ings) was calculated in 2 ways using 2 separate types of spawning markers. First, the reciprocal of the to-tal number of actively spawning females (i.e., those undergoing oocyte maturation (OM), including those with hydrated oocytes) was divided by the number of spawning capable females. For the second method, we used the reciprocal of the total number of females with postovulatory follicles (POFs) ≤24 h that were observed in the ovary divided by the number of spawning ca-pable females. We assumed that both types of spawn-ing markers are equivalent in both detectability and duration (approximately 24 hours, but see Porch et al., 2015). Because batch fecundity is positively correlated with fish size (Lowerre-Barbieri et al., 2015), relative batch fecundity (RBF, number of eggs/g ovary-free body weight) was used in all models to remove the influence of fish size and was calculated as batch fecundity di-vided by ovary-free body weight.
Data analysis
Our analyses involved the use of hierarchical Bayesian models, which are well suited to account for statisti-cal uncertainty at multiple levels and from multiple sources (Gelman et al., 2013). An essential component to Bayesian analysis is prior distributions, which can be thought of as formalized assumptions of our uncer-tainty about the parameters. In particular, we used weakly informative priors that place a low probabil-ity on extraordinarily unreasonable parameter values without excluding anything in a broad range of plausi-bility. A Bayesian analysis combines the prior distribu-tions with the likelihood of the data to create a poste-rior distribution that describes the uncertainty around the parameter estimates. Posteriors are often described by their median and their credible intervals (usually 50% and 95%), which are the corresponding quantiles of the distribution. The posterior distribution is gen-erally estimated with an algorithm that explores and
samples parameter values over a series of iterations. Once the posterior distribution has been estimated, it can be used to perform a posterior predictive check (i.e., simulate new data from the parameters to evalu-ate the suitability of the model). If these generated data are not similar to the real data, the model may need revision. For further details, an introduction to Bayesian methodology is provided by McElreath (2016).
We examined the potential change in red snapper reproductive variables (spawning seasonality, spawn-ing interval, and fecundity) over a 27-year period. Our data came from multiple studies conducted by different researchers at varying times throughout the northern GOM, and all data sets shown in Table 1 were used in our analyses. Although we have full data sets for many of these studies, a substantial subset provided only means and standard errors. For each reproduc-tive parameter, we combined a Gaussian process time series model, which is a flexible method that estimates temporal trends where there is similarity among near-by years but not a linear increase or decrease in years, with a random effects meta-analysis, which accounts for variation among studies. Unless otherwise noted, all estimates and predictions produced by these analy-ses are posterior distributions.
To estimate spawning seasonality, we used a Gauss-ian process time series to estimate the mean GSI for each month and year within the data range; both raw and summarized data were used in this analysis. Sepa-rate Gaussian processes estimated monthly, yearly, and monthly-by-yearly interactions. We calculated the prob-ability of spawning activity for each month and year from the proportion of the posterior distribution cor-responding to a mean GSI estimate that was ≥1. The sum of monthly spawning probabilities for each year is the expected spawning period for the year.
Because spawning interval is the reciprocal of a proportion (i.e., the proportion of fish spawning at a given time), it can be analyzed with a modified logis-tic regression. When available, we used the number of fish caught and the number spawning to fit the model. When original data were unavailable, we used pub-lished estimates of spawning intervals and calculated standard errors from sample sizes. To examine poten-tial differences between the northeastern and north-western GOM, we compared models with a single time series with models where the 2 regions were modeled separately. We ran these models for both of the meth-ods to determine spawning interval (for individuals undergoing OM or POF). In addition to the time se-ries and meta-analysis, our model re-estimated spawn-ing interval for each study from the raw data. This approach improves spawning interval estimates from studies with small sample sizes and allows a credible interval calculation.
We used only individual-level data for our analysis of RBF. As with the spawning interval analysis, we compared a model that estimated separate time series for the northeastern and northwestern GOM with a model that pooled the regions.
Brown-Peterson et al.: Meta-analysis of reproductive parameters of Lutjanus campechanus in the Gulf of Mexico 41
All models were written with Stan software, vers. 2.171 (Carpenter et al., 2017). Pre- and postprocess-ing data were analyzed in R, vers. 3.4.1 (R Core Team, 2017). Results were checked for nonconvergence as recommended in the Stan user manual (Stan Devel-opment Team, 2017), and model fit was checked with posterior predictive checks. To assess the robustness of the models to prior assumptions, we re-ran each model multiple times with different hyperparameters. Prior sensitivity was assessed by comparing the posterior predictive summary statistics. Full details of all analy-ses and validations are provided in the online Supple-mentary methods section.
Results
Model performance
All models converged onto stationary posterior distri-butions (Suppl. Figs. 1–4). Posterior predictive checks showed the spawning seasonality model (Suppl. Figs. 5 and 6), the spawning interval models for OM (Suppl. Figs. 7–10) and POF (Suppl. Figs. 11–14) and the batch fecundity models (Suppl. Figs. 15 and 16) performed well, with summary statistics matching the real data. Although the batch fecundity models had difficulty pre-dicting individual fecundity values because of the large amount of variation among individuals (Suppl. Figs. 17 and 18), they predicted group-level fecundity well (Sup-pl. Figs. 19 and 20). Forest plots showed there was not a consistent temporal trend in study-level effects for spawning seasonality (Suppl. Fig. 21), and no temporal or regional trend for spawning interval (Suppl. Figs. 22 and 23) or fecundity (Suppl. Fig. 24). Finally, the sensitivity analyses showed qualitative agreement and therefore robustness to prior assumptions across the different sensitivity trials for all models (Suppl. Figs. 25–31). Details about model validity checks are pro-vided in the Validation Results section of the Supple-mentary methods.
Spawning seasonality
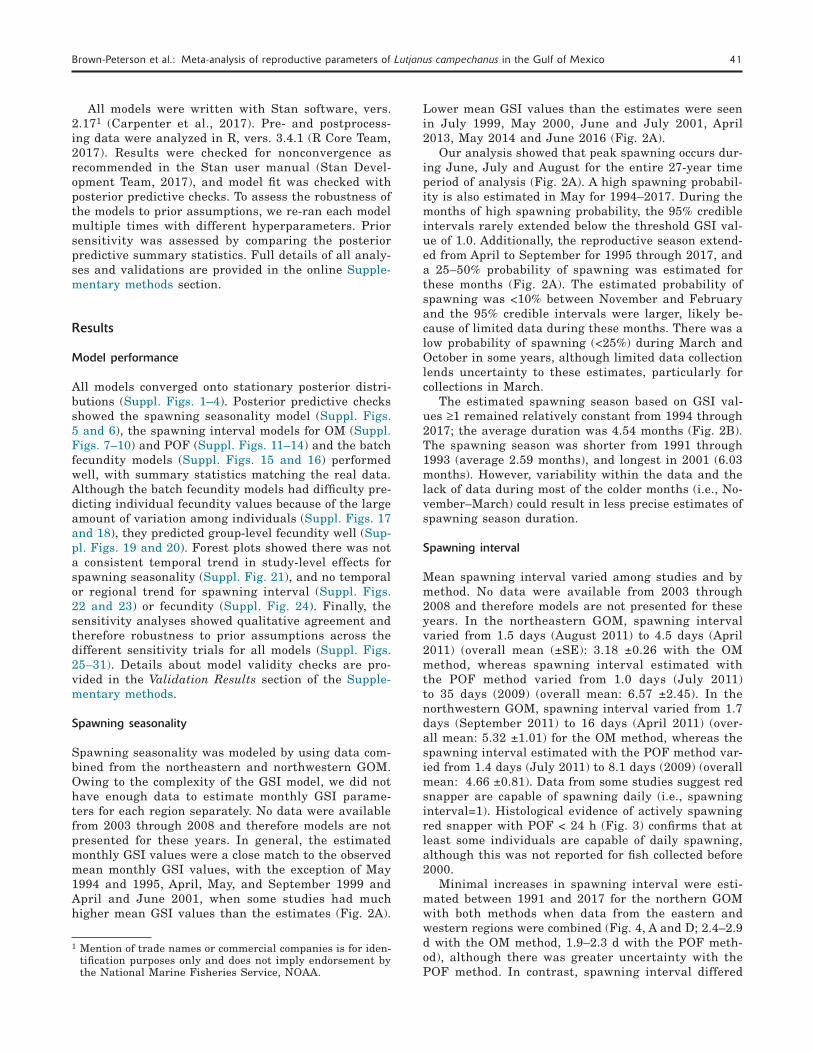
Spawning seasonality was modeled by using data com-bined from the northeastern and northwestern GOM. Owing to the complexity of the GSI model, we did not have enough data to estimate monthly GSI parame-ters for each region separately. No data were available from 2003 through 2008 and therefore models are not presented for these years. In general, the estimated monthly GSI values were a close match to the observed mean monthly GSI values, with the exception of May 1994 and 1995, April, May, and September 1999 and April and June 2001, when some studies had much higher mean GSI values than the estimates (Fig. 2A).
1 Mention of trade names or commercial companies is for iden-tification purposes only and does not imply endorsement by the National Marine Fisheries Service, NOAA.
Lower mean GSI values than the estimates were seen in July 1999, May 2000, June and July 2001, April 2013, May 2014 and June 2016 (Fig. 2A).
Our analysis showed that peak spawning occurs dur-ing June, July and August for the entire 27-year time period of analysis (Fig. 2A). A high spawning probabil-ity is also estimated in May for 1994–2017. During the months of high spawning probability, the 95% credible intervals rarely extended below the threshold GSI val-ue of 1.0. Additionally, the reproductive season extend-ed from April to September for 1995 through 2017, and a 25–50% probability of spawning was estimated for these months (Fig. 2A). The estimated probability of spawning was <10% between November and February and the 95% credible intervals were larger, likely be-cause of limited data during these months. There was a low probability of spawning (<25%) during March and October in some years, although limited data collection lends uncertainty to these estimates, particularly for collections in March.
The estimated spawning season based on GSI val-ues ≥1 remained relatively constant from 1994 through 2017; the average duration was 4.54 months (Fig. 2B). The spawning season was shorter from 1991 through 1993 (average 2.59 months), and longest in 2001 (6.03 months). However, variability within the data and the lack of data during most of the colder months (i.e., No-vember–March) could result in less precise estimates of spawning season duration.
Spawning interval
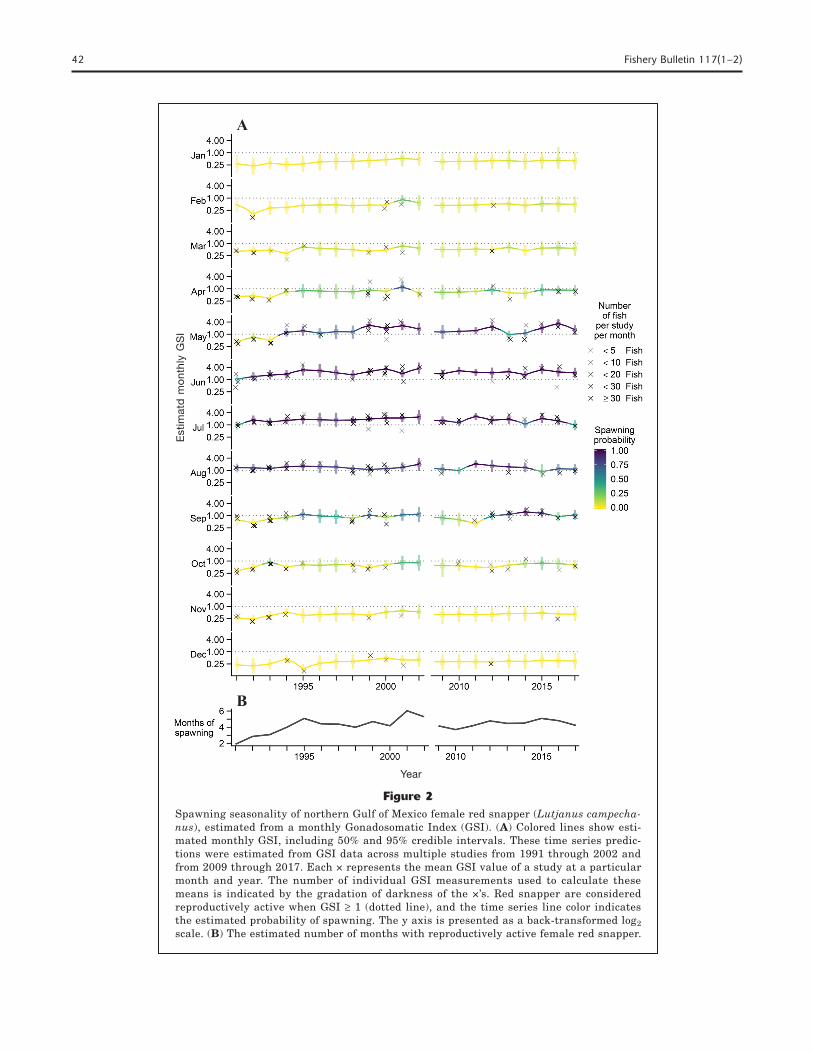
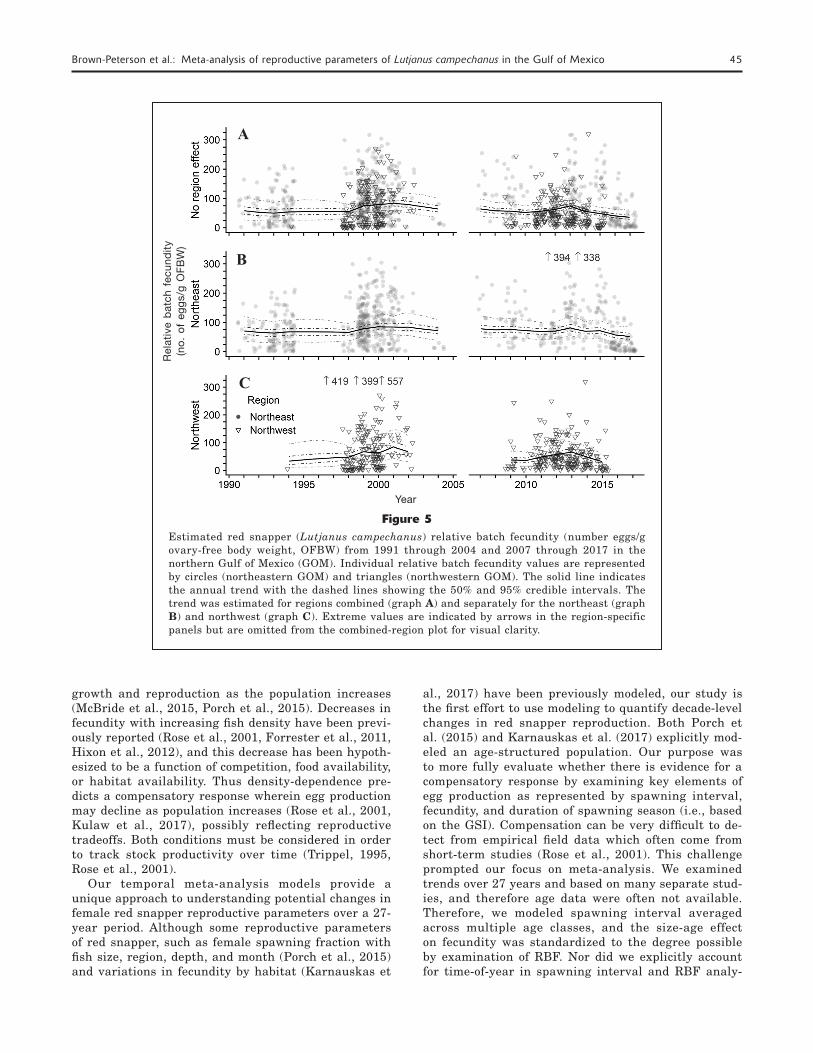
Mean spawning interval varied among studies and by method. No data were available from 2003 through 2008 and therefore models are not presented for these years. In the northeastern GOM, spawning interval varied from 1.5 days (August 2011) to 4.5 days (April 2011) (overall mean (±SE): 3.18 ±0.26 with the OM method, whereas spawning interval estimated with the POF method varied from 1.0 days (July 2011) to 35 days (2009) (overall mean: 6.57 ±2.45). In the northwestern GOM, spawning interval varied from 1.7 days (September 2011) to 16 days (April 2011) (over-all mean: 5.32 ±1.01) for the OM method, whereas the spawning interval estimated with the POF method var-ied from 1.4 days (July 2011) to 8.1 days (2009) (overall mean: 4.66 ±0.81). Data from some studies suggest red snapper are capable of spawning daily (i.e., spawning interval=1). Histological evidence of actively spawning red snapper with POF < 24 h (Fig. 3) confirms that at least some individuals are capable of daily spawning, although this was not reported for fish collected before 2000.
Minimal increases in spawning interval were esti-mated between 1991 and 2017 for the northern GOM with both methods when data from the eastern and western regions were combined (Fig. 4, A and D; 2.4–2.9 d with the OM method, 1.9–2.3 d with the POF meth-od), although there was greater uncertainty with the POF method. In contrast, spawning interval differed
42 Fishery Bulletin 117(1–2)
Figure 2Spawning seasonality of northern Gulf of Mexico female red snapper (Lutjanus campecha-nus), estimated from a monthly Gonadosomatic Index (GSI). (A) Colored lines show esti-mated monthly GSI, including 50% and 95% credible intervals. These time series predic-tions were estimated from GSI data across multiple studies from 1991 through 2002 and from 2009 through 2017. Each × represents the mean GSI value of a study at a particular month and year. The number of individual GSI measurements used to calculate these means is indicated by the gradation of darkness of the ×’s. Red snapper are considered reproductively active when GSI ≥ 1 (dotted line), and the time series line color indicates the estimated probability of spawning. The y axis is presented as a back-transformed log2 scale. (B) The estimated number of months with reproductively active female red snapper.
A
B
Year
Estim
atd
mon
thly
GSI

Brown-Peterson et al.: Meta-analysis of reproductive parameters of Lutjanus campechanus in the Gulf of Mexico 43
with the OM method when regions were considered separately. Although spawning interval remained sta-ble in the northeastern GOM with a median estimated value of 2.30 days in 1991 to 2.37 days in 2017, the median estimate for the northwestern GOM increased from 2.3 days in 1992 to 4.7 days in 2015 (Fig. 4, B and C). Additionally, estimations of spawning interval for the northwestern region showed more uncertainty because the upper 95% credible intervals were larger than those for the northeastern region, particularly from 2009 through 2015 (excluding missing data from 2003 through 2008). In contrast, spawning interval re-mained relatively stable across time in both regions with the POF method (Fig. 4, E and F), but the north-east region had slightly higher estimated values for spawning interval (median estimated spawning inter-val: northeastern=2.2–2.4 days, 1991–2017; northwest-ern=2.0–1.9 days, 1992–2015). Both regions showed higher uncertainty from 1999 through 2010 (excluding missing data from 2003 through 2008), but the upper 95% credible intervals were larger in the northeastern region. However, it should be noted that mean spawn-ing interval estimates (Fig. 4, horizontal lines) are less precise when individual study-level spawning interval values are large. Large spawning interval values are inherently more uncertain because they correspond with a very low proportion of individuals spawning at any given time, which can occur in studies with small sample sizes or with sample collections focused either early or late in the spawning season. Thus, even a
small amount of variation is greatly magnified when spawning interval is calculated (e.g., 2009 POF data and 2010 OM data).
Batch fecundity
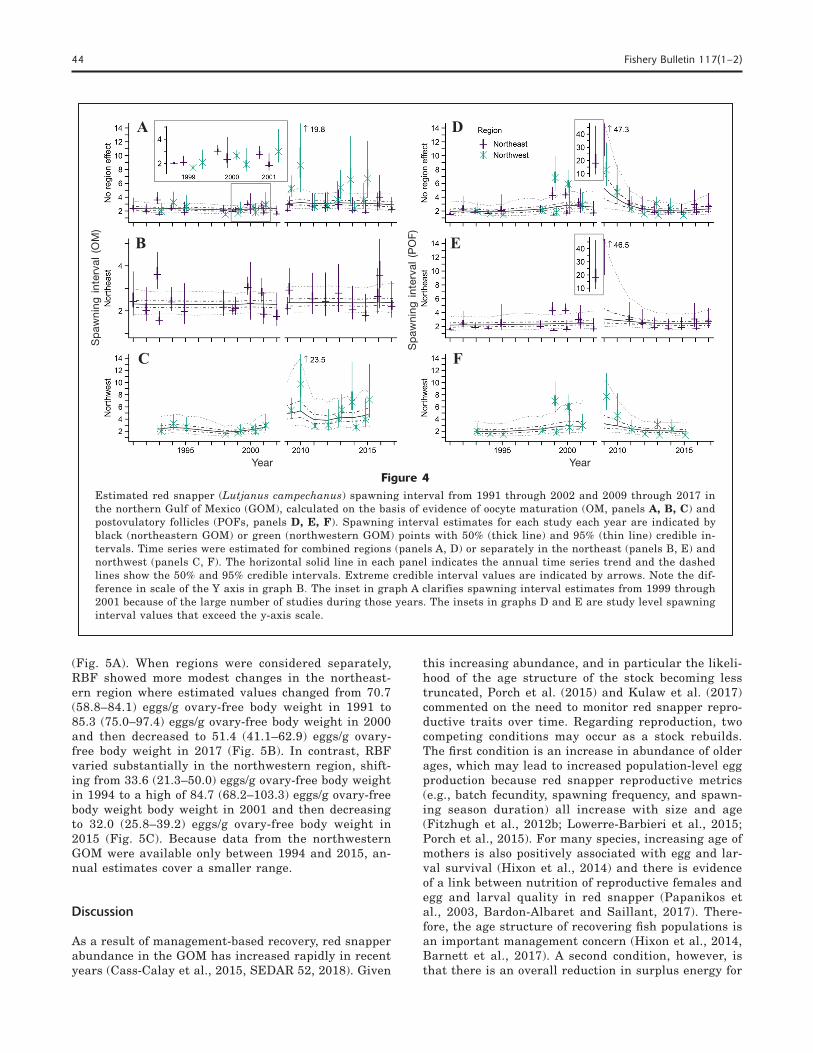
Individual RBF values varied greatly within all studies. Values ranged from 0.179 eggs/g ovary-free body weight in 1994 to 394.0 eggs/g ovary-free body weight in 2013 in the northeastern GOM and 0.048 eggs/g ovary-free body weight in 1998 to 557.39 eggs/g ovary-free body weight in 2001 in the northwestern GOM. Some of this variation was likely due to including RBF values col-lected from all months of the spawning season, includ-ing the beginning (April) and ending (September) of the spawning season. Despite the wide variation in individ-ual RBF values the model is moderately robust to outli-ers, which can be seen in the relatively narrow credible intervals (Fig. 5). There were no RBF data available from the northeastern GOM during 2005–2006 (2003–2008 for the northwestern GOM), and therefore those years are not included in the model.
Relative batch fecundity showed a trend of decreas-ing values over time, particularly after 2012 (Fig. 5). Estimated mean (50% confidence interval [lower–upper as 25% and 75% CI]) RBF values for regions combined were initially 58.0 (45.8–71.4) eggs/g ovary-free body weight in 1991, increased to 83.8 (74.4–93.5) eggs/g ovary-free body weight in 2001, then decreased to 35.7 (29.1–43.1) eggs/g ovary-free body weight in 2017
Figure 3Photomicrograph of ovarian tissue from a female red snapper (Lutja-nus campechanus) in the actively spawning reproductive subphase with 24-h postovulatory follicles (POFs) that show evidence of daily spawning. OM=oocytes undergoing oocyte maturation.
44 Fishery Bulletin 117(1–2)
(Fig. 5A). When regions were considered separately, RBF showed more modest changes in the northeast-ern region where estimated values changed from 70.7 (58.8–84.1) eggs/g ovary-free body weight in 1991 to 85.3 (75.0–97.4) eggs/g ovary-free body weight in 2000 and then decreased to 51.4 (41.1–62.9) eggs/g ovary-free body weight in 2017 (Fig. 5B). In contrast, RBF varied substantially in the northwestern region, shift-ing from 33.6 (21.3–50.0) eggs/g ovary-free body weight in 1994 to a high of 84.7 (68.2–103.3) eggs/g ovary-free body weight body weight in 2001 and then decreasing to 32.0 (25.8–39.2) eggs/g ovary-free body weight in 2015 (Fig. 5C). Because data from the northwestern GOM were available only between 1994 and 2015, an-nual estimates cover a smaller range.
Discussion
As a result of management-based recovery, red snapper abundance in the GOM has increased rapidly in recent years (Cass-Calay et al., 2015, SEDAR 52, 2018). Given
this increasing abundance, and in particular the likeli-hood of the age structure of the stock becoming less truncated, Porch et al. (2015) and Kulaw et al. (2017) commented on the need to monitor red snapper repro-ductive traits over time. Regarding reproduction, two competing conditions may occur as a stock rebuilds. The first condition is an increase in abundance of older ages, which may lead to increased population-level egg production because red snapper reproductive metrics (e.g., batch fecundity, spawning frequency, and spawn-ing season duration) all increase with size and age (Fitzhugh et al., 2012b; Lowerre-Barbieri et al., 2015; Porch et al., 2015). For many species, increasing age of mothers is also positively associated with egg and lar-val survival (Hixon et al., 2014) and there is evidence of a link between nutrition of reproductive females and egg and larval quality in red snapper (Papanikos et al., 2003, Bardon-Albaret and Saillant, 2017). There-fore, the age structure of recovering fish populations is an important management concern (Hixon et al., 2014, Barnett et al., 2017). A second condition, however, is that there is an overall reduction in surplus energy for
Figure 4Estimated red snapper (Lutjanus campechanus) spawning interval from 1991 through 2002 and 2009 through 2017 in the northern Gulf of Mexico (GOM), calculated on the basis of evidence of oocyte maturation (OM, panels A, B, C) and postovulatory follicles (POFs, panels D, E, F). Spawning interval estimates for each study each year are indicated by black (northeastern GOM) or green (northwestern GOM) points with 50% (thick line) and 95% (thin line) credible in-tervals. Time series were estimated for combined regions (panels A, D) or separately in the northeast (panels B, E) and northwest (panels C, F). The horizontal solid line in each panel indicates the annual time series trend and the dashed lines show the 50% and 95% credible intervals. Extreme credible interval values are indicated by arrows. Note the dif-ference in scale of the Y axis in graph B. The inset in graph A clarifies spawning interval estimates from 1999 through 2001 because of the large number of studies during those years. The insets in graphs D and E are study level spawning interval values that exceed the y-axis scale.
Year
Spaw
ning
inte
rval
(OM
)
Year
Spaw
ning
inte
rval
(PO
F)
A D
B E
C F
Brown-Peterson et al.: Meta-analysis of reproductive parameters of Lutjanus campechanus in the Gulf of Mexico 45
growth and reproduction as the population increases (McBride et al., 2015, Porch et al., 2015). Decreases in fecundity with increasing fish density have been previ-ously reported (Rose et al., 2001, Forrester et al., 2011, Hixon et al., 2012), and this decrease has been hypoth-esized to be a function of competition, food availability, or habitat availability. Thus density-dependence pre-dicts a compensatory response wherein egg production may decline as population increases (Rose et al., 2001, Kulaw et al., 2017), possibly reflecting reproductive tradeoffs. Both conditions must be considered in order to track stock productivity over time (Trippel, 1995, Rose et al., 2001).
Our temporal meta-analysis models provide a unique approach to understanding potential changes in female red snapper reproductive parameters over a 27-year period. Although some reproductive parameters of red snapper, such as female spawning fraction with fish size, region, depth, and month (Porch et al., 2015) and variations in fecundity by habitat (Karnauskas et
al., 2017) have been previously modeled, our study is the first effort to use modeling to quantify decade-level changes in red snapper reproduction. Both Porch et al. (2015) and Karnauskas et al. (2017) explicitly mod-eled an age-structured population. Our purpose was to more fully evaluate whether there is evidence for a compensatory response by examining key elements of egg production as represented by spawning interval, fecundity, and duration of spawning season (i.e., based on the GSI). Compensation can be very difficult to de-tect from empirical field data which often come from short-term studies (Rose et al., 2001). This challenge prompted our focus on meta-analysis. We examined trends over 27 years and based on many separate stud-ies, and therefore age data were often not available. Therefore, we modeled spawning interval averaged across multiple age classes, and the size-age effect on fecundity was standardized to the degree possible by examination of RBF. Nor did we explicitly account for time-of-year in spawning interval and RBF analy-
Figure 5Estimated red snapper (Lutjanus campechanus) relative batch fecundity (number eggs/g ovary-free body weight, OFBW) from 1991 through 2004 and 2007 through 2017 in the northern Gulf of Mexico (GOM). Individual relative batch fecundity values are represented by circles (northeastern GOM) and triangles (northwestern GOM). The solid line indicates the annual trend with the dashed lines showing the 50% and 95% credible intervals. The trend was estimated for regions combined (graph A) and separately for the northeast (graph B) and northwest (graph C). Extreme values are indicated by arrows in the region-specific panels but are omitted from the combined-region plot for visual clarity.
A
B
C
Year
Rela
tive
batc
h fe
cund
ity
(no.
of e
ggs/
g O
FBW
)
46 Fishery Bulletin 117(1–2)
ses, despite evidence that these parameters may vary throughout the reproductive season (Fitzhugh et al., 2012b, Lowerre-Barbieri et al., 2015). However, most studies commonly focused on reproductive sampling for these parameters during peak (summer) reproductive months, thus eliminating some temporal variation.
Our analyses indicate there was an overall decrease in egg production between 1991 and 2017, a decrease in RBF, and either no change or an increase in spawn-ing interval. These differences were more pronounced in the northwestern GOM than in the northeastern GOM. Athough there was a downward trend in rela-tive batch fecundity for the northeast, no substan-tial changes were estimated. There was no change in spawning interval in the northeast, whereas an in-crease was seen in the northwest when the OM method was used to calculate spawning interval. The lack of a meaningful change in spawning interval values with the POF method was likely due to large variations in the spawning interval values across months. Fish with POFs were more infrequently captured at the begin-ning and ending of the reproductive season than fish undergoing OM, leading to smaller sample sizes. De-spite the duration of the spawning season remaining relatively constant from 1994 through 2017, a decrease in total egg production (lower RBF, greater spawning interval) suggests lower annual fecundity in the stock, particularly in the northwestern GOM. Our analyses suggest the potential of a compensatory reproductive effect may be more evident in the northwestern GOM. This compensatory effect may correspond with stock assessment projections of higher levels of spawning stock biomass and a greater likelihood of sustained re-covery in the west (Cass-Calay et al., 2015, SEDAR 52, 2018), resulting in increased fish density and greater competition for resources as discussed above.
Differences in the population structure of red snap-per stocks between the eastern and western GOM have been previously identified. The northwestern GOM shows evidence of greater numbers of older red snapper, particularly in the last 8–10 years (Saari et al., 2014, Cass-Calay et al., 2015, Porch et al., 2015, Karnauskas et al., 2017, SEDAR 52, 2018), as well as greater numbers of eggs and larvae (Lyczkowki-Shultz and Hanisko, 2007, Hanisko et al., 2017). There is also evidence of a metapopulation structure of north-ern GOM red snapper; the demographic differences between GOM regions are supported by genetic analy-sis (Gold and Saillant, 2007, Puritz et al., 2016). Pre-vious findings of differences in maturity, growth, and demographics between the eastern and western GOM have suggested that density-dependent processes may be occurring (Fitzhugh et al., 2004, Jackson et al., 2007, Saari et al., 2014). Kulaw et al. (2017) recently reported more evidence of regional differences in com-paring reproductive traits from Alabama and Louisiana red snapper sampled ~10 years apart, and again in-voked compensation to help explain these differences. As with the present study, they saw a decreased trend in spawning frequency (increased spawning interval)
and provided evidence for decreased GSI and increas-ing age at maturity in their northwestern GOM study area. Kulaw et al. (2017) reported that a more detect-able trend of declining reproductive output was evi-dent among younger females in the west than in the east of the Mississippi River. However, Kulaw et al. (2017) tempered their conclusions regarding the degree of density dependence by age because of their limited sample size, and pointed to potential habitat factors in partially explaining their results.
Red snapper are most commonly found associated with underwater structures, and the type of structure (i.e., habitat) may influence reproduction. Higher re-productive output was found at natural versus artifi-cial habitats on the outer Louisiana shelf area of study (Glenn et al., 2017, Kulaw et al., 2017), although natu-ral and artificial reefs were at different depths which may confound the reported results. Red snapper in-habiting deep (60–100 m) artificial reefs have a longer spawning season and a higher percentage of spawn-ing-capable and actively spawning females than red snapper at shallow (<20 m) reefs (Brown-Peterson and Moncrief2); these differences are likely related to larger fish captured at deeper depths. In contrast, differences in reproductive parameters were not seen among habi-tats in artificial and natural reefs in the same depth zone off Texas (Downey et al., 2018). High densities of young red snapper are particularly common on artifi-cial structures, such as oil platforms and small artifi-cial reefs, although these structures represent only a fraction of the area in the northern GOM (Karnauskas et al., 2017). The majority of the data since 2012 used in the analyses in the present study have been from artificial structures. Therefore, we cannot reject the possibility that age and habitat may be confounding influences in our results, but we examined red snapper from a wider geographic area and longer time period than those of previous studies.
Although we were unable to model regional dif-ferences in spawning seasonality, it is clear from our analysis that the peak spawning time for red snapper in the northern GOM of June through August has re-mained relatively constant over the 27-year period ex-amined. This peak spawning period is well supported in the literature (Render, 1995; Collins et al., 1996; Fitzhugh et al., 2004). Our analysis suggests May is also a peak spawning month since 1994, which is cor-roborated by back calculated spawning dates of juve-nile red snapper in 1995 (Szedlmayer and Conti, 1999). In addition, spawning capable female red snapper have been recently reported from April, September, and ear-ly October (Lowerre-Barbieri et al., 2012; Fitzhugh et al., 2012a). Our model used mean monthly GSI ≥ 1.0 to define reproductively active females, which does not
2 Brown-Peterson, N. J., and T. D. Moncrief. 2017. Does depth influence Red Snapper reproductive biology metrics? In Abstract book, 2017 Joint Meetings of Ichthyologists and Herpetologists, Austin, Texas, p. 69–70. Available from website.
Brown-Peterson et al.: Meta-analysis of reproductive parameters of Lutjanus campechanus in the Gulf of Mexico 47
reflect the presence of a few individual females with high GSI values in each month. Therefore, the major-ity of the population was likely not reproductively ac-tive in April, September, and October, thus leading to a monthly mean GSI < 1.0. Furthermore, our spawning duration estimates cannot account for half months (i.e., for a decrease in GSI in the second half of a month), and may thus result in a slight underestimation of spawning season duration. However, we do estimate a 4.5-month duration of the spawning season since 1994, which likely corresponds to a May through mid-September spawning season. An additional challenge in modeling spawning seasonality is the fact that GSI reflects proportion data, which can result in skewed model results. Finally, temperature is an important regulator of spawning seasonality, particularly at the beginning of the reproductive season (Brown-Peterson et al., 2002). Incorporation of a temperature compo-nent into future models of spawning seasonality may increase the robustness of the seasonal estimates. An understanding of the duration of the spawning season, as well as how it may vary across time and with age is important for the most accurate determinations of age and size at sexual maturity, spawning frequency, and annual fecundity, which are all important metrics for optimal management of red snapper stocks.
The estimated decline in red snapper reproductive parameters from 1991 through 2017 may raise concern for the continued recovery of the red snapper popula-tion, particularly in the northwestern GOM. However our results are primarily based upon reproductive samples from young females (≤ age 6), similar to those from other studies (Porch et al., 2015; Glenn et al.; 2017, Karnauskas et al.; 2017; Kulaw et al., 2017). Ku-law et al. (2017) suggest that reductions in reproduc-tive output of young females may be more than offset by increasing contributions from older females. Unfor-tunately, older age females (e.g. ≥ age 9) are uncom-mon among reproductive studies despite estimates that show that peak per-capita reproductive output occurs around age 14 (Porch, 2007; Porch et al., 2015; Ku-law et al., 2017). Owing to the economic importance of GOM red snapper, we expect sampling for reproductive metrics to continue and possibly increase over time. Al-though slow to accrue, reproductive data are being col-lected from older females. The increasing abundance of older red snapper, particularly in the northwestern GOM (Porch et al., 2015, Karanauskas et al., 2017, Table 2.24 in SEDAR 52, 2018), suggests a changing population structure that has likely been aided by management regulations to reduce fishing pressure. Ultimately we do want to account for age-based effects of reproductive compensation and recommend modeling the sensitivity of compensation in predictions of stock status as discussed by Rose et al. (2001). Density-de-pendent reproductive compensation, if it exists, has im-portant management implications because reproductive productivity is the basis for stock assessment projec-tions and reference points (Rose et al., 2001, Porch et al., 2015). Continued monitoring and analysis of repro-
ductive attributes over the long term, such as those presented here, will provide insights into red snapper biology and stock condition.
Acknowledgments
We thank D. Kulaw, H. Glenn, C. Downey and G. Stuntz for sharing raw data. Staff from the National Marine Fisheries Service (NMFS) Southeast Fisheries Science Center, T. Moncrief, and M. Oshima assisted with collection and analyses of NMFS and Mississippi data. X. Zhang and A. Chester made helpful comments on the manuscript. Analyses were performed on the Texas Advanced Computing Center Lonestar 5 super-computer. Funding from the National Fish and Wild-life Federation in collaboration with the Mississippi Department of Environmental Quality, Covington Civil and Environmental Engineering and the Mississippi Department of Marine Resources (NBP) and the Office of Graduate Studies at the University of Texas-Austin (CRP) supported the authors.
Literature cited
Alexander, R. J. 2015. Comparing reproductive capacity of nearshore and
offshore Red Snapper, Lutjanus campechanus, on artifi-cial reefs in the western Gulf of Mexico. M.S. thesis, 84 p. Univ. Texas Rio Grande Valley, Brownsville TX.
Bagenal, T. B., and E. Braum. 1971. Eggs and early life history. In Methods for assess-
ment of fish production in fresh waters, IBP 2nd ed. (W. F. Ricker, ed.), p. 159–181. Blackwell Science, Oxford, U.K.
Bardon-Albaret, A., and E. Saillant. 2017. Egg quality traits and predictors of embryo and fry
viability in red snapper Lutjanus campechanus. Aquac. Rep. 7:48–56. Crossref
Barnett, A. K., T. A. Branch, R. A. Ranasinghe, and T. E. Essington. 2017. Old-growth fishes become scarce under fish-
ing. Curr. Biol. 27: 2843–2848.e2. CrossrefBrown-Peterson, N. J., M. S. Peterson, D. L. Nieland, M. D.
Murphy, R. G. Taylor, and J. R. Warren. 2002. Reproductive biology of female spotted seatrout,
Cynoscion nebulosus, in the Gulf of Mexico: differenc-es among estuaries? Environ. Biol. Fish. 63:405–415. Crossref
Brown-Peterson, N. J., K. M. Burns, and R. M. Overstreet. 2009. Regional differences in Florida red snapper repro-
duction. Proc. Gulf Carib. Fish. Inst. 61:149–155.Brown-Peterson, N. J., D. M. Wyanski, F. Saborido-Rey, B. J.
Macewicz, and S. K. Lowerre-Barbieri. 2011. A standardized terminology for describing reproduc-
tive development in fishes. Mar. Coast. Fish. 3:52–70. Crossref
Carpenter, B., A. Gelman, M. D. Hoffman, D. Lee, B. Goodrich, M. Betancourt, M. Brubaker, J. Guo, P. Li, and A. Riddell. 2017. Stan: A probabilistic programming language. J.
Stat. Software 76(1), 32 p. Crossref
48 Fishery Bulletin 117(1–2)
Cass-Calay, S. L, C. E. Porch, D. R. Goethel, M. W. Smith, V. Matter, and K. J. McCarthy. 2015. Stock assessment of red snapper in the Gulf of Mex-
ico 1872–2015—with provisional 2014 landings. SEDAR red snapper 2014 update assessment, North Charleston, SC, 242 p. Available from website.
Collins, L. A., A. G. Johnson, and C. P. Keim. 1996. Spawning and annual fecundity of the red snap-
per (Lutjanus campechanus) from the northeastern Gulf of Mexico. In Biology, fisheries and culture of tropical groupers and snappers, International Center for Liv-ing Aquatic Resources Management (ICLARM) Proceed-ings 48 (F. Arreguin-Sanchez, J. L. Munfo, M .C. Bal-gos, and D. Pauly, eds.), p. 174–188. ICLARM, Manila, Philippines.
Cowan, Jr., J. H., K. M. Boswell, K. A. Simonsen, C. R. Saari, and D. Kulaw. 2012. Working paper for red snapper data workshop (SE-
DAR 31). SEDAR31-DW-03. SEDAR, North Charleston, SC. 49 p. [Available from website.]
Downey, C. H., M. K. Streich, R. A. Brewton, M. J. Ajemian, J. J. Wetz, and G. W. Stunz. 2018. Habitat-specific reproductive potential of Red
Snapper: A comparison of artificial and natural reefs in the western Gulf of Mexico. Trans. Am Fish. Soc. 147:1030–1041. Crossref
Fitzhugh, G. R., M. S. Duncan, L. A. Collins, W. T. Walling Jr., and D. W. Oliver. 2004. Characterization of red snapper (Lutjanus
campechanus) reproduction: for the 2004 Gulf of Mexico SEDAR. SDEAR7-DW-35. Contribution Series 04-10, National Marine Fisheries Service, Panama City, FL, 29 p.
Fitzhugh, G. R., E. T. Lang, and H. Lyon. 2012a. Expanded annual stock assessment survey 2011:
red snapper reproduction. SEDAR31-DW-07. SEDAR, North Charleston, SC. 33 p. [Available from website.]
Fitzhugh, G. R., K. W. Shertzer, G. T. Kellison, and D. M. Wyanski. 2012b. Review of size- and age-dependence in batch
spawning: implications for stock assessment of fish spe-cies exhibiting indeterminate fecundity. Fish. Bull. 110:413–425.
Forrester, G., L. Harmon, J. Helyer, W. Holden, and R. Karis. 2011. Experimental evidence for density-dependent repro-
ductive output in a coral reef fish. Pop. Ecol. 53:155–163. Crossref
Gelman, A., J. B. Carlin, H. S. Stern, D. B. Dunson, A. Vehtari, and D. B Rubin. 2013. Bayesian data analysis, 3rd ed., 639 p. CRC Press,
Boca Raton, FL.Glenn, H. D., J. H. Cowan and J. E. Powers.
2017. A comparison of Red Snapper reproductive potential in the northwestern Gulf of Mexico: natural versus ar-tificial habitats. Mar. Coast. Fish. 9:139-148. Crossref
GMFMC.2007. Amendment 27 to the reef fish fishery management
plan and Amendment 14 to the shrimp fishery manage-ment plan. Gulf of Mexico Fishery Management Coun-cil, Tampa, FL, 480 p.
Gold, J. R. and E. Saillant. 2007. Population structure of red snapper in the northern
Gulf of Mexico. In Red snapper ecology and fisheries in the U. S. Gulf of Mexico, Symposium 60 (W. F. Patterson
III, J. H. Cowan Jr., G. R. Fitzhugh, and D. L. Nieland, eds.), p. 201–216. Am. Fish. Soc., Bethesda, MD.
Goodyear, C.P. 1988. Recent trends in the red snapper fishery of the Gulf
of Mexico. Technical Report CRD 87/88-19. National Ma-rine Fisheries Service, Southeast Fisheries Science Cen-ter, Miami, Florida. [Available from website.]
Hanisko, D. S., A. G. Pollack, D. M. Drass, P. J. Bond, C. Stepongzi, T. Wallace, A. Millet, C. Cowan, C. M. Jones, G. Zapfe and G. W. Ingram Jr.2017. Red Snapper (Lutjanus campechanus) larval indices
of relative abundance from SEAMAP Fall Plankton Sur-veys, 1986 to 2016. SEDAR52-WP-11. SEDAR, North Charleston, SC, 36 p. [Available from website.]
Hixon, M. A., T. W. Anderson, K. L Buch, D. W. Johnson, J. B. McLeod, and C. D. Stallings. 2012. Density dependence and population regulation in
marine fish: a large-scale, long-term field manipula-tion. Ecol. Monogr. 82:467–489. Crossref
Hixon, M. A., D. W. Johnson, and S. M. Sogard. 2014. BOFFFFs: on the importance of conserving old-
growth age structure in fishery populations. ICES J. Mar. Sci. 71:2171–2185. Crossref
Jackson, M. W., J. H, Cowan Jr., and D. L. Nieland. 2007. Demographic differences in northern Gulf of Mexico
Red Snapper reproductive maturation: implications for the unit stock hypothesis. In Red snapper ecology and fisheries in the U. S. Gulf of Mexico, Symposium 60 (W. F. Patterson III, J. H. Cowan, Jr., G. R. Fitzhugh, and D. L. Nieland, eds.), p. 217–227. Am. Fish. Soc., Bethesda, MD.
Karnauskas, M., J. F. Walter III, M. D. Campbell, A. G. Pol-lack, J. M. Drymon and S. Powers. 2017. Red snapper distribution on natural habitats
and artificial structures in the northern Gulf of Mexi-co. Mar. Coast. Fish. 9:50–67. Crossref
Kulaw, D. H., J. H. Cowan, and M. W. Jackson. 2017. Temporal and spatial comparisons of the reproduc-
tive biology of northern Gulf of Mexico (USA) red snapper (Lutjanus campechanus) collected a decade apart. PLoS ONE 12(3):e0172360. Crossref
Lang, E. T. and B. J. Falterman. 2017. A comparison of sampling methods and continu-
ation of red snapper life history metrics. SEDAR52-WP-07. SEDAR, North Charleston, 10 p. [Available from website.]
Lowerre-Barbieri, S. L. Crabtree, T. S. Switzer, and R. H. Mc-Michael Jr. 2012. Spatio-temporal dynamics in red snapper reproduc-
tion on the west Florida Shelf, 2008-2011. SEDAR31-DW-07. SEDAR, North Charleston, SC. 11 p. [Available from website.]
Lowerre-Barbieri, S. L, L. Crabtree, T. Switzer, S. W. Burnsed, and C. Guenther. 2015. Assessing reproductive resilience: an example
with South Atlantic red snapper Lutjanus campecha-nus. Mar. Ecol. Prog. Ser. 526:125–141. Crossref
Lyczkowski-Shultz, J., and D. S. Hanisko. 2007. A time series of observation on red snapper larvae
from SEAMAP surveys, 1982–2003: seasonal occurrence, distribution, abundance, and size. In Red snapper ecology and fisheries in the U.S. Gulf of Mexico, Sym-posium 60 (W. F. Patterson III, J. H. Cowan Jr., G. R. Fitzhugh, and D. L. Nieland, eds.), p. 3–23. Am. Fish. Soc., Bethesda, MD.
Brown-Peterson et al.: Meta-analysis of reproductive parameters of Lutjanus campechanus in the Gulf of Mexico 49
McBride, R. S., S. Somarakis, G. R. Fitzhugh, A. Albert, N. A. Yaragina, M. J. Wuenschel, A. Alonso-Fernandez, and G. Basilone. 2015. Energy acquisition and allocation to egg production
in relation to fish reproductive strategies. Fish Fish. 16:23–57. Crossref
McElreath, R. 2016. Statistical rethinking: a Bayesian course with
examples in R and Stan, 469 p. CRC Press/Taylor & Francis, Boca Raton, FL.
Papanikos, N., R. P. Phelps, K. Williams, A. Ferry, and D. Maus. 2003. Egg and larval quality of natural and induced
spawns of red snapper, Lutjanus campechanus. Fish Phys. Biochem. 28:487–488. Crossref
Porch, C. E. 2007. An assessment of the red snapper fishery in the
U.S. Gulf of Mexico using a spatially-explicit age-struc-tured model. In Red snapper ecology and fisheries in the U. S. Gulf of Mexico, Symposium 60 (W. F. Patterson III, J. H. Cowan Jr., G. R. Fitzhugh, and D. L. Nieland, eds.), p.355–384. Am. Fish. Soc., Bethesda, MD.
Porch, C. E., G. R. Fitzhugh, E. T. Lang, H. M Lyon, and B. C. Linton. 2015. Estimating the dependence of spawning frequency
on size and age in Gulf of Mexico red snapper. Mar. Coast. Fish. 7:233–2245. Crossref
Puritz, J. B., J. R. Gold and D. S. Portnoy. 2016. Fine-scale partitioning of genomic variation among
recruits in an exploited fishery: causes and consequenc-es. Sci. Rep. 6:36095. Crossref
R Core Team. 2017. R: a language and environment for statistical com-
puting. R Foundation for Statistical Computing, Vien-na, Austria. Available from website.
Render, J. H. 1995. The life history (age, growth, and reproduction) of
red snapper (Lutjanus campechanus) and its affinity for oil and gas platforms. Ph.D. diss., 76 p. Louisiana State Univ., Baton Rouge, LA.
Rose, K. A., J. H. Cowan Jr., K. O. Winemiller, R. A. Myers, and R. Hilborn. 2001. Compensatory density dependence in fish popula-
tions: importance, controversy, understanding and prog-nosis. Fish Fish. 2:293–327. Crossref
Saari, C. R., J. H. Cowan Jr., and K. M. Boswell. 2014. Regional differences in the age and growth of red
snapper (Lutjanus campechanus) in the U.S. Gulf of Mexico. Fish. Bull. 112:261–273. Crossref
SEDAR 7.2005. Stock assessment of SEDAR 7: Gulf of Mexico
red snapper. Southeast Data, Assessment, and Review, Charleston, SC, 480 p.
SEDAR 31.2013. SEDAR 31: Gulf of Mexico red snapper. Southeast
Data, Assessment, and Review, Charleston, SC, 294 p.SEDAR 52.
2018. SEDAR 52: Stock assessment report Gulf of Mexico red snapper, North Charleston, SC, 435 p.
Stan Development Team. 2017. Stan modeling language users guide and reference
manual, vers. 2.16.0. Available from website.Szedlmayer, S. T., and J. Conti.
1999. Nursery habitats, growth rates, and seasonality of age-0 red snapper, Lutjanus campechanus, in the north-east Gulf of Mexico. Fish. Bull. 97:626–635.
Trippel, E. A. 1995. Age at maturity as a stress indicator in fisher-
ies. Bioscience 45:759–771. Crossref