multi-zone reaction-based modeling of combustion for
TRANSCRIPT

Standard Article
International J of Engine Research1–14� IMechE 2018Reprints and permissions:sagepub.co.uk/journalsPermissions.navDOI: 10.1177/1468087418788488journals.sagepub.com/home/jer
Multi-zone reaction-based modeling ofcombustion for multiple-injectiondiesel engines
Yifan Men1, Ibrahim Haskara2 and Guoming Zhu1
AbstractAs the requirements for performance and restrictions on emissions become stringent, diesel engines are equipped withadvanced air, fuel, exhaust gas recirculation techniques, and associated control strategies, making them incredibly com-plex systems. To enable model-based engine control, control-oriented combustion models, including Wiebe-based andsingle-zone reaction-based models, have been developed to predict engine burn rate or in-cylinder pressure. Despitemodel simplicity, they are not suitable for engines operating outside the normal range because of the large error beyondcalibrated region with extremely high calibration effort. The purpose of this article is to obtain a parametric understand-ing of diesel combustion by developing a physics-based model which can predict the combustion metrics, such as in-cylinder pressure, burn rate, and indicated mean effective pressure accurately, over a wide range of operating conditions,especially with multiple injections. In the proposed model, it is assumed that engine cylinder is divided into three zones:a fuel zone, a reaction zone, and an unmixed zone. The formulation of reaction and unmixed zones is based on thereaction-based modeling methodology, where the interaction between them is governed by Fick’s law of diffusion. Thefuel zone is formulated as a virtual zone, which only accounts for mass and heat transfer associated with fuel injectionand evaporation. The model is validated using test data under different speed and load conditions, with multiple injec-tions and exhaust gas recirculation rates. It is shown that the multi-zone model outperformed the single-zone model inin-cylinder pressure prediction and calibration effort with a mild penalty in computational time.
KeywordsReaction-based combustion model, multi-zone combustion model, control-oriented model, diesel engine model
Date received: 28 March 2018; accepted: 15 June 2018
Introduction
To meet the demands for performance (torque and fueleconomy) and to satisfy the government regulations foremissions and safety, modern diesel engines, typicallyoperated under lean air–fuel ratio (AFR), utilize con-trol strategies such as multiple fuel injections andexhaust gas recirculation (EGR). At low speed, a pilotinjection is usually made 5–7 crank angle degrees beforethe main injection to increase the cylinder temperatureso that when the main injection occurs, the cylindertemperature will be at a temperature higher than dieselfuel autoignition point for uniform combustion. It isshown that pilot injection also helps to reduce combus-tion noise.1 Under the regenerative operations of engineaftertreatment subsystems (e.g. diesel particulate filterand lean NOx trap), a post injection is often used tomaintain stoichiometric AFR of the engine exhaustgas, and the injection timing is usually significantly
retarded. These strategies make control of diesel enginesystems more difficult than ever. To enable model-based control, physics-based models were developed tosimulate the engine behavior in real time. Therefore, itis required that a control-oriented engine combustionmodel gives accurate predictions while keeping itselfcomputationally efficient.
Features of a combustion model include predictingburn rate, in-cylinder temperature and pressure closely
1Department of Mechanical Engineering, Michigan State University, East
Lansing, MI, USA2General Motors Company, Warren, MI, USA
Corresponding author:
Guoming Zhu, Department of Mechanical Engineering, Michigan State
University, 1497 Engineering Research Court, East Lansing, MI 48824,
USA.
Email: [email protected]

related to engine performance (e.g. torque and effi-ciency), which makes it one of the most critical sub-models of an engine system model. Various types ofcombustion models have been developed that can becategorized into four groups based on their complexity:(1) zero-dimensional models, (2) quasi-dimensionalmodels, (3) one-dimensional models, and (4) three-dimensional models.
One-dimensional and three-dimensional models usu-ally are dealt with using strict fluid dynamics equationscoupled with detailed chemical kinetic mechanismsrequiring substantial computational effort and time.Therefore, although these models are of high accuracy,they are excluded in the discussions because they arenot feasible for control applications (real-timesimulations).
Zero-dimensional models are also referred to assingle-zone models due to the assumption that theentire engine cylinder is a uniform thermodynamic con-trol volume, which undergoes energy and/or massexchange with the surroundings and energy releasedduring the combustion process is governed by first lawof thermodynamics. In most single-zone models2 andsome multi-zone models,3,4 a so-called Wiebe function5
is used to model the fuel burn rate. It is a model ofmass-fraction-burned (MFB) with pre-determined com-bustion parameters, which are typically modeled as alookup table over the normal engine operational range.The Wiebe function has advantages of low computa-tional load and easy implementation. However, whenthe control variables are out of the modeled opera-tional range, for instance, when multiple injection strat-egy changes, Wiebe-based combustion models are notonly unable to provide accurate predictions, but alsodifficult to calibrate. Moreover, a separate ignitiondelay model is needed to predict the start of combus-tion, which in most cases is accomplished by Arrheniusintegral.6 An empirical burn rate model7 is used alter-natively by including cylinder states such as tempera-ture, pressure, and fuel and oxygen concentrations. Themodel predicts heat release rate, peak pressure, andindicated mean effective pressure (IMEP) fairly well formultiple injections while keeping computational loadlow. However, complementary models such as fuel eva-poration model, mixing model, and ignition delaymodel, crucial to predicting combustion timing andlimiting the burn rate, are required for such type ofmodels.
Reaction-based modeling approach8 has been pro-posed and used for diesel combustion. These modelsutilize thermochemistry and chemical kinetics9 todescribe the interactive dynamics among in-cylinderspecies, which is quite different from the traditionalmacroscopic thermodynamics-based models. The prop-erties of the whole cylinder gas is assumed to be theweighted sum of all the species properties, althoughtemperature is uniform over the entire control volume.The burn rate is calculated based on the species concen-trations and temperature, depending on which chemical
kinetic mechanism is assumed. Ideally, the reaction-based models are able to adapt to any injection profiledue to the consistent formulation of the model struc-ture. Moreover, because concentrations and tempera-ture are fed back to the burn rate calculation, themodel has the potential to predict heat release rateunder various operational conditions such as multipleinjections and different EGR rates. The model in litera-ture8 was tested to predict the in-cylinder pressure rea-sonably accurately under a wide range of operatingconditions, where it turned out that two combustioncoefficients are functions of engine speed and load,even injection timing. The functions can be modeled assecond-order polynomials. The model is still undersingle-zone assumption without evaporation and mix-ing mechanisms leading to early start of combustion,over-predicted burn rate and peak pressure, and fastburning during mixing-controlled combustion stage.
To compensate for the shortcomings of single-zonemodels, quasi-dimensional models (or multi-zone mod-els) are developed mainly to model the inhomogeneityof mixture in a diesel engine cylinder. The modelsremain zero-dimensional but introduce interactionsbetween different zones. There are two types of quasi-dimensional diesel combustion models depending onthe formulation. Phenomenological combustion mod-els10–13 are extension of single-zone empirical modelsby expanding the fuel evaporation model into a spraymodel, where a number of zones with different compo-sition and temperature but the same pressure are usedand an air zone is used to account for air entrainment,leading to accurate predictions of heat release rate,pressure, and NOx emissions. However, the burn rateis still calculated empirically; thus, an ignition delaymodel is required for these models. The other type ofmodels uses chemical kinetics to calculate combustionrate, in addition to using detailed spray model.14,15 Inthese models, the inhomogeneity of composition andtemperature is accounted for by formulating a numberof spray parcels that interact with each other and withthe surrounding air zone. There is no need for ignitiondelay model in this case because the chemical kineticmechanism predicts the start of combustion automati-cally. Fewer calibration parameters are required forsuch models due to the absence of empirical functions.The models are able to predict combustion metrics suchas heat release rate and in-cylinder pressure accuratelyover a wide range of engine operational map. However,the computational load is significantly increased.
In this article, a multi-zone reaction-based model isdeveloped with formulations16 significantly differentfrom the models discussed above. The physical delay isaccounted for by fuel evaporation model, the chemicaldelay by a simplified chemical kinetic mechanism, andair entrainment by Fick’s law of diffusion. The purposeof this work is to significantly reduce the number ofzones in the multi-zone model to decrease the computa-tional load while maintaining the critical physical sig-nificance and keeping the model prediction accurate
2 International J of Engine Research 00(0)
with minimal calibration parameters. Note that thequantitative assessment of computational time of themodel, compared to other multi-zone models, is notwithin the scope of this article. However, it is logicalthat the proposed model is computationally much moreefficient than the multi-zone models with chemicalkinetics.15 The main reason is that in the proposedmodel, chemical kinetics is only assumed in one zone(reaction zone), while in the previously developed mod-els, it is commonly assumed that chemical kineticsexists in each of the divided zone. When the number ofzones is large (normally around 10), the computationbecomes significant (at least 10 times). The advantageof the proposed model is using the simple transportstructure to model the complex diesel combustion,leading to significantly reduced computational effortfor simulating cylinder inhomogeneity and model cali-bration. This is extremely important for model-basedcombustion control requiring real-time simulationcapability. The model’s capability of combustionmetrics prediction has been demonstrated. The modelhas been calibrated with test data from a GM 6.6-Ldiesel engine. The improvement in both accuracy andparameter invariability compared to the single-zonereaction-based model has been shown.
Model description
This section describes the main architecture of the pro-posed multi-zone combustion model. The structure ofthe model will be explained schematically, followed bymathematical derivations of the dynamics in each zone.
Model structure
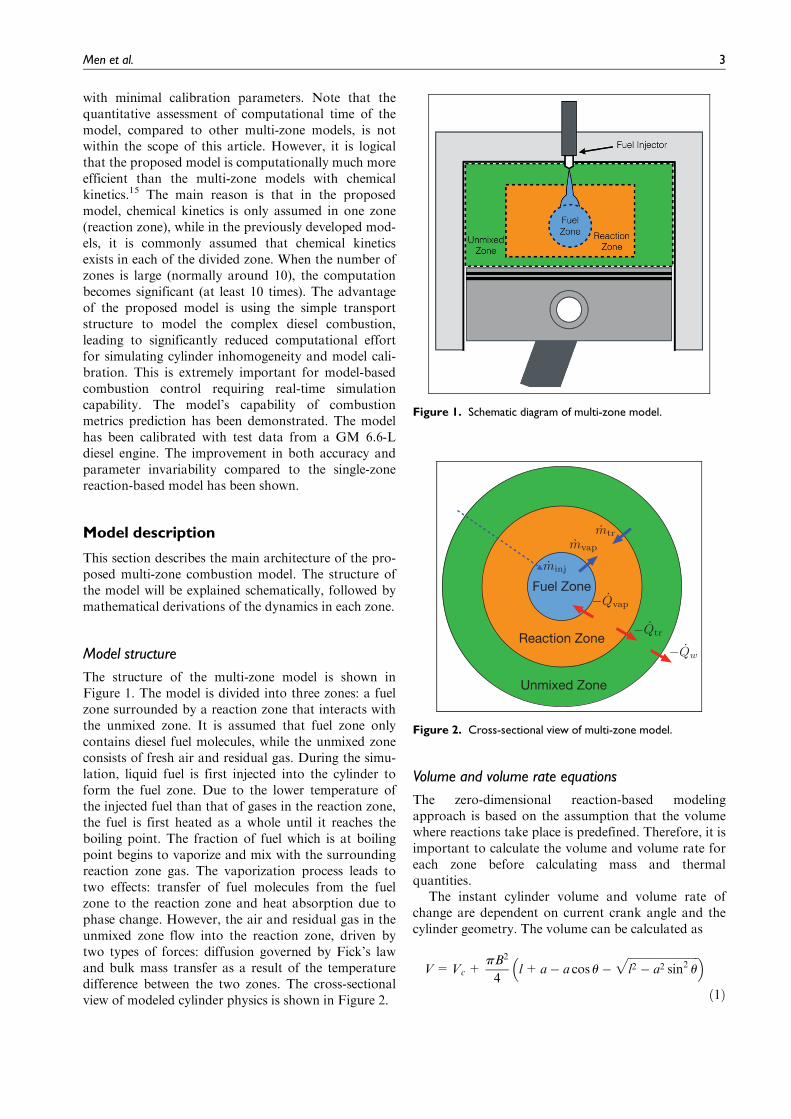
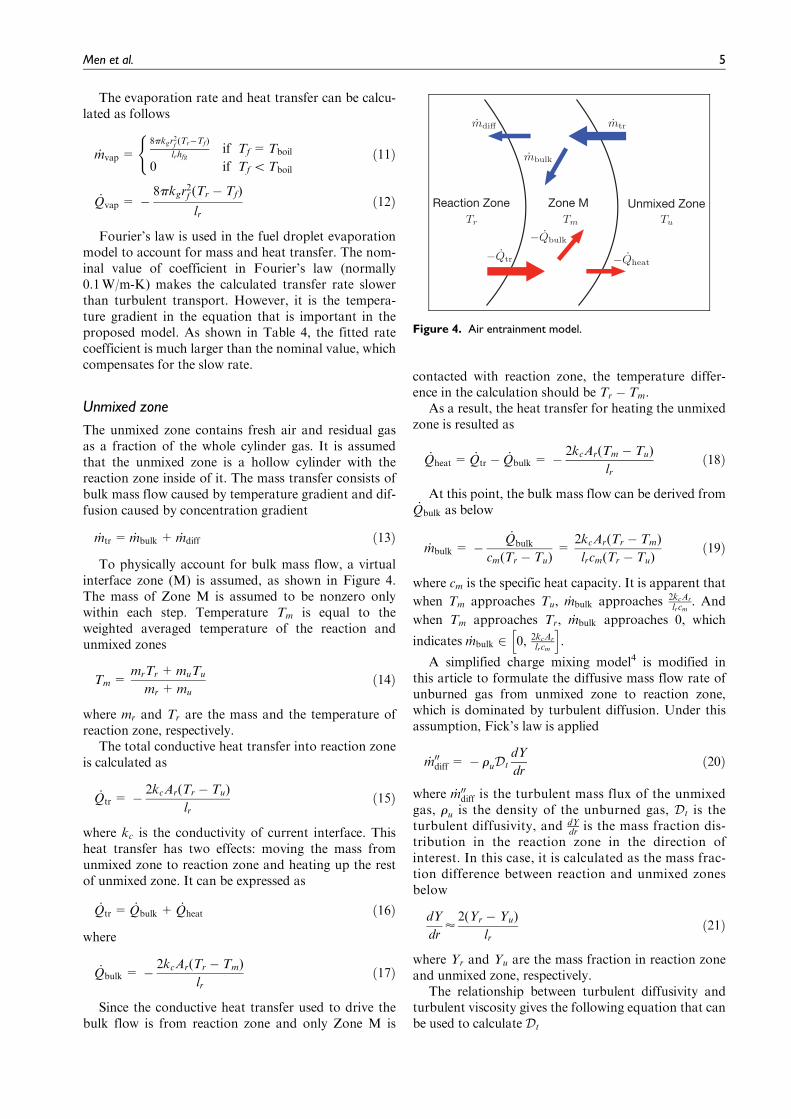
The structure of the multi-zone model is shown inFigure 1. The model is divided into three zones: a fuelzone surrounded by a reaction zone that interacts withthe unmixed zone. It is assumed that fuel zone onlycontains diesel fuel molecules, while the unmixed zoneconsists of fresh air and residual gas. During the simu-lation, liquid fuel is first injected into the cylinder toform the fuel zone. Due to the lower temperature ofthe injected fuel than that of gases in the reaction zone,the fuel is first heated as a whole until it reaches theboiling point. The fraction of fuel which is at boilingpoint begins to vaporize and mix with the surroundingreaction zone gas. The vaporization process leads totwo effects: transfer of fuel molecules from the fuelzone to the reaction zone and heat absorption due tophase change. However, the air and residual gas in theunmixed zone flow into the reaction zone, driven bytwo types of forces: diffusion governed by Fick’s lawand bulk mass transfer as a result of the temperaturedifference between the two zones. The cross-sectionalview of modeled cylinder physics is shown in Figure 2.
Volume and volume rate equations
The zero-dimensional reaction-based modelingapproach is based on the assumption that the volumewhere reactions take place is predefined. Therefore, it isimportant to calculate the volume and volume rate foreach zone before calculating mass and thermalquantities.
The instant cylinder volume and volume rate ofchange are dependent on current crank angle and thecylinder geometry. The volume can be calculated as
V=Vc +pB2
4l+ a� a cos u�
ffiffiffiffiffiffiffiffiffiffiffiffiffiffiffiffiffiffiffiffiffiffiffiffiffiffil2 � a2 sin2 u
p� �ð1Þ
Figure 1. Schematic diagram of multi-zone model.
Figure 2. Cross-sectional view of multi-zone model.
Men et al. 3

where Vc is the clearance volume, B is the bore, l is theconnecting rod length, a is the crank radius (halfstroke), and u is the crank angle. To calculate the vol-ume rate, _V, taking the derivative of V results in
_V=apB2
4sin u 1+ a
cos uffiffiffiffiffiffiffiffiffiffiffiffiffiffiffiffiffiffiffiffiffiffiffiffiffiffil2 � a2 sin2 u
p !
_u ð2Þ
where _u is the engine speed in radius per second.For fuel zone, the fuel is in liquid state, leading to
the assumption that the density of fuel is constant.Therefore, the volume of fuel zone can be calculated as
Vf =mf
rfuel
ð3Þ
where mf is the mass in fuel zone and rfuel is the fueldensity.
In fact, the volume of fuel zone is only about 0.01%of cylinder volume, which makes it negligible in thisstudy.
For unmixed zone, the volume Vu is calculated byideal gas law
Vu =muRuTu
pMWuð4Þ
where mu is the total mass of unmixed zone,Ru =8:314kJ=K� kmol is the universal gas constant,Tu is the unmixed zone temperature, p is the in-cylinderpressure, and MWu is the mixture molecular weight inthe unmixed zone. The rate of volume change ofunmixed zone _Vu is calculated by taking numericalderivative of Vu with respect to time.
The volume and volume rate of reaction zone can becalculated based on that of cylinder and reaction zone
Vr =V� Vu ð5Þ
and
_Vr = _V� _Vu ð6Þ
Fuel zone
The objective of formulating fuel zone is to describe thephysics of fuel evaporation during and after injectionevents using a simplified droplet evaporation model,9
as shown in Figure 3. Certain assumptions are made sothat the model is computationally efficient while stillagrees reasonably well with experimental results:
1. The fuel is a single-component liquid.2. Temperature is uniform and constant over the
entire zone at any instant in time, and it is assumedto be equal to the injection temperature when thefuel is initially injected. As the fuel zone is heatedby the reaction zone, the temperature will increaseuntil it reaches the boiling point of the fuel,Tboil = 505K. Only when the boiling point is
reached does the fuel begin to vaporize. The timeduration between the start of injection (SOI) andstart of fuel evaporation is defined as the physicaldelay of ignition.
3. The heat transfer between fuel and reaction zonesbegins as soon as fuel is injected and ends when theboiling point is reached.
4. The thermo-physical properties, such as thermalconductivity, density, and specific heat, areassumed to be constant for solving the equations.
There are two states, the mass of fuel, mf, and thetemperature, Tf, in the fuel zone
_mf =dmf
dt= _minj � _mvap ð7Þ
_Tf =� _Qvap + _minj(hinj � hf)� _mvaphfg
mfcv, fuelð8Þ
where _minj is available through fuel injection profile orparameters, hinj is the specific enthalpy of fuel at injec-tion temperature, hf is the specific enthalpy of the massin fuel zone, hfg=277kJ=kg is the specific heat for eva-poration; cv, fuel is the constant-volume specific heatcapacity of fuel, and _mvap is the evaporation rate of fuelthat can be derived by solving the energy equation onthe droplet surface
_Qvap = � _mvaphfg ð9Þ
Substituting Fourier’s law for _Qvap, the equationbecomes
4pkgr2f
dT
dr= _mvaphfg ð10Þ
where kg is the conductivity and rf is the radius of thefuel zone. It is assumed that at any time, the tempera-ture in the reaction zone has a constant distributiongradient; thus, the gradient term can be rewritten as2(Tr � Tf)=lr, where Tr is the reaction zone temperatureand lr is the thickness of the reaction zone, which isequal to half of reaction zone radius.
Figure 3. Fuel evaporation model.
4 International J of Engine Research 00(0)
The evaporation rate and heat transfer can be calcu-lated as follows
_mvap =8pkgr
2f(Tr�Tf)
lrhfgif Tf =Tboil
0 if Tf \Tboil
(ð11Þ
_Qvap = �8pkgr
2f (Tr � Tf)
lrð12Þ
Fourier’s law is used in the fuel droplet evaporationmodel to account for mass and heat transfer. The nom-inal value of coefficient in Fourier’s law (normally0.1W/m-K) makes the calculated transfer rate slowerthan turbulent transport. However, it is the tempera-ture gradient in the equation that is important in theproposed model. As shown in Table 4, the fitted ratecoefficient is much larger than the nominal value, whichcompensates for the slow rate.
Unmixed zone
The unmixed zone contains fresh air and residual gasas a fraction of the whole cylinder gas. It is assumedthat the unmixed zone is a hollow cylinder with thereaction zone inside of it. The mass transfer consists ofbulk mass flow caused by temperature gradient and dif-fusion caused by concentration gradient
_mtr = _mbulk + _mdiff ð13Þ
To physically account for bulk mass flow, a virtualinterface zone (M) is assumed, as shown in Figure 4.The mass of Zone M is assumed to be nonzero onlywithin each step. Temperature Tm is equal to theweighted averaged temperature of the reaction andunmixed zones
Tm =mrTr +muTu
mr +muð14Þ
where mr and Tr are the mass and the temperature ofreaction zone, respectively.
The total conductive heat transfer into reaction zoneis calculated as
_Qtr = � 2kcAr(Tr � Tu)
lrð15Þ
where kc is the conductivity of current interface. Thisheat transfer has two effects: moving the mass fromunmixed zone to reaction zone and heating up the restof unmixed zone. It can be expressed as
_Qtr = _Qbulk + _Qheat ð16Þ
where
_Qbulk = � 2kcAr(Tr � Tm)
lrð17Þ
Since the conductive heat transfer used to drive thebulk flow is from reaction zone and only Zone M is
contacted with reaction zone, the temperature differ-ence in the calculation should be Tr � Tm.
As a result, the heat transfer for heating the unmixedzone is resulted as
_Qheat = _Qtr � _Qbulk = � 2kcAr(Tm � Tu)
lrð18Þ
At this point, the bulk mass flow can be derived from_Qbulk as below
_mbulk = �_Qbulk
cm(Tr � Tu)=
2kcAr(Tr � Tm)
lrcm(Tr � Tu)ð19Þ
where cm is the specific heat capacity. It is apparent that
when Tm approaches Tu, _mbulk approaches 2kcAr
lrcm. And
when Tm approaches Tr, _mbulk approaches 0, which
indicates _mbulk 2 0, 2kcAr
lrcm
h i.
A simplified charge mixing model4 is modified inthis article to formulate the diffusive mass flow rate ofunburned gas from unmixed zone to reaction zone,which is dominated by turbulent diffusion. Under thisassumption, Fick’s law is applied
_m00diff = � ruDtdY
drð20Þ
where _m00diff is the turbulent mass flux of the unmixedgas, ru is the density of the unburned gas, Dt is theturbulent diffusivity, and dY
dr is the mass fraction dis-tribution in the reaction zone in the direction ofinterest. In this case, it is calculated as the mass frac-tion difference between reaction and unmixed zonesbelow
dY
dr’
2(Yr � Yu)
lrð21Þ
where Yr and Yu are the mass fraction in reaction zoneand unmixed zone, respectively.
The relationship between turbulent diffusivity andturbulent viscosity gives the following equation that canbe used to calculate Dt
Figure 4. Air entrainment model.
Men et al. 5

Sct =nt
Dtð22Þ
where Sct is the turbulent Schmidt number. Note thatnt is the turbulent viscosity that can be calculated by
nt = kd�vlr ð23Þ
where �v is the averaged velocity of the gas flow in thereaction zone that can be approximated by the meanpiston speed, lr is the thickness of the reaction zone (thesame as in the previous calculation), and kd is the cali-bration parameter. Since the turbulent Schmidt numberis difficult to estimate, it is lumped into the calibrationparameter kd and assumed to be one in this model. Themass transfer rate from unmixed zone to reaction zonecan be expressed as
_mdiff =2kdru�vAr(Yu � Yr)
Sctð24Þ
where Ar is the contact area of the surface betweenunmixed zone and reaction zone, which is equal to thesurface area of the reaction zone.
The reaction-based model of unmixed zone is basedon the first law thermodynamic analysis of an open sys-tem. Six states are included in this zone, and they areunmixed zone volume (Vu), unmixed zone temperature(Tu), the concentrations of oxygen (½O2�), carbon diox-ide (½CO2�), water (½H2O�), and nitrogen (½N2�).
In a chemical kinetic system, the molecular concen-tration of species i is defined as
½Xu, i�=Nu, i
Vuð25Þ
where Nu, i =mu, i
MWu, iis the number of moles of species i,
mu, i is the mass, and MWu, i is the molecular weight.The rate of change of molar concentration of species
i is defined as
½ _Xu, i�=_Nu, i
Vu�
_VuNu, i
V2u
=wtr, i �_Vu
Vu½Xu, i� ð26Þ
where wtr, i is the gas mixing rate, which can be calcu-lated as
wtr, i = � _mtr
VuMWuð27Þ
From the first law of thermodynamics, we have
dUu
dt= _Qu � _Wu � _mtrhu ð28Þ
where Uu is the internal energy of unmixed zone, _Qu isthe net heat transfer rate into the system, _Wu is the netrate of work done by the system, _mtrhu is the energy
change due to mass flow, and hu is the specific enthalpyof unmixed gases.
The rate of work done is defined as
_Wu = p _Vu ð29Þ
The relation between internal energy Uu andenthalpy H is
Hu =Uu + pVu ð30Þ
Then by re-arranging and differentiating with respectto time, the left-hand side (LHS) of equation (28)becomes
dUu
dt=
d(Hu � pVu)
dt=
dHu
dt� _pVu � p _Vu ð31Þ
By substitution, equation (28) can be re-arranged as
dHu
dt= _Qu + _pVu � _mtrhu ð32Þ
The extensive property Hu can be expressed as a sumof weighted molar enthalpies of all species
Hu =X
Ni�hi =Vu
X½Xi��hi ð33Þ
Thus, LHS of equation (32) becomes
LHS= _Vu
X½Xi��hi +Vu
X_½Xi��hi +Vu
X½Xi� _�hi
ð34Þ
where _�hi = �cp, i _Tu. Note that �cp, i is the constant-pressuremolar heat of species i. The state equations of ideal gasin terms of concentrations are given as
p=X½Xi�RuTu ð35Þ
and
_p=RuTu
X_½Xi�+Ru
_Tu
X½Xi� ð36Þ
By substitution, the right-hand side (RHS) of equa-tion (32) becomes equation (37).
RHS= _Qu+RuTuVu
X_½Xi�+Ru
_TuVu
X½Xi�+ _mtrhu
ð37Þ
Equating equations (34) and (37) and re-arrangingthe equation give the formula for the temperature ratein equation (38)
_Tu =_Qw � _Qheat +RuTuVu
P½ _Xu, i� � Vu
P½ _Xu, i��hi � _Vu
P½Xu, i��hi � _mtrhu
Vu
P½Xu, i� �cp, i � Ru
� � ð38Þ
Heat transfer term _Qu consists of heat transfer fromreaction zone and heat loss to cylinder wall and isshown below
_Qu = _Qw � _Qheat ð39Þ
The heat loss rate to cylinder wall _Qw can beexpressed as
6 International J of Engine Research 00(0)
_Qw = � Achc(Tu � Tw) ð40Þ
where Ac is the effective contact area between gas andcylinder wall, hc is the heat transfer coefficient, and Tw
is the cylinder wall temperature.The heat transfer coefficient is calculated by
Woschni’s correlation17
hc =aB�0:2p0:8T�0:55u (2:28Sp)0:8 ð41Þ
where Sp is the mean piston speed and a=1:25.
Reaction zone
The formulation of reaction zone is similar to that ofunmixed zone, with gas-phase fuel and mixed gas flow-ing into the reaction zone and chemical reactionmechanism integrated. There are eight states includedin this zone, and they are reaction zone volume (Vr),reaction zone temperature (Tr), concentrations of dieselfuel (½C10:8H18:7�), oxygen (½O2�), carbon dioxide(½CO2�), water (½H2O�), nitrogen (½N2�), and carbonmonoxide (½CO�). In this configuration, EGR rate canbe well managed by assigning initial conditions of spe-cies concentrations. For example, high EGR rate willresult in large O2, N2, CO2, and H2O initialconcentrations.
The rate of change of molar concentration of speciesi can be calculated as
½ _Xr, i�=wi �_Vr
Vr½Xr, i� ð42Þ
where wi is the concentration production that can befurther separated into two parts
wi =wrxn, i +wflow, i ð43Þ
where wrxn, i is the concentration production due tochemical reactions and it is calculated by the chemicalkinetic mechanism and wflow, i is the concentrationchange due to mass flow into and out of the controlvolume. In reaction zone, wflow, i consists of fuel eva-poration rate and gas mixing rate, that is
wflow, i=wvap, i+wtr, i=1
Vr
_mvap, i
MWf, i+
_mtr, i
MWu, i
� �ð44Þ
where MWf, i and MWu, i are the molecular weights ofeach species in fuel zone and unmixed zone,respectively.
The formula for temperature rate is shown in equa-tion (45)
_Tr =_Qvap +
_Qtr +RuTrVr
P½ _Xr, i� � Vr
P½ _Xr, i��hi � _Vr
P½Xr, i��hi + _mvaphf + _mbulkhr + _mdiffhu
Vr
P½Xr, i� �cp, i � Ru
� � ð45Þ
where hr is the specific enthalpy of the mass in reactionzone.
The two-step chemical reaction9 of C10:8H18:7 oxida-tion can be expressed as
C10:8H18:7+10:075O2 ! 10:8CO+9:35H2O ð46aÞCO+0:5O2 $ CO2 ð46bÞ
The reaction rates for C10:8H18:7 and CO oxidationare given by Arrhenius functions below
w1 = � A1 exp �EA, 1
RuT
� �½C10:8H18:7�m1 ½O2�n1 ð47aÞ
w2 = � A2 exp � EA, 2
RuT
� �½CO�m2 ½O2�n2 ½H2O�k1
+A3 exp � EA, 3
RuT
� �½CO2�k2
ð47bÞ
where A1, A2, A3, EA, 1, EA, 2, EA, 3, m1, m2, n1, n2, k1,and k2 are constants whose values are listed in Table 1.The reference values9 were first used for baseline eva-luation. Sensitivity analysis was then performed todetermine the highly sensitive parameters to tune.Finally, the selected parameters are tuned to match themodel with experimental data. The calibration processcan be found in the previous single-zone work.18
By inspecting equations (46a) and (46b), the rest ofthe reaction rates are as follows
wO2=10:075w1 +0:5w2 ð48aÞ
wCO2= � w2 ð48bÞ
wH2O = � 9:35w1 ð48cÞwCO = � 10:8w1 +w2 ð48dÞ
Note that the second step is a reversible reaction,where the reverse reaction decomposes CO2 moleculesinto CO and O2.
Cylinder properties
With the calculation of mixture properties of each zone,the averaged properties over the entire cylinder can beobtained. In-cylinder temperature is defined as themass-based averaged temperature for all three zones
T=mfTf +mrTr +muTu
mf +mr +muð49Þ
and in-cylinder pressure is calculated by ideal gas law
p=(mf +mr +mu)RuT
VMWmixð50Þ
where MWmix is the molecular weight of the mixtureover the whole cylinder.
Men et al. 7

Model validation
Test data
The test data used for model validation are from a GM6.6-L, eight-cylinder Duramax engine. The specifica-tions of the engine are summarized in Table 2. Theengine was tested at steady-state under various speedand load conditions. At each operational condition,different SOI timings and EGR rates are used. Brakemean effective pressure (BMEP) in bar is the measureof load. The recorded test data include in-cylinderpressure traces and engine control inputs, along withpost-processed heat release rate traces, air and EGRvariables, and pressure metrics such as IMEP and netmean effective pressure (NMEP) variables.
The available test data are summarized in Table 3 asfollows.
SOI of main injection sweeps at fixed speed and loadconditions with pilot injection:
1. Four speed–load pairs: 680 r/min, 1 bar; 1400 r/min, 2.5 bar; 1400 r/min, 5 bar; and 2000 r/min,7 bar.
2. An extra post injection at 2000 r/min.3. Fixed EGR rate for each speed–load pair.
In each of the four groups, half of the data pointsare randomly selected for model calibration. The otherhalf are used for model validation. To be more specific,6 points from 680 r/min, 10 points from 1400 r/min, and5 points from 2000 r/min have been randomly selected
for calibration, and the remaining 23 data points areused to test the model performance. Instead of valida-tion for each speed–load condition, the optimized para-meters are tested for all conditions. This validation isable to show the invariability of the calibration para-meters for both injection timing and speed–load varia-tion. Thus, another test is performed to validate thecalibration robustness under different speed–load con-ditions. The 1400-r/min and 1-bar data are used as thecalibration data set, and the test data set consists ofdata under operational conditions of 680 r/min with1 bar, 1400 r/min with 5 bar, and 2000 r/min with 7 bar.
Combustion characteristics
The accuracy of pressure prediction is of the highestpriority. Thus, a MATLAB function based on non-linear least-squares algorithm19 is used to minimize theresulting pressure error. The function solves nonlinearleast-squares curve fitting problems of the form
minxjjf(x)jj22 = min
xf1(x)
2 + � � � + fn(x)2
ð51Þ
where the cost function f(x) in this study is in the fol-lowing form
f(x)= p� pexp ð52Þ
Note that pexp is a crank-based vector from experi-mental data and x is a vector containing the calibrationparameters
x= kg kc kd T ð53Þ
The parameter values for optimal performance areshown in Table 4. In general, the fitted coefficients maynot be the same as actual values of the physical proper-ties. There are two reasons for this. First, the cylinder
Table 1. Reaction rate coefficients.
Parameter Model value
A1 4:83 3 109
A2 2:24 3 1014
A3 5 3 108
EA, 1 1:26 3 108
EA, 2 1:67 3 108
EA, 3 2:09 3 108
m1 0:1m2 1n1 1:65n2 0:25k1 0:5k2 1
Table 2. Engine specifications.
Parameter Model value
Bore 103 mmStroke 99.05 mmConnecting rod length 163 mmCompression ratio 16.4:1Intake valve duration 148 CADExhaust valve duration 244 CAD
Table 3. Summary of test data.
Operatingpoints
BMEP(bar)
qinj
(mm3)SOImain
(�bTDC)EGR(%)
680 r/min 3 12 Max 1.01 10.6 25 61.9Min 0.99 8.9 –10 60.8
1400 r/min 3 11 Max 2.52 18.3 25 55.5Min 2.49 16.4 –5 53.7
1400 r/min 3 11 Max 5.02 31.3 25 51.4Min 4.98 27.6 –5 48.0
2000 r/min 3 10 Max 7.09 56.2 20 40.3Min 6.90 45.8 –7 38.5
BMEP: brake mean effective pressure; bTDC: before top dead center;
EGR: exhaust gas recirculation.
Table 4. Optimized model parameters.
kg kc kd
8:3 3 103 1:1 3 104 0.12
8 International J of Engine Research 00(0)

is conceptually divided into three zones, which is a sig-nificant simplification of real diesel combustion.Second, the transport models used in this model is orig-inally used for microscopic phenomena. For example,Fourier’s law in droplet evaporation was used for fueldroplet diameter of around 500mm, where the tempera-ture gradient is evaluated at the length of around25mm. In addition, normal Fourier’s law results in aslower rate compared to turbulent diffusion, thus therate coefficient kg should be increased. Coefficient kc isassociated with the equation for bulk flow due to tem-perature difference. The main reason of using tempera-ture difference to account for mass and heat transfer isdue to the difficulty in determining the flame front ofdiesel combustion with such a simplified model. A nat-ural approach is to divide the total flow rate into twotypes: flow due to concentration gradient and flow dueto temperature gradient. The flow due to temperaturegradient is thus described by a conduction-like func-tion. It is not necessary to describe a real conductionprocess because there is no clear boundary between thereaction and unmixed zones actually. Similar to
Fourier’s law, the characteristic length in this model isassumed to be reaction zone thickness, which is muchlarger than the normal molecular length. The fitted kcis therefore much larger than commonly known con-ductivity values.
The modeled pressure traces are first compared withtest data for different speed and load conditions underthe same main injection timing (see Figure 5). Threeoperational condition are investigated: 680 r/min, 1 bar;1400 r/min, 5 bar; and 2000 r/min, 7 bar. The maininjection timing is fixed at 20� before top dead center(TDC). Under this advanced injection timing condi-tion, the model predictions are in good agreement withthe measured values. The start of combustion has beenaccurately predicted due to the fuel evaporation model.The peak pressure prediction is fairly good, except fora slight mismatch with 2% relative error. This error,which is a result of the premixed combustion stage,could be attributed to the assumption of the two-stepmechanism, which is an over-simplified model of thecombustion chemistry. The model predicts in-cylinderpressure accurately under different operational
Figure 5. Pressure traces at different speed–load conditions with the same main injection timing at 20� bTDC:(a) 680 r/min, BMEP = 1 bar; (b) 1400 r/min, BMEP = 5 bar; and (c) 2000 r/min, BMEP = 7 bar.
Men et al. 9

conditions without re-calibrating model parameters.This demonstrates the advantages of the proposedphysics-based model compared to calibration-basedmodels.
The second comparison is made under the sameoperational conditions except for changing the maininjection timing to 6� before TDC (see Figure 6). Theoverall pressure prediction is still accurate, althougherror increases near the peak pressure location at2000 r/min. As discussed above, the two-step assump-tion results in modeling error during the premixed com-bustion stage and in this case it is near TDC. However,the error in injection rate also increases the deviationduring pressure rise.
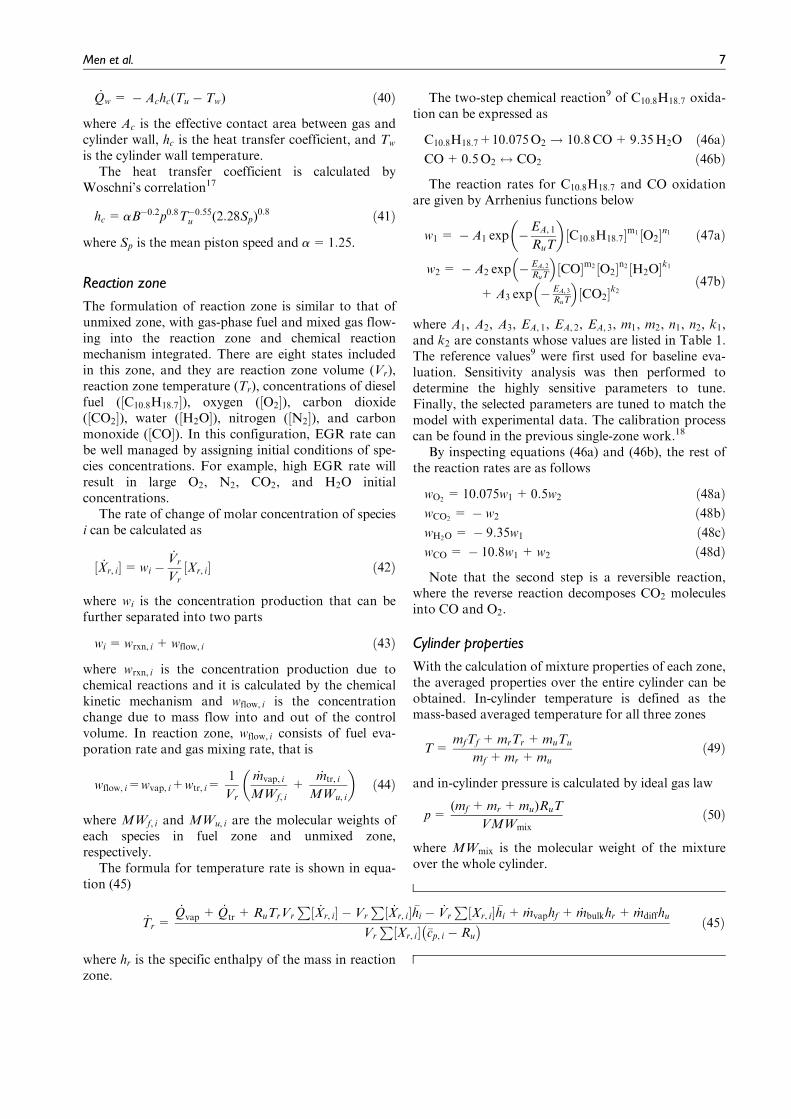
Another comparison is performed for the same oper-ating conditions but with a retarded injection timing at5� after TDC (see Figure 7). While maintaining the cali-bration parameters unchanged, the model predictionsare still within the acceptable range. At 680 r/min, thereis a larger error at the first peak, which could be due to
the simplification of the fuel evaporation model.Since the fuel zone is assumed to be one spherical vol-ume, the contact area is calculated based on thesphere radius, which could be different from theactual contact area for heat transfer. Thus, tempera-ture estimation of the fuel zone could not be perfect,which would lead to inaccurate ignition delay forsome extreme cases. At 1400 and 2000 r/min, the errorremains but becomes smaller and the model capturesthe trends fairly well. Note that for different opera-tional conditions, the EGR rate is different, which isnot explicitly included in the model. This factor couldalso account for the mismatch. With the results shownin Figure 7, it can be concluded that the model iscapable of predicting in-cylinder pressure under dif-ferent speed, load, and injection timing.
The last comparison is mainly between multi-zonemodel and single-zone model. The operational condi-tions are restricted to 1400 r/min and 2.5 bar withretarded injection timings. However, similar results can
Figure 6. Pressure traces under different speed and load conditions with the same main injection timing at 6� bTDC:(a) 680 r/min, BMEP = 1 bar; (b) 1400 r/min, BMEP = 5 bar; and (c) 2000 r/min, BMEP = 7 bar.
10 International J of Engine Research 00(0)
be obtained under other conditions. As shown inFigure 8, while multi-zone model predicts the pressuretraces with acceptable error, single-zone model predictsa much earlier start of combustion, which leads to anover-predicted peak pressure. This is due to the lack ofphysical delay in the single-zone model. The fuel isassumed to be ready for combustion as soon as it entersthe cylinder. However, in reality, it takes time for thefuel to be prepared for combustion, which is wellexplained in the multi-zone model.
The under-estimated physical delay can be furtherobserved in heat release rate traces in Figure 9. Thesingle-zone model predicts the start of combustion nearthe SOI, while the actual start of combustion is around5� after injection. The multi-zone model successfullymatches the test results.
The corresponding numerical evaluation of the mod-eling error of both single-zone and multi-zone modelsis shown in Table 5. The modeling error in pressure iscalculated as the scaled root mean square of relative
pressure error from intake valve closing (IVC) at 138�bTDC to exhaust valve opening (EVO) at 129� aTDC
err=
ffiffiffiffiffiffiffiffiffiffiffiffiffiffiffiffiffiffiffiffiffiffiffiffiffiffiffiffiffiffiffiffiffiffiffiffiffiffiffiffiffiffiffiffiffiffiffiffiffiffiffiffiffiffiffiffi1
N
XNi=1
p(i)model � p(i)expp(i)exp
!2vuut
3 100 ð54Þ
where p(i)model is the model predicted pressure, p(i)exp isthe measured pressure, i is the index of the samplingpoints within the investigated range of crank angledegrees, and N is the total number of sampling points.
Parameter variability
As the multi-zone model outperforms the single-zonemodel in predicting the combustion characteristics, it isworth noting that the multi-zone model is also preferredduring the calibration process. To obtain the previousresults, the single-zone model was calibrated case bycase,18 which indicates that the model is essentially a
Figure 7. Pressure traces at different speed–load conditions with the same main injection timing at 5� aTDC: (a) 680 r/min,BMEP = 1 bar; (b) 1400 r/min, BMEP = 5 bar; and (c) 2000 r/min, BMEP = 7 bar.
Men et al. 11

calibration-based model with several lookup tables.Although polynomial fitting approach was applied toeliminate part of the required calibration effort, thesingle-zone model still needs 5–6 parameters to be cali-brated with comprehensive test data.
However, the multi-zone model is demonstrated tobe table-free. After the model is calibrated using thecalibration data set, it is tested with the validationdata set without recalibration. The resulting IMEP isshown in Figure 10. All the data points are within the10% error bound, and this is the results with fixedmodel calibration parameters. Compared to single-zone model, which needs to change the parameterswhenever the operational condition changes, themulti-zone model, once calibrated, is sufficient tokeep all parameters constant under all operationalconditions.
The second validation results, as shown in Figure 11,indicate that the model, once calibrated at one opera-tional condition (1400 r/min and 2.5 bar), is capable ofpredicting the IMEP under different operational condi-tions including low- and high-speed conditions. When
engine is running at 680 r/min, low speed and high EGRrate cause the engine combustion to become unstable.As a result, within a reasonable range, the relative errorat this condition increases.
Conclusion
The multi-zone reaction-based modeling approach fordiesel combustion is shown in this work. The developedmodel is based on single-zone reaction-based model,with addition of fuel evaporation model and airentrainment model. The model parameters are cali-brated using part of the test data from a GM dieselengine, and the rest of the test data over a wide rangeof operational conditions are then used for model vali-dation. Comparisons between model predictions andmeasured data show good agreement under differentspeeds, loads, and injection timings. The model success-fully predicts in-cylinder pressure, heat release rate, andIMEP with constant calibration parameters. The multi-zone model outperforms single-zone model for bothaccuracy and parameter invariability. The current
Figure 8. Pressure traces at 1400 r/min, BMEP = 2.5 bar, with different main injection timings: (a) SOImain = 2� aTDC,(b) SOImain = 4� aTDC, and (c) SOImain = 5� aTDC.
12 International J of Engine Research 00(0)

model can be used as a foundation to generate simpli-fied control-oriented linear or nonlinear models formodel-based control design.
Future work includes replacing the two-stepmechanism with a more detailed mechanism thataccounts for chemical delay better. A systematicmethod that determines the optimal number of zones
Figure 9. Heat release rate traces at 1400 r/min, BMEP = 2.5 bar, with different main injection timings: (a) SOImain = 2� aTDC,(b) SOImain = 4� aTDC, and (c) SOImain = 5� aTDC.
Table 5. Modeling error in in-cylinder pressure.
SOI(� aTDC)
Single-zonemodel (%)
Multi-zonemodel (%)
2 6.3860 3.87784 5.9162 3.11895 5.8746 3.0215
SOI: start of injection; aTDC: after top dead center.
Figure 10. Predicted IMEP versus actual IMEP for differentoperating conditions.
Men et al. 13

and/or reaction steps depending on the application isan open problem to be solved.
Declaration of conflicting interests
The author(s) declared no potential conflicts of interestwith respect to the research, authorship, and/or publi-cation of this article.
Funding
The author(s) disclosed receipt of the following finan-cial support for the research, authorship, and/or publi-cation of this article: This work is an extension of theproject supported by General Motors Company undercontract number: 147655.
ORCID iD
Guoming Zhu https://orcid.org/0000-0002-2101-2698
References
1. Zhang L. A study of pilot injection in a DI diesel engine.
SAE technical paper 1999-01-3493, 1999.2. Yang X and Zhu GG. A mixed mean-value and crank-
based model of a dual-stage turbocharged SI engine for
hardware-in-the-loop simulation. In: Proceedings of the
2010 American control conference, Baltimore, MD, 30
June–2 July 2010, pp.3791–3796. New York: IEEE.3. Yang X and Zhu GG. A control-oriented hybrid combus-
tion model of a homogeneous charge compression igni-
tion capable spark ignition engine. Proc IMechE, Part D:
J Automobile Engineering 2012; 226(10): 1380–1395.4. Zhang S, Zhu G and Sun Z. A control-oriented charge
mixing and two-zone HCCI combustion model. IEEE T
Veh Technol 2014; 63(3): 1079–1090.
5. Ghojel J. Review of the development and applications of the
Wiebe function: a tribute to the contribution of Ivan Wiebe
to engine research. Int J Engine Res 2010; 11(4): 297–312.6. Zhang S, Zhu GG, Yoon Y and Sun Z. A control
oriented charge mixing and HCCI combustion model for
internal combustion engines. In: ASME 2012 5th annual
dynamic systems and control conference joint with the
JSME 2012 11th motion and vibration conference, Fort
Lauderdale, FL, 17–19 October 2012, pp.321–327. New
York: American Society of Mechanical Engineers.7. Barba C, Burkhardt C, Boulouchos K and Bargende M.
A phenomenological combustion model for heat release
rate prediction in high-speed DI diesel engines with com-
mon rail injection. SAE technical paper 2000-01-2933,
2000.8. Men Y, Haskara I, Wang YY, Chang C-F and Zhu GG.
Model-based calibration of the reaction-based diesel
combustion dynamics. In: 2017American control confer-
ence (ACC), Seattle, WA, 24–26 May 2017, pp.4735–
4740. New York: IEEE.9. Turns SR. An introduction to combustion. Boston, MA:
McGraw Hill, 2000.10. Arsie I, Di Genova F, Mogavero A, Pianese C, Rizzo G,
Caraceni A, et al. Multi-zone predictive modeling of com-
mon rail multi-injection diesel engines. SAE technical
paper 2006-01-1384, 2006.11. Zhang K, Xu M, Wei J, Cui Y and Deng K. Phenomeno-
logical two-phase multi-zone combustion model for
direct-injection diesel engines. Int J Auto Tech Kor 2016;
17(5): 895–907.12. Ates M, Matthews RD and Hall MJ. A full-cycle multi-
zone quasi-dimensional direct injection diesel engine
model based on a conceptual model developed from ima-
ging experiments. SAE technical paper 2017-01-0537,
2017.13. Rether D, Grill M, Schmid A and Bargende M. Quasi-
dimensional modeling of CI-combustion with multiple
pilot- and post injections. SAE Int J Engines 2010; 3(1):
12–27.14. Dobos AP and Kirkpatrick AT. Quasidimensional mod-
eling of diesel combustion using detailed chemical
kinetics. J Eng Gas Turb Power 2017; 139(8): 081502.15. Neshat E, Honnery D and Saray RK. Multi-zone model
for diesel engine simulation based on chemical kinetics
mechanism. Appl Therm Eng 2017; 121: 351–360.16. Men Y and Zhu GG. A multi-zone reaction-based diesel
combustion model for model-based control. In: ASME
2017 dynamic systems and control conference, Tysons,
VA, 11–13 October 2017, p.V003T27A003. New York:
American Society of Mechanical Engineers.17. Woschni G. A universally applicable equation for the
instantaneous heat transfer coefficient in the internal
combustion engine. SAE technical paper 670931, 1967.18. Men Y, Haskara I, Wang YY, Chang C-F and Zhu G.
Model-based calibration of reaction-based diesel combus-
tion dynamics. Proc IMechE, Part D: J Automobile Engi-
neering. Epub ahead of print 14 November 2017. DOI:
10.1177/0954407017732859.19. Coleman TF and Li Y. An interior trust region approach
for nonlinear minimization subject to bounds. SIAM J
Optimiz 1996; 6(2): 418–445.
Figure 11. Predicted IMEP versus actual IMEP for differentspeed–load conditions.
14 International J of Engine Research 00(0)