multi-temporal sar interferometry for ... sar interferometry for landslide monitoring r. dwivedi a*,...
TRANSCRIPT

MULTI-TEMPORAL SAR INTERFEROMETRY FOR LANDSLIDE MONITORING
R. Dwivedi a*, A. B. Narayan b, A. Tiwari b, O. Dikshit b, A. K. Singh a
* Corresponding Author ([email protected])
a Geographic Information System (GIS) Cell, MNNIT Allahabad, India - (ramjid, aksingh)@mnnit.ac.in
b Department of Civil Engineering, IIT Kanpur, India - (avadhbn, ashut, onkar)@iitk.ac.in
Commission VIII, WG VIII/1
KEY WORDS: SAR Interferometry, Landslide monitoring
ABSTRACT:
In the past few years, SAR Interferometry specially InSAR and D-InSAR were extensively used for deformation monitoring related
applications. Due to temporal and spatial decorrelation in dense vegetated areas, effectiveness of InSAR and D-InSAR observations
were always under scrutiny. Multi-temporal InSAR methods are developed in recent times to retrieve the deformation signal from
pixels with different scattering characteristics. Presently, two classes of multi-temporal InSAR algorithms are available- Persistent
Scatterer (PS) and Small Baseline (SB) methods. This paper discusses the Stanford Method for Persistent Scatterer (StaMPS) based
PS-InSAR and the Small Baselines Subset (SBAS) techniques to estimate the surface deformation in Tehri dam reservoir region in
Uttarkhand, India. Both PS-InSAR and SBAS approaches used sixteen ENVISAT ASAR C-Band images for generating single
master and multiple master interferograms stack respectively and their StaMPS processing resulted in time series 1D-Line of Sight
(LOS) mean velocity maps which are indicative of deformation in terms of movement towards and away from the satellites. From 1D
LOS velocity maps, localization of landslide is evident along the reservoir rim area which was also investigated in the previous
studies. Both PS-InSAR and SBAS effectively extract measurement pixels in the study region, and the general results provided by
both approaches show a similar deformation pattern along the Tehri reservoir region. Further, we conclude that StaMPS based PS-
InSAR method performs better in terms of extracting more number of measurement pixels and in the estimation of mean Line of
Sight (LOS) velocity as compared to SBAS method. It is also proposed to take up a few major landslides area in Uttarakhand for
slope stability assessment.
1. INTRODUCTION
Synthetic aperture radar (SAR) is an innovative technology of
radar community. It is an active microwave remote sensing
mechanism which is capable of imaging the earth in all weather
conditions and making it valuable for several hazards
monitoring application by measuring surface deformation.
Initially, Interferometric SAR (InSAR) was adopted in several
deformation monitoring applications by using two or more SAR
images at different acquisition time to generate interferograms
which after unwrapping produce Digital Elevation Model
(DEM), and thereby determine the change in the position of
resolution grids in the satellite line of sight (LOS). However,
the reliability InSAR is always a concern because of temporal
decorrelation and spatial decorrelation.
In order to overcome the aforementioned limitations of InSAR,
time-series interferometric synthetic aperture radar (InSAR)
methods are developed in the past to retrieve the deformation
signal from pixels with different scattering characteristics.
Presently, two classes of multi-temporal InSAR algorithms are
available- Persistent Scatterer (PS) and Small Baseline (SB)
methods. Ferretti et al. (2000) and Hooper et al. (2004) are
credited with the most for the development of Permanent
scatterer InSAR (PS-InSAR). PS-InSAR identifies measurement
pixels known as permanent scatterer (PS) with stable amplitude
and phase history over a long interval of time. Examples of such
PS candidates are manmade objects such as buildings, roofs,
etc. Although PS-InSAR is proved to be more accurate and
consistent, it suffers from some limitations such as low PS
density in non-urban areas and a relatively large temporal baseline
(Greif and Vlcko, 2013).
In order to overcome these limitations, Hooper et al. (2007)
developed Stanford Method of Persistent Scatterer (StaMPS)
approach which uses spatial correlation of interferogram phase in
defined neighbourhood to identify phase stable pixels over a
period of time even with low amplitude stability which makes the
approach capable of detecting PS pixels in non-urban areas. Apart
from the PS, a few natural targets such as desert and non-
cultivated areas, often referred as DS with moderate coherence in
few interferometric pairs, can also be explored to retrieve the time-
series deformation. These targets with moderate phase stability
over complete observation period possess high spatial density
compared to PS in non-urban areas. It has been observed that
time-series of geophysical parameters can also be extracted from
DS by reducing the decorrelation effect. This is achieved by
forming interferograms between image pairs with small temporal
baselines and a small difference in look angles. This is the
working principle of the Small Baseline Subset (SBAS) approach
which has been extensively exploited for measuring the surface
deformation.
In the past, several researches have investigated the efficacy of
PS-InSAR and SBAS in measuring surface deformation (Crosetto
et al., 2005; Berardino et al., 2008; Hooper et al., 2007; Hooper
et al., 2008; Agram, 2011; Tiwari et al., 2016). In this research
work, we have implemented StaMPS based PS-InSAR and SBAS
processing for analysing the slope instability in Tehri reservoir
regions in Uttarakhand, India.
The International Archives of the Photogrammetry, Remote Sensing and Spatial Information Sciences, Volume XLI-B8, 2016 XXIII ISPRS Congress, 12–19 July 2016, Prague, Czech Republic
This contribution has been peer-reviewed. doi:10.5194/isprsarchives-XLI-B8-55-2016
55

2. STUDY AREA AND SATELLITE DATASET
Landslide is the one of the most threatening geo-hazard of the
Himalaya causing colossal damages to the infrastructure and
livelihood of common people. Therefore, the Himalyan town of
Tehri of Uttarakhand (India) is investigated in this study. Tehri
town is inhabited near Tehri reservoir at the union of Bhagirathi
and Bhilangana rivers. It is located at an altitude of 1,750 m
(5,740 ft). Tehri Dam is among the largest dams in India. In the
past, several causalities haves been reported because of the
landslides in this area. In December 2010, debris from the
landslip has blocked a division tunnel forcing closure of
electricity generation. This has caused a loss of more than 15
Million USD. Hence, the study is quite significant for this area.
Fig. 1: Study area location (X-axis represent latitude and Y-axis
represent longitude)
2.1 Satellite Dataset
To monitor the critical slopes around Tehri reservoir, 16
Envisat ASAR C-Band SLC images of track 291 (frame: 83)
acquired between January 2009 to July 2010 are used. ASAR
image of 9th October 2009 is chosen as the master image based
on minimizing the temporal, Doppler and perpendicular
baseline. The dataset is presented in Table 1.1 along with the
critical perpendicular baseline length with respect to master
image, acquisition date, orbit number and Doppler centroid
frequency. Apart from the SLC images, a 90 m resolution
SRTM Digital Elevation Model (DEM), in Figure 1, is used to
remove the topographic phase from the differentially corrected
interferogram. The DORIS precise orbits for the year 2009 and
2010 are used to remove orbital bias.
S.
No
Acquisition
date
Orbit
No.
B┴ (m) Doppler
Centroid (Hz)
1. 12Jan 2009 36417 301.6 172.014
2. 16Feb 2009 36417 305.1 348.914
3. 23Mar2009 36918 651.1 169.777
4. 27Apr 2009 37419 251.1 165.833
5. 01Jun 2009 37920 390.4 171.174
6. 06Jul 2009 38421 207.8 173.297
7. 10Aug2009 38922 173.2 173.608
8. 14Sep2009 39423 598.7 176.089
9. 19Oct2009 39924 0 169.287
10 23Nov2009 40924 50.33 172.812
11 01Feb2010 41425 567.8 174.730
12 08Mar2010 41427 112.3 177.697
13 12Apr2010 42429 390 184.121
14 17May2010 42930 426.9 166.537
15 21Jun 2010 43431 273.4 190.413
16 26Jul 2010 43932 -27.9 186.428
Table 1. ENVISAT data set of Tehri region
3. STAMPS BASED PS-INSAR AND SBAS APPROACH
The PS-InSAR method was initially developed by Ferretti et al.
(2000). Later, Hanssen (2003), Lyons and Sandwell (2005) and
Crossetto et al. (2005) proposed several modification and
succeeded in finding PSs in urban areas which required a
minimum of 15-20 interferograms for estimating the time series
displacement of each detected PS pixel. The StaMPS method,
developed by Hooper et al. (2007) came as an improvement to the
above mentioned methods in the sense that the method is capable
of finding PS pixels in urban as well as nonurban areas and also
less number of interferograms is sufficient to map the surface
displacement.
The interferogram generation in StaMPS is done using a single
master image and is based on the maximization of the correlation
amongst the set of images used for processing. The interferograms
are then generated by using this master image which involves co-
registration, resampling and complex multiplication of the master
with all the slave images. Once interferograms are generated, the
phase stability test is applied to obtain a set of phase stable pixels.
An initial amplitude based filtering is performed using the
amplitude dispersion index ‘DA’ value which is the ratio of the
standard deviation (σA) and the mean (µA) of the amplitude values
to filter the pixels which are not PS candidates. The topographical
correction is done using an external DEM to convert the
interferograms into differential interferograms, which are suitable
for PS processing. The differential interferograms are input to the
next step.
The pixels are initially selected on the basis of amplitude stability,
in which those pixels which have a value of the amplitude
dispersion index AD (ratio of the standard deviation and the mean
of amplitude values) within the threshold are selected as initial PS
candidates.
The candidates are tested for phase stability using a measure x stated in the following equation Hooper et al. (2007):
, ,
1, ,
1
ˆexp 1x i
Nu
x x i x iN
i
(1)
N represents the number of interferograms, ,x i represents the
wrapped phase value of the xth pixel in the ith interferogram,
,x i is the mean value of ,x i and , ,
ˆx i
u
represents the change
in the spatially uncorrelated part of the look angle error for the xth
pixel in the ith interferogram.
The pixels which satisfy the convergence of x to the threshold
value are picked as PS pixels. The selected PS pixels contain a
wrapped phase value, which is to be unwrapped, i.e. they must be
added by an estimated number of phase cycles of 2π to retrieve the
original phase value, a process known as phase unwrapping. Other
nuisance terms, such as the master and atmospheric error terms,
spatially uncorrelated look angle error, satellite orbit errors are
also estimated and removed from the unwrapped phase ‘ ,x i ’of
the detected PS pixels. The displacement can then be estimated
using the phase values of the individual PS pixels. A 1D Line of
Sight (LOS) velocity map is generated as an output of the StaMPS
method.
The International Archives of the Photogrammetry, Remote Sensing and Spatial Information Sciences, Volume XLI-B8, 2016 XXIII ISPRS Congress, 12–19 July 2016, Prague, Czech Republic
This contribution has been peer-reviewed. doi:10.5194/isprsarchives-XLI-B8-55-2016
56
However, StaMPS based Small Baseline Subset (SBAS)
approach uses multiple master interferograms prepared based on
reduction of spatial and temporal baseline. The method uses the
amplitude difference dispersion index (DΔA) given in equation
as the criterion for selecting initial candidates.
AA
A
D
(3)
Where, A
denotes the standard deviation of the amplitude
differences and A is mean of the amplitude values of the
respective pixel in the set of SLC images. DΔA is an indicator of
phase stability when spectral filtering is applied in range, since
it includes only the retained parts of the interferogram spectra
(Hooper, 2008). The key difference in SBAS processing chain
in comparison to PS-InSAR is the use of filtering to minimize
phase decorrelation.
Similar to PS-InSAR, the phase stability estimation in SBAS
approach makes use of the common low pass and adaptive
filters to detect the atmospheric, topographical and orbital errors
present in the phase of the candidate pixels. Once the phase
stability step is completed, SB pixels are selected based on both
the γ and ΔAD value following equation (1). The Spatially
Correlated Look Angle (SCLA) error and the Spatially
Uncorrelated Look Angle (SULA) or (DEM) error are estimated
in a similar manner as in case of the PS method. After phase
unwrapping, the phase of the SB interferograms is inverted
using the least squares method in order to estimate the phase
due to deformation. The SCLA error is removed after phase
unwrapping. Once all the errors are estimated and removed, the
remaining phase value is considered as the phase due to
deformation. The output of StaMPS based SBAS method,
similar to PS-InSAR method, results in the form of a 1D LOS
velocity map showing time series displacement of the extracted
pixels. Detailed explanation of this approach can be found in
Hooper et al. (2004, 2007), Hooper (2008).
4. RESULTS AND DISCUSSION
In this section, results of StaMPS based PS-InSAR processing
of the 16 Envisat ASAR SLC images of Tehri and its adjoining
area is presented. The parameters used for StaMPS based PS-
InSAR processing are shown in Table 2. PS-InSAR processing
using 15 geocoded single master interferograms resulted in
more than 12,50,000 PS candidates based on the DA value in
each patch with the area being divided into 6 patches which
finally resulted in 19,549 PS pixels. The PS velocity plot
(shown in Figure 3) shows displacement from -17.9 to 23.4
mm/year where cold and warm colours show displacement away
and towards the satellite LOS respectively.
The StaMPS based SBAS approach produces multiple master
small baseline interferograms and selection of a measurement
pixel depends on the extent of decorrelation present in the study
area. The StaMPS based SBAS approach resulted in a dense
network of well-connected 107 interferograms. Finally,
measurement pixels are extracted as measurement pixels by this
method. Here, we observe that the SBAS method extracted less
number of pixels (2545) than the PS-InSAR method owing to
the fact that both are optimized for different kind of scattering
models.
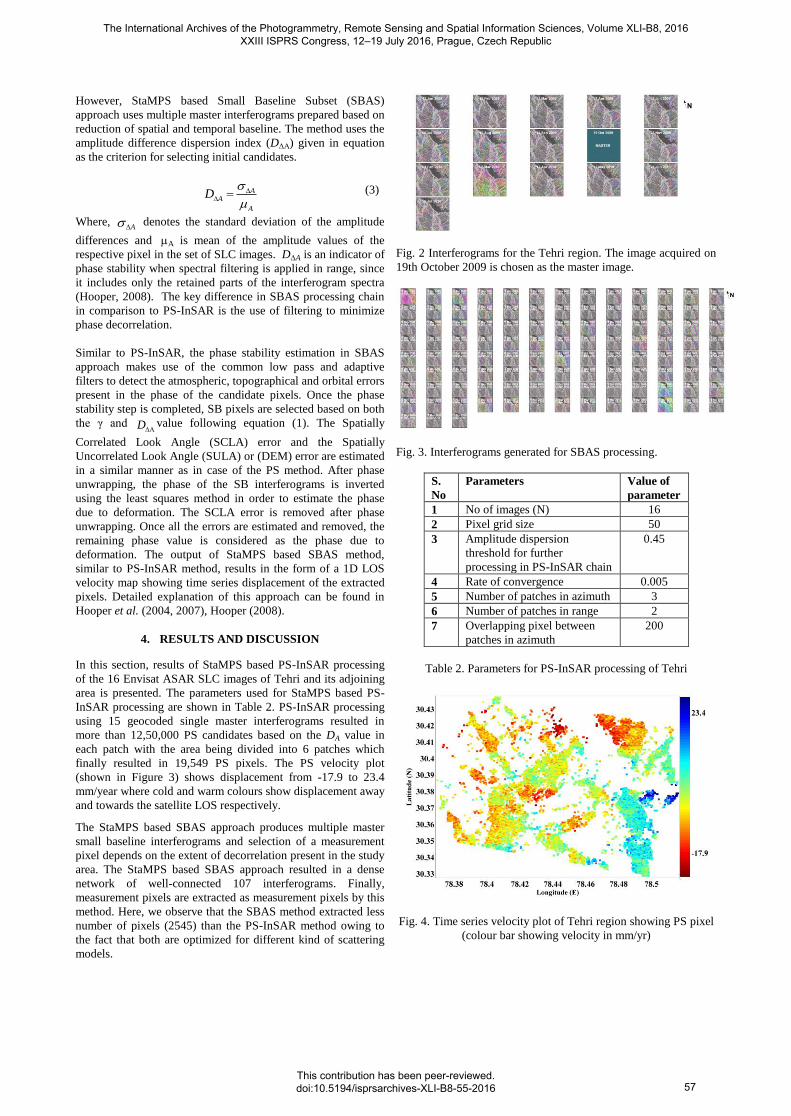
Fig. 2 Interferograms for the Tehri region. The image acquired on
19th October 2009 is chosen as the master image.
Fig. 3. Interferograms generated for SBAS processing.
S.
No
Parameters Value of
parameter
1 No of images (N) 16
2 Pixel grid size 50
3 Amplitude dispersion
threshold for further
processing in PS-InSAR chain
0.45
4 Rate of convergence 0.005
5 Number of patches in azimuth 3
6 Number of patches in range 2
7 Overlapping pixel between
patches in azimuth
200
Table 2. Parameters for PS-InSAR processing of Tehri
Fig. 4. Time series velocity plot of Tehri region showing PS pixel
(colour bar showing velocity in mm/yr)
The International Archives of the Photogrammetry, Remote Sensing and Spatial Information Sciences, Volume XLI-B8, 2016 XXIII ISPRS Congress, 12–19 July 2016, Prague, Czech Republic
This contribution has been peer-reviewed. doi:10.5194/isprsarchives-XLI-B8-55-2016
57
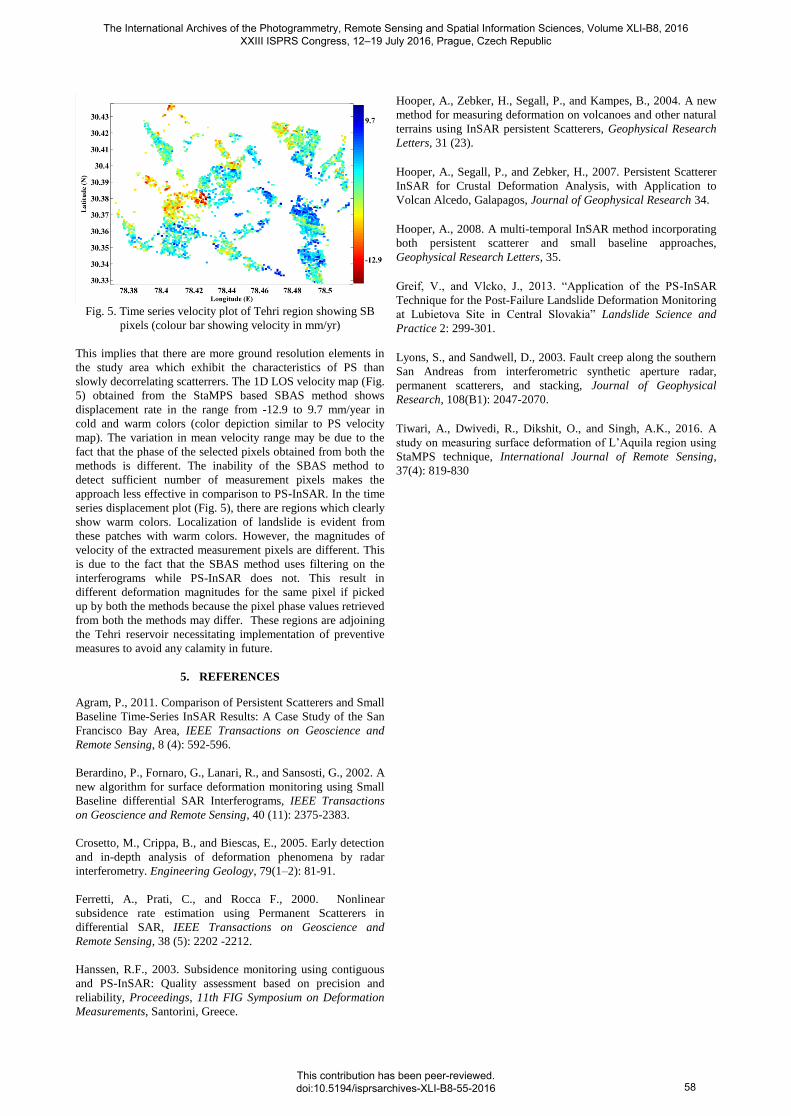
Fig. 5. Time series velocity plot of Tehri region showing SB
pixels (colour bar showing velocity in mm/yr)
This implies that there are more ground resolution elements in
the study area which exhibit the characteristics of PS than
slowly decorrelating scatterrers. The 1D LOS velocity map (Fig.
5) obtained from the StaMPS based SBAS method shows
displacement rate in the range from -12.9 to 9.7 mm/year in
cold and warm colors (color depiction similar to PS velocity
map). The variation in mean velocity range may be due to the
fact that the phase of the selected pixels obtained from both the
methods is different. The inability of the SBAS method to
detect sufficient number of measurement pixels makes the
approach less effective in comparison to PS-InSAR. In the time
series displacement plot (Fig. 5), there are regions which clearly
show warm colors. Localization of landslide is evident from
these patches with warm colors. However, the magnitudes of
velocity of the extracted measurement pixels are different. This
is due to the fact that the SBAS method uses filtering on the
interferograms while PS-InSAR does not. This result in
different deformation magnitudes for the same pixel if picked
up by both the methods because the pixel phase values retrieved
from both the methods may differ. These regions are adjoining
the Tehri reservoir necessitating implementation of preventive
measures to avoid any calamity in future.
5. REFERENCES
Agram, P., 2011. Comparison of Persistent Scatterers and Small
Baseline Time-Series InSAR Results: A Case Study of the San
Francisco Bay Area, IEEE Transactions on Geoscience and
Remote Sensing, 8 (4): 592-596.
Berardino, P., Fornaro, G., Lanari, R., and Sansosti, G., 2002. A
new algorithm for surface deformation monitoring using Small
Baseline differential SAR Interferograms, IEEE Transactions
on Geoscience and Remote Sensing, 40 (11): 2375-2383.
Crosetto, M., Crippa, B., and Biescas, E., 2005. Early detection
and in-depth analysis of deformation phenomena by radar
interferometry. Engineering Geology, 79(1–2): 81-91.
Ferretti, A., Prati, C., and Rocca F., 2000. Nonlinear
subsidence rate estimation using Permanent Scatterers in
differential SAR, IEEE Transactions on Geoscience and
Remote Sensing, 38 (5): 2202 -2212.
Hanssen, R.F., 2003. Subsidence monitoring using contiguous
and PS-InSAR: Quality assessment based on precision and
reliability, Proceedings, 11th FIG Symposium on Deformation
Measurements, Santorini, Greece.
Hooper, A., Zebker, H., Segall, P., and Kampes, B., 2004. A new
method for measuring deformation on volcanoes and other natural
terrains using InSAR persistent Scatterers, Geophysical Research
Letters, 31 (23).
Hooper, A., Segall, P., and Zebker, H., 2007. Persistent Scatterer
InSAR for Crustal Deformation Analysis, with Application to
Volcan Alcedo, Galapagos, Journal of Geophysical Research 34.
Hooper, A., 2008. A multi-temporal InSAR method incorporating
both persistent scatterer and small baseline approaches,
Geophysical Research Letters, 35.
Greif, V., and Vlcko, J., 2013. “Application of the PS-InSAR
Technique for the Post-Failure Landslide Deformation Monitoring
at Lubietova Site in Central Slovakia” Landslide Science and
Practice 2: 299-301.
Lyons, S., and Sandwell, D., 2003. Fault creep along the southern
San Andreas from interferometric synthetic aperture radar,
permanent scatterers, and stacking, Journal of Geophysical
Research, 108(B1): 2047-2070.
Tiwari, A., Dwivedi, R., Dikshit, O., and Singh, A.K., 2016. A
study on measuring surface deformation of L’Aquila region using
StaMPS technique, International Journal of Remote Sensing,
37(4): 819-830
The International Archives of the Photogrammetry, Remote Sensing and Spatial Information Sciences, Volume XLI-B8, 2016 XXIII ISPRS Congress, 12–19 July 2016, Prague, Czech Republic
This contribution has been peer-reviewed. doi:10.5194/isprsarchives-XLI-B8-55-2016
58