multi-technique study of the x-ray binary cyg x-1 fileabstract • the results based on our...
TRANSCRIPT

Multi-Technique Study of theMulti-Technique Study of the X-RayX-Ray Binary CygBinary Cyg X-1X-1
E.A. KaritskayaE.A. Karitskaya
Astronomical Institute of RASAstronomical Institute of RAS48 Pyatnitskaya str., Moscow 119017 48 Pyatnitskaya str., Moscow 119017 RussiaRussia

Abstract• The results based on our many-year optical photometric, high-resolution spectral and
spectropolarimetric observations by using the tools of different kinds are briefly reviewed.• The main optical photometric variation component is the ellipsoidality effect been studied in details
in Roche model. Apart from different kinds of flares, dips and “precession” period 147/294 d were revealed. Evidence of irregularities in matter flowing from one component to another was detected.
• Cross-correlation analysis revealed lags of X-ray (2-10 keV) long-term variations in respect to the optical ones. It allowed determining accretion time which is much shorter than that in standard accretion model.
• The comparison of the observed spectra with non-LTE model ones allowed us to set limits on the O-supergiant Cyg~X-1 optical component Teff = 30400+/-500K, log g = 3.31+/-0.07 and the element overabundances: from 0.4 dex to 1.0 dex for He, N, Ne, Mg, Si, that is, the elements affected by CNO- and alpha-processes. Tidal distortion of Cyg X-1 optical component and its illumination by X-ray emission of the secondary are taken into account.
• The photometric and spectral variations point to the supergiant parameters’ changes on the time scale of tens of years. Line profile non-LTE simulations lead to the conclusion that the star radius has grown about 1-4% from 1997 to 2003-2004 while the temperature decreased by 1300-2400K.
• The spectral line profile sets permitted us to construct the binary 2D and 3D tomographic maps. The comparison of 2D tomographic map with the theoretical calculations allowed to construct a more precise system model and receive better information on the gas flowing. The hard limits on Cyg~X-1 component mass ratio were obtained by such manner:
1/4 ≤ MX/MO ≤ 1/3.• Our VLT 8-m telescope spectropolarimetric observations permitted us to reveal the magnetic field
of ~100 G on the supergiant and to suspect the magnetic field of ~600 G on the accretion structure outer limit. For the first time the existence of magnetic accretion on the black hole has been confirmed.

Breaf review of our 36-year Cyg X-1 studying by using multi-technique methods and based on our optical photometric, high-resolution spectral and
spectropolarimetric observations.
Here the most of Key topics of this conference is presented:
• Multiwavelength photometry and spectroscopy of interacting binaries
• Imaging techniques: adaptive optics, interferometry, polarimetry, tomography
• Model atmospheres of stars, interacting binaries, disks, exoplanets, and brown dwarfs
• Synthetic light curves, velocity curves, spectra of binary stars, and spectra of accretion structures

Distance d = 1.8-2.5 kpc
.
.
hot line
jet
scattering gas
hot spot
on the disctidally distorted
supergiant collimated stellar wind
-- accretion stream
black hole
Scheme of X-Ray Binary Cyg X-1Porb = 5.6d Pprec = 294d
accretion disc

Multiwavelength photometry Photometric observations and
comparison with X-ray data The main results are reported in:• Karitskaya E.A., Goranskij V.P., Grankin E.N. et al.: 2000, Astronomy
Letters, 26, 22. (Pis'ma v Astron.Zh., 26, 27); • Karitskaya A.A., Voloshina I.B., Goranskij V.P. et al.: 2001,
Astron.Rep., 45, 350.(Astron.Zh., 78, 408);
In the frame of the international campaign ”Optical
Monitoring of Unique Astrophysical Objects” (Georgia, Kazakhstan, Russia, Uzbekistan, and Ukraine) in 1994-1998:
• 2258 UBVR observations made during 407 nights 1994-1998.
• Comparison with ASM/RXTE (1.3-12 keV) 1996-2001 data – 1806 daily points

By comparing Cyg X-1 photoelectric (UBVR) and X-ray variations we found:
• variability - different kinds of flares, dips and “precession” period 147/294 d;
• a correspondence between optical and X-ray variations. Cross-correlation analysis of the X-ray and optical mean brightness shows significant correlation. The X-ray variations delays in respect to the optical one - 7 d delay in 1996 and 12 d - in 1997-1998
(the main 1996 X-ray outburst and the mean orbital optical and X-ray light curves were subtracted from the X-ray and optical data).
For 1997-1998 we derived a correlation, with the X-ray light curve lagging 12 +/-- 2 days relative to the optical light curve, with a significance level substantially exceeding 99.99% (Karitskaya et al. 2001).
• Evidences of accretion instability

Evidences of accretion instability• 1. The shape variations of X-ray orbital light curve.• 2. Unusual optical deep fading in November,1996.• 3. Several-day-long optical flares coincided with X-ray dips.
The suggested scenario of flares and dips
Sometimes the matter flows, in separate portions, from the supergiant on to the accretion structure. Each portion creates a shock wave and a gas bulk which give rise to a powerful several-day-long optical flare. The gas ejected into the surrounding space absorbs soft X-rays, thus causing an X-ray dip. The rest of the matter, after the time-interval it needs to travel through the accretion structure (disk), gives rise to an X-ray flare.
The characteristic time of the matter transfer through the accretion disk was about 7 days in Summer and Autumn 1996 and 12 days in 1997-98.

The orbital light curves P=5.6 d
ASM RXTE X-Ray1996-2001
V-band1996-1998
The amplitude A=0.045+/-0.002 magThe difference minima depth
A=0.003+/-0.002 mag

The ellipsoidality effect-ROCHE model-admissible parameter values for Cyg X-1
Bochkarev N.G. Karitskaya E.A., Shakura N.I., Soviet Astronomy Letters, vol. 1, 1975, p. 118-120:
for A = 0.035 - 0.050m, A <0.005m, d > 2kpc, Teff < 35000 K the admissible values of Cyg X-1 parameters were obtained:25°<i<67°; 0.2<q<0.55; 0.9<μ<1; Mo>17Msun; 7Msun<Mx<27Msun
•36 years ago in our paper
Our admissible values (bold lines) for the mass ratio q as a function of the orbital inclination angle i vs 4 best models A-D from J.A.Orosz et al. Astro-ph, 1106.3689, 18 June 2011
A
B
C
D

Distance to Cyg X-1 In our paper Bochkarev N.G., Karitskaya E.A., Cyg X-1 (V1357 Cyg) and its
interstellar environment, Astrophysics and Cosmology After Gamow, edited by G. S. Bisnovaty-Kogan, S. Silich, E. Terlevich, R. Terlevich and A. Zhuk. Published by Cambridge Scientific Publishers, Cambridge, UK, 2007, p.395
ISM absorption localization toward Cyg X-1 was investigated. As a result werenew distance limits. 3D-velocity vector and ISM spatialdistribution reconstruction permit us to limit black hole age andbirth place. Two probability: 1) d~2.3 kpc - Cyg X-1 born in CygOB3 association (not more than 8 Myr ago) –• no kick effect from black hole creation• velocity is about 0• 2) d ~1.8 kpc - Cyg X-1 born in CygOB1 association (not early than 7.5 Myr
ago) –• kick effect from black hole creation velocity ~ 20 km/s Reid M.J. et al Astro-ph 1106.3688 (June 2011) by using trigonometrical
parallax in radio (VLBI measurment) obtained d=1.75-1.98 kpc and velocity ~21 km/s – so Cyg X-1 was born more than 7.5 Myr ago in CygOB1.
In the case of short scale of distances in Galaxy (RG =7.5 kpc) the distance to CygOB3 association d ~1.8 kpc - Cyg X-1 was born in CygOB3 not more than 8 Myr ago.

The spectroscopy of Cyg X-1since 2002 up to now
The main tasks and prospect of high-resolution spectroscopy of Cyg X-1 are published in the paper:
• E.A.Karitskaya, Kinematika i Fizika Nebesnykh Tel, Suppl. No.4 230-233 (2003).
The main high-resolution precision spectroscopy of Cyg X-1 our results are published in the paper:
• Karitskaya E.A.; Bochkarev, N. G.; Bondar', A. V.; Galazutdinov, G. A.; Lee, B.-C.; Musaev, F. A.; Sapar, A. A.; Shimanskii, V. V., Spectroscopic Monitoring of V1357 Cyg = Cyg X-1 in 2002–2004, Astronomy Reports, Volume 52, Issue 5, pp.362-378, (2008).
• E.A.Karitskaya, M.I.Agafanov, N.G.Bochkarev, A.V.Bondar, G.A.Galazutdinov, B.-C.Lee, F.A.Musaev, O.I.Sharova, V.V.Shimanskii, A.E.Tarasov. Results of high-resolution optical spectroscopy investigation of Cyg X-1 = V1357 Cyg, Astronomical and Astrophysical Transactions, v. 26, p. 159-162 (2007)

High-resolution spectral
observations of 2002-2004 Peak Terskol Observatory(Central Caucasus, Russia): 2-m telescopeechelle-spectrographs:-- Coude Focus: R = 45000, 3700 - 10300 Å;-- Cassegrain Focus: R = 13000, 3800 – 7600 Å.
BOAO Observatory (South Korea): 1.84 m telescopefiber echelle-spectrograph: R = 44000 & 30000, 3800 – 10000 Å.
During 33 nights in 2002 - 2004 75 spectra were obtained.

Sequences HeII 4686 Å и HeI 4713 Å profiles against the orbital
period phases
• The Figure shows series of fragments of Cyg X-1 optical spectra against the orbital phase. HeI 4713 A absorption line Doppler shift corresponds to the optical component (supergiant) orbital motion.
• HeII 4686 A line profile variability encloses information on the gas fluxes in the system and on how they are affected by the X-ray radiation variability.
X-ray “soft”June 2003
X-ray “hard”2002 X-ray “soft”2002
HeI 4713 ÅHeII 4686 Å
Main spectral features:
• the supergiant absorption lines:-- HI, HeI, HeII,-- strong CNO λ4640Å blend, -- multiple lines of heavy elements (C, N, O, Ne, Mg, Si, S, Fe, Zn),• strong emission components in Hα and HeII λ4686Å with complex profiles.

The X-ray Flare of June 13, 2003
According to RXTE/ASM data, the X-ray flux F(1.2-12 keV) increased by a factor of 1.7 in 3.7 hours (the time-interval between the expositions)
The line profile variations:
Φ=0.79
Φ=0.76
Φ=0.79
Φ=0.76
Ф is orbital phase
Intensity of HeII 4686A line was increased and Hα line was decreased. So circumstellar gas ionization was increased during the X-ray flare.

Model atmosphere of Cyg X-1 optical star
The main results are reported in:• Karitskaya, E. A.; Agafonov, M. I.; Bochkarev, N. G.; Bondar
, A. V.; Galazutdinov, G. A.; Lee, B.-C.; Musaev, F. A.; Sapar, A. A.; Sharova, O. I.; Shimanskii, V. V., 2005, Astronomical and Astrophysical Transactions, vol. 24, Issue 5, p.383-389
• Karitskaya E.A., Lyuty V.M., Bochkarev N.G., Shimanskii V. V., Tarasov A. E., Bondar A. V., Galazutdinov G. A., Lee B.-C., Metlova N.V., Long-Term Variations of the Supergiant in the X-Ray Binary Cyg X-1. Inf. Bull. Var. Stars, No. 5678, 2006, p. 1-4.
• Karitskaya, E. A.; Shimanskii, V. V.; Sakhibullin, N. A.; Bochkarev, N. G., Peculiarities of the Chemical Composition of the Optical Component of Cyg X-1. In: Why Galaxies Care about AGB Stars: their Importance as Actors and Probes. ASP Conf. Series, V. 378, Eds.: F.Kerschbaum, C.Charbonell & R.F.Wing, 2007, p. 123-124.

The SPECTR code (Sakhibullin, Shimanskii, 1997):
1) Illuminated atmosphere models with heating and cooling balance (Ivanova et al., 2002);
2) Equipotential shape of a star that almost fills its Roche lobe (Shimanskii, 2002);
3) Two types of outer illumination spectra
“soft” - “hard” (A.Zdziarski, M.Gierlinski, (Prog. Theor. Phys. Suppl. No.155, 2004);
4) A synthetic spectrum based on 580000 spectral lines (Shimanskii et al., 2003); 5) Direct computation of non-LTE effects for HI, HeI, MgII, SiIV with influence of outer illumination (Ivanova et al., 2004).
Cyg X-1 spectra simulation technique

• Chromosphere with a temperature excess up to 5000K is formed during the “soft” state of Cyg X-1 only.
• X-ray radiation of any type causes no sensible effect on HI, HeI, MgII, CII, etc. profiles.
• P Cyg emission components in HeI λλ4387, 4471, 4713, 4921, 5876 Å profiles;
• Hot wind outflow from the O-star surface at optical depth log τ < -2.0.
The obtained results:
theorytheory
erg/s theor
obs
Obs

The correct description of HI, HeI and other line profiles corresponds to Cyg X-1 O9.7 Iab star parameters: Teff = 30400 +/- 500 K,
log g =3.31 +/- 0.07, [He/H] = 0.43 +/- 0.06,
Alpha Cam has very similar characteristics but it is ingle supergiant O9.5 I.
For α Cam we obtained : Teff = 30800 +/- 1200K, log g = 3.26 +/- 0.10, [He/H] = 0.02 +/- 0.15,
Cyg X-1 optical spectra simulation leads to conclusions:
Differences between the element to hydrogen abundance ratiologarithms in HDE 226868 and alpha Cam photospheres.4 ovals encircle groups of elements subjected to influences: 1) CNO cycle of hydrogen fusion, 2) alpha--processes of helium fusion, 3) both the processes, 4) or non of them (initial composition).
Cyg X-1 main characteristics and chemical composition. Comparison with α Cam

Chemical composition conclusions
• Cyg X-1 supergiant atmosphere shows a high (from 0.4 dex to 1.0 dex) excess of He, N, Ne, Mg, Si, that is, the elements affected by CNO– and alpha--processes.
It looks like the mixing of matter ought to be far more effective in that object than in the single star alpha Cam, due, in all probability to tidal interaction and mass exchange with the relativistic component at the preceding and present stages of the system evolution.
• Cyg X-1 star chemical composition is anomalous. It demonstrates an influence of matter transformation as in CNO – cycle and in alpha – processes.
• The detected peculiarities of the chemical composition of Cyg X-1 optical component atmosphere may serve as landmarks for the system evolution recuperation.

Cyg X-1 system supergiant variability
The 35-year long series of observations performed by V.M.Lyuty at SAI Crimean Laboratory revealed the supergiant light variation on the time-scale tens of years.
Brightness variations in U-band and X-ray activity
Spectral observations at Crimean Astrophysical Observatory in 1997 performed in the Coude focus of the 2.6 m telescope R=35000, λλ 4655-4722A June 15-August 16, 1997. 20 spectra were obtained.
The data were compared with the data obtained at Terskol Observatory and at BOAO (South Korea).
E.A. Karitskaya, V.M. Lyuty, N.G. Bochkarev, V.V. Shimanskii, et al., 2006a, Long-Term Variations of the Supergiant in the X-Ray Binary Cyg X-1, IBVS, No.5678, pp.1-4.

HeI 4713 A line profile: 1997 vs 2004 data
• The 1997 line profile is different – less deep than the 2004 one. • One example of non-LTE computation for 1997 data is given.
Log g =3.32 is found not to be in agreement with the photometric changes. Therefore combined analysis of photometric and spectral variability has been performed.

Averaged magnitude differences for 2004 vs 1997 according to V.M.Lyuty’s photometric observations:
U 0.065±0.003 m,
B 0.031±0.003 m,
V 0.029±0.003 m.
Simultaneous matching of non-LTE simulation of the photometric variability and HeI 4713 A line profiles against the observed ones shows that
from 1997 to 2003-2004:
• The star radius has increased by 1-4%,• The temperature has decreased by 1300-2400 K.
X-ray activity increasing after 1996 is believed to be a result of the supergiant parameter changes.

Imaging Techniques: Cyg X-1 Doppler Tomography The main results are reported in:
• Karitskaya, E. A.; Agafonov, M. I.; Bochkarev, N. G.; Bondar, A. V.; Galazutdinov, G. A.; Lee, B.-C.; Musaev, F. A.; Sapar, A. A.; Sharova, O. I.; Shimanskii, V. V., 2005, Astronomical and Astrophysical Transactions, vol. 24, Issue 5, p.383-389
• E.A.Karitskaya, M.I.Agafanov, N.G.Bochkarev, A.V.Bondar, G.A.Galazutdinov, B.-C.Lee, F.A.Musaev, O.I.Sharova, V.V.Shimanskii, A.E.Tarasov. Results of high-resolution optical spectroscopy investigation of Cyg X-1 = V1357 Cyg, Astronomical and Astrophysical Transactions, v. 26, p. 159-162 (2007)
• Sharova, O. I.; Agafonov, M. I.; Karitskaya, E. A.; Bochkarev, N. G.; Zharikov, S. V.; Butenko, G. Z.; Bondar', A. V., Three-Dimensional Doppler Tomography of the X-ray Binary Cyg X-1. In: Variable Stars, the Galactic Halo and Galaxy Formation. Eds. Ch.Sterken, N.Samus, L.Sabodos, Moscow: SAI MSU, 2010, p. 212.
A tomogram (tomography map), i.e., spectral intensity distribution in the velocity space constructed over spectral line profiles.
A technique based on the radioastronomical approach (RA) was used (Agafonov, 2004, Astronomische Nachrichten, v.325, No.3, p.259-262 & p.263).
The results of 3D tomography reconstruction of Cyg X-1 see poster presented on this meeting : Sharova, O. I.; Agafonov, M. I.; Karitskaya, E. A.; Bochkarev, N. G. et al.

Cyg X-1 2D tomogram in He II 4686 A line during “soft” state of the X-ray spectrum
(June 2003, Peak Terskol)V
y, k
m/s
Vx, km/s
0
0 -400 0 +400
Starμ=0.95
The accretion diskRd = 0.2 aRd = 0.25 a
The mass ratio q = Mx/Mo q = 1/4q = 1/3
Полости Роша
Star μ=1.0
-600
+400
+400
-400
Comparison with the system parameters

Cyg X-1 tomogram in He II 4686 A line during “hard” state of the X-
ray spectrum (June 2004, Peak Terskol)
Vx, км/с-800 0 +800
Star (μ=0.95)q = 1/4
Comparison with the system parameters
Roche lobes
The blue isolines (absorption component of the line) in upper part of the Figure correspond to the supergiant region opposite to BH and should be inside the Roche lobe. It yields the upper limit:
q = Mx/Mo=1/3.
On the other hand, the star must almost fill its Roche lobe, which yields the lower limit:
q = Mx/Mo=1/4.
The ovals correspond the the disk radii rd = 0.2 and 0.25 in the units of the distance between the components. The emission parts of HeII 4686A line (the red isolines) may be generated in: • the outer parts of the accretion disk heated by the supergiant;• in the “hot line” (Kuznetsov et al., 2001);• and/or the hot stream (focused stellar wind).

Doppler Tomography in 2D and 3D
of the X-ray Binary Cyg X-1 for June, 2007
Sharova O.I. 1), Agafonov M.I. 1), Karitskaya E.A. 2), Bochkarev N.G. 3), Zharikov S.V. 4), Butenko G.Z. 5),
Bondar’ A.V. 5)

• on the base of the spectral data for the line HeII 4686 A obtained with 2-m telescope of the Peak Terskol Observatory (Russia) and 2.1-m telescope of the Mexican National Astronomical Observatory in June, 2007.
• Information about gas motions in the out of the orbital plane by using of all the three velocity components Vx,Vy,Vz were estimated for the first time.
• The features with high intensity in emission (1) the emission of the accretion structure that is located around the compact object but on the side next to the donor-star; 2) the elongated feature of the stream from L1 point; 3) the emission of the stream – accretion structure interaction) and in absorption (the compact area of the supergiant)
An interesting emission feature also associated with the donor-star is in the slices of the low row by the values of Vz= -200, -280, -360 km/s. Its intensity is equal to about ~20-30% from the maximum intensity of 3D tomogram. That is probably a stream from the donor-star that is visible in emission and that flows almost perpendicularly to the orbital plane

Abstract The 2D and 3D Doppler tomograms of the X-ray binary system
Cyg X-1 (V1357 Cyg) were reconstructed on the base of the spectral data for the line HeII 4686 A obtained with 2-m telescope of the Peak Terskol Observatory (Russia) and 2.1-m telescope of the Mexican National Astronomical Observatory in June, 2007. Information about gas motions in the out of the orbital plane by using of all the three velocity components Vx,Vy,Vz were estimated for the first time. The realization of the 3D Doppler tomography became possible due to the developed Radioastronomical Approach to reconstruction in the few projection tomography. The tomograms reconstruction was carried out for the system inclination angle of 45°. The equal resolution (50x50x50 km/s) is realized in this case as in the orbital plane (Vx,Vy) so in the perpendicular direction Vz. The checkout tomograms were realized also for the inclination angle of 40° because of the angle uncertainty. Two versions of the results showed no qualitative discrepancy. Structure details revealed by the 3D Doppler tomogram were analyzed.
The 2D tomograms for June 2007 are similar to those reconstructed earlier (for 1997, 2003 and 2004). They give evidences for the emission component of the HeII 4686 A line being generated mainly in the outer parts of the Cyg X-1 accretion structure closest to the donor star (O-supergiant). The absorption component is formed in the atmosphere of the supergiant. The comparison using the Chi-square method of the observed line profiles with the computed ones (recovered from the reconstructed tomograms) shows a good quality of reconstruction.

Spectropolarimetrical observations.Magnetic field discovery in Cyg X-1
The main results are reported in:
• E.A.Karitskaya, N.G.Bochkarev, S.Hubrig, Yu.N.Gnedin, M.A.Pogodin, R.V.Yudin, M.I.Agafonov, O.I.Sharova Magnetic Field in X-ray Binary Cyg X-1, 2009, arXiv: astro-ph 0908.2719
• E.A.Karitskaya, N.G.Bochkarev, S.Hubrig, Yu.N.Gnedin, M.A.Pogodin, R.V.Yudin, M.I.Agafonov, O.I.Sharova, 2010, The first discovery of a variable magnetic field in X-ray binary Cyg X-1 = V1357 Cyg, IBVS, No. 5950, 1
• Karitskaya, Eugenia A.; Bochkarev, N.G.; Hubrig, S.; Gnedin, Yu.N.; Pogodin, M.A.; Yudin, R.V.; Agafonov, M.I.; Sharova,O.I., The magnetic field in the X-ray binary Cyg X-1. In: Cosmic Magnetic Fields: from Planets to Stars and Galaxies, Eds. K. G. Strassmeier, A.G. Kosovichev, J. Beckman, Cambridge Univ. Press,. IAU Symp. 259, 2009, p. 137-138.

Some Developments of the Weak Stellar Magnetic Field Determination Method on the Example of Cyg X-1
N.G.Bochkarev Sternberg Astron. Inst., Moscow, Russia
E.A.KaritskayaInst. of Astron. RAS, Moscow, Russia
IAU Symp. 282, July 2011

AbstractSome developments of measurements of the weak stellar magnetic fields
by the least square technique applied to spectropolarimetrical data are proposed and used for the X-ray binary Cyg X-1=HDE 226868 (the optical counterpart is an O9.7 supergiant). The V/I circular polarization spectra obtained during our spectropolarimetric FORS1 VLT observations have variable sloped continuum components not belonging to the object. It is shown that such components should be removed, otherwise these false sloped continua yield biased results. For HDE226868 the mean longitudinal magnetic field bias Δ<Bz> varies from 20 G to 100 G, which is comparable to its value. The slopes of I-spectra have smaller influence on <Bz> result but they should be subtracted too. We also consider the initial I- and V/I-spectra cleaning, effects from the deviating points, and their influence on the results of <Bz> measurements.
By using these developments we could detect magnetic field in Cyg X-1. That is the first successful measurement of magnetic field in a binary with a black hole. The value of the mean longitudinal magnetic field in optical component (9.7 Iab supergiant) changes regularly with the orbital phase reaching its maximum of 130 G (σ ≈ 20 G).
The measurements based on Zeeman effect were carried through over all the observed supergiant photosphere absorption spectral lines. Similar measurements over the emission line He II 4686 A yielded a value of several hundreds Gauss with a smaller significance level.

Our VLT FORS1 spectropolarimetric 2007 -2008 observations permitted us to reveal the magnetic field of ~100 G on the supergiant in Cyg X-1 and to suspect the magnetic field of ~600 G on the accretion structure outer limit.
It is the pioneer measurement in black hole systems.
The field is enough for X-ray flickering. For details see poster by Bochkarev N.G. and Karitskaya E.A.
It is the firstobservationalconfirmation ofmagnetic discaccretion onblack hole(including AGNs).
G (6

Sources of wavelength-dependant circular polarization
of optical continuum• In contrast to previously studied stars (mainly A and late B
types), luminous O-stars have usually significant interstellar / circumstellar linear (up to ~ 10 %) and weak circular (< 0.05 %) polarization in optical continuum.
• Any spectropolarimeter has cross-talk between linear and circular polarization within analysing equipment. It creates a false circularly polarized wavelength-dependant continual component of radiation for stars with linear polarization.
As a result, more and more often targets for magnetic field measuring has spectra of Stokes parameter V (measuring circular polarization) and ratio V/I (I is Stokes parameter for total intensity) containing wavelength-dependant continual components CV(λ) and CV/I(λ), λ is wavelength.

Cyg X-1 = HDE 226868 observations• Very Large Telescope (VLT) 8.2 m (Mount Paranal, Chile);• Spectropolarimetry with FORS1 spectrograph; • Resolution R=4000; • Range 3680-5129 A;• S/N = 1500 – 3500 (for I);• since June 18 over July 9, 2007 • since July 14 over July 30, 2008 (Cyg X-1 in X-ray hard state) 13 nights of 1-hour observations
13 spectra of intensity I and circular polarization V were obtained.
X-ray binary Cyg X-1 = HDE 226868:
Magnitude mV = 9m
> 95% of optical radiation from O9.7 Iab star;
Interstellar extinction AV=3.36m.
Interstellar/circumstellar linear polarization ~5%.
Stellar wind (Mdot ~ 5*10-6 Msun/yr).
Chemical peculiarities (excess mainly He, N, Si).
Moderate rotation velocity V sin i = 95 km/s.

The method of the magnetic field measurment
• Mean longitudinal magnetic field ‹Bz› was determined by statistical processing of spectra of circular polarization V(λ) and intensity I(λ), using equation (e.g. Landstreet 1982):
•
where geff is the effective Lande factor,
CZ = e/(4 π me c2) = 4.67*10−13 Å−1 G−1.
Least squares method (LSM) used for ‹Bz› calculation (for details see, e.g., Bagnulo et al. 2002, 2006; Hubrig et al. 2004).

Sources of noise of <B> measurements, which should be removed from I- and V/I-spectra
• 1) interstellar lines and narrow diffuse interstellar bands (DIBs);
• 2) defects (including residual cosmic ray tracks that remained after the standard observation processing);
• 3) He II 4686A line with complicated profile including the accretion-structure emission component (the second emission line Hα is situated outside the spectral range of our VLT observations);
• 4) emission components of lines with P Cyg effect. • In addition we removed some λ intervals containing
no observed lines besides noise.• We found no pollution by telluric lines in our spectra.
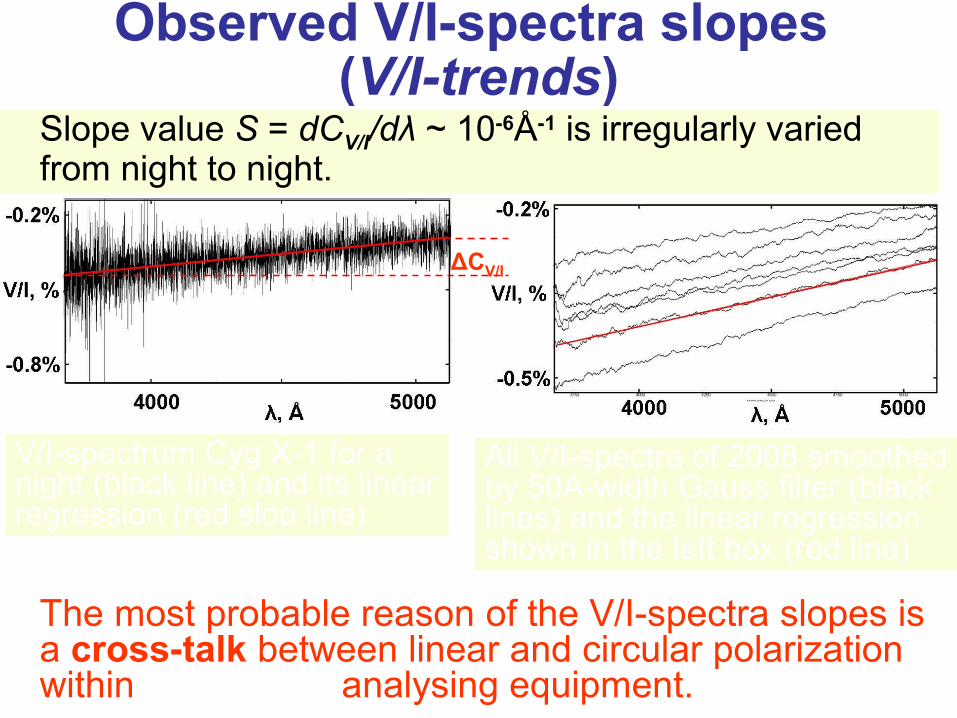
Observed V/I-spectra slopes (V/I-trends)
Slope value S = dCV/I/dλ ~ 10-6Å-1 is irregularly varied from night to night.
V/I-spectrum Cyg X-1 for a night (black line) and its linear regression (red slop line)
ΔCV/I
All V/I-spectra of 2008 smoothed by 50A-width Gauss filter (black lines) and the linear regression shown in the left box (red line)
The most probable reason of the V/I-spectra slopes is a cross-talk between linear and circular polarization within the FORS1 analysing equipment.

ΔCV/I
Influences of the V/I-trends on results of ‹Bz› measurements
Application of a least squares method (LSM) to data with non-removed V/I trend results in distorted or even false <Bz> value and its significance.
There are at least 2 reasons for it:
1) Strong violation of residuals Gauss statistic;
2) Appearance of false <Bz> component.
False ‹Bz› component is
~ (ΔλD / λ)2 * dCV/I / dλ
No V/I-trend: Gauss statistic of residuals
V/I-trend exist: non-Gauss statistic of residuals

Corrections of Cyg X-1 optical component ‹Bz› produced by the V/I-continuum slope removing
• For our Cyg X-1 FORS1 observations false ‹Bz› from
single spectral line and sloped V/I continuum without Zeeman S-waves is several Gauss.
• To avoid any influence of the V/I-continuum slope on our ‹Bz› measurements, we subtracted linear trends from V/I
spectra.
• For our Cyg X-1 VLT observations non-removed V/I-spectra slopes create <Bz> shifts from 20 to 84 G.
• All ‹Bz› corrections are negative.

Influence of I-spectra slopes on ‹Bz›
• We normalized I-spectra by pseudo-continuum.
• Wavelength dependence of I-continuum I(λ) is produced by:
-- the source energy distribution, -- interstellar reddening, -- broad diffuse interstellar bands (DIBs), -- atmospheric extinction, -- used equipment detector sensitivity.
• I-spectrum slopes reach |d(log(I(λ))/d(log(λ))| ~ 20.
• The slope removing gives ‹Bz› correction up to ~ 20 G.
• It is usually less than the statistical errors σ(‹Bz›) ~ 20 − 30 G.

Дата Фаза <Вz>, Гс (орб) 18/06/07 0.650 -6+-2819/06/07 0.830 +37+-2220/06/07 0.006 +58+-2125/06/07 0.907 +22+-2829/06/07 0.603 +48+-2009/07/07 0.400 +101+-1814/07/08 0.641 +49 +-2315/07/08 0.816 +22 +-2216/07/08 0.995 +80 +-2317/07/08 0.174 +24 +-1923/07/08 0.247 -16 +-2024/07/08 0.430 +27 +-1930/07/08 0.500 +128 +-21
Results of <Bz> measurements of Cyg X-1 optical component
About 6 sigma!
About 6 sigma!
Tests: 1) Each spectrum was divided in two halves at mid-wavelength; <Вz>,
determined over each half separately were coincided within error.2) “Zeeman S-waves” for the strongest lines (e.g. Hel 4026 A) were found.3) Deviations have Gauss statistic up to >3.5 sigma. It is an accuracy estimation control.

<Bz> measuring is helped by element overabundance in the star atmosphere: [He/H]=0.42, [N/H]=0.9, [Ne/H]=0.7, [Si/H]=0.7, [S/H]=0.4, … (Karitskaya et al. 2006, 2007), which enforces the spectral lines.
2007 2008
It is very possible that the orbital magnetic curve is varying with time
Results of <Bz> measurements of Cyg X-1 optical component

Analysis of He II 4686 A spectral lineThe line has compound profile:absorption (star photosphere) +
emission (accretion structure)
It was omitted from the earlier analysis!Now we investigate it separately.
The accuracy of magnetic field measuring over 1 line considerably lower than from all lines.But estimations on 4 sigma level was found for orbital phases 0.65 (2007) and 0.43 (2008):<Bz>=-730+/-170 G <Bz>=+420+/-105 G
HeII 4686 A
<Bz> reality is confirmed:• by “Zeeman S-wave” in V-spectrumsmoothed over 3 А (see +/- 1 sigma corridor on right figure);• by its correspondence to the dI(λ)/dλ wave.
I
dI/dλ
V/I ± σ
λ
~
ΔI = 7.5%I
3A
theor
obs

Cyg X-1 Magnetic FieldWe got B ~ 100 G for the star photosphere. Phase dependence is more complicated than for dipole field model (may be quadrupole for 2008) and evidently has time variations. The quadrupole is inclined in respect to the system axis of rotation.Near orbital phase 0.5 (X-ray source in front) we look at magnetic pole.Near orbital phase 0.0 we see the other magnetic pole.
Gas stream carries the field on to the accretion structure; the gas is compressed by interaction with outer rim. Gas density is increased on a factor 6-10: B ~ 600 G at a distance 6*1011 см = 2*105 Rg.
According to Shakura-Sunyaev (1973) magnetized accretion disc standard model
at 3 Rg B ~ 109 G.
Taking into account radiative pressure predominance inside~10--20 Rg, we get:
B(3 Rg) ~ (2—3) 108 G.
N Pol
S Pol
Obs Φ=0.5Obs Φ=0.0

Can magnetic field of the disc inner region account for Cyg X-1 X-ray flickering?
If the flickering has magnetic nature, then the accreting matter magnetic energy flux must exceed the X-ray emission fluctuating component luminosity. X-ray emission originates at R < 30Rg. Inside the sphere of this radius the magnetic energy amounts to
1040 erg. The flux radial velocity is 1.5 km/s (α=1, because magnetic viscosity is big).
the time of matter fall is ~1000 s; magnetic energy flux is 1037 erg/s which is
equal or exceed the flickering component power (0.5-1)1037erg/s.
So magnetic energy can account for the flickering. Magnetic field 3D structure
near BH (Robertson & Leiter, 2003)