multi-spectral and hyper-spectral remote sensing and hyper-spectral remote sensing lectures 6 ......
TRANSCRIPT
Multi-spectral and Hyper-spectral Remote Sensing
Lectures 6October 2, 2007

Multispectral Remote Sensing
Multispectral remote sensing is defined as the collection of reflected, emitted, or backscattered energy from an object or area of interest in multiple bands of electromagnetic spectrum; while Hyperspectral remote sensing involves data collection in hundreds of bands.
Instead of cameras and 1 to 4 bands for photogrammetry, Remote sensing use detectors that are sensitive to from multiple bands to hundreds of bands in the electromagnetic spectrum. Measurements made by detectorsare always stored in a digital format (as BSQ, BIP, or BIL)

Ustin, 2003

Landsat satellite series
Jensen, 2000Jensen, 2000Jensen, 2000
MSS TM ETM+0.5-0.6 0.45-0.52 0.45-0.520.6-0.7 0.52-0.60 0.52-0.610.7-0.8 0.63-0.69 0.63-0.690.8-1.1 0.76-0.90 0.78-0.9010.4-12.6 1.55-1.75 1.55-1.75
10.4-12.5 10.4-12.52.08-2.35 2.09-2.35
0.52-0.9079m 30 30240m 120 60
156 bits 8 8103 m/c 99 9918 days 16 16 919km 705 705185km 185 185
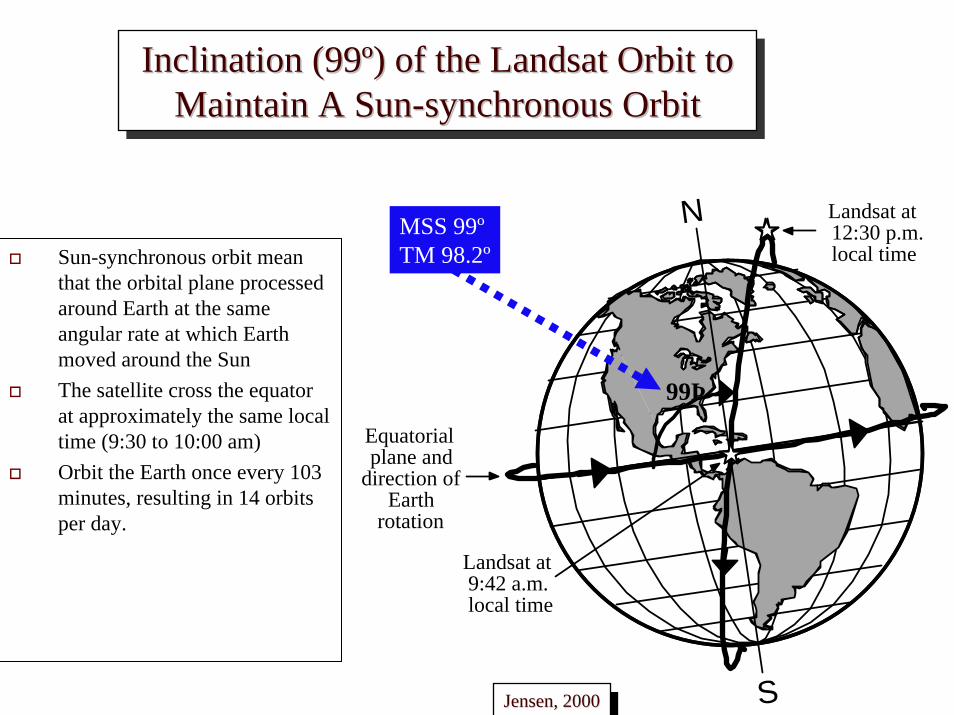
Inclination (99º) of the Landsat Orbit to Maintain A Sun-synchronous Orbit
Inclination (99Inclination (99ºº) of the Landsat Orbit to ) of the Landsat Orbit to Maintain A SunMaintain A Sun--synchronous Orbitsynchronous Orbit
99Þ
Landsat at 12:30 p.m. local time
Equatorial plane and
direction of Earth
rotation
Landsat at 9:42 a.m. local time
N
SJensen, 2000Jensen, 2000Jensen, 2000
MSS 99ºTM 98.2ºSun-synchronous orbit mean
that the orbital plane processed around Earth at the same angular rate at which Earth moved around the SunThe satellite cross the equator at approximately the same local time (9:30 to 10:00 am)Orbit the Earth once every 103 minutes, resulting in 14 orbits per day.
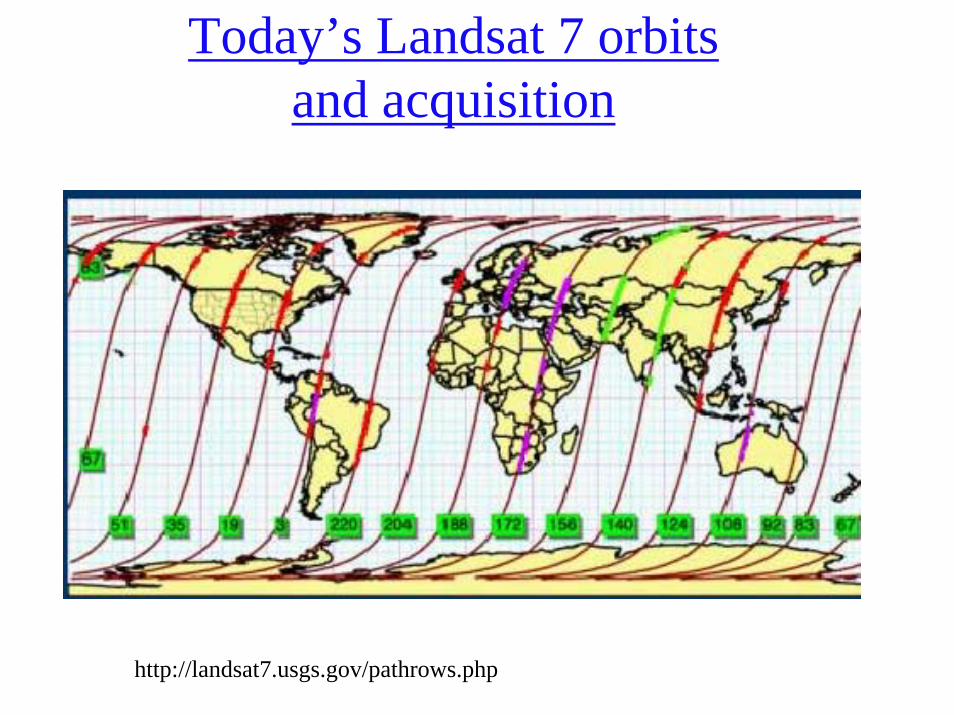
Today’s Landsat 7 orbits and acquisition
http://landsat7.usgs.gov/pathrows.php
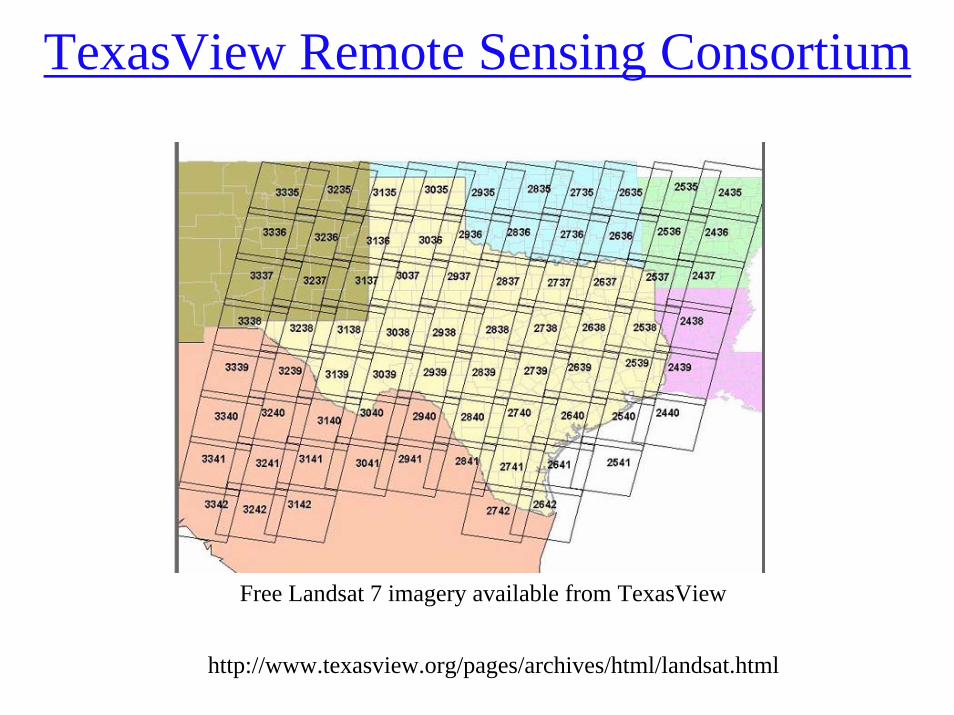
TexasView Remote Sensing Consortium
Free Landsat 7 imagery available from TexasView
http://www.texasview.org/pages/archives/html/landsat.html

GOES satellites provide the kind of continuous monitoring necessary for intensive data analysis. They circle the Earth in a geosynchronous orbit, which means they orbit the equatorial plane of the Earth at a speed matching the Earth's rotation. This allows them to hover continuously over one position on the surface
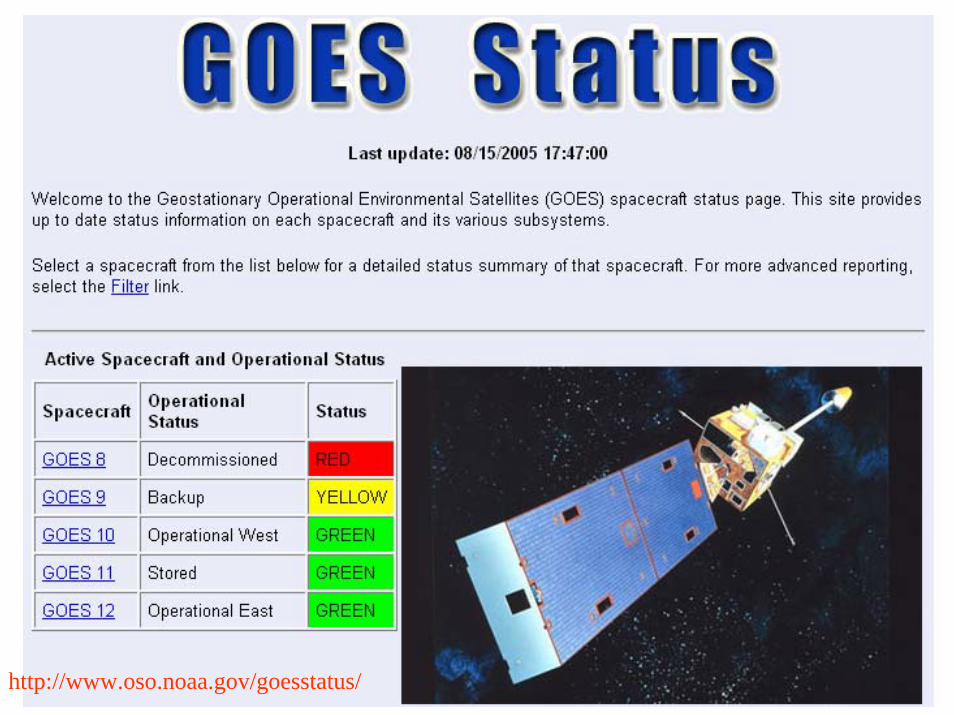
http://www.oso.noaa.gov/goesstatus/

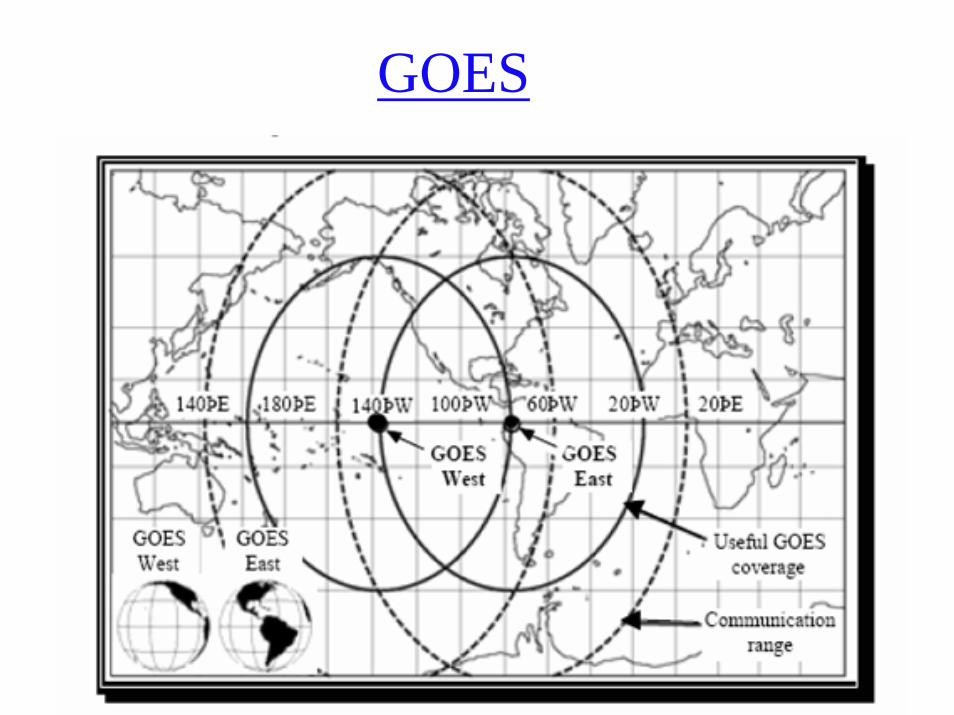
GOES
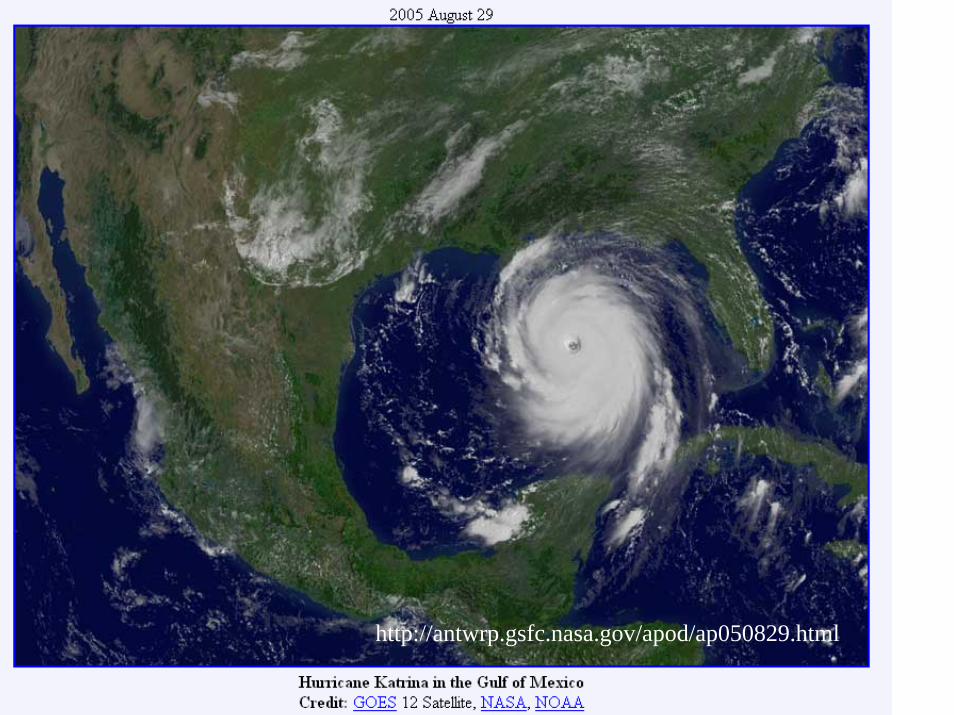
http://antwrp.gsfc.nasa.gov/apod/ap050829.html

GOES 13 Launched May 24, 2006
NOAA will put GOES-13 into on-orbit storage at 105W until it is needed to replace GOES-12 at GOES-EAST or GOES-11 at GOES-WEST, circa 2010Know more about GOES-13?
http://goes.gsfc.nasa.gov/text/goesnstatus.htmlhttp://rammb.cira.colostate.edu/projects/goes_n/http://www.n2yo.com/satellite.php?s=29155
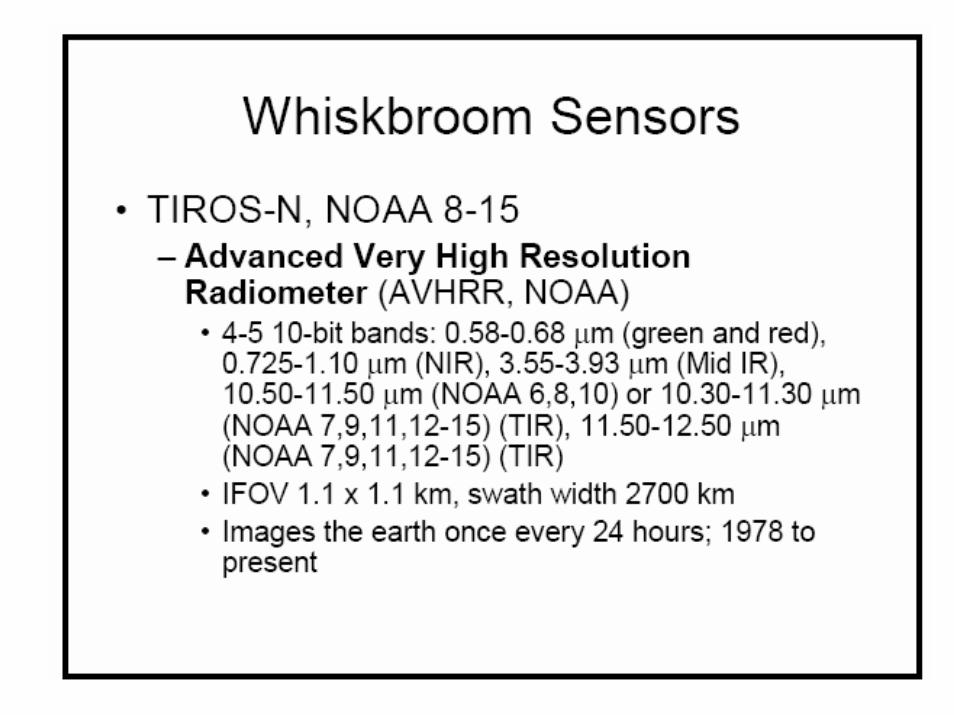

Advanced Very High Resolution Radiometer (AVHRR) Bandwidths
Advanced Very High Advanced Very High Resolution Radiometer Resolution Radiometer (AVHRR) Bandwidths(AVHRR) Bandwidths
9.5 10 10.5 11.511 12
20
40
60
80
100
0
700 800 1000900 1100
20
40
60
80
100
0600
3.3 3.4 3.5 3.7 3.93.6 3.8
20
40
60
80
100
04.0
500 550 600 700 800650 750
20
40
60
80
0
11 11.25 11.5 12 12.511.75 12.25
20
40
60
80
100
0
Nor
mal
ized
Rel
ativ
e
Res
pons
e (%
)
Wavelength (nm)
AVHRR Band 1
Band 2
Band 3 Band 4
Band 5
Nor
mal
ized
Rel
ativ
e
Res
pons
e (%
)N
orm
aliz
ed R
elat
ive
R
espo
nse
(%)
100
Wavelength ( µm)
Wavelength ( µm)
1.1 km
Jensen, 2000Jensen, 2000Jensen, 2000

Advanced Very High Resolution Radiometer (AVHRR) Mosaic of the Conterminous United States
Advanced Very High Resolution Radiometer Advanced Very High Resolution Radiometer (AVHRR) Mosaic of the Conterminous United States(AVHRR) Mosaic of the Conterminous United States
Jensen, 2000Jensen, 2000Jensen, 2000
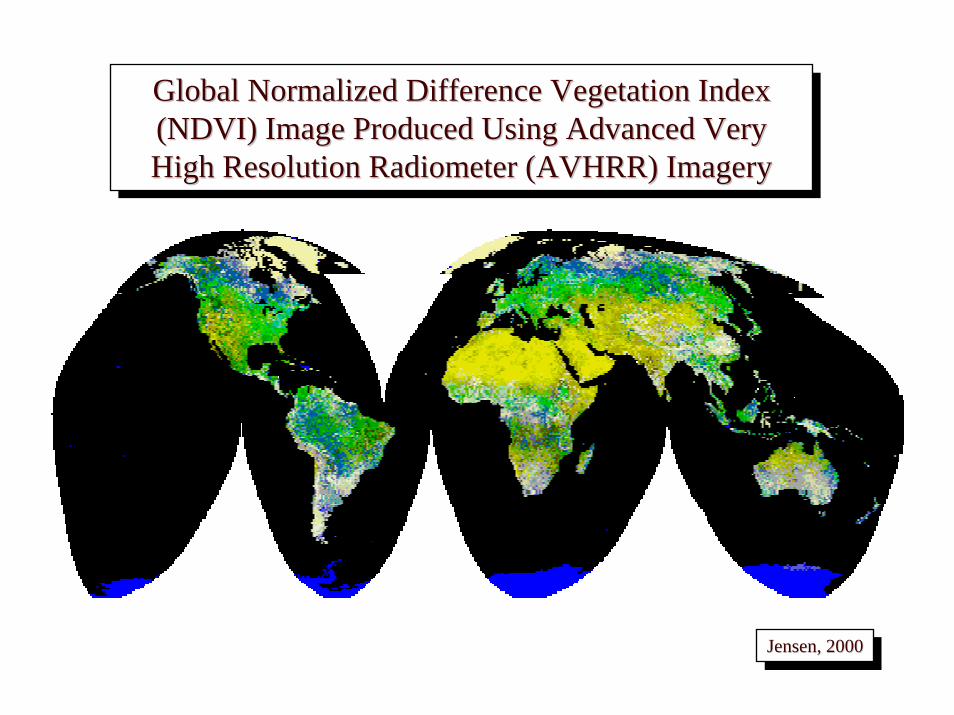
Global Normalized Difference Vegetation Index (NDVI) Image Produced Using Advanced Very High Resolution Radiometer (AVHRR) Imagery
Global Normalized Difference Vegetation Index Global Normalized Difference Vegetation Index (NDVI) Image Produced Using Advanced Very (NDVI) Image Produced Using Advanced Very High Resolution Radiometer (AVHRR) ImageryHigh Resolution Radiometer (AVHRR) Imagery
Jensen, 2000Jensen, 2000Jensen, 2000


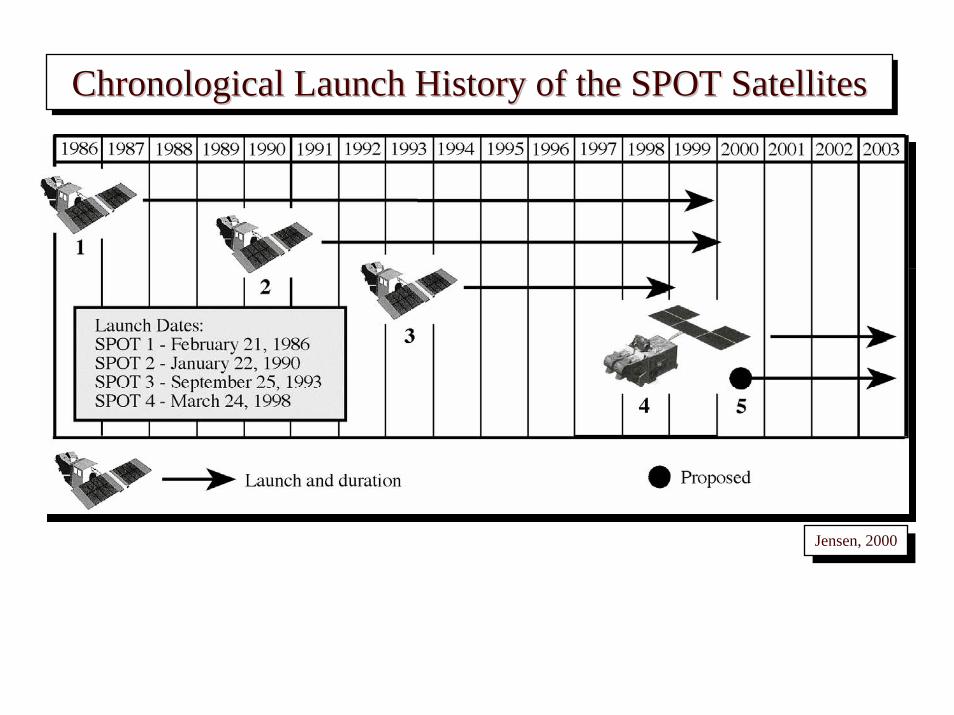
Chronological Launch History of the SPOT SatellitesChronological Launch History of the SPOT SatellitesChronological Launch History of the SPOT Satellites
Jensen, 2000Jensen, 2000
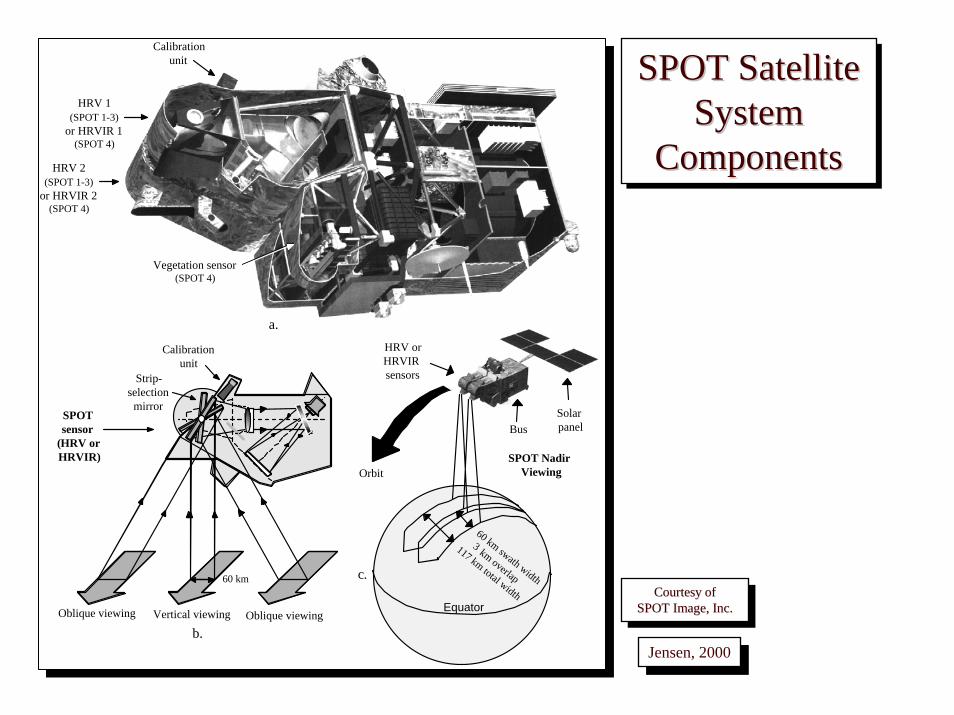
b.Vertical viewingOblique viewing Oblique viewing
SPOT sensor
(HRV or HRVIR)
Calibration unit
Calibration unit
a.
HRV 1 (SPOT 1-3)
or HRVIR 1 (SPOT 4)
60 km
Vegetation sensor (SPOT 4)
HRV 2 (SPOT 1-3)
or HRVIR 2 (SPOT 4)
Strip- selection
mirror
60 km swath width
Equator
117 km total width
3 km overlap
HRV or HRVIR sensors
BusSolar panel
OrbitSPOT Nadir
Viewing
c.
SPOT Satellite System
Components
SPOT Satellite SPOT Satellite System System
ComponentsComponents
Courtesy of SPOT Image, Inc.
Courtesy of Courtesy of SPOT Image, Inc.SPOT Image, Inc.
Jensen, 2000Jensen, 2000

Geographic Coverage of the SPOT HRV and Landsat Thematic Mapper Remote Sensing Systems
Geographic Coverage of the SPOT HRV and Landsat Geographic Coverage of the SPOT HRV and Landsat Thematic Mapper Remote Sensing SystemsThematic Mapper Remote Sensing Systems
Jensen, 2000Jensen, 2000


Multi-angle Imaging Spectroradiometer
(MISR) Onboard Terra
MultiMulti--angle Imaging angle Imaging SpectroradiometerSpectroradiometer
(MISR) Onboard (MISR) Onboard TerraTerra
70.5Þ Df
60Þ Cf
45.6Þ Bf
0Þ nadir
70.5Þ Da 60Þ Ca
26.1Þ Af
26.1Þ Aa 45.6Þ Ba
425 – 467 nm
Sensors
View angle 70.5Þ 60Þ 60Þ 70.5Þ 45.6Þ 45.6Þ 26.1Þ 26.1Þ 0Þ
Df Cf Bf Af An Aa Ba Ca Da
275 x 275 m 1.1 x 1.1 km 275 m x 1.1 km
543 – 571 nm
660 – 682 nm
846 – 886 nm
Nadir is the point of the Earth surface thatis vertically downward from the observer
Jensen, 2000Jensen, 2000
f: forward, a: after

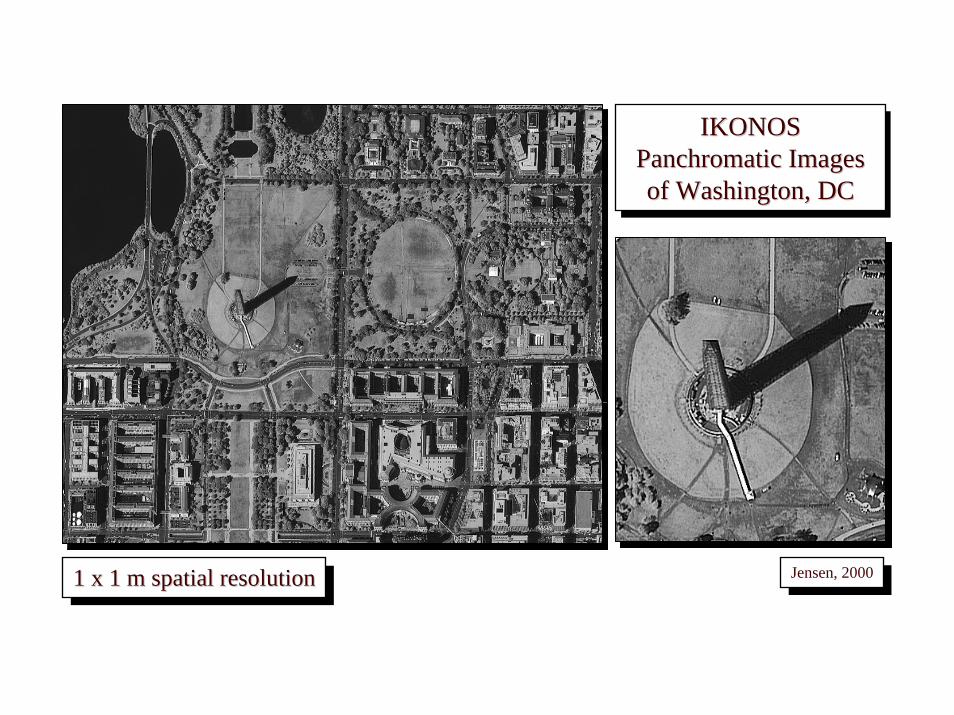
IKONOS Panchromatic Images of Washington, DC
IKONOS IKONOS Panchromatic Images Panchromatic Images of Washington, DCof Washington, DC
Jensen, 2000Jensen, 20001 x 1 m spatial resolution1 x 1 m spatial resolution1 x 1 m spatial resolution

IKONOS Panchromatic Stereopair of Columbia, SC AirportIKONOS Panchromatic IKONOS Panchromatic StereopairStereopair of Columbia, SC Airportof Columbia, SC Airport
Jensen, 2000Jensen, 2000 November 15, 2000November 15, 2000November 15, 2000
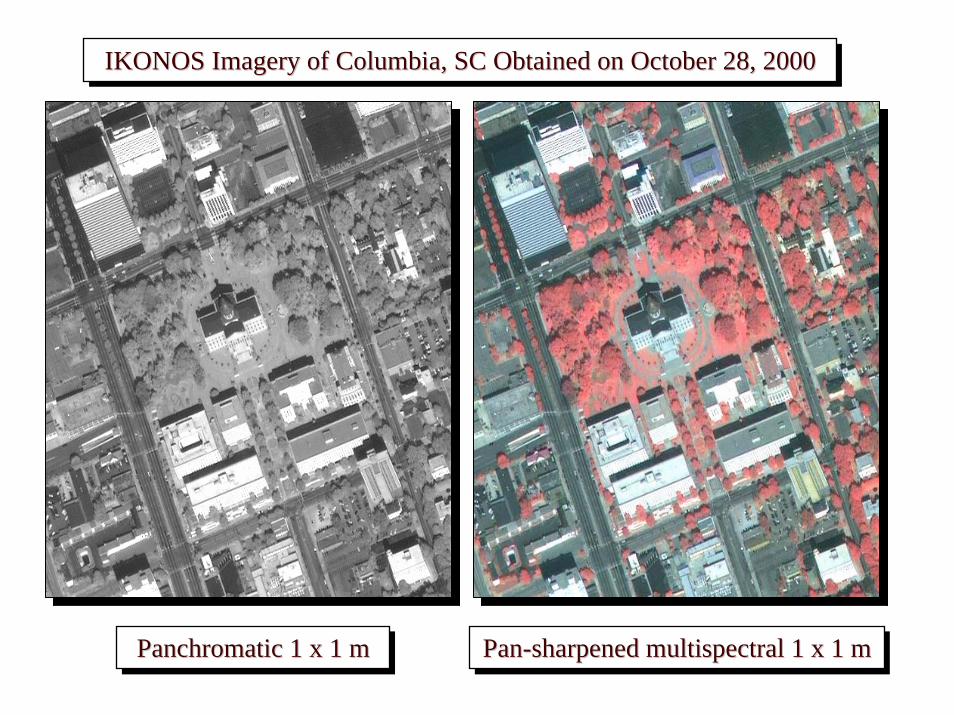
IKONOS Imagery of Columbia, SC Obtained on October 28, 2000IKONOS Imagery of Columbia, SC Obtained on October 28, 2000IKONOS Imagery of Columbia, SC Obtained on October 28, 2000
Panchromatic 1 x 1 mPanchromatic 1 x 1 mPanchromatic 1 x 1 m Pan-sharpened multispectral 1 x 1 mPanPan--sharpened multispectral 1 x 1 msharpened multispectral 1 x 1 m
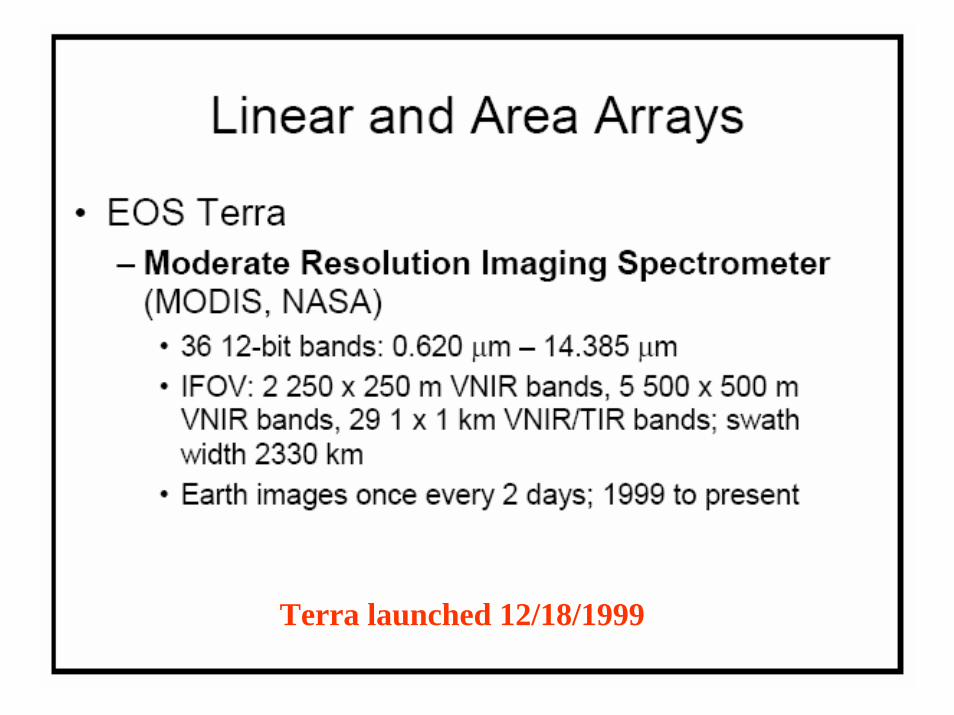
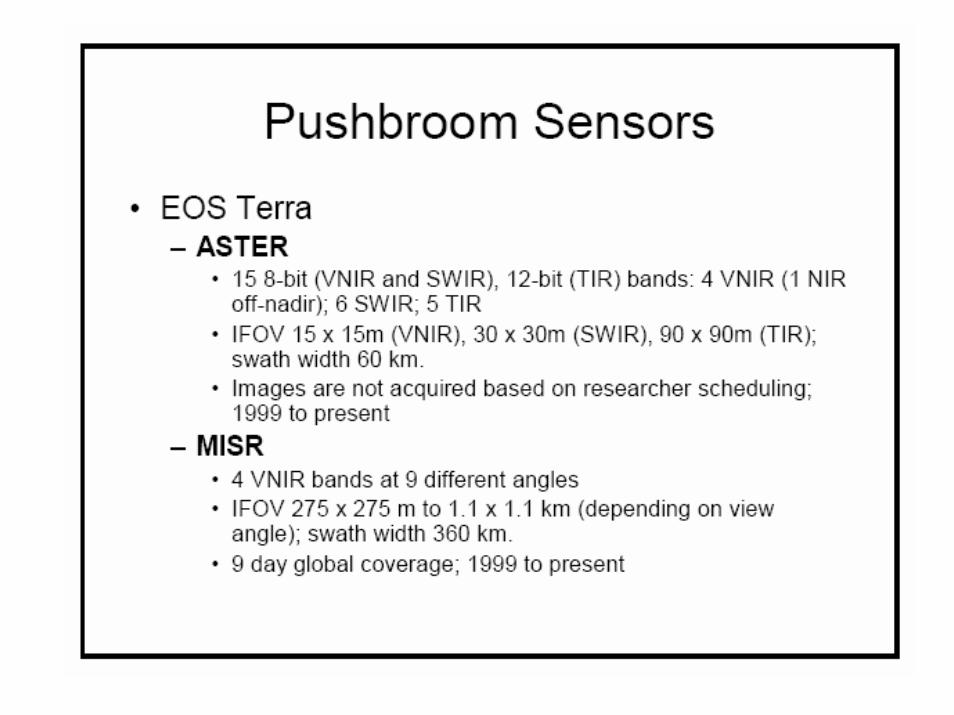
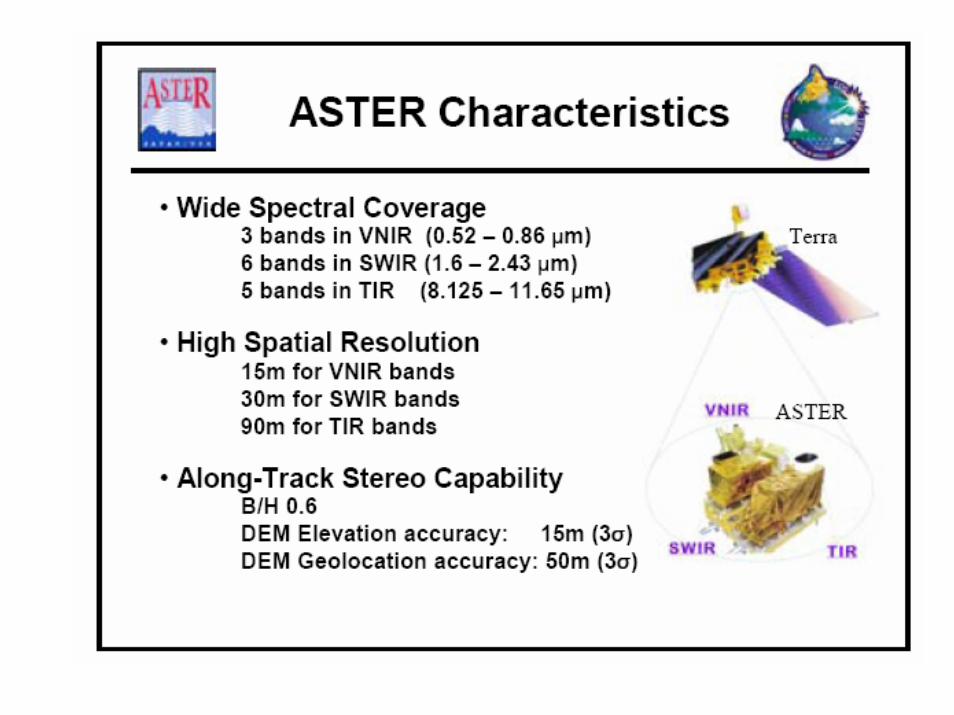
Terra launched 12/18/1999

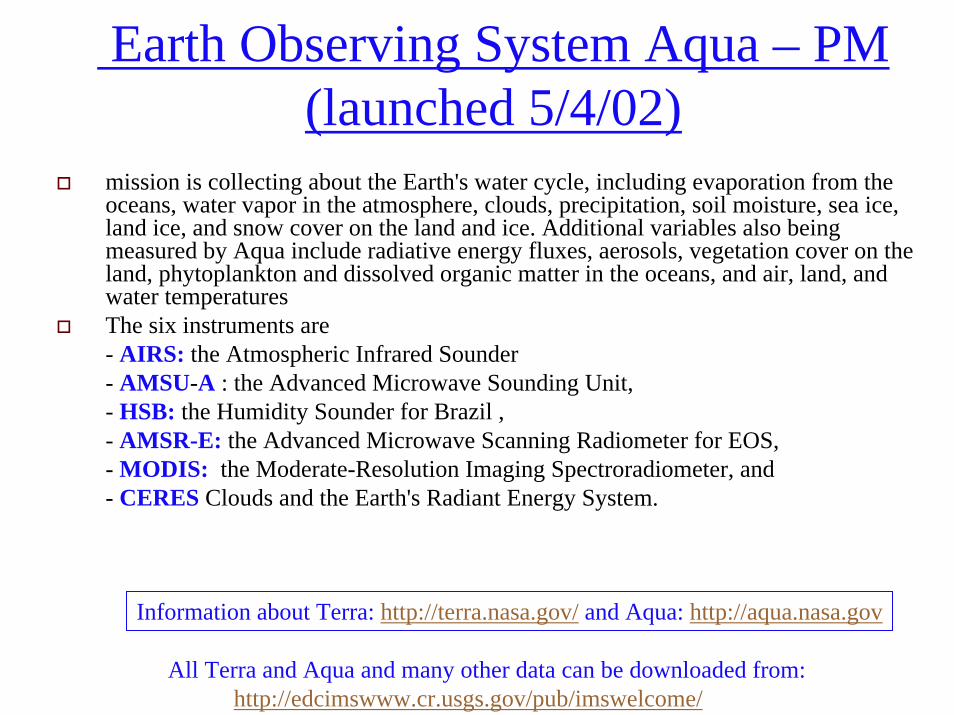
Earth Observing System Aqua – PM (launched 5/4/02)
mission is collecting about the Earth's water cycle, including evaporation from the oceans, water vapor in the atmosphere, clouds, precipitation, soil moisture, sea ice, land ice, and snow cover on the land and ice. Additional variables also being measured by Aqua include radiative energy fluxes, aerosols, vegetation cover on the land, phytoplankton and dissolved organic matter in the oceans, and air, land, and water temperatures The six instruments are - AIRS: the Atmospheric Infrared Sounder - AMSU-A : the Advanced Microwave Sounding Unit, - HSB: the Humidity Sounder for Brazil ,- AMSR-E: the Advanced Microwave Scanning Radiometer for EOS,- MODIS: the Moderate-Resolution Imaging Spectroradiometer, and - CERES Clouds and the Earth's Radiant Energy System.
All Terra and Aqua and many other data can be downloaded from: http://edcimswww.cr.usgs.gov/pub/imswelcome/
Information about Terra: http://terra.nasa.gov/ and Aqua: http://aqua.nasa.gov
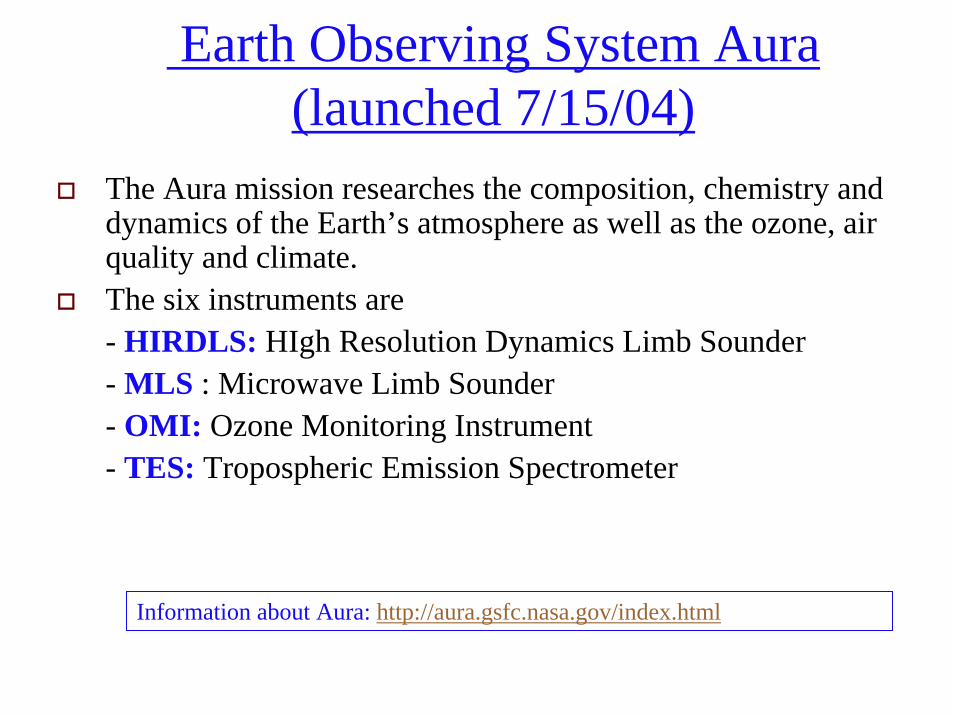
Earth Observing System Aura (launched 7/15/04)
The Aura mission researches the composition, chemistry and dynamics of the Earth’s atmosphere as well as the ozone, air quality and climate. The six instruments are - HIRDLS: HIgh Resolution Dynamics Limb Sounder - MLS : Microwave Limb Sounder - OMI: Ozone Monitoring Instrument- TES: Tropospheric Emission Spectrometer
Information about Aura: http://aura.gsfc.nasa.gov/index.html
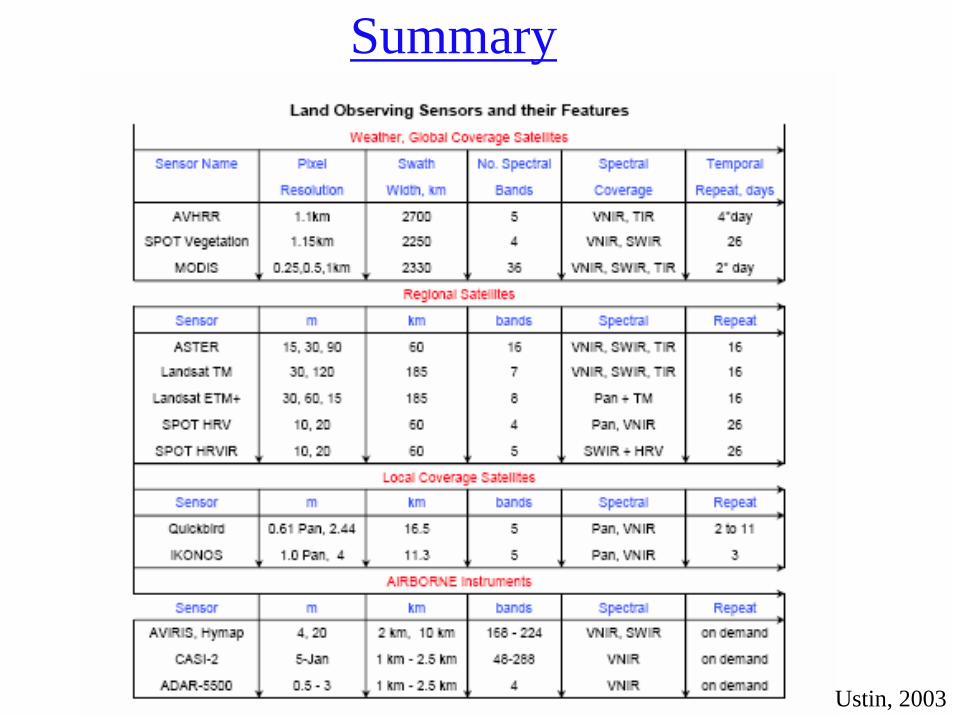
Summary
Ustin, 2003

Hyper-spectral remote sensing
Many remote sensing systems record energy over several separate wavelength ranges at various spectral resolutions. These are referred to as multi-spectral sensors. Advanced multi-spectral sensors called hyperspectral sensors, detect hundreds of very narrow spectral bands throughout the visible, near-infrared, and mid-infrared portions of the electromagnetic spectrum. Hyper-: Narrow bands (≤ 20 nm in resolution or FWHM) and continuous measurements.Imaging spectrometry: the simultaneous acquisition of images in many relatively narrow, contiguous and/or non-contiguous spectral bands throughout the ultraviolet, visible, and infraredportions of the spectrum.The very high spectral resolution facilitates fine discrimination between different targets based on their spectral response in each of the narrow bands
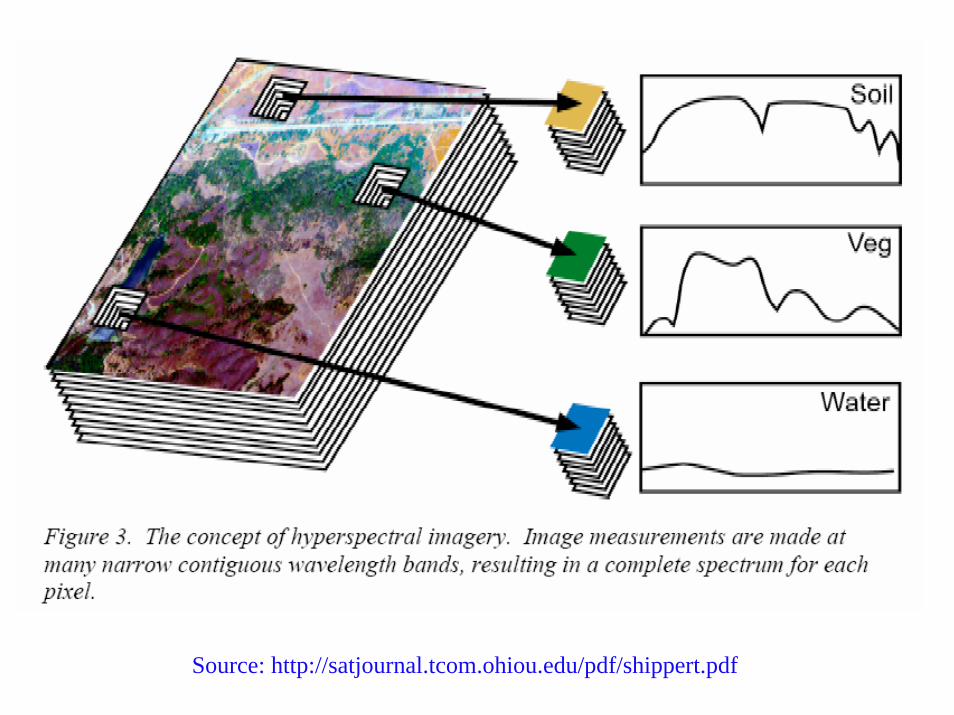
Source: http://satjournal.tcom.ohiou.edu/pdf/shippert.pdf

Airborne Visible Infrared Imaging
Spectrometer (AVIRIS) Datacube of
Sullivan’s Island Obtained on
October 26, 1998
Airborne Visible Airborne Visible Infrared Imaging Infrared Imaging
Spectrometer Spectrometer (AVIRIS) Datacube of (AVIRIS) Datacube of
SullivanSullivan’’s Island s Island Obtained on Obtained on
October 26, 1998October 26, 1998
Jensen, 2000Jensen, 2000

Linear and Area Arrays
Hyperion (EO-1, NASA)220 bands: 400-2500 nm, band width 10 nmPixel size 30 x 30 m, swath width 7.5 km11/21/2000 to present, it is the first satellite-based hyperspectral remote sensor.
Science information: http://eo1.gsfc.nasa.gov/overview/eo1Overview.html
Data order from: http://edc.usgs.gov/products/satellite/eo1.html
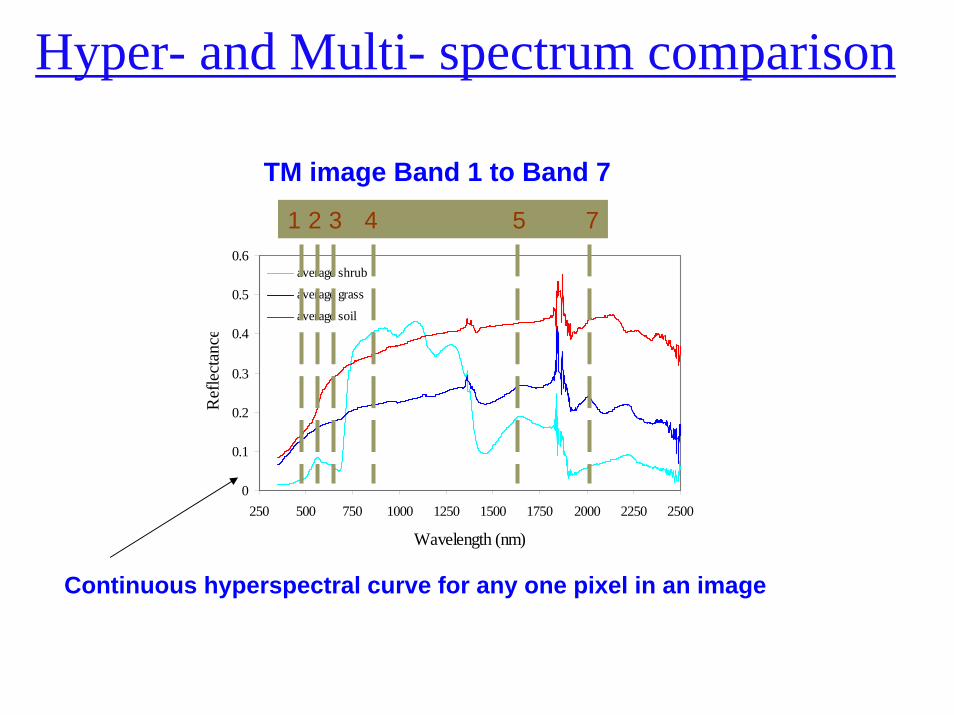
Hyper- and Multi- spectrum comparison
0
0.1
0.2
0.3
0.4
0.5
0.6
250 500 750 1000 1250 1500 1750 2000 2250 2500
Wavelength (nm)
Ref
lect
ance
average shrub
average grass
average soil
1 2 3 4 5 7
TM image Band 1 to Band 7
Continuous hyperspectral curve for any one pixel in an image


Ustin, 2003

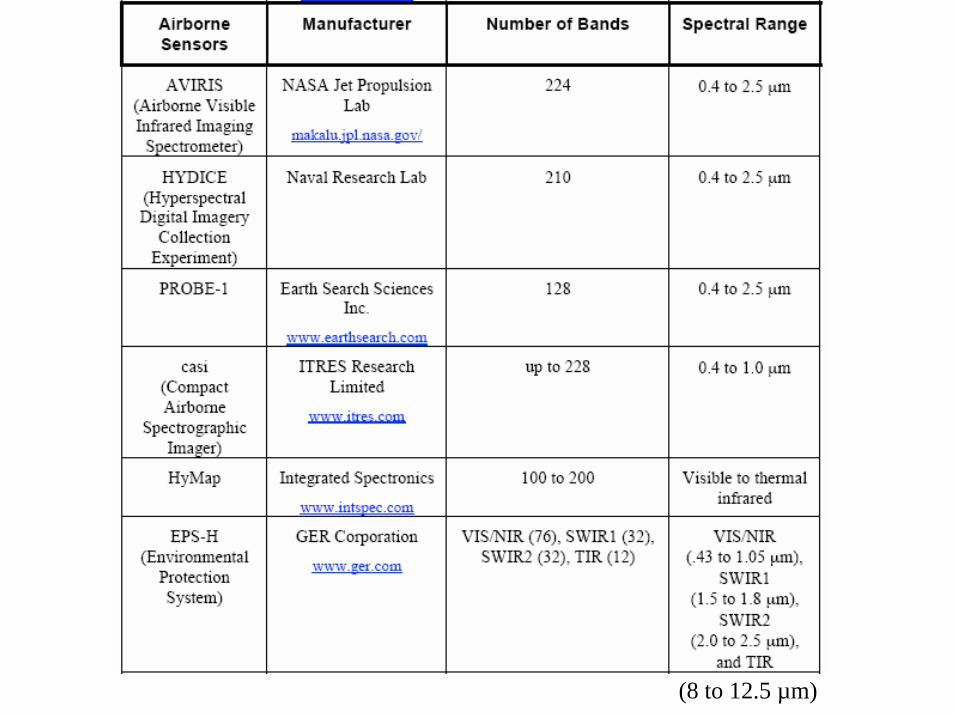
Summary table: current and recent hyderspectral sensors
ESA Mars ExpressOMEGA 351 0.35 to 5.12 µm
7 or 4 nm in 0.5-1.1 microns13 nm in 1.0-2.7 microns20 nm in 2.6-5.2 microns
Spectral resolution:
Spatial resolution: 300 m – 5 km
(8 to 12.5 µm)
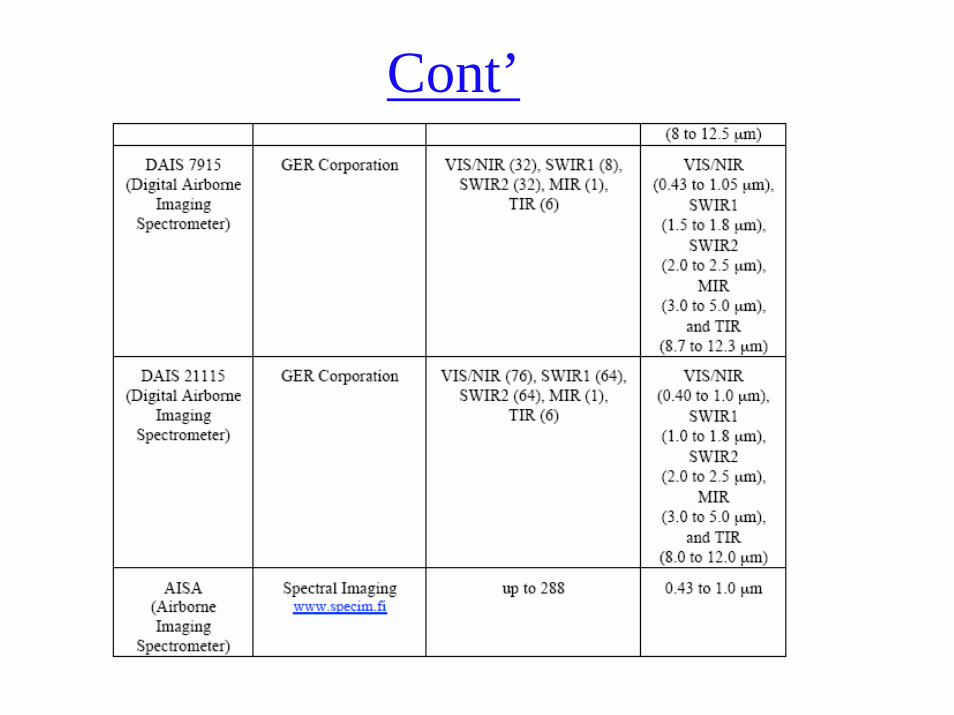
Cont’
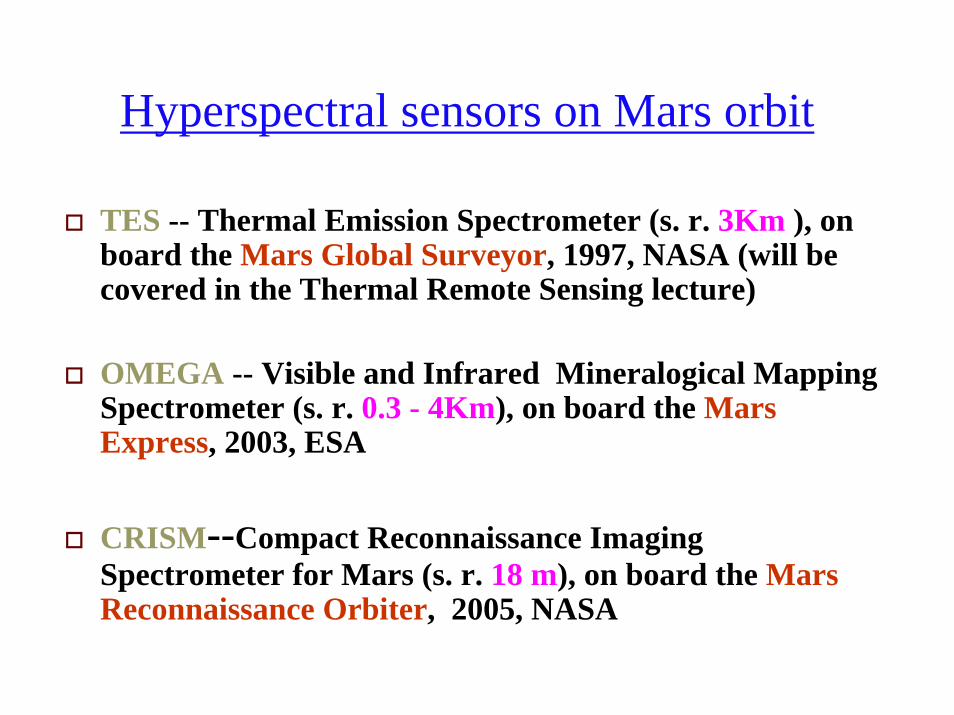
Hyperspectral sensors on Mars orbit
TES -- Thermal Emission Spectrometer (s. r. 3Km ), on board the Mars Global Surveyor, 1997, NASA (will be covered in the Thermal Remote Sensing lecture)
OMEGA -- Visible and Infrared Mineralogical Mapping Spectrometer (s. r. 0.3 - 4Km), on board the Mars Express, 2003, ESA
CRISM--Compact Reconnaissance Imaging Spectrometer for Mars (s. r. 18 m), on board the Mars Reconnaissance Orbiter, 2005, NASA

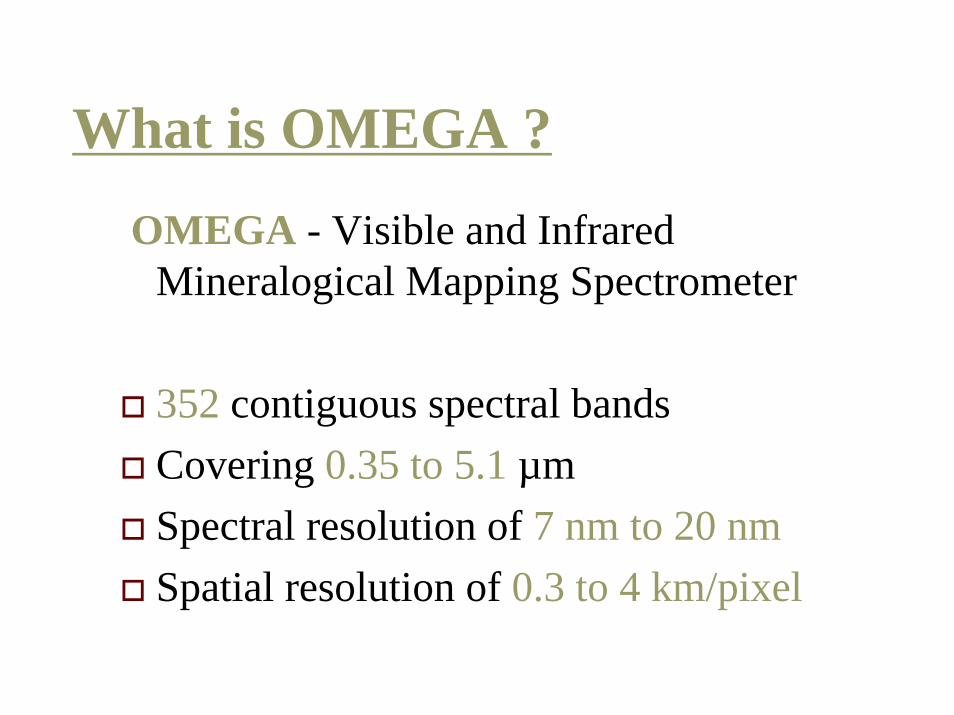
What is OMEGA ?
OMEGA - Visible and Infrared Mineralogical Mapping Spectrometer
352 contiguous spectral bands Covering 0.35 to 5.1 µm Spectral resolution of 7 nm to 20 nmSpatial resolution of 0.3 to 4 km/pixel

Surface mineralogy revealed by OMEGA
Mafic and ultramafic minerals (pyroxene and olivine)Surface CO2 and H2O ice and frosts Hydrated sulfates (gypsum, kieserite, and polyhydratedsulfates) on light-toned layered terrainsHydrated alteration phyllosilicates (nontronite, chamosite, and montmorillonite)Iron oxides and oxhydroxides (hematite and jarosite) related to liquid water processes
From: Bibring et al. 2005; Mustard et al., 2005; Poulet et al, 2005; Gendrin et al. 2005; Langevin et al, 2005; Arvidson et al, 2005; Combe et al, 2005. all in Science vol. 307
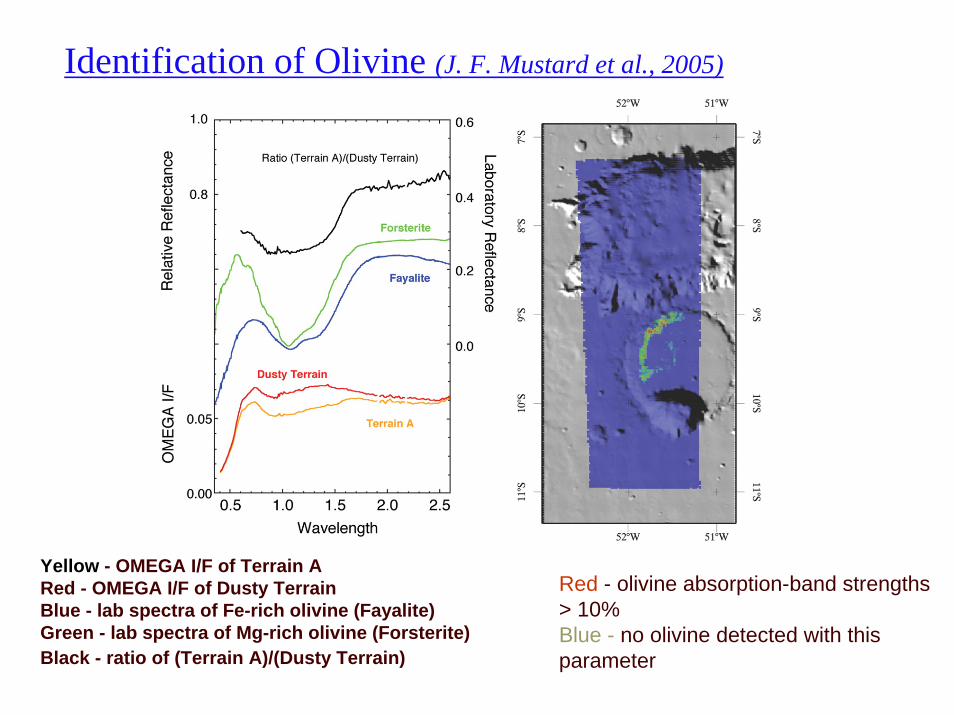
Identification of Olivine (J. F. Mustard et al., 2005)
Yellow - OMEGA I/F of Terrain A Red - OMEGA I/F of Dusty TerrainBlue - lab spectra of Fe-rich olivine (Fayalite) Green - lab spectra of Mg-rich olivine (Forsterite)Black - ratio of (Terrain A)/(Dusty Terrain)
Red - olivine absorption-band strengths > 10%Blue - no olivine detected with this parameter
http://crism.jhuapl.edu/