multi-source tools for assessing the users’ needs & perception on statistical quality. the...
TRANSCRIPT

Multi-source tools for assessing the users’ needs & perception on statistical quality.
The Spanish experience.
European Conference on Quality in Official Statistics (Q2014) Vienna, Austria 3-5 June 2014.
Agustín Cañada Luisa Muñoz
María González-de-ZuluetaQuality Unit
Spanish Statistical Office (INE)
(With the help of the Dissemination and Press departments of INE)
Multi-source tools for assessing users’ needs
1. Tools for assessing Users' views & needs: User Satisfaction Surveys
2. Other means for assessing users’ perceptions & needs.
3. Users' views& needs as an input to the INE's Statistical Plans.
[Final remarks: Future challenges]
Multi-source tools for assessing users’ needs
1. Tools for assessing Users' views & needs: User Satisfaction Surveys
2. Other means for assessing users’ perceptions & needs.
3. Users' views& needs as an input to the INE's Statistical Plans.
[Final remarks: Future challenges]
Users' views & needs in Statistical Offices: overview.
4
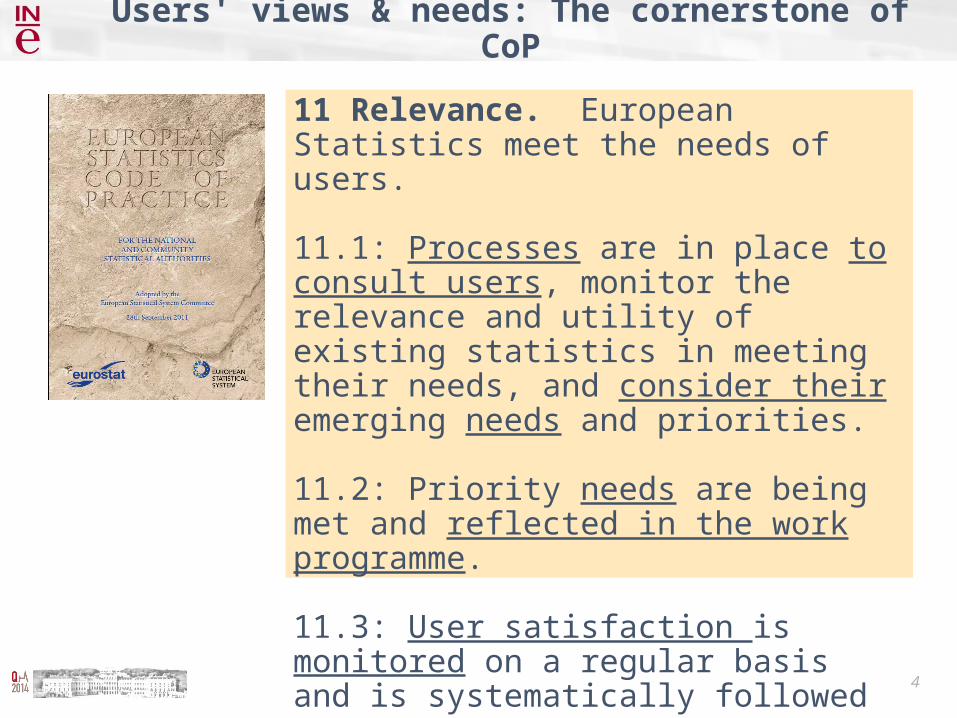
Users' views & needs: The cornerstone of CoP
11 Relevance. European Statistics meet the needs of users.
11.1: Processes are in place to consult users, monitor the relevance and utility of existing statistics in meeting their needs, and consider their emerging needs and priorities.
11.2: Priority needs are being met and reflected in the work programme.
11.3: User satisfaction is monitored on a regular basis and is systematically followed up.

5
The predominant role of the user in Quality management/ assurance frameworks, requires two types of elements:
2) Procedures to consider this user' information in the Statistical Office action plans.
1) Adequate methods and tools to assess needs and opinions from Users.
Users' views & needs: The cornerstone of CoP
6
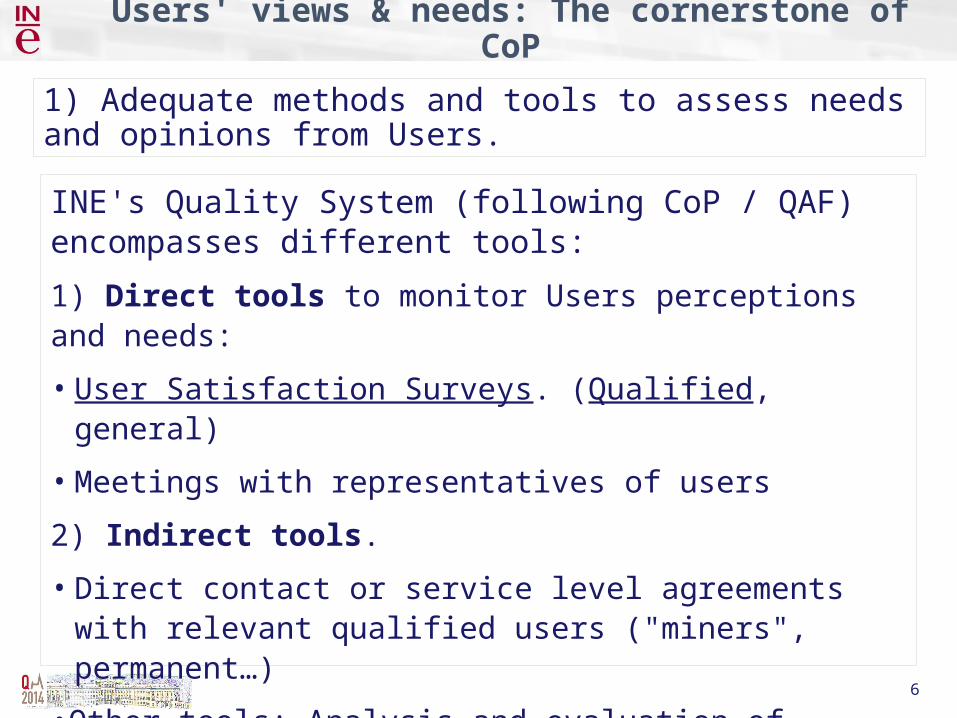
1) Adequate methods and tools to assess needs and opinions from Users.
Users' views & needs: The cornerstone of CoP
INE's Quality System (following CoP / QAF) encompasses different tools:
1) Direct tools to monitor Users perceptions and needs:
• User Satisfaction Surveys. (Qualified, general)
• Meetings with representatives of users
2) Indirect tools.
• Direct contact or service level agreements with relevant qualified users ("miners", permanent…)
•Other tools: Analysis and evaluation of downloads, etc.; INE's user support; media news evaluation

Multi-source tools for assessing users’ needs
1. Tools for assessing Users' views & needs: User Satisfaction Surveys
2. Other means for assessing users’ perceptions & needs.
3. Users' views& needs as an input to the INE's Statistical Plans.
[Final remarks: Future challenges].
8
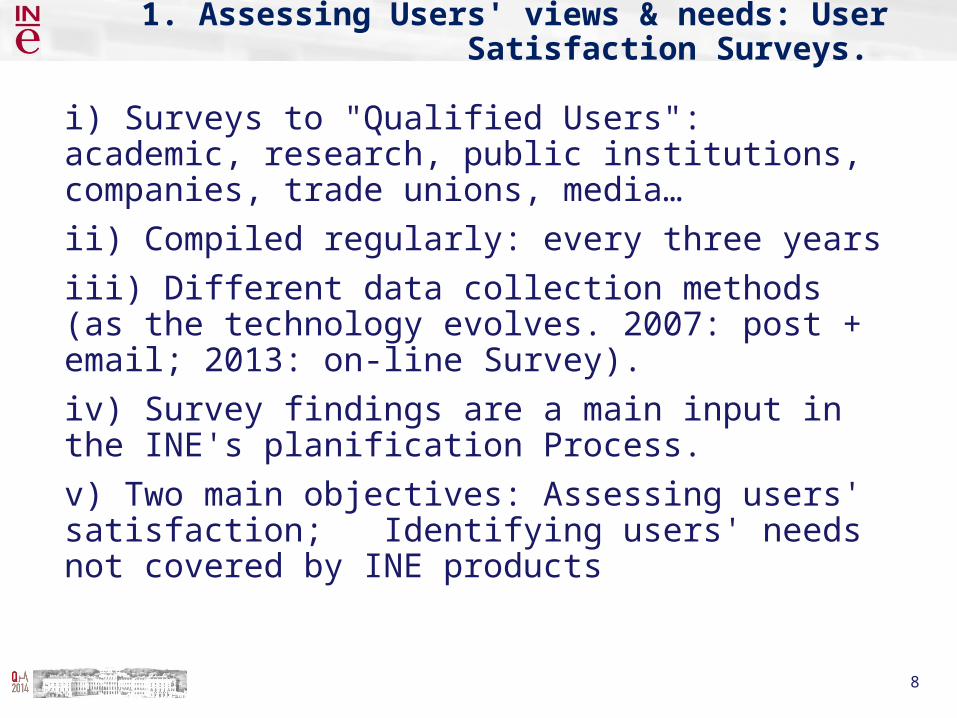
1. Assessing Users' views & needs: User Satisfaction Surveys.
i) Surveys to "Qualified Users": academic, research, public institutions, companies, trade unions, media… ii) Compiled regularly: every three yearsiii) Different data collection methods (as the technology evolves. 2007: post + email; 2013: on-line Survey). iv) Survey findings are a main input in the INE's planification Process.v) Two main objectives: Assessing users' satisfaction; Identifying users' needs not covered by INE products
9
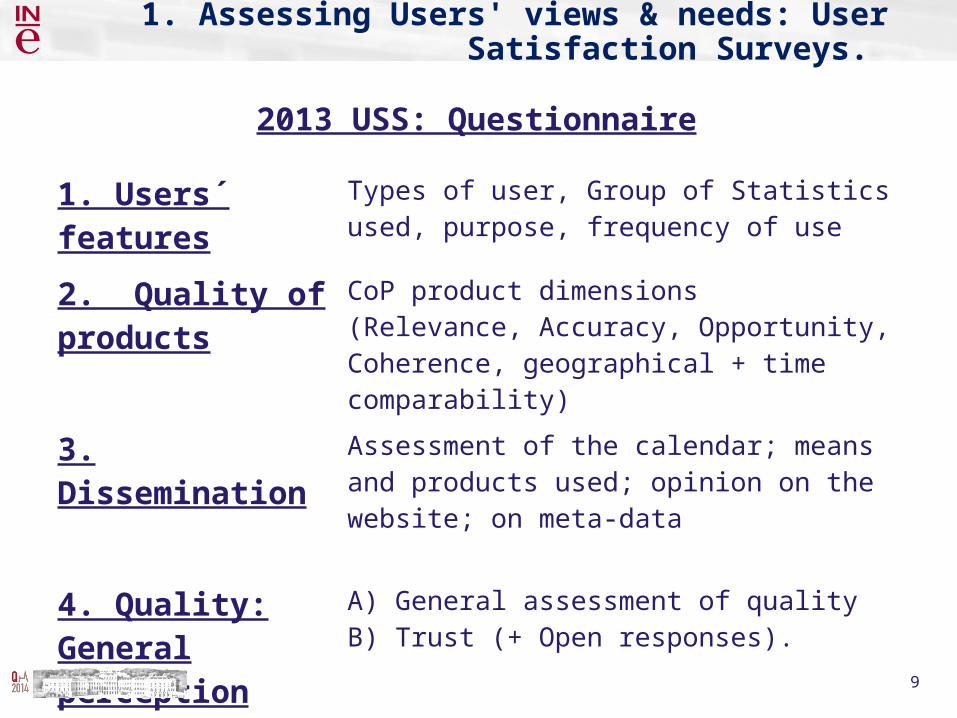
1. Assessing Users' views & needs: User Satisfaction Surveys.
2013 USS: Questionnaire
1. Users´ features Types of user, Group of Statistics used, purpose, frequency of use
2. Quality of products
CoP product dimensions (Relevance, Accuracy, Opportunity, Coherence, geographical + time comparability)
3. Dissemination Assessment of the calendar; means and products used; opinion on the website; on meta-data
4. Quality: General perception
A) General assessment of qualityB) Trust (+ Open responses).
5. User needs Question on Unmet needs (open responses)
10
0% 20% 40% 60% 80% 100%
1. Population
2. Social Statistics
3. Labour Market
4. CPI
5. EUSILC, HBS
6. National Accounts
7. Industry
8. Services
9. Agriculture
10. Science and technology
11. Environment
12.Others
TOTAL
+ + + 0 - - -
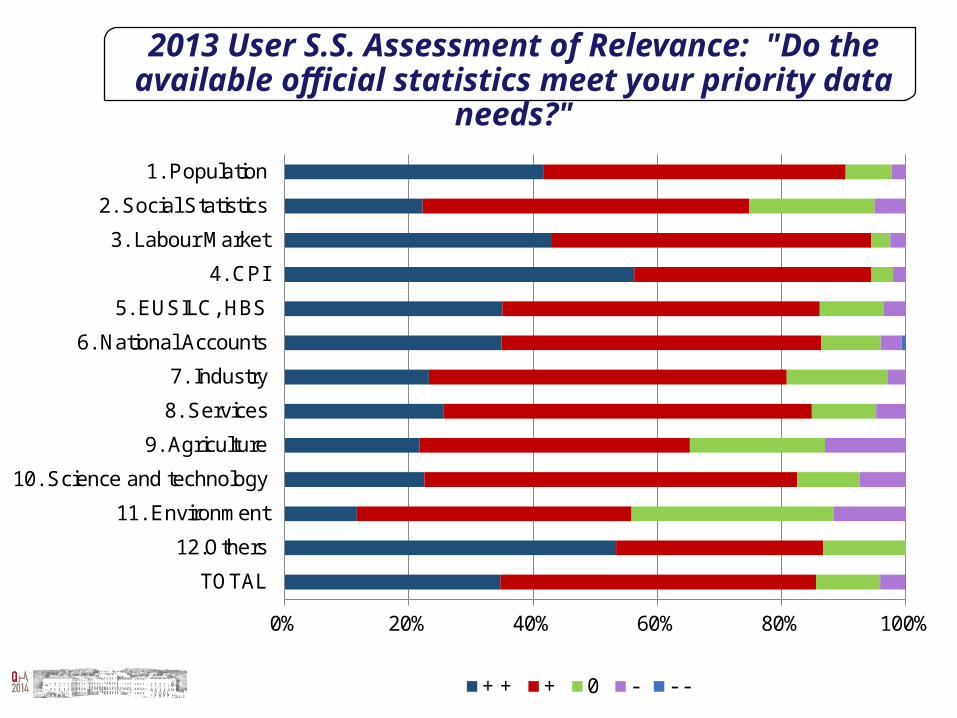
2013 User S.S. Assessment of Relevance: "Do the available official statistics meet your priority data needs?"
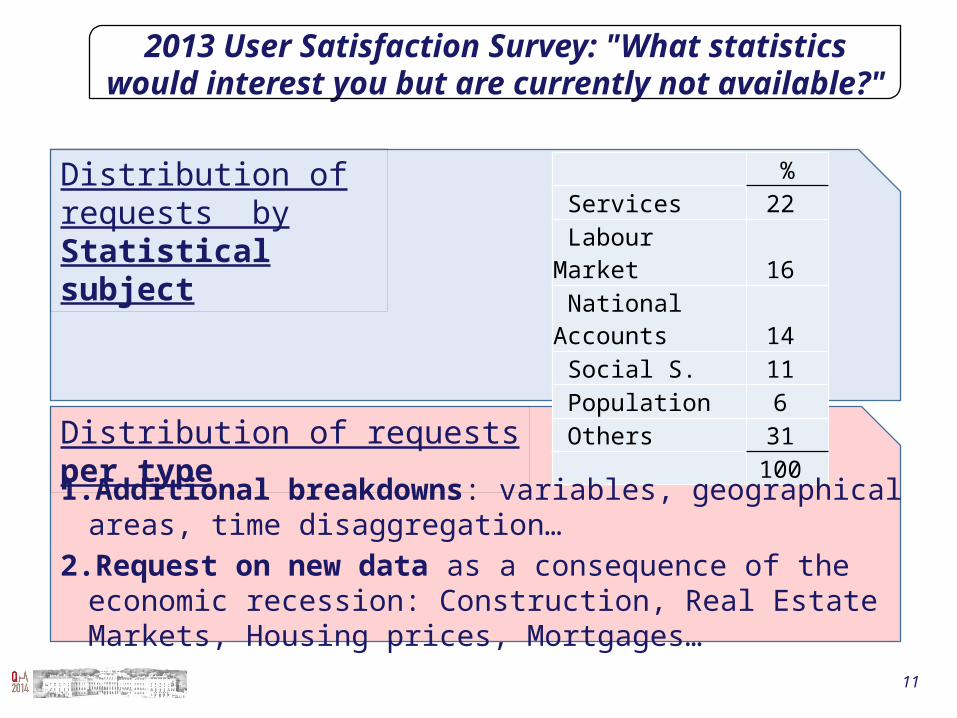
2013 User Satisfaction Survey: "What statistics would interest you but are currently not available?"
11
% Services 22 Labour Market 16 National Accounts 14 Social S. 11 Population 6 Others 31
100
1. Additional breakdowns: variables, geographical areas, time disaggregation…
2. Request on new data as a consequence of the economic recession: Construction, Real Estate Markets, Housing prices, Mortgages…
Distribution of requests by Statistical subject
Distribution of requests per type
Multi-source tools for assessing users’ needs
1. Tools for assessing Users' views & needs: User Satisfaction Surveys.
2. Other means for assessing users’ perceptions & needs.
3. Users' views& needs as an input to the INE's Statistical Plans.
[Final remarks: Future challenges].
13
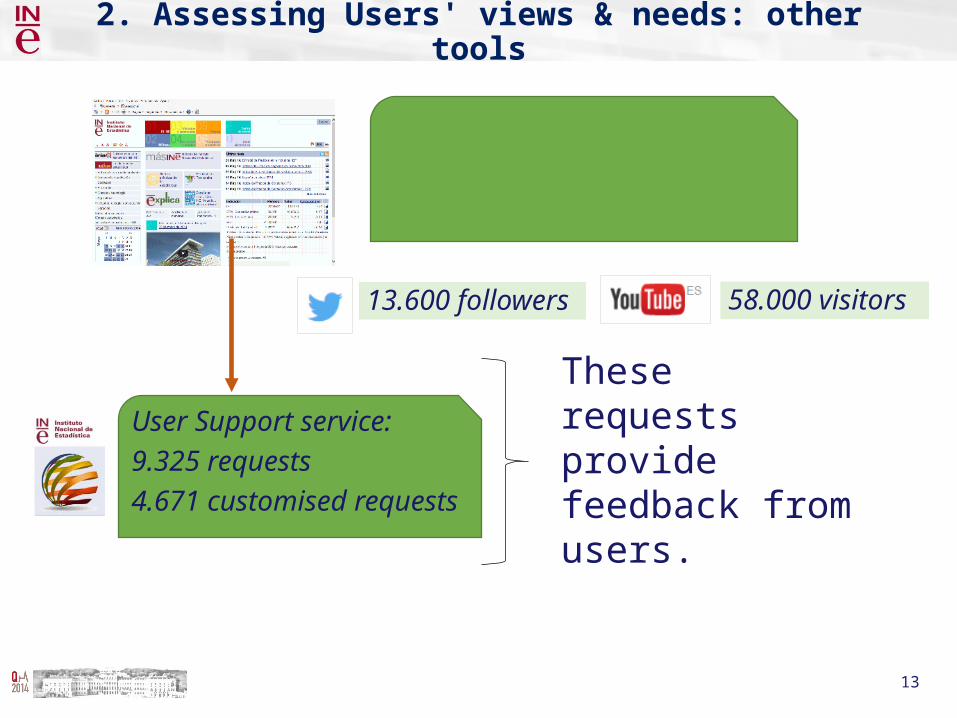
2. Assessing Users' views & needs: other tools
13.600 followers
2013: 10 million visits.150 m. pages.28 m. data consultations.17 m. applications requested
58.000 visitors
User Support service:
9.325 requests
4.671 customised requests
These requests provide feedback from users.

14
2. Assessing Users' views & needs: other tools
INE's impact on the media: conventional methodologies (through specialised companies) to measure audiences and the impact on the media.
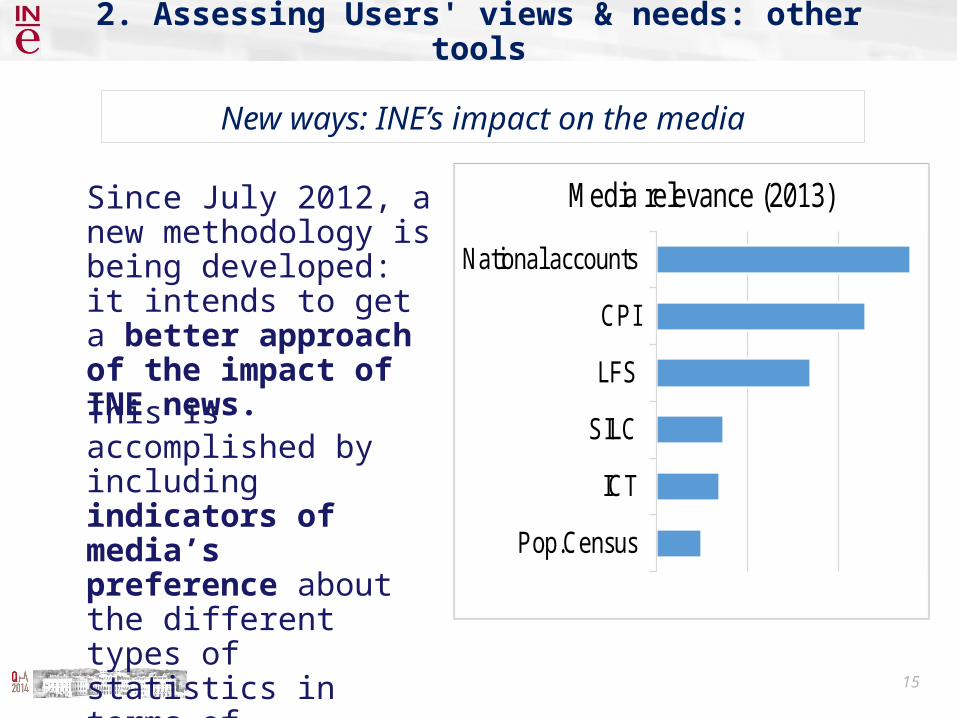
New ways: INE’s impact on the media
195,170Internet
28,122Press
1,515TV
1,851Radio
No. of INE news (2013)
15
New ways: INE’s impact on the media
National accounts
CPI
LFS
SILC
ICT
Pop.Census
Media relevance (2013)Since July 2012, a new methodology is being developed: it intends to get a better approach of the impact of INE news.
This is accomplished by including indicators of media’s preference about the different types of statistics in terms of visibility.
2. Assessing Users' views & needs: other tools
Multi-source tools for assessing users’ needs
1. Tools for assessing Users' views & needs: User Satisfaction Surveys.
2. Other means for assessing users’ perceptions & needs.
3. Users' views& needs as an input to the INE's Statistical Plans.
[Final remarks: Future challenges].
17
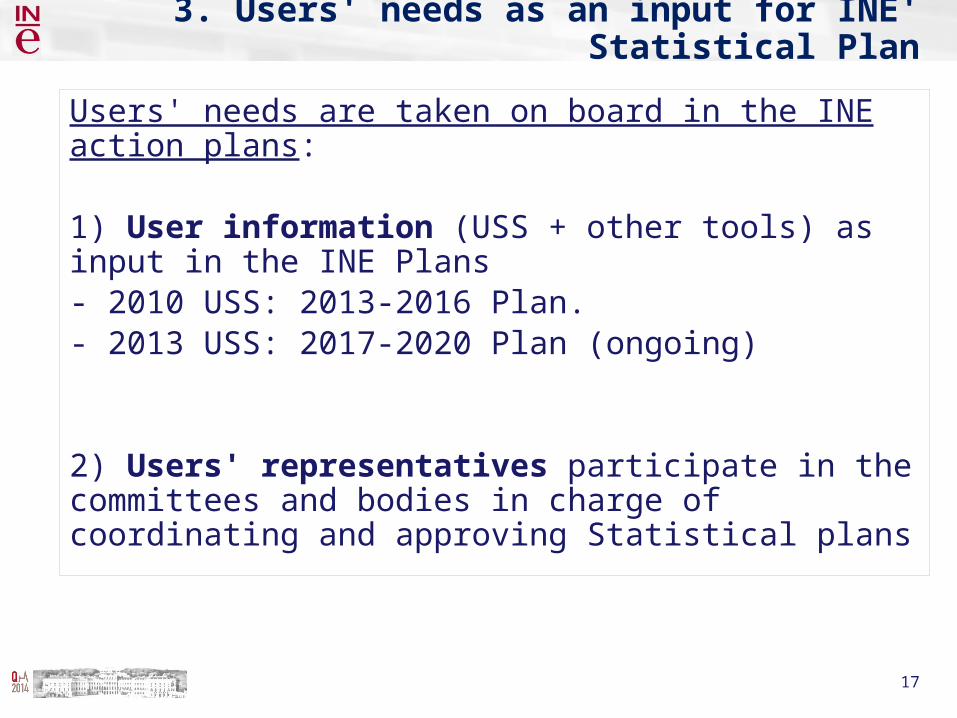
3. Users' needs as an input for INE' Statistical Plan
Users' needs are taken on board in the INE action plans:
1) User information (USS + other tools) as input in the INE Plans - 2010 USS: 2013-2016 Plan. - 2013 USS: 2017-2020 Plan (ongoing)
2) Users' representatives participate in the committees and bodies in charge of coordinating and approving Statistical plans

18
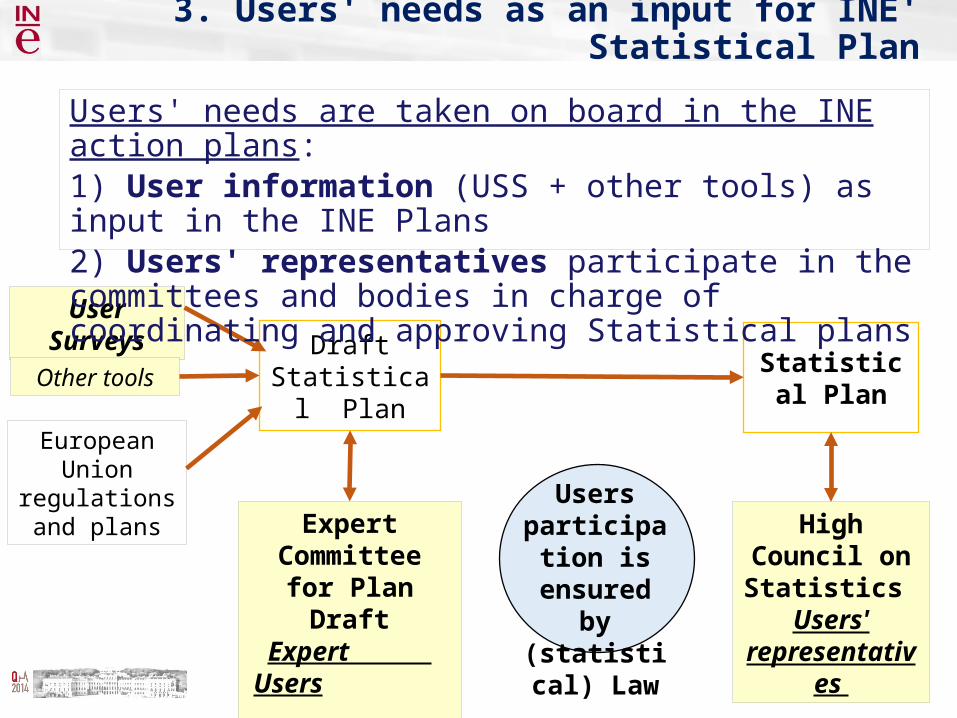
3. Users' needs as an input for INE' Statistical Plan
18
User Surveys
Other toolsDraft
Statistical PlanStatistical
Plan
European Union regulations and
plansHigh Council on
Statistics
Expert Committee for Plan Draft
Users' needs are taken on board in the INE action plans:1) User information (USS + other tools) as input in the INE Plans 2) Users' representatives participate in the committees and bodies in charge of coordinating and approving Statistical plans
19
3. Users' needs as an input for INE' Statistical Plan
19
User Surveys
Other toolsDraft
Statistical PlanStatistical
Plan
European Union regulations and
plansHigh Council on
Statistics Users'
representatives
Expert Committee for Plan DraftExpert Users
Users participation is ensured by
(statistical) Law
Users' needs are taken on board in the INE action plans:1) User information (USS + other tools) as input in the INE Plans 2) Users' representatives participate in the committees and bodies in charge of coordinating and approving Statistical plans
Multi-source tools for assessing users’ needs
1. Tools for assessing Users' views & needs: User Satisfaction Surveys.
2. Other means for assessing users’ perceptions & needs.
3. Users' views& needs as an input to the INE's Statistical Plans.
Final remarks: Future challenges.

21
4. Final remarks: some challenges in to the future
To summarise:• User’s point of view is a milestone in the INE policy. • We have developed a range of tools to assessing users
satisfaction and needs. Until now: a major role played by User S.S. (in the future: other tools)
• A set of legal/ administrative procedures to integrating users into statistical plans.
New challenges. Internet and other means: A revolution in dissemination of statistics… A trade-off: we are loosing direct contact with our Users,
Hence the need to continue exploring and making efforts to know the user’s views and needs; both, through conventional means (USS’s) but also exploring new ways and technologies.
User needs and perceptions
Thank you
Picture of INE´s main office in Madrid