multi-source deep learning for information trustworthiness
TRANSCRIPT

Multi-Source Deep Learning forInformation Trustworthiness Estimation
Liang Ge, Jing Gao, Xiaoyi Li, and Aidong ZhangComputer Science and Engineering Department
State University of New York at BuffaloBuffalo, 14260, USA
{liangge, jing, xiaoyili, azhang}@buffalo.edu
ABSTRACT
In recent years, information trustworthiness has become aserious issue when user-generated contents prevail in ourinformation world. In this paper, we investigate the im-portant problem of estimating information trustworthinessfrom the perspective of correlating and comparing multipledata sources. To a certain extent, the consistency degreeis an indicator of information reliability–Information unani-mously agreed by all the sources is more likely to be reliable.Based on this principle, we develop an effective computa-tional approach to identify consistent information from mul-tiple data sources. Particularly, we analyze vast amounts ofinformation collected from multiple review platforms (mul-tiple sources) in which people can rate and review the itemsthey have purchased. The major challenge is that differentplatforms attract diverse sets of users, and thus informationcannot be compared directly at the surface. However, latentreasons hidden in user ratings are mostly shared by multiplesources, and thus inconsistency about an item only appearswhen some source provides ratings deviating from the com-mon latent reasons. Therefore, we propose a novel two-stepprocedure to calculate information consistency degrees for aset of items which are rated by multiple sets of users on dif-ferent platforms. We first build a Multi-Source Deep BeliefNetwork (MSDBN) to identify the common reasons hiddenin multi-source rating data, and then calculate a consistencyscore for each item by comparing individual sources with thereconstructed data derived from the latent reasons. We con-duct experiments on real user ratings collected from Orbitz,Priceline and TripAdvisor on all the hotels in Las Vegas andNew York City. Experimental results demonstrate that theproposed approach successfully finds the hotels that receiveinconsistent, and possibly unreliable, ratings.
Categories and Subject Descriptors
H.4 [Information Systems Applications]: Algorithms
Permission to make digital or hard copies of all or part of this work for personal orclassroom use is granted without fee provided that copies are not made or distributedfor profit or commercial advantage and that copies bear this notice and the full cita-tion on the first page. Copyrights for components of this work owned by others thanACM must be honored. Abstracting with credit is permitted. To copy otherwise, or re-publish, to post on servers or to redistribute to lists, requires prior specific permissionand/or a fee. Request permissions from [email protected], August 11–14, 2013, Chicago, Illinois, USA.Copyright 2013 ACM 978-1-4503-2174-7/13/08.
Keywords
Deep Learning, Multiple-Source, Information Trustworthi-ness
1 INTRODUCTION
With the booming of Internet applications and mobile de-vices, it is now much easier for people to access, create andpublish contents than ever before, which leads to great in-formation exposure for almost everyone in the world. Sinceeveryone is able to generate contents online, as the side ef-fect of freedom of speech, information trustworthiness hasbecome a serious problem for many applications includingEbay [16], Twitter [10] and Amazon [7,12]. One of the fun-damental difficulties in analyzing user-generated data is thatinformation is massive, yet can be noisy, incorrect and mis-leading. It is hard to infer reliable knowledge from massivedata with low data quality, and there exists no universaloracle that can tell us which information source is reliableand which piece of information is trustworthy. Therefore,we seek to infer information trustworthiness from the databy cross checking multiple data sources. Trustworthiness ofcontents cannot be inferred purely based on its informationalone, but rather by exploring consensus and commonalitiesin multiple sources simultaneously. A piece of informationis more likely to be reliable if it is supported by many inde-pendent sources while high inconsistency across sources maysuggest potentially unreliable information. In this paper,we propose to infer the consistency degree of informationacross multiple sources as an effective indicator for informa-tion trustworthiness.
Applications. Information trustworthiness is an impor-tant issue for numerous applications, but in this paper, weparticularly focus on online recommendation systems, whichtypically involve overwhelming amounts of user-generateddata. Nowadays, there are many places where people canleave their opinions for their experiences with products orservices, in the form of ratings and reviews. Those ratingsand reviews exert great influence on people before they maketheir decisions about their potential purchases. In fact, moreand more people rely on such websites (e.g., Yelp) to findan apartment, book a hotel and reserve a table in a restau-rant, etc. However, people are bothered by the existence ofunreliable and misleading information especially when thereexist fake reviews or ratings posted by spammers. Althoughsome endeavors have been made to detect and prevent spamreviews and ratings [7, 9, 12, 13], people are still strugglingwith untruthful information.
In reality, people will check multiple websites for unbiasedopinions before they make decisions because they are fully

aware of the biases and noises embedded in a single source.Intuitively, consensus opinions across multiple sources aboutan item should be valued more, but high discrepancy mayindicate that the information is suspicious. However, thehuge volume of data makes the task of manually checkingmultiple review websites time-consuming and sometimes im-possible. Motivated by this observation, we propose to de-velop an effective and efficient approach to compare multiplesources of information about the same item and calculate aconsistency score for each item to assist users in decisionmaking. In this paper, we focus on identifying consistentinformation from user rating matrices collected from multi-ple platforms. The framework can be extended in the futureto incorporate other information, such as user profiles andreview comments.
Challenges. One major challenge in consistency degreecomputation is that different platforms attract different setsof users. It is impossible to simply compare ratings at theuser level because users may leave ratings only at one place.Even if there are overlapping users, we are unable to alignthem due to the lack of users’ information. On the otherhand, comparing rating statistics or summary obtained byaggregating ratings in individual sources can also be prob-lematic because users have quite diverse tastes and prefer-ences. As users with different backgrounds all contributeto the ratings and reviews, the difference between the rat-ing summaries of multiple sources could well reflect userpreference diversity rather than information inconsistency.To accurately estimate consistency degrees, we must iden-tify subtle commonalities shared among sources embeddedin multiple rating matrices.
Observations. In regard to the challenges discussed above,we have the following observations that shed some lights onthe problem.
• Many latent reasons contribute to the ratings thatusers gave. For example, many possible ways can beenumerated to explain the ratings of hotels, which in-clude the purpose of the trip, type of the users (e.g.family travelers or solo travelers), services of the hotel,price, view and location of the hotel. Moreover, we no-tice that those latent reasons can be grouped into sev-eral categories, such as reasons about the traveler(s),reasons about the hotel and reasons about the location.Clearly, there exists a hierarchical latent structure un-derlying the ratings data that corresponds to variousreasons leading to users’ decisions.
• Looking at multiple sources simultaneously, we canfind that users’ latent rating behavior is consistenteven though users are different across platforms. Atthe surface, ratings collected from different sourcescan have different rating scales and have diverse dis-tributions; each source may have its own bias; andspammers may contaminate some of the entries. De-spite all these facts, the latent reasons that accountfor majority of the users’ ratings are consistent acrosssources. Based on this consensus principle, we are ableto compute a consistency degree for each item indi-cating the chance this item receives consistent ratingsacross sources.
Summary. These observations motivate us to proposea novel two-step procedure to estimate information consis-tency across multiple sources given multiple rating matricescollected from different platforms. The key idea is to connectmultiple sources by learning their shared latent hierarchy of
rating reasons and then compare multiple sources at the la-tent reason layer to obtain the consistency scores. First, wedevelop a Multi-Source Deep Belief Network (MSDBN) tolearn a joint model that represents the common hidden rea-sons underlying the observed ratings across sources. Sincethe latent space for each source forms a hierarchical struc-ture, a deep network can be used to extract latent structurefrom each source. We connect multiple sources by linkingthe deep network structures through a joint consensus layerwhich represents the common hidden reasons embedded inmultiple data sources. At the second step, we reconstructlatent representations for each source from the joint repre-sentation of multiple sources. The reconstructed data sim-ulates users’ rating behavior in each source if the sourcefollows the common latent reasons. By comparing recon-structed data based on common reasons and each source’sown representation, we can successfully derive informationconsistency for each item, which can be further used to sug-gest the trustworthiness of an item’s information. Note thatour work differs from existing deep learning approaches inthat we develop an approach to compute information consis-tency across multiple sources while existing work focuses onsingle data source and targets at different problems (classifi-cation, clustering, etc.). To demonstrate the effectiveness ofthe proposed approach, we crawled real ratings of hotels intwo big cities from three travel websites: Orbitz, Pricelineand TripAdvisor. Experimental results on this multi-sourcedata set show that the proposed method provides veraciousestimation of information consistency to help users identifytrustable information from massive, conflicting and biaseddata. We also design experiments on synthetic data to per-form a thorough quantitative analysis illustrating the strongabilities of the proposed approach in distinguishing consis-tent from inconsistent information.
To sum up, the contributions of this paper are:
• We investigate the problem of information trustworthi-ness from the novel perspective of exploring multiplesources’ information consistency degree. The proposedmethod simulates the natural intuition that more con-sistent information stated by many sources is morelikely to be trustworthy.
• We propose an unsupervised Multi-Source Deep Be-lief Network to learn a joint model across sources tocapture the consensus rating behavior in multi-sourcerating data. Based on the joint structure, we developan effective approach to evaluate information consis-tency by comparing original and reconstructed data.
• Experimental results on both real and synthetic datasets show that the proposed approach is able to dis-cover common rating behavior shared by multiple sources,derive each item’s information consistency, and thusoutput meaningful alerts for inconsistent and unreli-able information.
2 METHODOLOGY
In this section, we present the details of the proposed method.We first present the description of the problem formulationin Section 2.1. Section 2.2 discusses how to represent the la-tent reasons for a single source. The two-step procedure ofinformation trustworthiness estimation is presented in Sec-tions 2.3 and 2.4. The first step is to train a Multi-SourceDeep Belief Network (MSDBN) so that the common latentreasons across sources are captured. The consistency score is

V1 N1
K
……
NS
K R R
Step 1 Multi-Source Deep Belief
Networks
Step 2 Consistency Score
Calculation
……
User Ratings
MSDBN Consistency Scores
VS DBN
DBN
Joint Representation
Reconst-ructed
Data
Reconst-ructed
Data
……
Reconstruct Data
Figure 1: Flow of the Proposed Method
calculated accordingly in the second step. We discuss somepractical issues of training MSDBN in Section 2.5.
2.1 Problem Formulation
Suppose we are interested in K items (each item could bea hotel, a book, a restaurant or any entity of interests).There are S sources that we can obtain ratings about theK items. The s-th source is characterized by a rating ma-trix Vs, which denotes ratings of K items from Ns users.Note that the users are differen across sources. The goalis to derive a consistency score vector R, where each entryrk denotes the consistency score of the k-th item. The gen-eral intuition is that an item will receive high score if itsratings are consistent across multiple sources. The consis-tency score denotes our recognition that information unan-imously agreed by all the sources is most likely to be re-liable. Due to noise, sparsity and alignment issues, it isimpossible to determine the consistency of items by directlycomparing their ratings. However, latent reasons hidden inuser ratings are mostly shared by multiple sources and in-consistency about an item can only be revealed when somesource provides ratings deviating from the common latentreasons. Therefore, we propose a Multi-Source Deep BeliefNetwork to extract common reasons underlying the observedrating matrices V1,...,Vs. The trained MSDBN is used to re-construct data for each source and the reconstructed datasimulate the ratings following the common latent reasons.The consistency score for each item can thus be obtainedby calculating the similarity between the original data andthe reconstructed data across multiple sources. The flow ofthe proposed method is shown in Figure 1. Table 1 lists thenotation used throughout this paper.
Table 1: Notation
Symbol DefinitionK number of itemsS number of sourcesVs rating matrix for s-th sourceNs number of users in s-th sourceU weight matrix for source 1 in Sec. 2.3V weight matrix for source 2 in Sec. 2.3b bias for source 1 in Sec. 2.3c bias for source 2 in Sec. 2.3a bias for the top layer in Sec. 2.3ϵ learning rate for MSDBN
h(n)s the n-th layer for s-th sourcevs visible units for s-th source
dskdsk denotes the distance between original dataand reconstructed data of k-th item in s-source
v"
h"
RBM" W"
(a) RBM
h(1)%
h(2)%
RBM%
v%
W(1)%
(b) DBN
Figure 2: A Restricted Boltzmann Machine and A 2-Layer DeepBelief Network for Each Source
2.2 Single Source Representation
As we discussed in Section 1, there are many possible latentreasons to explain users’ rating behavior. Therefore, given arating matrix Vs for s-th source, how to represent the latentreasons underlying Vs is our first problem.
A common approach to represent the latent reasons is us-ing clustering techniques [2,3,21] where Vs is modeled by theproduct of matrix PNs×C and QC×K . Such model performsclustering on the input space where P is the clustering indi-cation matrix and Q is the cluster level feature (C clustersare obtained). Users in the same cluster in P share simi-larity in terms of their rating behavior, and the aggregatedrating of the cluster is captured by Q. One limitation of theclustering techniques is that it usually forms a coarse rep-resentation of the latent reasons. Users in the same clusterare similar because of combinations of several latent reasons.For example, the reason that users belong to the same clus-ter may be because they are all family travelers who likebargain hotels and free wifi. Increasing the number of clus-ters doesn’t usually get a finer representation, because it willusually create a lot of trivial clusters with very few users inthem.
To have a finer representation of latent reasons for a sin-gle source, we propose to use Restricted Boltzmann Machine(RBM). RBM is an undirected graphical model with visibleunits v and stochastic binary hidden units h. The visibleunits v denote the observed data (in our case, Vs) and thehidden units h denote the latent reasons that generate theobserved data. There are symmetrically weighted connec-tions W between each visible unit and each hidden unit.There is no connections between visible units and betweenhidden units. Therefore, RBM forms a bipartite graph be-tween visible and hidden units as illustrated in Figure 2 (a).
The probability distribution of RBM is as follows:
p(v, h) =1
Ze−E(v,h),
where the partition function Z is given by summing over allpossible pairs of visible and hidden vectors: Z =
∑v,h e−E(v,h).
The energy function of visible and hidden units is
E(v, h) = −∑
i∈visible
bivi −∑
j∈hidden
ajhj −∑i,j
vihjwij , (1)
where ai, bj are biases for hidden and visible units and wij
is the weight between them. The purpose of RBM is to finda configuration of (v, h) so that the energy function achievesits lowest level.
Since RBM takes the shape of a bipartite graph, with nodirect connections between hidden units and between visi-ble units, the hidden units are mutually independent given

Algorithm 1 MSDBN Training Algorithm For TwoSources
Input: Input for each source M1 and M2, learning rate ϵOutput: Weight matrices of two sources–U and V , biases of twosources–b and c, top layer bias a
1: Randomly initialize U , V , a, b and c2: repeat3: repeat4: pick up a sample x1 from M1 and sample x2 from M2
5: for all hidden units i do6: compute P (h1i = 1|x1, x2) using Eq. 87: sample h1i from P (h1i|x1, x2)8: end for9: for all visible units j in source 1 do
10: compute P (x(1)2j = 1|h1) using Eq. 6
11: sample x(1)2j from P (x
(1)2j |h1)
12: end for13: for all visible units j in source 2 do
14: compute P (x(2)2j = 1|h1) using Eq. 7
15: sample x(2)2j from P (x
(2)2j |h1)
16: end for17: for all hidden units i do18: compute P (h2i = 1|x(1)
2 , x(2)2 ) using Eq. 8
19: end for20: until for all samples in M1 and M2
21: U ← U + ϵ(h1x′1 − P (h2 = 1|x(1)
2 )x(1)′2 )
22: V ← V + ϵ(h1x′2 − P (h2 = 1|x(2)
2 )x(2)′2 )
23: a← a + ϵ(h1 − P (h2 = 1|x(1)2 , x
(2)2 ))
24: b← b + ϵ(x(1)1 − x
(1)2 )
25: c← c + ϵ(x(2)1 − x
(2)2 )
26: until all parameters are converged27: return U , V , a, b and c
the visible units and vice versa. The individual activationprobabilities of a hidden and a visible unit are given by
P (hj = 1|v) = σ(bj +∑i
viwij), (2)
P (vi = 1|h) = σ(ai +∑j
hjwij), (3)
where σ denotes the logistic sigmoid function. ConsideringEq. 2, suppose hj is one latent reason for ratings in Vs (e.g.,price), the activation probability P (hj = 1|v) shows how“important” this reason is given the observed data. Givenmany hidden units (e.g., 500) that represent the latent rea-sons, the learning of RBM could be understood as tuning upthe importance of all latent reasons given the observed dataset so that the hidden units could get close to the true latentreasons as much as possible. For RBM, exact maximum like-lihood learning is intractable. In practice, efficient learningis performed using Contrastive Divergence (CD) [4].
The advantage of RBM is that it discovers a richer repre-sentation of the input data than clustering techniques. Eachhidden unit in RBM creates a 2-region partition of the inputspace and n hidden units can represent up to 2n differentregions in input space. This indicates that given L latentreasons in input space, clustering techniques will take L pa-rameters (e.g., number of clusters) to capture that many rea-sons, RBM only need log2(L) hidden units. Since there aremany possible latent reasons underlying Vs for s-th source,we choose RBM instead of clustering techniques to representeach single source.
RBM can represent many possible underlying reasons ofeach source, such as reasons about hotels and reasons aboutlocation as we discussed in Section 1. Within each typeof reasons, there exist many reasons about the detailed as-pects. For example, one may choose a hotel due to its room
h(1)%
h(2)%
RBM%
v%
W(1)%
h(1)%
h(2)%
RBM%
v%
W(1)%
Source%1% Source%2%
Joint%Representa9on%
h%
U% V%
Figure 3: Multi-Source Deep Belief Network
service, staff quality, or internet services. We can go evenfurther down the hierarchy for more detailed reasons thatcontribute to users’ ratings. Therefore, these reasons forma hierarchical structure, and we can thus add more layersinto RBM to form a Deep Belief Network (DBN) to repre-sent such complicated latent reasons. A DBN with l layersmodels the joint distribution between observed variables vand l hidden layers h(k), k = 1, ..., l as follows:
p(v, h(1), ..., h(l)) = P (v|h(1))...P (h(l−2)|h(l−1))p(h(l−1), h(l)),(4)
Denoting b(k) the bias vector of layer k and W (k) the weightmatrix between layer k and k + 1, we have
P (h(k)|h(k+1)) = ΠiP (h(k)i |h(k+1)),
P (h(k)i = 1|h(k+1)) = σ(b
(k)i +
∑j
W(k)ij h
(k+1)j ).
A two-layer DBN is shown in Figure 2 (b). The training ofDBN follows a greedy layer-wise CD strategy [4].
2.3 Multi-Source Deep Belief Network
Although we extract latent reasons of each source usingDBN, we can’t obtain the consensus reasons by directly com-paring them because 1) The latent reasons of each sourcemay contain their source-specific bias, making them hardlycomparable across sources. 2) For the common latent rea-sons each source contain, they are not properly aligned.Therefore, to find the common latent reasons across sources,we propose the Multi-Source Deep Belief Network (MSDBN).
We illustrate the construction of a MSDBN using twosources as a running sample. Note that it can be easilyextended to accept inputs from multiple sources. Considermodeling each source using a two-layer DBN. The energyfunction P (v, h(1), h(2)) is given by Eq. 4. To form a MS-DBN, we combine the two DBNs by adding an additionallayer of binary hidden units on top of them. The resultinggraphical model is shown in Figure 3. The joint distributionover the multiple sources can be written as:
P (v1, v2, h) = P (h(2)1 , h
(2)2 , h)P (v1, h
(1)1 , h
(2)1 )P (v2, h
(1)2 , h
(2)2 ),
where P (h(2)1 , h
(2)2 , h) can be written as follows:
P (h(2)1 , h
(2)2 , h) ∝ exp(
∑i
aih(2)1i +
∑j
bjh(2)2j +
∑k
ckhk
+∑i,k
h(2)1i Uikhk +
∑jk
h(2)2j Vjkhk),
(5)
where U and V are the weight matrix connecting the tophidden layer of DBN for each source. a, b and c are the cor-responding bias vectors. Given the MSDBN, the conditional

A B C0
0.51
A B C0.350.40.45
2
A B C0.4
0.45
0.53
A B C0.350.40.45
4
A B C0
0.55
A B C0
0.56
A B C0
0.57
A B C0
0.58
A B C0
0.59
A B C0
0.510
A B C0
0.511
A B C0
0.512
A B C0.460.480.5
13
A B C0
0.5
114
A B C0
0.515
A B C0.46
0.48
0.516
A B C0
0.517
A B C0
0.518
A B C0
0.519
A B C0
0.520
Figure 4: The distance between original data and reconstructed data across three sources for 20 hotels in Las Vegas. X axis denotesthe three sources with A: Orbitz, B: Priceline and C: TripAdvisor. Y axis denotes the distance between original data and reconstructeddata. The majority of hotels exhibit a similar shape.
distribution is derived as follows:
P (h(2)1 |h) = σ(a+
∑i
hiUi), (6)
P (h(2)2 |h) = σ(b+
∑i
hiVi), (7)
P (h|h(2)1 , h
(2)2 ) = σ(c+
∑i
Uih(2)1i +
∑j
Vjh(2)2j ), (8)
where σ is logistic sigmoid function. The learning of MS-DBN is to tune up the top hidden layer h (Eq. 8) so thatit can better generate the input sources (Eq. 6 and Eq. 7).In this way, MSDBN tries to find the shared latent reasonsthat underly multiple sources.
The training of MSDBN using two sources is shown in Al-gorithm 1. In Algorithm 1, lines 5 to 19 prepares ingredientsfor CD [4]. Specifically, lines 5 to 8 compute the activationprobability of hidden units of MSDBN based on two inputsources; lines 9 to 16 reconstruct source 1 and 2 based onhidden units; and lines 17 to 19 calculate the activation prob-ability of hidden units based on two reconstructed sources.Lines 21 to 25 update parameters U, V, a, b, c accordingly.The algorithm stops when all parameters are converged.
2.4 Consistency Score Calculation
At the first step, we obtain the consensus latent reasons un-derlying multiple sources. Consequently, at the second step,based on the learned consensus hidden reasons, we estimatethe information trustworthiness by calculating a consistencyscore for each item. The higher the score, the more consis-tently the item behaves across multiple sources, the morelikely that the information about the item is reliable.
Once the MSDBN is trained, we have the top layer of hid-den units that represents the consensus reasons. Next, wereconstruct each source using Eq. 6 and Eq. 7. The recon-
structed data are sampled from P (h(2)1 |h) and can be viewed
as the data generated from the consensus reasons in eachsource. Therefore, for a given source s and item i, we haveits original data and its reconstructed data. We calculatetheir distance using Root Mean Square Error (RMSE) toform a matrix D of size S×K where dsk represents the dis-tance between original data and reconstructed data of itemk on source s.
Ideally, if an item behaves consistently across sources,the distance between its reconstructed data and its origi-nal data should be small since both of them are driven bythe same consensus reasons. However, the reconstruction ofeach source by MSDBN is not perfect, i.e., there is recon-struction error for each source. The existence of reconstruc-tion error for each source severely prohibits us to simplymeasure consistency scores using distance aggregated uponmultiple sources. An item that has a large overall distancebetween original and reconstructed data doesn’t necessarilymean that the information it receives is inconsistent.
To tackle this challenge, we will examine the distance ma-trix D to find the consensus patterns as a basis for con-sistency score computation because majority of the itemsreceive consistent user ratings across sources. Figure 4 plotsthe distance between the original data and reconstructeddata for 20 hotels in Las Vegas from three sources: Orbitz,Priceline and TripAdvisor. As we can see, for the majority ofitems, the distance between original data and reconstructeddata follows a similar shape. This shape has close relationswith reconstruction error of each source, which can be seenas the reflection of the bias of each source in terms of theconsensus latent reasons. For items that have a differentshape than that of the majority items (e.g., items 3 and13), we believe it is highly possible that some inconsistencyresides among them.
Since the majority of items are consistent, we thus derivethe Consistency Score rk of each item k by following:
p = median(D, 2), (9)
rk = Similarity(D(:, k), p), (10)
where Eq. 9 takes the median of each column in D, andthus p stands for the distance between original data andreconstructed data for the majority of consistent items. Theconsistency score rk for each item k is consequently obtainedby calculating the similarity between each row of D with p.In this work, we use Pearson Correlation as the similaritymeasure as it focuses on the shape similarity rather thanthe absolute distance. The lower the score, the further theitem is away from consistent items, which indicates a higherpossibility that the item receives inconsistent information.

20 40 60 80 100 1200
0.5
1
1.5
2
Hotels in Las Vegas
Inco
nsis
tent
Sco
re
MSDBN
Figure 5: Inconsistent Score Distribution of Hotels in Las Vegas
Since the major part of the proposed method lies in theconstruction of Multi-Source Deep Belief Network, we nameour method MSDBN.
2.5 Practical Issues
In MSDBN, DBN for each source has binary visible unitsyet the rating matrix is count data whose range is from 0to N . As suggested in [18], one simple and effective wayis to make N copies of binary visible units and give themall the same weights and biases. Using this weight-sharingto synthesize count data out of binary units will keep themathematics underlying binary-binary DBN unchanged.
MSDBN accepts inputs from DBN of each source. TheDBN of each source could contain several layers of hiddenunits. The number of layers and the number of hidden unitsare strongly related to the representational power of MS-DBN. Increasing the number of layers can also reduce thenumber of parameters used in the model. However, there isa trade-off between the performance and time of training interms of the hidden number of units and the number of lay-ers. In this work, we maintain the number of layers of DBNfor each source to be 2 and the number of hidden units onthe top layer of MSDBN to be 500.
There are some issues involved in training MSDBN in Al-gorithm 1 including choosing the learning rate ϵ, initializa-tion of the weights and biases and stopping criteria. A de-tailed guide on these issues can be found in [5].
Table 2: Hotel Rating Data Sets: Las Vegas
Features Orbitz Priceline TripAdvisor#. of Users 34,735 2,530 100,037
Avg. Hotel Rate #. 1407.4 423.5 3506.7Avg. User Rate #. 5.3 21.9 4.5Avg. Hotel Rate 3.6 3.7 3.8Rate Variance 1.3 3.6 1.4
Table 3: Hotel Rating Data Sets: New York City
Features Orbitz Priceline TripAdvisor#. of Users 10,259 3,096 117,582
Avg. Hotel Rate #. 230.6 363.7 2172.1Avg. User Rate #. 5.5 29.2 4.6Avg. Hotel Rate 3.9 3.9 4.0Rate Variance 1.0 2.9 1.3
3 EXPERIMENTS ONREAL DATA SETS
In this section, we apply the proposed method on the realhotel rating data sets and show how the proposed approachissues meaningful alerts on unreliable information.
0 50 100 150 200 2500
0.5
1
1.5
2
Hotels in New York City
Inco
nsis
tent
Sco
re
MSDBN
Figure 6: Inconsistent Score Distribution of Hotels in NYC
A B C0.47
0.475
0.48
0.485
0.49
0.495
0.5
A B C0
0.1
0.2
0.3
0.4
0.5
Consistent HotelsCarriage House
Figure 7: The distance between original data and recon-structed data for Carriage House and consistent hotels inLas Vegas
3.1 Data Sets
The two data sets are the ratings of hotels crawled from threepopular travel websites in United States: Orbitz, Pricelineand TripAdvisor. Two popular cities, Las Vegas and NewYork City are chosen in our experiments because there areplenty of hotels being reviewed. The three websites havedifferent numbers of hotels in the two cities and we crawl allthe ratings of the common hotels among the three websites.The data sets are crawled between March 7 and March 9,2012. The rating scale is between 1 and 5. Tables 2 and 3show the characteristics of the two real data sets.
3.2 Results and Evaluation
The output of MSDBN is a consistency score vector R. Sinceit is more interesting to present some inconsistent informa-tion, we compute the Inconsistency Score for each itemas I(k) = α − rk where α is the maximal value in R. Weapply the MSDBN on the above data sets and calculate theinconsistency score for each hotel. Figures 5 and 6 show theinconsistency score distribution of hotels in Las Vegas andNew York City.
There are several observations that can be drawn from thefigures. First, most hotels in Las Vegas and New York cityreceive low inconsistency scores, indicating that the informa-tion about most hotels in three websites are consistent. Ifratings about a hotel are consistent across multiple sources,we can usually claim that the information about this hotelare reliable. Second, the inconsistency score for some ho-tels are significantly higher, indicating that there exist largeinconsistency about the information of these hotels acrosssources. This usually requires further investigations aboutthese hotels to determine if their information are reliable ornot. Next, we present two case studies to show that there in-deed exist unreliable information in their ratings. Althoughwe don’t have ground truth for this task, we find substantialevidence to support the findings of the proposed method.

A B C0.26
0.28
0.3
0.32
0.34
0.36
0.38
0.4
A B C0
0.1
0.2
0.3
0.4
DoubleTree Hotel
Consistent Hotels
Figure 8: The distance between original data and reconstructeddata for DoubletTree Hotel and consistent hotels in NYC
Case Study I: In the first cast study, we pick the hotelthat has the highest inconsistency score in Las Vegas: theCarriage House hotel. Figure 7 shows the distance betweenoriginal data and reconstructed data for Carriage House andconsistent hotels in Las Vegas from three sources. From thefigure, it seems that the information about this hotel on thethird source (TripAdvisor) rings a bell.
From TripAdvisor’s perspective, Carriage House is a realnice hotel. It ranked 12-th of all 282 hotels in Las Vegas.More than 80% of users gave rating more than 4. How-ever, other sources tell a different story. In Yelp, 50% ofguests gave ratings less than 3. In Booking, 24.4% peoplegave ratings less than 4. Other than ratings, we summarizesome of the reviews about the Carriage House from vari-ous sources in Table 4. As shown in the table, the CarriageHotel shows many unattractive features and those features(e.g., loud, rude and dirty) are unfortunately quite consis-tent across multiple sources. This case study shows that theproposed method successfully detects the large inconsistencyof information between TripAdvisor and other sources andcan warn potential customers on the information trustwor-thiness of the ratings.
Table 4: Summary of Reviews about The Carriage House
Websites Review SummaryYelp super loud, unfriendly, constant noise, dirty
Priceline rude front desk, carpet dirty, AC super loudBooking noisy, rude staff, AC noisy, lazy service, dirty
Cast Study II: MSDBN discovers that the Double TreeHilton Hotel near Time Square in New York city has thehighest inconsistency score. Figure 8 shows the distance be-tween original data and reconstructed data for Double TreeHotel and consistent hotels in New York city. As we can see,in this case, information on TripAdvisor causes the high in-consistency again. Priceline lists this hotel as 11-th of the357 hotels in New York city. In Booking, the overall rate is8.5 out of 10 and it is considered very good among hotelsin New York city. However, TripAdvisor ranks this hotelas as 256-th of 432 hotels in New York city and 40% of therating are less than 3. Such huge contrasts between TripAd-visor and other sources remind us to be cautious about theinformation about this hotel.
The two case studies both point out that TripAdvisoris more likely to receive unreliable information from users.This makes sense in that TripAdvisor are totally open toanyone who is able to register, which is much easier to at-tract spam information. Note that the above results do notindicate that TripAdvisor is always less reliable comparedwith other sources, rather, it provides less reliable informa-tion on the hotels in the case studies.
4 EXPERIMENTS ONSYNTHETIC DATA
In Section 3, we present case studies on the real hotel ratingdata sets to show that the proposed method is effective inestimating the information trustworthiness in recommenda-tion systems. In this part, we conduct experiments on thesynthetic data sets to perform quantitative analysis on theproposed method.
3 4 5 6 7 80
0.2
0.4
0.6
0.8
1
Number of Inconsistent Item
F−M
easu
re
NHCMSDBNJMF
Figure 9: Performance Comparison
4.1 Data Generation and Evaluation Metric
The synthetic data are generated based on the observationthat the latent reasons across multiple sources are consis-tent. We generate three sources and mandate that theyshare a mixture of three rating distributions. For a givenitem, its ratings in each source are drawn from one of thedistributions. t items are randomly chosen to be the itemsreceiving inconsistent information, and their ratings are ran-domly shuffled. All the generated ratings are padded withrandom noises to simulate the fact that users have diversepreference.
The evaluation metric of this experiment is F-measure, de-fined as 2(precision×recall)/(precision+recall). precisiondefines the percentage of correctly identified items that re-ceive inconsistent information among all the top t items re-turned by the method, and recall is the percentage of cor-rectly identified items that receive inconsistent informationamong the true top t items generated by the data generator.
4.2 Performance Comparison
To illustrate the power of the proposed model, we first intro-duce some baseline methods. As discussed in Section 1, theratings from individual users can’t be compared directly, yetwe can consider the method which compares ratings statis-tics. The first baseline method is Normalized HistogramComparison (NHC) as follows. For a source s and item k,we compute the percentage of users who give rating to itemk from 1 to N (the maximum rating), and thus we havea rating summary vector of length N for each item in eachsource. Then we compute the inconsistency score as the min-imum of the mutual distance among those summary vectorsand pick up the top t items as items that receive the mostinconsistent information. Note that mutual distance couldbe any distance measurement that fits the application. Inthis work, we use the commonly used Euclidean distance asthe distance measure.
The second baseline method is from [3], which targets atthe similar problem using Joint Matrix Factorization (JMF).JMF finds the consistent groups across multiple sources us-
4000 5000 6000 7000 8000 90000
0.01
0.02
0.03
0.04
0.05
0.06
Number of Users
Inco
nsis
tent
Sco
re
Inconsistent ItemsConsistent Items
(a) MSDBN w.r.t # Users
4000 5000 6000 7000 8000 90000
0.05
0.1
0.15
0.2
Number of Users
JMF
Soc
res
Inconsistent ItemConsistent Item
(b) JMF w.r.t # Users
60 75 90 105 120 1350
0.01
0.02
0.03
0.04
0.05
0.06
The number of Items
Inco
nsis
tent
Sco
res
Inconsistent ItemsConsistent Items
(c) MSDBN w.r.t # Items
60 75 90 105 120 1350
0.05
0.1
0.15
0.2
0.25
Number of Items
NM
F S
core
s
Inconsistent ItemConsistent Item
(d) JMF w.r.t # Items
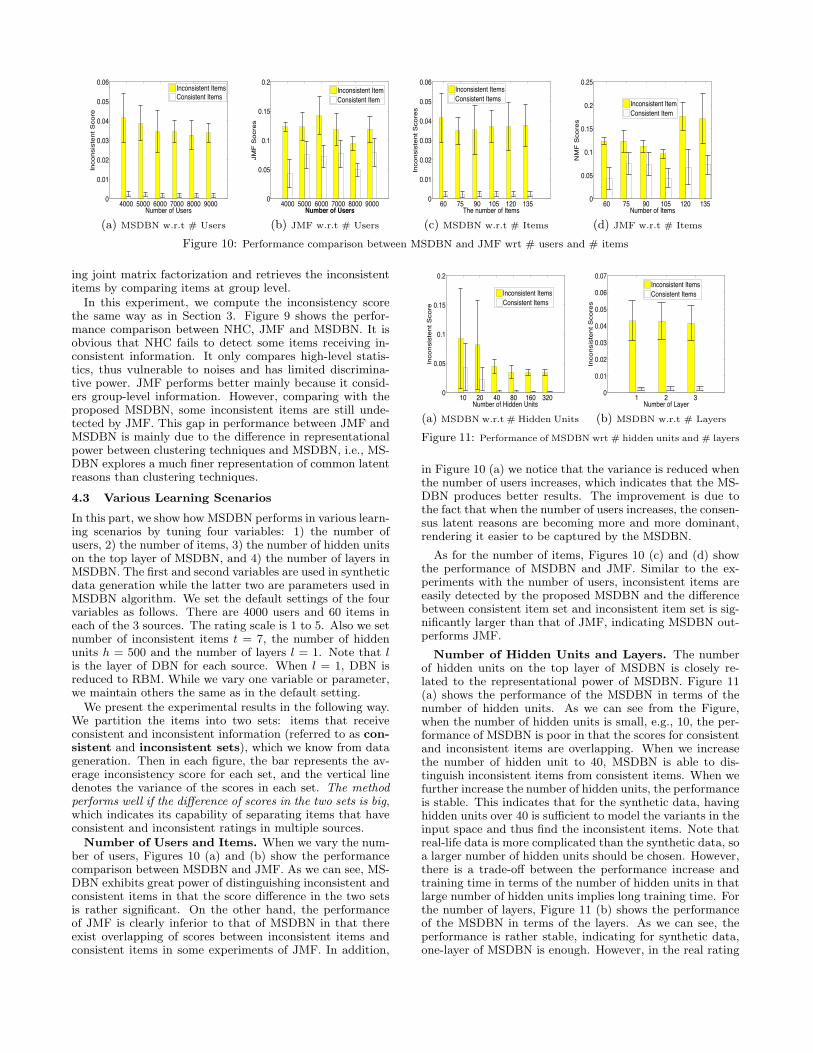
Figure 10: Performance comparison between MSDBN and JMF wrt # users and # items
ing joint matrix factorization and retrieves the inconsistentitems by comparing items at group level.
In this experiment, we compute the inconsistency scorethe same way as in Section 3. Figure 9 shows the perfor-mance comparison between NHC, JMF and MSDBN. It isobvious that NHC fails to detect some items receiving in-consistent information. It only compares high-level statis-tics, thus vulnerable to noises and has limited discrimina-tive power. JMF performs better mainly because it consid-ers group-level information. However, comparing with theproposed MSDBN, some inconsistent items are still unde-tected by JMF. This gap in performance between JMF andMSDBN is mainly due to the difference in representationalpower between clustering techniques and MSDBN, i.e., MS-DBN explores a much finer representation of common latentreasons than clustering techniques.
4.3 Various Learning Scenarios
In this part, we show howMSDBN performs in various learn-ing scenarios by tuning four variables: 1) the number ofusers, 2) the number of items, 3) the number of hidden unitson the top layer of MSDBN, and 4) the number of layers inMSDBN. The first and second variables are used in syntheticdata generation while the latter two are parameters used inMSDBN algorithm. We set the default settings of the fourvariables as follows. There are 4000 users and 60 items ineach of the 3 sources. The rating scale is 1 to 5. Also we setnumber of inconsistent items t = 7, the number of hiddenunits h = 500 and the number of layers l = 1. Note that lis the layer of DBN for each source. When l = 1, DBN isreduced to RBM. While we vary one variable or parameter,we maintain others the same as in the default setting.
We present the experimental results in the following way.We partition the items into two sets: items that receiveconsistent and inconsistent information (referred to as con-sistent and inconsistent sets), which we know from datageneration. Then in each figure, the bar represents the av-erage inconsistency score for each set, and the vertical linedenotes the variance of the scores in each set. The methodperforms well if the difference of scores in the two sets is big,which indicates its capability of separating items that haveconsistent and inconsistent ratings in multiple sources.
Number of Users and Items. When we vary the num-ber of users, Figures 10 (a) and (b) show the performancecomparison between MSDBN and JMF. As we can see, MS-DBN exhibits great power of distinguishing inconsistent andconsistent items in that the score difference in the two setsis rather significant. On the other hand, the performanceof JMF is clearly inferior to that of MSDBN in that thereexist overlapping of scores between inconsistent items andconsistent items in some experiments of JMF. In addition,
10 20 40 80 160 3200
0.05
0.1
0.15
0.2
Number of Hidden Units
Inco
nsis
tent
Sco
re
Inconsistent ItemsConsistent Items
(a) MSDBN w.r.t # Hidden Units
1 2 30
0.01
0.02
0.03
0.04
0.05
0.06
0.07
Number of Layer
Inco
nsis
tent
Sco
res
Inconsistent ItemsConsistent Items
(b) MSDBN w.r.t # Layers
Figure 11: Performance of MSDBN wrt # hidden units and # layers
in Figure 10 (a) we notice that the variance is reduced whenthe number of users increases, which indicates that the MS-DBN produces better results. The improvement is due tothe fact that when the number of users increases, the consen-sus latent reasons are becoming more and more dominant,rendering it easier to be captured by the MSDBN.
As for the number of items, Figures 10 (c) and (d) showthe performance of MSDBN and JMF. Similar to the ex-periments with the number of users, inconsistent items areeasily detected by the proposed MSDBN and the differencebetween consistent item set and inconsistent item set is sig-nificantly larger than that of JMF, indicating MSDBN out-performs JMF.
Number of Hidden Units and Layers. The numberof hidden units on the top layer of MSDBN is closely re-lated to the representational power of MSDBN. Figure 11(a) shows the performance of the MSDBN in terms of thenumber of hidden units. As we can see from the Figure,when the number of hidden units is small, e.g., 10, the per-formance of MSDBN is poor in that the scores for consistentand inconsistent items are overlapping. When we increasethe number of hidden unit to 40, MSDBN is able to dis-tinguish inconsistent items from consistent items. When wefurther increase the number of hidden units, the performanceis stable. This indicates that for the synthetic data, havinghidden units over 40 is sufficient to model the variants in theinput space and thus find the inconsistent items. Note thatreal-life data is more complicated than the synthetic data, soa larger number of hidden units should be chosen. However,there is a trade-off between the performance increase andtraining time in terms of the number of hidden units in thatlarge number of hidden units implies long training time. Forthe number of layers, Figure 11 (b) shows the performanceof the MSDBN in terms of the layers. As we can see, theperformance is rather stable, indicating for synthetic data,one-layer of MSDBN is enough. However, in the real rating
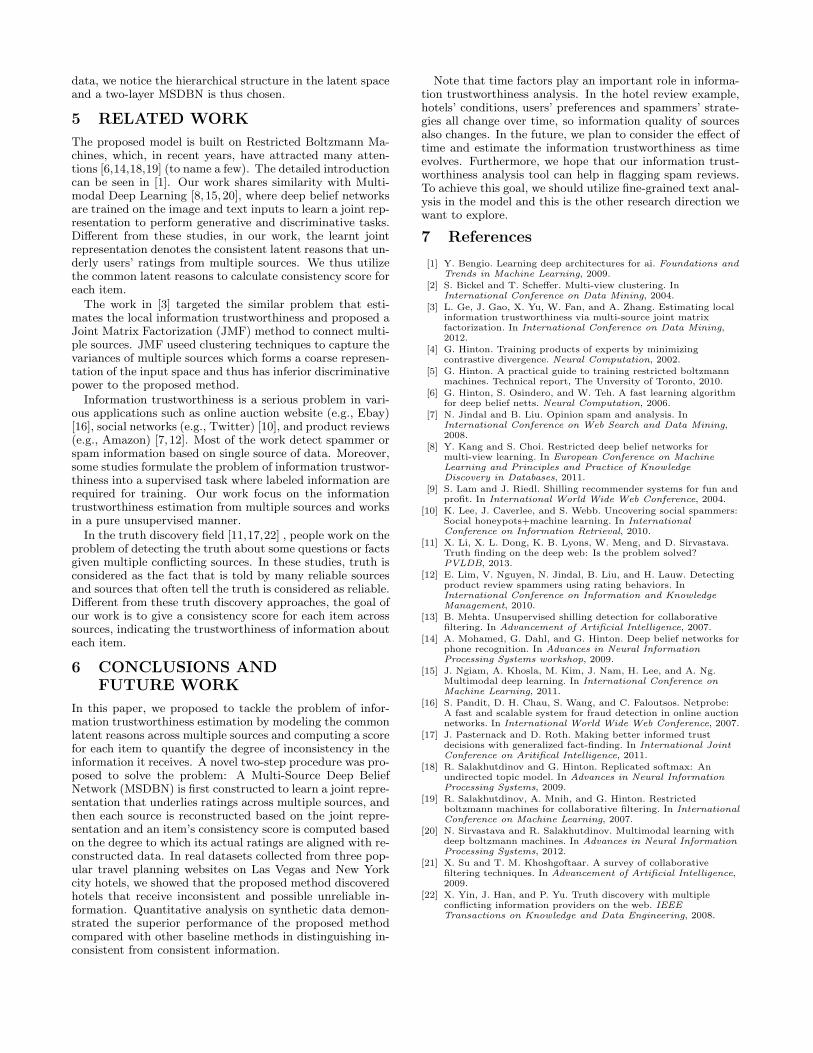
data, we notice the hierarchical structure in the latent spaceand a two-layer MSDBN is thus chosen.
5 RELATED WORK
The proposed model is built on Restricted Boltzmann Ma-chines, which, in recent years, have attracted many atten-tions [6,14,18,19] (to name a few). The detailed introductioncan be seen in [1]. Our work shares similarity with Multi-modal Deep Learning [8,15,20], where deep belief networksare trained on the image and text inputs to learn a joint rep-resentation to perform generative and discriminative tasks.Different from these studies, in our work, the learnt jointrepresentation denotes the consistent latent reasons that un-derly users’ ratings from multiple sources. We thus utilizethe common latent reasons to calculate consistency score foreach item.
The work in [3] targeted the similar problem that esti-mates the local information trustworthiness and proposed aJoint Matrix Factorization (JMF) method to connect multi-ple sources. JMF useed clustering techniques to capture thevariances of multiple sources which forms a coarse represen-tation of the input space and thus has inferior discriminativepower to the proposed method.
Information trustworthiness is a serious problem in vari-ous applications such as online auction website (e.g., Ebay)[16], social networks (e.g., Twitter) [10], and product reviews(e.g., Amazon) [7,12]. Most of the work detect spammer orspam information based on single source of data. Moreover,some studies formulate the problem of information trustwor-thiness into a supervised task where labeled information arerequired for training. Our work focus on the informationtrustworthiness estimation from multiple sources and worksin a pure unsupervised manner.
In the truth discovery field [11,17,22] , people work on theproblem of detecting the truth about some questions or factsgiven multiple conflicting sources. In these studies, truth isconsidered as the fact that is told by many reliable sourcesand sources that often tell the truth is considered as reliable.Different from these truth discovery approaches, the goal ofour work is to give a consistency score for each item acrosssources, indicating the trustworthiness of information abouteach item.
6 CONCLUSIONS ANDFUTURE WORK
In this paper, we proposed to tackle the problem of infor-mation trustworthiness estimation by modeling the commonlatent reasons across multiple sources and computing a scorefor each item to quantify the degree of inconsistency in theinformation it receives. A novel two-step procedure was pro-posed to solve the problem: A Multi-Source Deep BeliefNetwork (MSDBN) is first constructed to learn a joint repre-sentation that underlies ratings across multiple sources, andthen each source is reconstructed based on the joint repre-sentation and an item’s consistency score is computed basedon the degree to which its actual ratings are aligned with re-constructed data. In real datasets collected from three pop-ular travel planning websites on Las Vegas and New Yorkcity hotels, we showed that the proposed method discoveredhotels that receive inconsistent and possible unreliable in-formation. Quantitative analysis on synthetic data demon-strated the superior performance of the proposed methodcompared with other baseline methods in distinguishing in-consistent from consistent information.
Note that time factors play an important role in informa-tion trustworthiness analysis. In the hotel review example,hotels’ conditions, users’ preferences and spammers’ strate-gies all change over time, so information quality of sourcesalso changes. In the future, we plan to consider the effect oftime and estimate the information trustworthiness as timeevolves. Furthermore, we hope that our information trust-worthiness analysis tool can help in flagging spam reviews.To achieve this goal, we should utilize fine-grained text anal-ysis in the model and this is the other research direction wewant to explore.
7 References
[1] Y. Bengio. Learning deep architectures for ai. Foundations andTrends in Machine Learning, 2009.
[2] S. Bickel and T. Scheffer. Multi-view clustering. InInternational Conference on Data Mining, 2004.
[3] L. Ge, J. Gao, X. Yu, W. Fan, and A. Zhang. Estimating localinformation trustworthiness via multi-source joint matrixfactorization. In International Conference on Data Mining,2012.
[4] G. Hinton. Training products of experts by minimizingcontrastive divergence. Neural Computation, 2002.
[5] G. Hinton. A practical guide to training restricted boltzmannmachines. Technical report, The Unversity of Toronto, 2010.
[6] G. Hinton, S. Osindero, and W. Teh. A fast learning algorithmfor deep belief netts. Neural Computation, 2006.
[7] N. Jindal and B. Liu. Opinion spam and analysis. InInternational Conference on Web Search and Data Mining,2008.
[8] Y. Kang and S. Choi. Restricted deep belief networks formulti-view learning. In European Conference on MachineLearning and Principles and Practice of KnowledgeDiscovery in Databases, 2011.
[9] S. Lam and J. Riedl. Shilling recommender systems for fun andprofit. In International World Wide Web Conference, 2004.
[10] K. Lee, J. Caverlee, and S. Webb. Uncovering social spammers:Social honeypots+machine learning. In InternationalConference on Information Retrieval, 2010.
[11] X. Li, X. L. Dong, K. B. Lyons, W. Meng, and D. Sirvastava.Truth finding on the deep web: Is the problem solved?PVLDB, 2013.
[12] E. Lim, V. Nguyen, N. Jindal, B. Liu, and H. Lauw. Detectingproduct review spammers using rating behaviors. InInternational Conference on Information and KnowledgeManagement, 2010.
[13] B. Mehta. Unsupervised shilling detection for collaborativefiltering. In Advancement of Artificial Intelligence, 2007.
[14] A. Mohamed, G. Dahl, and G. Hinton. Deep belief networks forphone recognition. In Advances in Neural InformationProcessing Systems workshop, 2009.
[15] J. Ngiam, A. Khosla, M. Kim, J. Nam, H. Lee, and A. Ng.Multimodal deep learning. In International Conference onMachine Learning, 2011.
[16] S. Pandit, D. H. Chau, S. Wang, and C. Faloutsos. Netprobe:A fast and scalable system for fraud detection in online auctionnetworks. In International World Wide Web Conference, 2007.
[17] J. Pasternack and D. Roth. Making better informed trustdecisions with generalized fact-finding. In International JointConference on Aritifical Intelligence, 2011.
[18] R. Salakhutdinov and G. Hinton. Replicated softmax: Anundirected topic model. In Advances in Neural InformationProcessing Systems, 2009.
[19] R. Salakhutdinov, A. Mnih, and G. Hinton. Restrictedboltzmann machines for collaborative filtering. In InternationalConference on Machine Learning, 2007.
[20] N. Sirvastava and R. Salakhutdinov. Multimodal learning withdeep boltzmann machines. In Advances in Neural InformationProcessing Systems, 2012.
[21] X. Su and T. M. Khoshgoftaar. A survey of collaborativefiltering techniques. In Advancement of Artificial Intelligence,2009.
[22] X. Yin, J. Han, and P. Yu. Truth discovery with multipleconflicting information providers on the web. IEEETransactions on Knowledge and Data Engineering, 2008.