multi-satellite remote sensing of global inundated surfaces over a decade papa fabrice(1), prigent...
Post on 20-Dec-2015
221 views
TRANSCRIPT
Multi-Satellite Remote Sensing of Global Inundated Surfacesover a Decade
PAPA Fabrice(1), PRIGENT Catherine(2), AIRES Filipe(3),ROSSOW William(1)
(1) NOAA/CREST, New York, USA(2) LERMA/ Observatoire de Paris, Paris, France(3) LMD, Paris, France
Mail to: [email protected] [email protected]
1. Inundated Surfaces and their Roles
~ 4% to 6% of the ice-free Earth surfaces depending on the estimates
As part of the biochemical and water cycle, major role in atmospheric and hydrological processes:
The largest methane source (~ 20-40%), a powerful greenhouse gazThe only CH4 source dominated by short-term climate variations
Regulate the local river hydrologyPart of the fresh water input in the ocean via river dischargesSources for recharching ground water supplies.
However: Lack of reliable estimates of inundation extent Dynamics (seasonal, inter-annual) poorly understood

Active microwave (SAR)• very high spatial resolution• large data volume: difficult to handle for global analysis• few time samples: difficult to assess the dynamic
Ex: the Amazon, Hess et al., 2003
Active microwave (altimeter) • usually used for river and lake water levels• thin track: not total coverage except over boreal regions
Ex: the Boreal regions, Papa et al., 2006
Passive microwave (SSMR, SSM/I…)• water reduces emissivities in both linear polarizations • difficult to account for vegetation contribution when used alone• low spatial resolution (~ 20 km)
Ex: The Amazon, Sippel et al., 1998)
2. Existing Inundation database
• based on vegetation and soil distribution• no seasonal or inter-annual variations Ex: Global scale, Matthews et al., 1987, 1991
Static estimates
Satellite-derived estimates
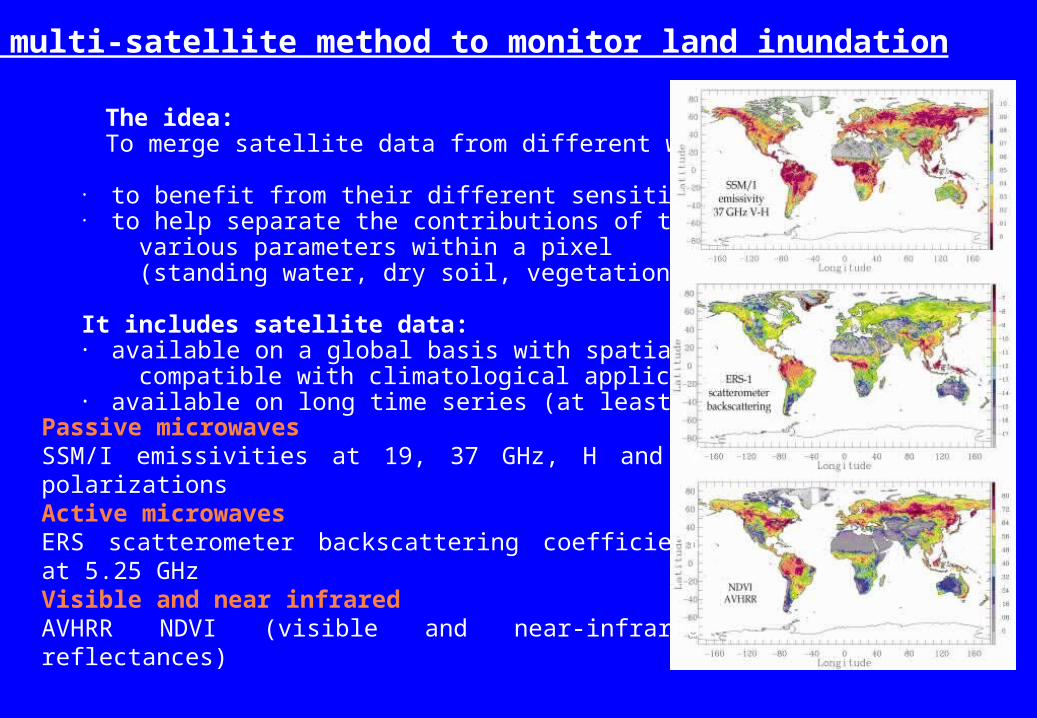
The idea: To merge satellite data from different wavelengths
• to benefit from their different sensitivities• to help separate the contributions of the various parameters within a pixel (standing water, dry soil, vegetation…)
It includes satellite data: • available on a global basis with spatial resolution compatible with climatological applications • available on long time series (at least 10 years)
3. A multi-satellite method to monitor land inundation
Passive microwavesSSM/I emissivities at 19, 37 GHz, H and V polarizationsActive microwavesERS scatterometer backscattering coefficient at 5.25 GHz Visible and near infraredAVHRR NDVI (visible and near-infrared reflectances)
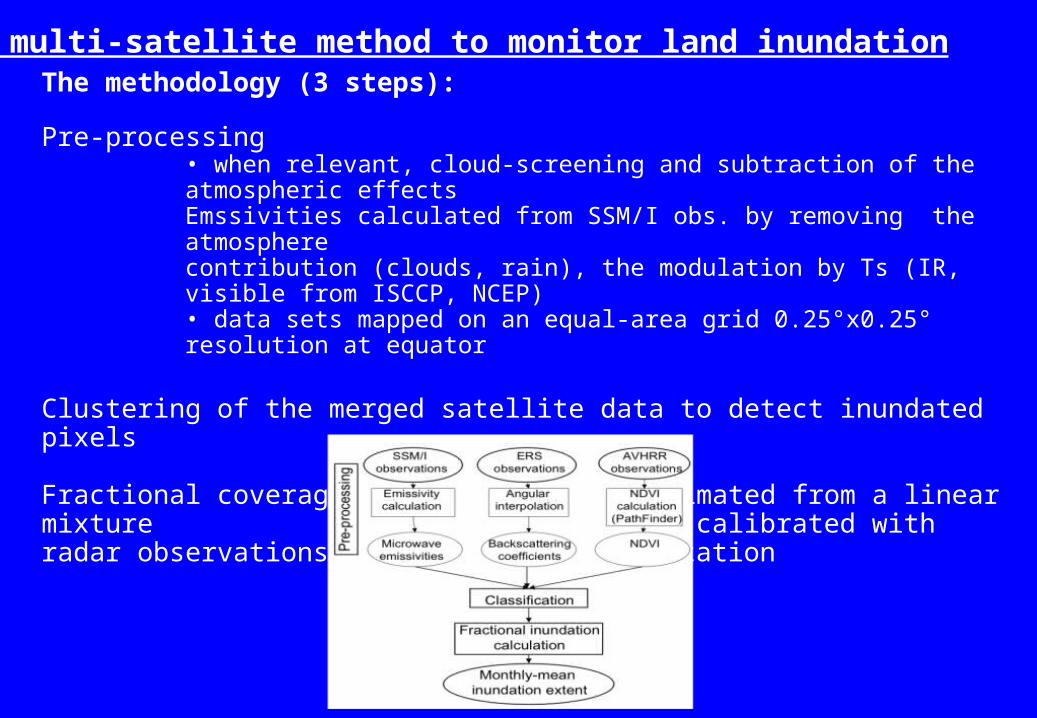
The methodology (3 steps):
Pre-processing• when relevant, cloud-screening and subtraction of the atmospheric effectsEmssivities calculated from SSM/I obs. by removing the atmosphere contribution (clouds, rain), the modulation by Ts (IR, visible from ISCCP, NCEP) • data sets mapped on an equal-area grid 0.25°x0.25° resolution at equator
Clustering of the merged satellite data to detect inundated pixels
Fractional coverage of flooding then estimated from a linear mixture model with end members calibrated with radar observations to account for vegetation
3. A multi-satellite method to monitor land inundation
4. Results and Evaluation
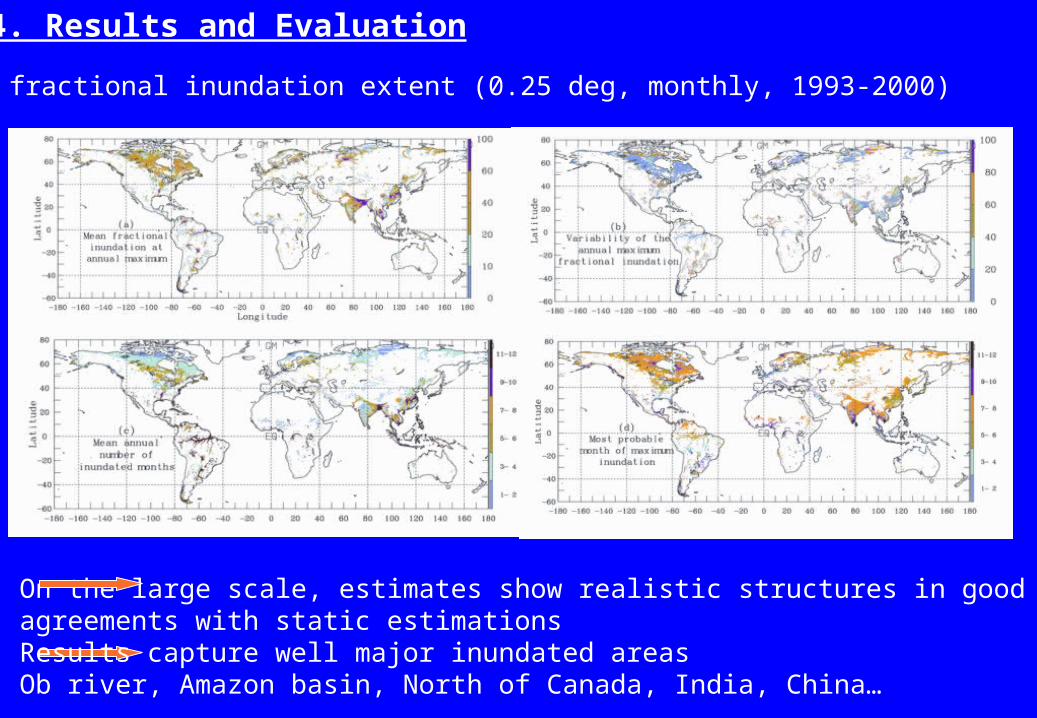
Global fractional inundation extent (0.25 deg, monthly, 1993-2000)
On the large scale, estimates show realistic structures in good agreements with static estimationsResults capture well major inundated areasOb river, Amazon basin, North of Canada, India, China…
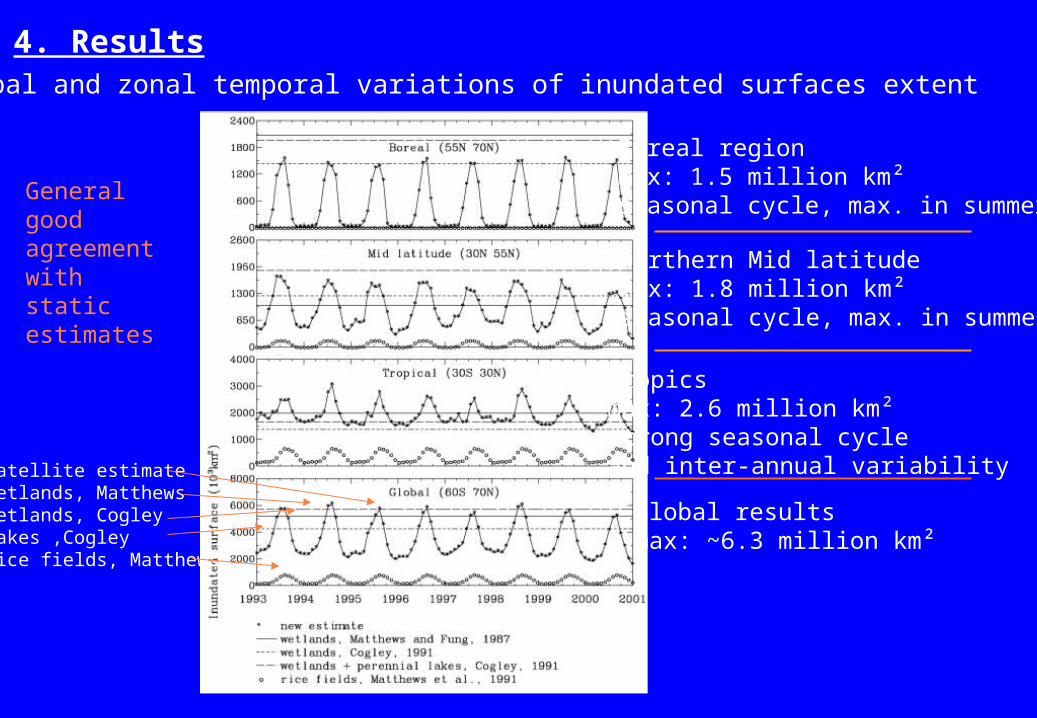
4. ResultsGlobal and zonal temporal variations of inundated surfaces extent
Boreal regionmax: 1.5 million km²seasonal cycle, max. in summer
Northern Mid latitudemax: 1.8 million km²seasonal cycle, max. in summer
Tropicsmax: 2.6 million km²strong seasonal cycleand inter-annual variability
Global resultsmax: ~6.3 million km²
General good agreement with static estimates
Satellite estimateWetlands, MatthewsWetlands, CogleyLakes ,CogleyRice fields, Matthews

5. Comparison of the wetland estimates with related variablesCorrelation between wetland extents and GPCP rain estimates over 8 years
Different regimes: - rain-fed inundation (direct rain at the location)- inundation related to snow-melt or rain upstream location
Time-lagged maximal correlation between inundation estimates and GPCP and the time lag in month over South America
Time series of anomalies (normalized)

Comparison with altimeter water level estimates(Generro et al., Surface water monitoring by satellite altimetry, www.legos.obs-mip.fr/soa/hydrologie/hydroweb)
5. Comparison of the wetland estimates with related variables
Very good correspondence in the cycles between the altimeter-derived water level and the satellite-derived inundation extent estimates
The Pantanal in South America
The Ganges
The Amazon

(%)
6. Case study: the large Siberian watersheds
LenaYenissey
Ob
Latidunal dependenceon gradual snowmelting
Basin inundation Extent (km2)
In-situdischarge(m3/s)
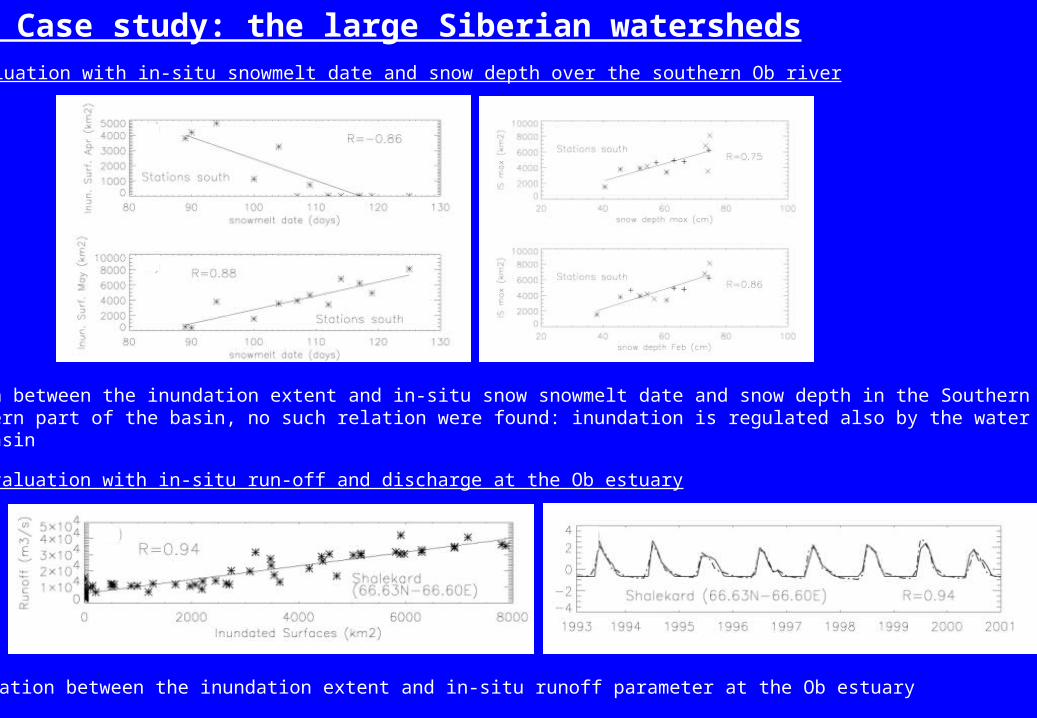
1. Evaluation with in-situ snowmelt date and snow depth over the southern Ob river
2. Evaluation with in-situ run-off and discharge at the Ob estuary
6. Case study: the large Siberian watersheds
Good relation between the inundation extent and in-situ snow snowmelt date and snow depth in the Southern areaIn the Northern part of the basin, no such relation were found: inundation is regulated also by the water coming fromdownstream basin
Good relation between the inundation extent and in-situ runoff parameter at the Ob estuary

6. Case study: the large Siberian watershedsRelation between inundated surfaces South/North of the Ob river basinMay/JuneJune/July
Relation between inundated surfaces north of the Ob river basin and the discharge at the Ob estuaryJune/JuneJuly/July
One of the main goal over the large Siberian watersheds:
Estimates of winter snow depth or SWE from in-situ or from satellites
Estimates of inundations at spring
Estimates of spring/summer discharge

7. A combination of multi-satellite derived inundation with water level variations from altimetry (Topex-Poseidon) over the Rio Negro River
Identification of floodplains/inundation using multi-satellite technique
Construction of water level time series (TP)
Estimation of water level maps
Computation of water level variation maps
Computation of surface water volume variations
Topex-Poseidon tracks
Topex-Poseidonvirtual stations
In-situ stations
Map of water level (m)
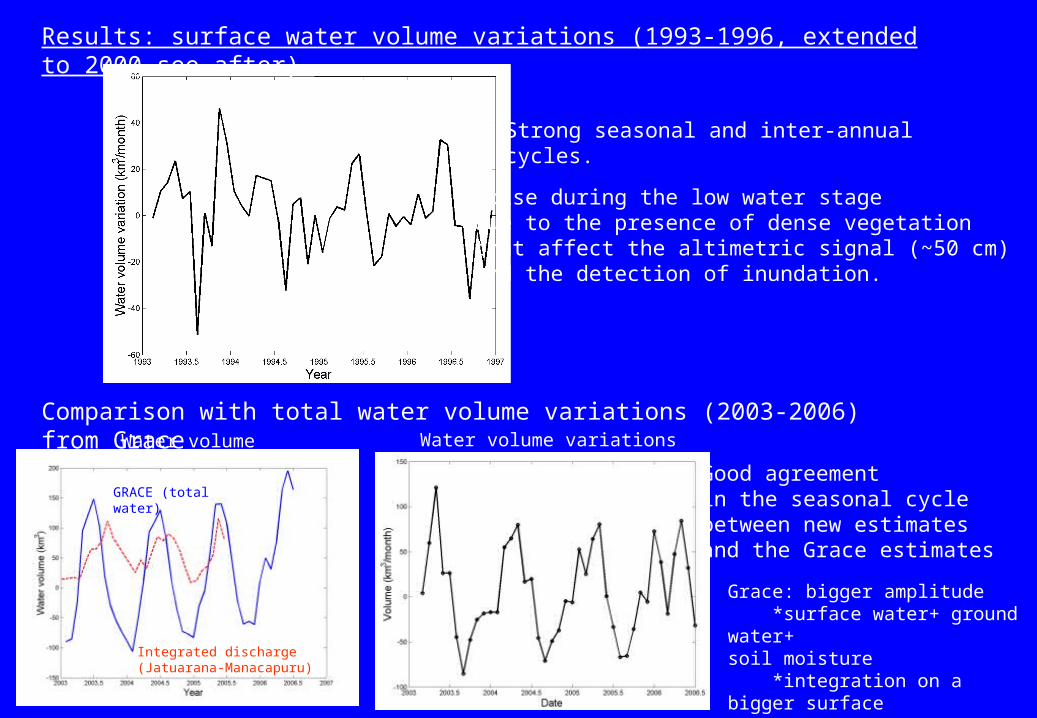
Results: surface water volume variations (1993-1996, extended to 2000 see after)
Strong seasonal and inter-annualcycles.
Noise during the low water stagedue to the presence of dense vegetationthat affect the altimetric signal (~50 cm)and the detection of inundation.
Comparison with total water volume variations (2003-2006) from Grace Water volume Water volume variations
Good agreement in the seasonal cyclebetween new estimatesand the Grace estimates
GRACE (total water)
Integrated discharge (Jatuarana-Manacapuru)
Grace: bigger amplitude *surface water+ ground water+ soil moisture *integration on a bigger surface

Grace(2003-2006)(ground water+soil moisture+surface water)
Multi-satelliteand altimeter(1993-2000)(surface water)
Results: Climatology of water volumes variations over the Rio Negro basin

Surface storage (multi-sat+alt)
Integrated discharge
Evaluation with GPCP estimates and reconstructed in-situ water volume estimates (integrated discharge)
La Nina
*Good correspondence in the amplitude *Interpretation of the lag ??*Bad agreement sometimes due to problem on the calculation of the integrated discharge*lack of in-situ measurements…
Comparison with in-situ discharge
Comparison with GPCP

Total
Surface water
Ground water + Soil moisture
Perspectives: Estimation of “Ground water+ Soil moisture”
“Ground water+ Soil moisture”=Total water (Grace)- Surface Water (Multi-Alti)
Soil moisture coming soon with SMOS…..
7. A combination of multi-satellite derived inundation with water level variations from altimetry (Topex-Poseidon) over the Rio Negro River
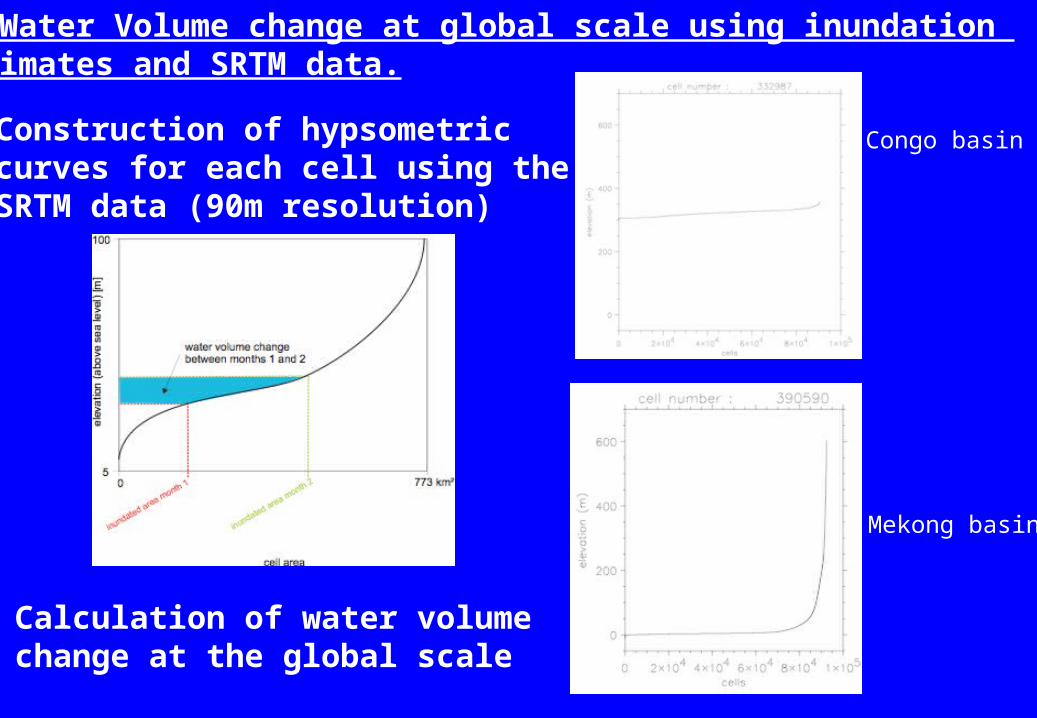
8. Water Volume change at global scale using inundation estimates and SRTM data.
Construction of hypsometriccurves for each cell using theSRTM data (90m resolution)
Congo basin
Mekong basin
Calculation of water volumechange at the global scale

8. Water Volume change at global scale using inundation estimates and SRTM data.
km3
Some realistic and encouraging results over the Congo basin or the Ganges river
Some unrealistic (but not discouraging) results over the Mekong river basin orNorth East AmericaConstraint the maximum height using altimetry?
Need of in-situ validation data, comparison with Grace and WGHM
Existing satellite observations have potential to estimate inundation dynamics at global scale with spatial resolution of ~ 25km and temporal sampling of 1 month
Work in progress to a weekly, daily basis
Now available monthly from 1993 to 2000, soon to 2006
Evaluation of the inundation dynamic estimates still in progress: - difficult given the lack of independent global data sets
Limitations of the method: - inappropriate for coastal regions
- small surfaces likely to be missed
Use of the inundation dataset:- in methane emission models- in hydrological models
- land hydrology
9. Conclusions