multi-resolution, object-oriented fuzzy analysis of · pdf filemulti-resolution,...
TRANSCRIPT

www.elsevier.com/locate/isprsjprs
ISPRS Journal of Photogrammetry & Remote Sensing 58 (2004) 239–258
Multi-resolution, object-oriented fuzzy analysis of
remote sensing data for GIS-ready information
Ursula C. Benz*, Peter Hofmann, Gregor Willhauck, Iris Lingenfelder, Markus Heynen
Definiens Imaging GmbH, Trappentreustr. 1, D-80339 Munich, Germany
Received 31 January 2003; accepted 6 October 2003
Abstract
Remote sensing from airborne and spaceborne platforms provides valuable data for mapping, environmental
monitoring, disaster management and civil and military intelligence. However, to explore the full value of these data, the
appropriate information has to be extracted and presented in standard format to import it into geo-information systems and
thus allow efficient decision processes. The object-oriented approach can contribute to powerful automatic and semi-
automatic analysis for most remote sensing applications. Synergetic use to pixel-based or statistical signal processing
methods explores the rich information contents. Here, we explain principal strategies of object-oriented analysis, discuss
how the combination with fuzzy methods allows implementing expert knowledge and describe a representative example
for the proposed workflow from remote sensing imagery to GIS. The strategies are demonstrated using the first object-
oriented image analysis software on the market, eCognition, which provides an appropriate link between remote sensing
imagery and GIS.
D 2003 Elsevier B.V. All rights reserved.
Keywords: object-oriented image analysis; remote sensing; multi-resolution segmentation; fuzzy classification; GIS
1. Introduction or high-resolution polarimetric SAR data (Curlander
Remote sensing imagery of a large variety of
spaceborne and airborne sensors provides a huge
amount of data about our earth surface for global
and detailed analysis, change detection and monitor-
ing. Powerful signal processing methods are devel-
oped to explore the hidden information in advanced
sensor data (Curlander and Kober, 1992; Haverkamp
and Tsatsoulis, 1992; Tsatsoulis, 1993; Pierce et al.,
1994; Serpico and Roli, 1995), e.g. for hyperspectral
0924-2716/$ - see front matter D 2003 Elsevier B.V. All rights reserved.
doi:10.1016/j.isprsjprs.2003.10.002
* Corresponding author. Tel.: +49-89-23118046; fax: +49-89-
23118090.
E-mail address: [email protected] (U.C. Benz).
and Kober, 1992; Coulde and Pottier, 1996).
However, all these signal processing algorithms are
applied on pixels or rectangular areas and do not take
into account contextual information. Image processing
methods, data and information fusion have to be
added to exploit the full information, both of the
physics of the sensor measurements and the context
within the scene.
Additionally, results in signal processing are most-
ly presented in raster format which is not well-suited
to fuse with results of digital photogrammetry and
combination with vector GIS data.
Thus, there is a large gap between theoretically
available information in remote sensing imagery and

U.C. Benz et al. / ISPRS Journal of Photogrammetry & Remote Sensing 58 (2004) 239–258240
extracted and used information to support decision
making processes.
We propose a new strategy to bridge this gap. Our
approach focuses on:
n the extension of the signal processing approach for
image analysis by exploration of a hierarchical
image object network to represent the strongly
linked real-world objects;
n usage of polygons for suitable interface to GIS;
n fuzzy systems for improved and robust modeling of
real-world dependencies and a detailed quality
check of the resulting product;
n sensor and information fusion to use all available
synergies.
In the following, we describe basic concepts of our
approach, some parts of these explanations are taken
from eCognition’s UserGuide (UserGuide eCognition,
2003). We explain the concepts on some examples
and discuss the enhanced possibilities due to the fuzzy
classification.
2. Overview: from data analysis to image
understanding using a hierarchical object network
The basic processing units of object-oriented image
analysis are segments, so-called image objects, and
not single pixels. Advantages of object-oriented anal-
ysis are meaningful statistic and texture calculation,
an increased uncorrelated feature space using shape
(e.g. length, number of edges, etc.) and topological
features (neighbor, super-object, etc.), and the close
relation between real-world objects and image objects.
This relation improves the value of the final classifi-
cation and cannot be fulfilled by common, pixel-based
approaches.
Since at least two decades, processing power of
affordable computers allows image processing and
image segmentation. Therefore, these methods be-
come applicable for operational remote sensing
image analysis. First major advantages in this area
were derived in studies for sea-ice analysis (Daida
et al., 1990), object-oriented image matching
(Heene and Gautama, 2000) and certain approaches
for data compaction (Ghassemian and Landgrebe,
1988).
The first general object-oriented image analysis
software on the market was eCognition (UserGuide
eCognition, 2003). This software product was pro-
duced by Definiens. Although eCognition is of course
a specific combination of different contributing pro-
cedures, there are some basic characteristic aspects of
the underlying object-oriented approach, which are
independent of the particular methods. The network of
these image objects is directly connected to the
representation of image information by means of
objects. Whereas the topological relation of single,
adjacent pixels is given implicitly by the raster, the
topology and interaction of adjacent image objects
must be explicitly worked out, in order to address
neighbor objects. In consequence, the resulting topo-
logical network has a big advantage, as it allows the
efficient propagation of many different kinds of rela-
tional information.
In many cases, a complete classification task
consists of subtasks which have to operate on objects
of different sizes. For example, to detect ‘‘single
buildings’’ in ‘‘urban areas’’, analysis on different
resolution levels, which are linked is necessary. This
multi-scale analysis is possible with eCognition. The
system allows representation of image information in
different scales simultaneously by different object
layers.
It is achieved by a hierarchical network of image
objects. Besides its neighbors, each object also knows
its sub-objects and super-objects in such a strict
hierarchical structure. This allows precise analysis
of the substructures of a specific region, e.g. the
numbers of single buildings in an urban area. Fur-
thermore, the shape of super-objects can be changed
based on sub-objects.
Image analysis can be separated in two steps,
sensor-specific analysis of object primitives and
scene-specific analysis based on the detected and
recognized object primitives.
This separation makes image analysis very flexi-
ble. Remote sensing experts develop sensor-specific
methods to extract certain kinds of object primitives
from sensor data, e.g. spectral characteristics for trees
or buildings. This information is available in object
features and attributes and can be combined in the
subsequent scene-dependent processing.
As soon as trees or buildings are identified, general
knowledge can be applied, e.g. the expert knowledge
U.C. Benz et al. / ISPRS Journal of Photogrammetry & Remote Sensing 58 (2004) 239–258 241
of a forester, who then does not need to have specific
knowledge on the sensor characteristics.
That means after object primitives are identified,
e.g. primitives which represent a part of a tree or a
tree, the object and its neighbors, sub-and super-
objects can be analyzed with a forest logic. Instead
of processing all areas of an image with the same
algorithm, differentiated procedures can be applied to
different classified super-objects. The results will be
much more appropriate. This is very similar to using
different experts in manual image interpretation: The
special knowledge of, e.g. urban planners or forest
engineers is used for the dedicated analysis tasks for
forestry and urban planning to get appropriate results.
To enable this localized usage of expert algorithms is
a specific strength of multi-scale object-oriented im-
age analysis.
For successful information extraction, an iterative
application of segmentation and classification is
helpful.
Initial segmentation relies on low-level informa-
tion, e.g. the pixel values and basic features of the
intermediate image objects. The initial (multi-scale)
segmentation provides image object primitives with a
certain spectral behavior, shape and context. These
object features enable a preliminary classification.
After this step, the classification result can be used
as high-level input for segmentation, a so-called
classification-based segmentation. Typically, objects
of interest are extracted by these iterative loops of
classification and processing. Thereby, image objects
as processing units can continuously change their
shape, classification and mutual relations.
This circular processing results in a sequence of
intermediate states, with an increasing differentiation
of classification and an increasing abstraction of the
original image information. In each step of abstrac-
tion, new information and new knowledge is gener-
ated and can be beneficially used for the next analysis
step. It is interesting that the result of such a circular
process is by far not only a spatial aggregation of
pixels to image regions, but also a spatial and seman-
tic structuring of the image content. Whereas the first
steps are more data driven, more and more knowledge
and semantic differentiation can be applied in later
steps. The resulting network of classified image
objects can be seen as a spatial, semantic network.
The image analysis based on a hierarchical object
network leads from mainly data-driven analysis to
scene understanding.
3. Knowledge-based image interpretation
The design of successful image analysis systems
requires knowledge about the underlying problem
solving processes. The better the knowledge about
the process and the better this knowledge can be
represented in the system, the more useful the
extracted information will be.
Main requirements of the information extraction
process in a state-of-the-art image analysis system are:
(1) understanding of the sensor characteristics,
(2) understanding of appropriate analysis scales and
their combination,
(3) identification of typical context and hierarchical
dependencies,
(4) consideration of the inherent uncertainties of the
whole information extraction system, starting with
the sensor, up to fuzzy concepts for the requested
information.
Here, we focus on the object-oriented approach and
fuzzy analysis of the object network to address items
2, 3 and 4.
3.1. Selection and combinations of scales
Scale is a crucial aspect of image understanding.
Although in the domain of remote sensing a certain
scale is always presumed based on pixel resolution,
the objects of interest often have their own inherent
scale. Scale determines the occurrence or absence of a
certain object class. The same type of objects appears
differently at different scales. Vice versa, the classifi-
cation task and the respective objects of interest
directly determine a particular scale of interest.
There is an important difference between scale and
resolution: as resolution commonly expresses the
average area dimensions a pixel covers on the ground,
scale describes the magnitude or the level of aggre-
gation (and abstraction) on which a certain phenom-
enon can be described. Thus, studying an image in
different levels of scale instead of an analysis ap-
proach based on different resolutions is an adequate

U.C. Benz et al. / ISPRS Journal of Photogrammetry & Remote Sensing 58 (2004) 239–258242
approach to understand relations within an image and
interpret the scene more easily.
The following describes the multi-scale concept
for analysis of an image which depicts an urban area,
e.g. acquired by high-resolution satellite sensors, as
Ikonos.
Looking from a close distance at the image, one
can detect and recognize single houses, buildings,
roads and other urban objects. If one enlarges the
viewing distance, one cannot see single buildings, but
rather different settlement types or even neighbor-
hoods. These areas can be typically distinguished by
different texture, size and shape, too. The neighbo-
rhood’s texture comprises its objects and structures on
a finer scale—houses, roads, gardens, etc.—and it is
especially determined by their spectral values, shape,
and also their spatial relationships.
At a larger distance, one might discover the city
area as a single entity and some surrounding agricul-
tural areas and/or forests.
This example describes a 3-scale-level approach:
(1) trees, buildings and roads at a fine scale;
(2) groups of trees and groups of buildings aggregated
to different settlement types at a medium scale;
(3) forest and urban area and open landscape at a
coarse scale.
Between these scales there is a hierarchical depen-
dency. One obtains settlement areas or even neighbor-
hoods by aggregating houses, buildings, roads and
other objects. The aggregation of several settlement
areas yields a town. Ecosystems show analogous
patterns: combining several trees builds a group of
trees and combining more trees or groups of trees
builds a forest. Forests and towns have a similar
aggregation level. Both are of comparable scale and
both are of high semantic abstraction.
These hierarchical scale dependencies are self-
evident in each observation and description of real-
world structures. However, explicit representation of
these patterns adds valuable information to automated
image understanding methods.
Houses in an urban area can be treated in a
different way than single houses in forests, for in-
stance. For each type, different characteristics are of
interest. Thus, in order to analyze an image success-
fully it is necessary to represent its content at several
scales simultaneously and to explore the hierarchical
scale dependencies among the resulting objects.
It is obvious that this aggregation, which can be used
for later abstraction, cannot be analyzed by just chang-
ing the resolution of the imagery. This would, more-
over, lead to the loss of a lot of useful information.
3.2. Image semantics—mutual relations between
image objects
One of the most important aspects of understand-
ing imagery is information about image context. There
are two types of contextual information: global con-
text, which describes the situation of the image—
basically, time, sensor and location—and local con-
text, which describes the mutual relationships of
image regions. In human perception, processing of
context information is in most cases consciously or
subconsciously present and contributes essentially to
the great capabilities of humans in image analysis.
In order to receive meaningful context information,
image regions of the right scale must be brought into
relation. This is an extension to the analysis of the
image on different scales without semantic context as
described in Section 2. For instance, the classification
task to identify parks in very high-resolution imagery
can be solved by the following approach: A park is
always a large, contiguous vegetated area. This dif-
ferent scale distinguishes parks from gardens. Addi-
tionally, parks are distinguished from pastures, for
example by their embedding in urban areas. Single
neighboring buildings are not a sufficient condition to
describe parks. However, neighborhood to single
buildings is a suitable criterion for distinguishing
gardens from pasture.
This simple example already shows how much the
available context information depends on the scale of
the structures, which are brought into relation. This
fact explains why it is so difficult or even impossible
to describe meaningful context relations using pixel-
based approaches. Only representing image informa-
tion based on image objects of the appropriate scale,
enables one to handle image semantics. Additionally,
image objects have to be linked to allow low and
high-level semantic and spatial context.
The image object network becomes a hierarchical
image object network, when image objects of different
scale at the same location are linked. Now, each object

U.C. Benz et al. / ISPRS Journal of Photogrammetry & Remote Sensing 58 (2004) 239–258 243
is characterized not only by its spectral, shape or
texture features, but also by its unique neighbors, its
sub- and super-objects.
Together with classification and mutual dependen-
cies between objects and classes, such a network can
be seen as a spatial semantic network.
3.3. Inherent uncertainties and vagueness
Various types of uncertainty influence information
extraction from remote sensing data. Uncertainty
starts with noisy sensor measurements with limited
accuracy, degrading signal processing methods for
data compression and filtering, ambiguous feature
extraction and classification and ends with imprecise
concepts of landcover and landuse classes.
3.3.1. Uncertainties of the sensor
Sensor measurements—the basic source for image
pixels—have limited radiometric and geometric reso-
lution. Limitations in radiometric resolution which are
present even after careful calibration of the instrument
reduce the distance of classes in the feature space. The
geometric resolution in remote sensing—and in any
data acquisition process—is limited as well. This
effect leads to class mixture within one resolution
cell: if a resolution cell covers water–land transition,
the relevant pixel represents to some degree water and
to some degree the landcover of the shore area. Thus,
both geometric and radiometric resolution lead to
reduced possibilities of unambiguous classification.
3.3.2. Uncertainties in image generation
The image generation process, e.g. for SAR
images, converts sensor measurements to image data.
Additionally, these data have to be compressed to
reduce requirements for archiving and data transmis-
sion. In most cases, these data processing steps cause
artifacts and ambiguities, which lead to noise and
therefore, to additional uncertainty in the final image
data.
3.3.3. Fuzzy concepts
Usually only fuzzy concepts exist for landcover
and landuse. There is no exact threshold between
densely and sparsely populated area, or between low
and high vegetation. Therefore, whenever thresholds
are defined they are mostly unsatisfactory idealiza-
tions of the real world and subsequently lead to
problems during classification. If these thresholds
are used for ‘‘ground truth’’ definition, classification
results are compared with idealized reference data and
thus performance estimation of the classification is not
optimal.
3.3.4. Vague retrieval models
Information retrieval from remote sensing data-
bases is based to a large extent on vague knowledge.
The dependency between features and landcover or
landuse is mostly only roughly modeled. Especially
context information is typically only expressed in
terms of vague linguistic rules. For example, if trees
are ‘‘nearly completely’’ surrounded by urban area,
they are assigned to the class park.
3.3.5. Ambiguities due to limited feature space
In many cases the requested information for a
specific classification task is not, or not unambigu-
ously, contained in the available image data. This can
be caused by spatial or radiometric resolution, by
limited number of frequency bands or polarizations,
or because the signal to noise ratio is too low. This
reduced reliability of classification is important input
especially for sensor fusion. The output of each sensor
can be weighted by its suitability and reliability for a
certain classification. This may also vary as reliability
for optic analysis degrades for hazy or cloudy images.
There are several approaches, so-called soft clas-
sifiers, which take these uncertainties into account.
One of the most powerful soft classifiers are fuzzy
classification systems, which are able to incorporate
inaccurate sensor measurements, vague class descrip-
tions and imprecise modeling into the analysis ap-
proach. The degree of uncertainty for each object is
part of the fuzzy classification result (Zadeh, 1965;
Bezdek and Pal, 1992; Bandemer and Gottwald, 1995;
Maselli et al., 1996; Benz, 1999). Taking these uncer-
tainties into account within information extraction, the
classification result is well suited as part of any
decision support system.
4. Image objects and object features
The basic elements of an object-oriented approach
are image objects. Image objects are contiguous

U.C. Benz et al. / ISPRS Journal of Photogrammetry & Remote Sensing 58 (2004) 239–258244
regions in an image. We distinguish between image
object primitives and objects of interest. Only objects
of interest match real-world objects, e.g. the building
footprints or whole agricultural parcels. Object prim-
itives are usually the necessary intermediate step
before objects of interest can be found by segmenta-
tion and classification process. The smallest image
object is one pixel.
Image objects can be linked to a hierarchical
network, where they are attributed with a high-dimen-
sional feature space:
Image object statistics and texture:
Within an image object all kind of statistics based
on single input layers or combinations within the input
image layer stack can be computed, e.g. the ratio of the
mean values of two input channels A and B.
frAB ¼1=n
Xn
pAðxnÞ
1=nXn
pBðxnÞð1Þ
with n number of pixels x within object; p(x) value
of pixel at location x.
Using image objects to calculate this statistic
instead of boxes of pixels improves the reliability of
statistic without smearing edges, since objects do not
exceed edges. Of course homogeneous areas of mixed
pixels can’t be resolved. In ideal cases, this mixture
would be detected since it is not matching the sig-
natures of pure classes and therefore result in a
reduced reliability of object classification.
Image object shape:
The closer object primitives are to objects of
interest, the more image object shape features such
as size, length or number of edges can be used as
additional uncorrelated object features. Advanced
shape features can be derived from object polygons
and object skeletons. Since these features are inde-
pendent of sensor characteristics they are robust
versus sensor calibration and illumination conditions.
Image objects statistics, texture (e.g. Haralick
measures; Haralick and Shapiro, 1992), and shape
can be regarded as intrinsic features. They are avail-
able for each object.
Topological object features:
Due to the object network context features are
provided. Within one scale relations to neighboring
objects can be evaluated, whereby the range of the
neighborhood can be defined as parameter. Between
image scales hierarchical relations can be explored,
where the distance of scales can be adjusted using
distance scale parameter.
The hierarchical network provides additional ob-
ject features:
n characterization of an image object based on its
sub-objects using;
a. texture analysis based on sub-objects;
b. line analysis based on sub-objects;
c. class-related features: relationships to classified
sub-objects, such as the relative area of image
objects assigned to a certain class, e.g. if an
urban area on higher level contains many sub-
objects classified as houses, this urban area can
be described as dense vs. other less dense areas.
Characterization of an image object based on its
super-objects, e.g. houses belonging to a super object
urban can be classified as urban houses, whereas
houses in rural areas can be classified as cottages or
special buildings.
Semantic features:
These higher order features are available after a first
classification of image objects. They allow describing
a park as forested region within urban area or shore
regions as adjacent land regions to water. These
semantic features reduce ambiguities, allow landuse
classification in addition to pure landcover classifica-
tion and thus lead to a first step of scene understanding.
In the following, we describe the image object
creation process.
4.1. Creation of image objects
Objects are created by image segmentation, which
is the subdivision of an image into separate regions.
Image segmentation is a long year research topic in
the area of image analysis (Rosenfeld and Kak, 1976;
Manjunath and Chellappa, 1991; Mao and Jain, 1992;
Panjwani and Healey, 1995). This segmentation can
be realized as an optimization process. Regions of
minimum heterogeneity given certain constraints
have to be found. Criteria for heterogeneity, definition
of constraints and the strategy for sequence of aggre-
gation determine the final segmentation result (see
Fig. 1).

Fig. 1. Example segmentation result in eCognition.
U.C. Benz et al. / ISPRS Journal of Photogrammetry & Remote Sensing 58 (2004) 239–258 245
Heterogeneity can refer to primary object features,
such as standard deviation or gray tones, shape of the
object, or texture on objects or on higher order object
features, such as class assignment of objects. Seg-
mentation methods using a heterogeneity definition
relying only on primary object features can usually
only deliver object primitives, without a direct rela-
tionship to real-world objects. However, these object
primitives can be assigned to classes during a first
classification step and then the higher order object
feature ‘‘class assignment’’ is available for classifica-
tion-based segmentation. This advanced segmentation
step creates objects, which are similar or close to the
objects of interest.
Segmentation in eCognition (Baatz and Schape,
1999; Baatz and Mimler, 2002) allows both segmen-
tation based on primary features (gray tone and shape)
and—after an initial classification—the more ad-
vanced classification-based segmentation. The meth-
od is applicable for many data types with different
dynamic and distribution. Constraints can be used to
ensure exact reproducibility of segmentation.

U.C. Benz et al. / ISPRS Journal of Photogrammetry & Remote Sensing 58 (2004) 239–258246
As already mentioned in Section 3.1 image scale is
very important for meaningful analysis. Therefore,
eCognition provides segmentation on several scales.
Scale selection is performed using certain parameters.
Details of eCognition’s object creation approach
are provided in the following sections.
4.1.1. Object creation in eCognition
eCognition’s multi-resolution segmentation is a
bottom up region-merging technique starting with
one-pixel objects. In numerous subsequent steps,
smaller image objects are merged into bigger ones.
Throughout this pair wise clustering process, the
underlying optimization procedure minimizes the
weighted heterogeneity n h of resulting image objects,
where n is the size of a segment and h a parameter of
heterogeneity. In each step, that pair of adjacent image
objects is merged which results in the smallest growth
of the defined heterogeneity. If the smallest growth
exceeds the threshold defined by the scale parameter,
the process stops. Doing so, multi-resolution segmen-
tation is a local optimization procedure.
The procedure simulates the simultaneous growth
of segments over a scene in each step to achieve
adjacent image objects of similar size and thus of
comparable scale. Thus, the procedure starts at any
point in the image with one-pixel objects. A treatment
sequence based on a binary counter guarantees a
regular spatial distribution of treated objects. Howev-
er, such a sequence leads to slightly varying results
dependent on the history of treated pixels and objects.
Constraints can be used to force an exactly repro-
ducible segmentation on the same image. Here a
global optimization criterion is used.
4.1.1.1. Definition of heterogeneity. Heterogeneity
in eCognition considers as primary object features
color and shape. The increase of heterogeneity f has to
be less than a certain threshold.
f ¼ wcolor � Dhcolor þ wshape � Dhshape;wcolor
a½0; 1; �;wshapea½0; 1; �wcolor þ wshape ¼ 1 ð2Þ
The weight parameters (wcolor, wshape) allow adapt-
ing the heterogeneity definition to the application.
The spectral heterogeneity allows multi-variant
segmentation by adding a weight wc to the image
channels c. Difference in spectral heterogeneity
Dhcolor is defined as following:
Dhcolor ¼Xc
wcðnmerge:rc;merge
� ðnobj 1:rc;obj 1 þ nobj 2:rc;obj 2ÞÞ ð3Þ
with nmerge number of pixels within merged object,
nobj_1 number of pixels in object 1, nobj_2 number
of pixels in object 2, rc standard deviation within
object of channel c. Subscripts merge refer to the
merged object, object 1 and object 2 prior to merge,
respectively.
The shape heterogeneity Dhshape is a value that
describes the improvement of the shape with regard to
smoothness and compactness of an object’s shape.
Dhshape ¼ wcompt � Dhcompt þ wsmooth � Dhsmooth ð4Þ
with
Dhsmooth ¼ nmerge:lmerge
bmerge
� nobj 1:lobj 1
bobj 1
þ nobj 2:lobj 2
bobj 2
� �ð5Þ
Dhcompt ¼ nmerge:lmergeffiffiffiffiffiffiffiffiffiffiffinmerge
p
� nobj 1:lobj 1ffiffiffiffiffiffiffiffiffiffiffinobj 1
p þ nobj 2:lobj 2ffiffiffiffiffiffiffiffiffiffiffinobj 2
p
!ð6Þ
l is perimeter of object, b is perimeter of object’s
bounding box.
Thus, the smoothness heterogeneity equals the ratio
of the de facto border length l and the border length b
given by the bounding box of an image object parallel
to the raster.
The compactness heterogeneity equals the ratio of
the de facto border length l and the square root of the
number of pixels forming this image object.
The weights wc, wcolor, wshape, wsmooth, wcompt are
parameters, which can be selected in order to get
suitable segmentation results for a certain image data
stack and a considered application.
The scale parameter is the stop criterion for opti-
mization process. Prior to the fusion of two adjacent
objects, the resulting increase of heterogeneity f is
calculated. If this resulting increase exceeds a thresh-
U.C. Benz et al. / ISPRS Journal of Photogrammetry & Remote Sensing 58 (2004) 239–258 247
old t determined by the scale parameter, t =W (scale
parameter), then no further fusion takes place and the
segmentation stops.
The larger the scale parameter, the more objects
can be fused and the larger the objects grow. Details
are to be found in (Baatz and Schape, 1999).
4.1.1.2. Alternative creation modes in eCognition for
object primitives. Appropriate object creation with
respect to different applications may require alternative
approaches to the described standard implementation
in eCognition. Therefore, external segmentation results
can be inserted into eCognition and a selection be-
tween alternative segmentation approaches is possible.
Segmentation according to the spectral difference
of objects:
Using the mode ‘‘spectral difference’’ large homo-
geneous areas can be created regarding spectral dif-
ference. Areas, which have a lower spectral difference
than a certain threshold are merged. The scale param-
eter determines the threshold.
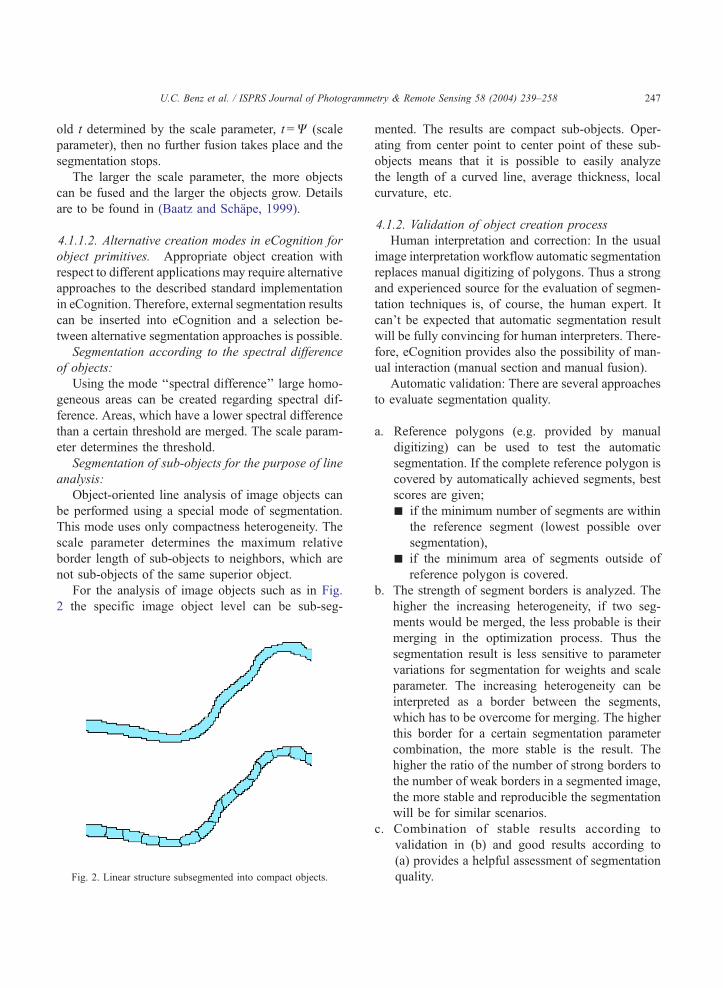
Segmentation of sub-objects for the purpose of line
analysis:
Object-oriented line analysis of image objects can
be performed using a special mode of segmentation.
This mode uses only compactness heterogeneity. The
scale parameter determines the maximum relative
border length of sub-objects to neighbors, which are
not sub-objects of the same superior object.
For the analysis of image objects such as in Fig.
2 the specific image object level can be sub-seg-
Fig. 2. Linear structure subsegmented into compact objects.
mented. The results are compact sub-objects. Oper-
ating from center point to center point of these sub-
objects means that it is possible to easily analyze
the length of a curved line, average thickness, local
curvature, etc.
4.1.2. Validation of object creation process
Human interpretation and correction: In the usual
image interpretation workflow automatic segmentation
replaces manual digitizing of polygons. Thus a strong
and experienced source for the evaluation of segmen-
tation techniques is, of course, the human expert. It
can’t be expected that automatic segmentation result
will be fully convincing for human interpreters. There-
fore, eCognition provides also the possibility of man-
ual interaction (manual section and manual fusion).
Automatic validation: There are several approaches
to evaluate segmentation quality.
a. Reference polygons (e.g. provided by manual
digitizing) can be used to test the automatic
segmentation. If the complete reference polygon is
covered by automatically achieved segments, best
scores are given;
n if the minimum number of segments are within
the reference segment (lowest possible over
segmentation),
n if the minimum area of segments outside of
reference polygon is covered.
b. The strength of segment borders is analyzed. The
higher the increasing heterogeneity, if two seg-
ments would be merged, the less probable is their
merging in the optimization process. Thus the
segmentation result is less sensitive to parameter
variations for segmentation for weights and scale
parameter. The increasing heterogeneity can be
interpreted as a border between the segments,
which has to be overcome for merging. The higher
this border for a certain segmentation parameter
combination, the more stable is the result. The
higher the ratio of the number of strong borders to
the number of weak borders in a segmented image,
the more stable and reproducible the segmentation
will be for similar scenarios.
c. Combination of stable results according to
validation in (b) and good results according to
(a) provides a helpful assessment of segmentation
quality.

rammetry & Remote Sensing 58 (2004) 239–258
4.2. Hierarchical object network
Objects created on different scales can be linked
together to a hierarchical object network like the one
displayed in Fig. 3. This has several advantages for
image analysis.
4.2.1. Hierarchical network creation in eCognition
The levels of image objects are generated by the
described multi-resolution segmentation described
above.
All segmentation procedures provided by eCog-
nition operate on arbitrary levels in a strong hierar-
chical network. Since the level of pixels and the
level of the whole image always exist by definition,
each segmentation of a new level is a construction
in between a lower and an upper level. To guaran-
tee a definite hierarchy over the spatial shape of all
objects the segmentation procedures follow two
rules:
n Object borders must follow borders of objects on
the next lower level.
n Segmentation is constrained by the border of the
object on the next upper level.
Within eCognition.
n Structures of different scales can be represented
simultaneously and thus classified in relation to
each other.
n Different hierarchical levels can be segmented
based on different data; an upper layer, for
instance can be built based on thematic land
register information, whereas a lower layer is
U.C. Benz et al. / ISPRS Journal of Photog248
Fig. 3. Four-level hierarchical network of image objects in abstract
illustration.
segmented using remote sensing data. Classifying
the upper level, each land register object can be
analyzed based on the composition of its classified
sub-objects. By means of this technique different
data types can be analyzed in relation to each
other.
n Object shape correction based on regrouping of
sub-objects is possible.
This network provides the base for successful
information extraction: Relations between scales and
combinations of scales can be used, e.g. one could
focus based on the same image on trees, on groups of
trees and on forest. Roads (extracted on fine scale)
leading through forest areas (extracted on coarse
scale) can be classified as forest roads. Based on the
width of the roads a certain drivability can be assigned
as feature in the output for a geo-information system.
Furthermore, context information and semantics can
be used to distinguish between trees within a forest or
within an urban area.
4.3. Creation of vector information to bridge remote
sensing and geo-information systems
Image objects not only enhance automatic classi-
fication of remote sensing imagery, they support also
export of the extracted information to geo-information
systems, since they can be easily converted to poly-
gons. Within eCognition vector structures are not only
used for import and export, but also for advanced
classification.
eCognition supports a simultaneous raster / vector
representation of image objects. After segmentation,
vectorization functionality allows the production of
polygons and skeletons for each image object. This
vector information is produced in different resolutions
for different purposes.
eCognition produces polygons along the pixel ras-
ter or slightly abstracted polygons. The latter polygons
are referred to in the following as base polygons. They
are created with respect to the topological structure of
image objects and are used for exporting vector
information, too. More abstracted vector information
represents the shape of image objects independently of
the topological structure and is used for the computa-
tion of shape features. These polygons are referred to
as shape polygons.
U.C. Benz et al. / ISPRS Journal of Photogrammetry & Remote Sensing 58 (2004) 239–258 249
The computation of base polygons is done by
means of a Douglas Peucker (Douglas and Peucker,
1973) algorithm.
The Douglas–Peucker algorithm produces in some
cases relatively acute angles. In order to improve the
result, angles smaller than 45j are detected. From the
two particular vectors at such an angle, that one is
subdivided which will result in the largest angles. This
procedure continues in iterative steps until there are
no angles smaller than 45j.For high thresholds, which produce a strong ab-
straction from the original raster, slivers and intersec-
tions within and between base polygons can arise.
This can be especially disturbing when these base
polygons are exported. In order to avoid this effect, an
additional, optional algorithm detects intersections
and splits the affected vectors.
The shape polygons are created by means of a
derivative of multi-resolution segmentation (Eq. (3)),
in this case not applied to image regions but to single
vectors. In contrast to the Douglas–Peucker algorithm
this procedure is a bottom-up approach. Starting with
base polygons, the single vectors are subsequently
merged, optimizing a homogeneity criterion. It is
important to understand that the heterogeneity of
single shape vectors is defined as deviation of the
underlying base vectors. Thus, a threshold of 0 will
always produce shape polygons identical to the under-
lying base polygons. The resulting shape therefore,
depends also on the threshold of the base polygons. A
threshold larger than 0 will result in a stronger abstrac-
tion than the base polygons. Particularly, the deviation
is computed as the maximum of the difference of
length between shape vector and underlying base
vectors and the sum of the lengths of the orthogonal
parts of the underlying base vectors to the shape
vector. Iteratively, the two adjacent vectors of a poly-
gon which result in the smallest heterogeneity are
merged. This continues until the threshold is reached.
4.3.1. Object features based on polygons
The shape polygons are independent of the topo-
logical structure as a segment is represented as one
vector, even if it contains a topological point.
Thus, fractal parts of the boundary of an image
object are represented in a characteristic way by a
number of short vectors, whereas straight edges are
represented by long edges. These shape polygons
allow computing additional object features, e.g. the
number of straight edges, average length of edges and
maximum length of edges. These features can be used
to discriminate between manmade objects and natural
objects: Artificial objects are usually characterized by
few long straight edges, whereas natural objects are
more irregularly shaped.
Skeletons are advanced object features based on
polygons. For elongated objects they provide the
centerline of and second and higher order branches.
Thus, in addition to the road detected in remote
sensing imagery the centerline of the street is
extracted. This is of advantage for subsequent use of
the information extraction result. The line can be
exported to GIS and used for subsequent map pro-
duction, where the road is not depicted as detected in
the image but according to its importance and accord-
ing to the map scale.
Skeletons are created based on a Delauney
triangulation.
To find skeleton branches, three types of triangles
are created: branch-triangles (three-neighbor-triangle),
connecting triangles (two-neighbor-triangles) and
end-triangles (one-neighbor-triangles):
n branch triangles indicate branch-points of the
skeleton,
n two-neighbor-triangles define a connection point,
and
n end-triangles represent end-points of the skeleton.
To obtain the skeletons, the generated points are
connected. The longest possible connection of branch-
points is defined as main line. An example is shown in
Fig. 4.
Skeletons provide input for advanced automatic
shape correction. For example high order branches of
an irregular object can be cut automatically. A typical
example is the separation of lower order streets from
the main road for individual analysis. The automated
object cut can be understood as pruning the object’s
skeleton from outside to inside.
4.3.2. Vector format import and export
Efficient integration of extracted information into
geo-information systems is possible, because objects
can be represented easily by polygons as shown in the
previous section.

Fig. 4. Creation of skeletons based on a Delauney triangulation of image objects’ shape polygons.
U.C. Benz et al. / ISPRS Journal of Photogrammetry & Remote Sensing 58 (2004) 239–258250
eCognition supports the import and export of
thematic data in shape format. Since eCognition is a
region-based analysis system, only polygons can be
imported.
For internal usage this vector information is trans-
formed to raster format. Export supports polygons,
line and point information. While lines in vector
format are based on the lines of the skeletons, points

U.C. Benz et al. / ISPRS Journal of Photogrammetry & Remote Sensing 58 (2004) 239–258 251
are equivalent to the center-point of the main line for
each object to be exported.
Fig. 5. Rectangular and trapezoidal membership functions on
feature x to define a crisp set M(X), lM(x)a{0,1} and a fuzzy set
A(X), lA(x)a{0,1} over the feature range X.
5. Fuzzy classification
Fuzzy classification is beside neural networks
(Gopal and Woodcock, 1996) and probabilistic ap-
proaches (Curlander and Kober, 1992) a very powerful
soft classifier. As an expert system for classification
(Tsatsoulis, 1993) it takes into account:
n uncertainty in sensor measurements,
n parameter variations due to limited sensor
calibration,
n vague (linguistic) class descriptions,
n class mixtures due to limited resolution.
Fuzzy classification consists of an n-dimensional
tuple of membership degrees, which describes the
degree of class assignment A of the considered object
obj to the n considered classes.
fclass;obj ¼ ½lclass 1ðobjÞ; lclass 2ðobjÞ; . . . lclass nðobjÞ�ð7Þ
Crisp classification would only give the informa-
tion, which membership degree is the highest, where-
as this tuple contains all information about the overall
reliability, stability and class mixture.
Fuzzy classification requires a complete fuzzy
system, consisting of fuzzification of input variables
resulting in fuzzy sets, fuzzy logic combinations of
these fuzzy sets and defuzzification of the fuzzy
classification result to get the common crisp classifi-
cation for map production.
Fuzzy logic is a multi-valued logic quantifying
uncertain statements. The basic idea is to replace the
two boolean logical statements ‘‘true’’ and ‘‘false’’ by
the continuous range of [0,. . .,1], where 0 means
‘‘false’’ and 1 means ‘‘true’’ and all values between
0 and 1 represent a transition between true and false.
Avoiding arbitrary sharp thresholds, fuzzy logic is
able to approximate real world in its complexity much
better than the simplifying boolean systems do. Fuzzy
logic can model imprecise human thinking and can
represent linguistic rules.
Hence, fuzzy classification systems are well suited
to handle most sources of vagueness in remote sens-
ing information extraction. The mentioned parameter
and model uncertainties are considered by fuzzy sets,
which are defined by membership functions.
Fuzzy systems consist of three main steps, fuzzifi-
cation, the combination of fuzzy sets, e.g. by fuzzy
rule-base and defuzzification, which are briefly de-
scribed in the following.
5.1. Fuzzification
Fuzzification describes the transition from a crisp
system to a fuzzy system. It defines on an object
feature certain fuzzy sets. These fuzzy sets represent
object feature classes, e.g. ‘‘low’’, ‘‘medium’’ or
‘‘high’’.
These fuzzy object feature classes are defined by
so-called membership functions. These functions as-
sign a membership degree between 0 and 1 to each
object feature value with respect to the considered
object feature class. Depending on the shape of the
function, the transition between ‘‘full member’’ and
‘‘no member’’ can be crisp (for a rectangular function)
or fuzzy (see Fig. 5, set M).
All feature values, which have a membership value
higher than 0 belong to a fuzzy set. In general, the
broader the membership function, the more vague the
underlying concept; the lower the membership values,

Fig. 6. Example for three fuzzy sets on feature x. The membership
functions on feature x define the fuzzy set low, medium and high for
this feature.
U.C. Benz et al. / ISPRS Journal of Photogrammetry & Remote Sensing 58 (2004) 239–258252
the more uncertain is the assignment of a certain value
to the set.
Within the fuzzy system not feature values are
combined but the fuzzy sets defined on these
features values. Hence all calculations refer to
membership degrees with the defined range be-
tween 0 and 1, independent of the range of the
originally crisp features. This simplifies working in
a high-dimensional feature space with different
feature value ranges and features of various types,
e.g., backscatter from different sensors, geographic
information, texture information and hierarchical
relations.
For successful classification a deliberate choice
and parameterization of the membership function is
crucial. The function has to model the underlying
relation between object features and classification as
good as possible. The design is one of the most
important steps to introduce expert knowledge into
the system. Therefore, the better the knowledge
about the real system is modeled by the membership
functions, the better the final classification result
(Civanlar and Trussel, 1986).
It is possible to define more than one fuzzy set on
one feature, e.g., to define the fuzzy sets low, medium
and high for one object feature. The more the
memberships overlap, the more objects are common
in the fuzzy sets and the more vague the final
classification.
For an image object with a feature value of x = 70,
the membership to class low is 0.4, to class medium is
0.2 and to class high is 0.0. If the feature value x
equals 200, the membership to the classes is 0.0, 0.0,
0.8, respectively.
5.2. Fuzzy rule-base
A fuzzy rule-base is a combination of fuzzy rules,
which combine different fuzzy sets. The simplest
fuzzy rules are dependent on only one fuzzy set.
Fuzzy rules are ‘‘if– then’’ rules. If a condition is
fulfilled, an action takes place. An example is: ‘‘If’’
feature x is low, ‘‘then’’ the image object should be
assigned to landcover W. In fuzzy terminology this
would be written: If feature x is a member of fuzzy set
low, then the image object is a member of landcover
W. According to the example in Fig. 6, in case feature
value x = 70, the membership to landcover W would
be 0.4, in case x = 200, the membership to landcover
W would be 0.
To create advanced fuzzy rules, fuzzy sets can be
combined. An operator returns a fuzzy value that is
derived from the combined fuzzy sets. How this
value is derived depends on the operator. The logic
operators are ‘‘and’’, ‘‘or’’ and ‘‘not’’. There are
several possibilities to realize these operators. In
most cases the simplest implementation is to use
minimum operation to implement the fuzzy ‘‘and’’
and the maximum operation to implement fuzzy
‘‘or’’.
The results are independent of the sequence of
logic combinations within the rule-base (A ‘‘and’’ B
gives the same result as B ‘‘and’’ A). In addition a
hierarchic structure following common logic (e.g., A
‘‘or’’ (B ‘‘and’’ C) equals (A ‘‘or’’ B) ‘‘and’’ (A ‘‘or’’
C)) can be created easily.
A fuzzy rule-base delivers a fuzzy classification,
which consists of a tuple of return values for each of
the considered output classes (see Fig. 7). These
values represent the degree of class assignment.
It should be noted that, while fuzzy classification
gives a possibility for an object to belong to a class,
classification based on probability provides a proba-
bility to belong to a class. A possibility gives
information on a distinct object. Probability relies
on statistics and provides one value for many objects.
Whereas the probability of all possible events adds
up to one, this is not necessarily true for possibilities.
The not normalized possibility values provide addi-
tional information on the classification reliability for
each object.
The higher the membership degree for the most
possible class, the more reliable is the assignment.

Fig. 7. Fuzzy classification for the considered landcover classes
urban, water and vegetation. The image object is a member of all
classes to various degrees; lurban(obj) = 0.6, lwater(obj) = 0.8,lvegetation(obj) = 0.3.
U.C. Benz et al. / ISPRS Journal of Photogrammetry & Remote Sensing 58 (2004) 239–258 253
In the example above, the membership to water
lwater(obj) is rather high and in most applications
this object would therefore, be assigned to the
Fig. 8. Image mosaic provided by the for
water. The bigger the difference between highest
and second highest membership value, the more
stable is the decision. Classification stability and
reliability can be calculated and visualized within
eCognition as an advanced method for classification
validation.
Equal membership degrees of an object to several
classes indicate an unstable classification. Within the
resolution cell and based on the provided class defi-
nition the classes cannot be distinguished. If the
membership value is high and the system is well
designed, this result indicates a class mixture within
the resolution cell. If the membership value is low, the
assignment is unreliable and the object will be flagged
for quality assurance in subsequent processing steps.
A threshold for the required membership degree is
est mapping management, Austria.

Fig. 9. Provided polygons of buildings.
Fig. 10. Hierarchical rule-base structure in eCognition.
U.C. Benz et al. / ISPRS Journal of Photogrammetry & Remote Sensing 58 (2004) 239–258254
defined. If this threshold is not reached, the object
remains ‘‘unclassified’’.
This analysis of fuzzy classification provides an
important input for classification validation but fur-
thermore for information fusion in current and future
remote sensing systems with multi-sensor sources
and ancillary data. The reliability of class assign-
ments for each sensor can be used to find the best
class assignment. A solution is possible, even if there
are contradictory class assignments based on different
sensor data, e.g., optical sensors are regarded as
being less reliable than radar sensors if there is a
heavy fog.
5.3. Defuzzification
To produce results like maps for standard land-
cover and landuse applications, the fuzzy results have
to be translated back to a crisp value. To this end, the
maximum membership degree of the fuzzy classifica-
tion is used as crisp class assignment. This process is a
typical approach for defuzzification of fuzzy classifi-
cation results.
If the maximum membership degree of a class is
below a threshold, no classification is performed to
ensure minimum reliability.

Fig. 11. Protocol for automatic analysis of mosaic.
U.C. Benz et al. / ISPRS Journal of Photogrammetry & Remote Sensing 58 (2004) 239–258 255
As this output removes the rich measures of
uncertainty of the fuzzy classification, this step
should be only performed if necessary and as late
as possible in the whole information extraction
process.
Further information on fuzzy systems in image
analysis and remote sensing can be found in Bezdek
and Pal (1992), Maselli et al. (1996), Benz (1999) and
Jaeger and Benz (2000).
6. Example
In the following, we shortly describe a typical
example for eCognition’s usage for information
Fig. 12. Classification map (left) of buildings, other impervious areas and
areas mark objects with highly reliable classification, while the rest show
extraction from remote sensing imagery to update
geo-information.
The goal of this example was to analyze a mosaic
of high-resolution (0.5 m) RGB aerial orthoimages of
FMM (Forest Mapping Management), an Austrian.
Input files were the image mosaic (Fig. 8) and shape
files, showing building footprints (Fig. 9). This infor-
mation was to be updated and extended by polygons
for impervious areas.
Based on an image subset, the segmentation and
the classification strategy is developed.
The classification is applied on two levels (Fig. 10).
The hierarchical rule-base defines on level 1 first the
classes ‘‘roof’’ and ‘‘non-roof’’. ‘‘Non-roof’’ is further
subdivided into ‘‘non-impervious’’, ‘‘shadow’’, ‘‘im-
pervious’’ and ‘‘probably impervious’’. ‘‘Probably im-
pervious’’ is split in ‘‘could be impervious’’ and ‘‘not
likely to be impervious’’. ‘‘Shadow’’ is classified as
‘‘shadow over vegetation’’, or ‘‘shadow over impervi-
ous area’’.
This hierarchy in the rule-base design allows a
well-structured incorporation of knowledge with low
mutual influence of object classes.
As the class names already show, linguistic and
fuzzy concepts are necessary to take uncertainty into
account. The helpful concept to use shadow for
further classification is only possible using the neigh-
borhood concept, that elevated objects like buildings
cast shadows.
The classification strategy for this application con-
sists of iterative segmentation and classification. The
steps, parameters and rule-bases are stored in a
non-impervious areas. Reliability map (right), where medium grey
s unreliable classification.

Fig. 14. Updated and ex
Fig. 13. Example of statistics for export.
U.C. Benz et al. / ISPRS Journal of Photogrammetry & Remote Sensing 58 (2004) 239–258256
protocol. This protocol can be used for batch process-
ing to apply the information extraction on the whole
image mosaic.
Fig. 11 shows the steps and parameters of analysis
for this example. First, a segmentation is performed
with different parameter settings to get the two levels
of object primitives. A first class hierarchy (fmm_ba-
se_1.dkb) is loaded and used in the next step for
classification. Based on this preliminary classification,
first objects of interest are created from object prim-
itives, by classification-based fusion. Similar steps are
performed until the final classification is applied on
level 2. Objects of level 2 are vectorized and exported
to a shape file.
tended shape file.

U.C. Benz et al. / ISPRS Journal of Photogrammetry & Remote Sensing 58 (2004) 239–258 257
Results are:
n a classification map and a reliability map (Fig. 12),
n statistics with relation to certain classes and with
respect to single objects (Fig. 13), and
n an updated and extended shape file (Fig. 14).
The reliability map (Fig. 12, right) is important for
manual post-processing. Only those objects flagged
as having a low reliability have to be manually
assigned after inspection of the aerial images or, if
no decision is possible based on the image, in-situ
observations.
Thus, the method does not replace all manual
interactions, but reduces the amount significantly.
Due to the final supported check by experts not only
a time efficient process is possible, but also a product
with high classification accuracy and reliability can be
provided.
The first table in Fig. 13 shows a unique ID for
each object. The crisp classification is provided by the
‘‘best class’’ column, in which the class is coded by a
number. Any object feature can be exported along
with the object, here the membership degree of the
best class and the mean value is added as an additional
column.
The second table in Fig. 13 shows information on
all objects of a certain subset, e.g. the number of
objects assigned as buildings equals 218, the total area
of impervious object is 121684 m2, the mean area of
impervious objects is 137 m2, the maximum area of
one impervious object is 54654.8 m2, etc.
Due to the object-oriented approach with
n the possibility to take context and semantic
information into account and
n the ability for vector-based input and output and
n due to the robust fuzzy classification with its
advanced accuracy and reliability assessment.
an operational system could be developed for analysis
of an aerial image mosaic and update of GIS-infor-
mation.
The efficiency of the time consuming and subjec-
tive analysis with many in-situ measurements can be
improved and thus, the quality of the final geo-
information can be increased, while simultaneously
reducing costs.
7. Conclusion
The main focus at Definiens is to produce software
for the analysis of complex systems. This can only be
done, if the high degree of mutual relationships and
actions at different scales such as context information,
semantic and hierarchical structure are taken into
account. With Definiens’ Cognition Network Tech-
nology, the basis is available to analyze not only
images but also texts from many different domains,
and to combine the information from heterogeneous
sources to support decision makers.
Acknowledgement
This document relies on many discussions within
the Definiens Imaging unit and parts are taken from
the UserGuide of eCognition created over the years
with contribution of the whole Definiens Imaging
unit.
References
Baatz, M., Mimler, M., 2002. Bildobjekt-Primitive als Bausteine-
Extraktion von Objekten of interest bzw. anthropogenen Objekt-
en basierend auf der expliziten Kanteninformation von Bildob-
jekt-Primitiven. In: Blaschke, T. (Ed.), GIS und Fernerkundung:
Neue Sensoren – Innovative Methoden. Wichmann Verlag,
Heidelberg, pp. 179–188.
Baatz, M., Schape, A., 2000. Multiresolution segmentation—an
optimization approach for high quality multi-scale image seg-
mentation. In: Strobl, J., Blaschke, T., Griesebner, G. (Eds.),
Angewandte Geographische Informations-Verarbeitung XII.
Wichmann Verlag, Karlsruhe, pp. 12–23.
Bandemer, H., Gottwald, S., 1995. Fuzzy Sets, Fuzzy Logic, Fuzzy
Methods with Applications. Wiley, Chichester.
Benz, U., 1999. Supervised fuzzy analysis of single and multi-
channel SAR data. Transactions on Geoscience and Remote
Sensing 37 (2), 1023–1037.
Bezdek, J., Pal, S., 1992. Fuzzy Models for Pattern Recognition,
Methods that Search for Structures in Data. IEEE Press, New,
York.
Civanlar, R., Trussel, H., 1986. Constructing membership functions
using statistical data. IEEE Fuzzy Sets and Systems 18, 1–14.
Coulde, S.R., Pottier, E., 1996. A review of target decomposition
theorems in radar polarimetry. IEEE Transactions on Geoscience
and Remote Sensing 34 (2), 498–518.
Curlander, J., Kober, W., 1992. Rule based system for thematic
classification in SAR imagery. Proc. IGARSS. IEEE Press,
New York, pp. 854–856.

U.C. Benz et al. / ISPRS Journal of Photogrammetry & Remote Sensing 58 (2004) 239–258258
Daida, J., Samadani, R., Vesecky, J.F., 1990. Object-oriented fea-
ture-tracking algorithms for SAR image of the marginal ice
zone. IEEE Transactions on Geoscience and Remote Sensing
28 (4), 573–589.
Douglas, D.H., Peucker, T.K., 1973. Algorithms for the reduction of
the number of points required to represent a line or its caricature.
Canadian Cartographer 10 (2), 112–122.
Ghassemian, H., Landgrebe, D.A., 1988. Object-oriented feature
extraction method for image data compaction. IEEE Control
Systems Magazine 8 (3), 42–48.
Gopal, S., Woodcock, C., 1996. Remote sensing of forest change
using artificial neural networks. IEEE Transactions on Geosci-
ence and Remote Sensing 34 (2), 398–404.
Haralick, R., Shapiro, L., 1992. Computer and Robot Vision,
vol. I. Chap. 9. Texture. Addison-Wesley, Reading, USA,
pp. 453–494.
Haverkamp, D., Tsatsoulis, C., 1992. The use of expert systems in
combination with active and passive microwave data to classify
sea ice. NASA Report, 1625–1627.
Heene, G., Gautama, S., 2000. Optimisation of a coastline extrac-
tion algorithm for object-oriented matching of multisensor sat-
ellite imagery. Proc. IGARSS, vol. 6. IEEE Press, New York,
pp. 2632–2634.
Jaeger, G., Benz, U., 2000. Measures of classification accuracy
based on fuzzy similarity. IEEE Transactions on Geoscience
and Remote Sensing 38 (2), 1462–1467.
Manjunath, B., Chellappa, R., 1991. Unsupervised texture segmen-
tation using Markov random field models. IEEE Transactions on
Pattern Analysis and Machine Intelligence 13 (5), 478–482.
Mao, J., Jain, A., 1992. Texture classification and segmentation
using multiresolution simultaneous autoregressive models. Pat-
tern Recognition 25 (2), 173–188.
Maselli, F., Rodolfi, A., Copnese, C., 1996. Fuzzy classification of
spatially degraded thematic mapper data for the estimation of
sub-pixel components. International Journal of Remote Sensing
17 (3), 537–551.
Panjwani, D., Healey, G., 1995. Markov random field models for
unsupervised segmentation of textured color images. IEEE
Transactions on Pattern Analysis and Machine Intelligence 17
(10), 939–954.
Pierce, E., Ulaby, F., Sarabandi, K., Dobson, M., 1994. Knowledge-
based classification of polarimetric SAR images. IEEE Trans-
actions on Geoscience and Remote Sensing 30 (4), 697–705.
Rosenfeld, A., Kak, A.C., 1976. Digital Picture Processing. Aca-
demic Press, New York.
Serpico, S., Roli, F., 1995. Classification of multisensor remote-
sensing images by structured neural networks. IEEE Transac-
tions on Geoscience and Remote Sensing 33 (3), 562–577.
Tsatsoulis, C., 1993. Expert systems in remote sensing applications.
IEEE Geoscience and Remote Sensing Newsletter June, 7–15.
UserGuide eCognition, 2003. Website: www.definiens_imaging.
com (accessed September 01, 2003).
Zadeh, L., 1965. Fuzzy Sets. IEEE Transactions Information and
Control 8 (3), 338–353.