multi probe software 17.1.1.4
TRANSCRIPT

Multi Probe Software17.3.2.0User Guide23 Feb 2018
Table of Contents
Chapter 1: About Probe Instances............................................................................... 5Introducing Probes...........................................................................................................................5
What is a probe instance?........................................................................................................6Which software probe is right for you?...............................................................................8How probes work with switches.......................................................................................... 10
Chapter 2: Multi Probe Software............................................................................... 12How to install or upgrade the software..................................................................................12
Comparing software probe features.................................................................................... 13Minimum and recommended system specifications....................................................... 15How to upgrade to Windows 10...........................................................................................16How to install all versions...................................................................................................... 16How to upgrade version 17 and later.................................................................................. 17How to upgrade version 16 and earlier............................................................................... 17Capture card driver requirements......................................................................................... 17Installing the wireless NIC driver on Windows 7/Vista...................................................18Installing a third-party USB wireless adapter................................................................... 19Installing Windows updates and updating virus protection........................................ 20
Upgrading the probe software...................................................................................................21Upgrading the probe software directly.............................................................................. 21FAQ: Licensing and updating..................................................................................................21Backing up your GigaStor settings...................................................................................... 23
Creating a probe instance........................................................................................................... 24How to use additional storage volumes on the GigaStor active instance................ 26
Connecting to a Probe................................................................................................................. 26How to change the monitored network adapter............................................................ 26Connecting to a probe for the first time from Observer...............................................27Connecting the Multi Probe or Expert Probe to an Observer...................................... 27

Table of Contents (23 Feb 2018) — Archive/Non-authoritative version 3
Connecting to a probe instance from an Observer analyzer........................................ 28Connecting the probe to an Observer................................................................................28
Redirecting a probe instance..................................................................................................... 28Configuring a probe’s name and other probe options....................................................... 30
Customizing statistics and capture buffers for probe instances.................................. 31Configuring probes to collect data even when not connected to an analyzer.........32Setting the probe’s time clock synchronization settings...............................................32Configuring connections to multiple NICs or Observer................................................. 32Setting the total system memory reserved for probes..................................................33Configuring the probe’s adapter speed, ToS/QoS precedence, and statisticssampling....................................................................................................................................... 33Probe Properties field-level descriptions........................................................................... 34
How to encrypt captured data at rest.................................................................................... 38Using the Probe..............................................................................................................................41
Switching between the probe and analyzer user interfaces.........................................41Enabling Network Trending and setting which statistics are collected.....................42Monitoring a wireless access point......................................................................................42
How to assign physical ports to probe instances................................................................ 42Using the NetFlow features in Observer................................................................................45Creating a NetFlow collector or NetFlow Trending collector............................................ 45
Chapter 3: Understanding How a Probe Uses RAM................................................. 47How a probe uses RAM............................................................................................................... 47
Packet capture buffer and statistics buffer......................................................................49Running Observer without reserved memory..................................................................50Running Observer with reserved memory.........................................................................52How packet capture affects RAM........................................................................................ 53
How to allocate the reserved RAM.......................................................................................... 55Recommendations for the VIAVI capture cards................................................................55
Chapter 4: Gen3 Capture Card.................................................................................... 57Hardware configuration............................................................................................................... 57
Understanding the capture card...........................................................................................57Supported QSFP+/SFP/SFP+ media types......................................................................... 58How to configure the card for an optical TAP, SPAN, or other.................................... 58
Software configuration.................................................................................................................61How to view the capture card properties..........................................................................61How to create virtual adapters.............................................................................................63How to remove duplicate packets in real time................................................................65How to assign physical ports to probe instances........................................................... 66How to change the monitored network adapter............................................................69
Understanding hardware acceleration.....................................................................................69How to enable hardware acceleration................................................................................70Hardware-accelerated mode restrictions............................................................................73Features that require hardware acceleration.................................................................... 74
Capture card device properties.................................................................................................. 75General..........................................................................................................................................75Current State...............................................................................................................................75

4 Table of Contents (23 Feb 2018) — Archive/Non-authoritative version
Advanced Settings.....................................................................................................................77Driver.............................................................................................................................................78Details........................................................................................................................................... 79Events...........................................................................................................................................80Resources......................................................................................................................................81
How to identify your GigaStor..................................................................................................82Capture card details................................................................................................................. 83
Chapter 5: Troubleshooting........................................................................................85Troubleshooting common issues............................................................................................... 85
Troubleshooting a slow probe system............................................................................... 86A probe is not connecting to the analyzer or vice versa...............................................86No network adapter available...............................................................................................87Integrated adapters report all sent packets with bad TCP checksum....................... 88“No VLAN” shown while using a Gigabit NIC...................................................................88VLAN Statistics tool is not working.................................................................................... 88Using Discover Network Names on a Layer 3 switch that uses VLANS.....................90Suspected NAT or VPN issues...............................................................................................90Running Observer passively affects NetFlow................................................................... 91Daylight Savings Time............................................................................................................. 91Configuring Cisco 6xxx switches using a SPAN port to a full-duplex GigabitProbe..............................................................................................................................................91Ports used by Observer products v16 and earlier........................................................... 92
Chapter 6: Backups and Restoring............................................................................ 93Backing up your GigaStor settings...........................................................................................93
Index..............................................................................................................................95
1
Chapter 1: About Probe Instances
Introducing ProbesDiscover the basics of probes, probe instances and what type is right for you, andhow probes work with switches.
As a network administrator, when something goes wrong on your network,seeing what is happening on the wire can quickly lead you to a solution. Usethis guide to assist you with choosing, deploying, configuring, and using yourprobes. The probes, along with Observer Analyzer software, let you see all trafficon the network to which it is connected. To monitor multiple networks from asingle analyzer, probes must be installed at every point where network visibilityis required.
Probes collect and report network traffic and statistics (usually from a switch)to an Observer. This enables you to detect and anticipate problems on bothlocal and remote portions of the network. Probes gain insight and visibilityinto every part of the network, access remote networks as easily as localnetworks, eliminate the time and expense of traveling to remote sites, and speedtroubleshooting.
A probe is a hardware device on your network running VIAVI probe instancesoftware. Each hardware probe has at least one probe instance that capturespackets from your network to analyze. The probe hardware device could be anappliance purchased from VIAVI or you could install the probe software on yourown hardware.
The probe can be located on the same system as the analyzer (every Observerincludes a “local probe”), or the probe can communicate with remote analyzersover TCP/IP.

Introducing Probes6 Multi Probe (23 Feb 2018) — Archive/Non-authoritative version
Probes monitor the following topologies:
♦ 10/100 Mb, 1/10/40 Gb Ethernet (half- and full-duplex)♦ Wireless ( 802.11 a/b/g/n)
Figure 1 (page 6) shows how probes provide visibility into your network. Itmay be obvious, but it also shows that you cannot see traffic on portions of yournetwork where you do not have a probe. Finally, you can put Observer anywhereon your network so long as it has TCP connectivity to the probe.
Figure 1: Typical network
What is a probe instance?Observer has only one kind of probe instance: the probe instance. If you have aGigaStor then you have two special probe instance types available to you: theactive probe instance and the passive probe instance.
Observer uses probes to capture network data. In some cases you may want orneed more than one probe in a specific location. You can achieve that throughprobe instances. A probe instance provides you the ability to look at multiplenetwork interfaces, have multiple views of the same interface, or to publish tomultiple Observer.
Table 1 (page 6) compares the features of active and passive probe instanceswith an Observer probe instance found on all non-GigaStor probes.
Table 1. Active vs. passive GigaStor instances and Observer probe GigaStor Active
probe instanceGigaStor Passiveprobe instance
Observer Probe1
Better suited fortroubleshooting
X X
Better suited fordata capture
X
Start packetcapture
X X X
Stop packetcapture
X X X
Start GigaStorpacket capture
X
Introducing ProbesChapter 1: About Probe Instances 7
GigaStor Activeprobe instance
GigaStor Passiveprobe instance
Observer Probe1
Schedule packetcapture
X X X
Change directorieswhere data isstored
X X X
Able to setpermissions
X X
Able to redirect todifferent analyzer,etc.
X X X
1. An Observer probe is the Single Probe, Multi Probe, or Expert Probe software running on a non-GigaStor probe.
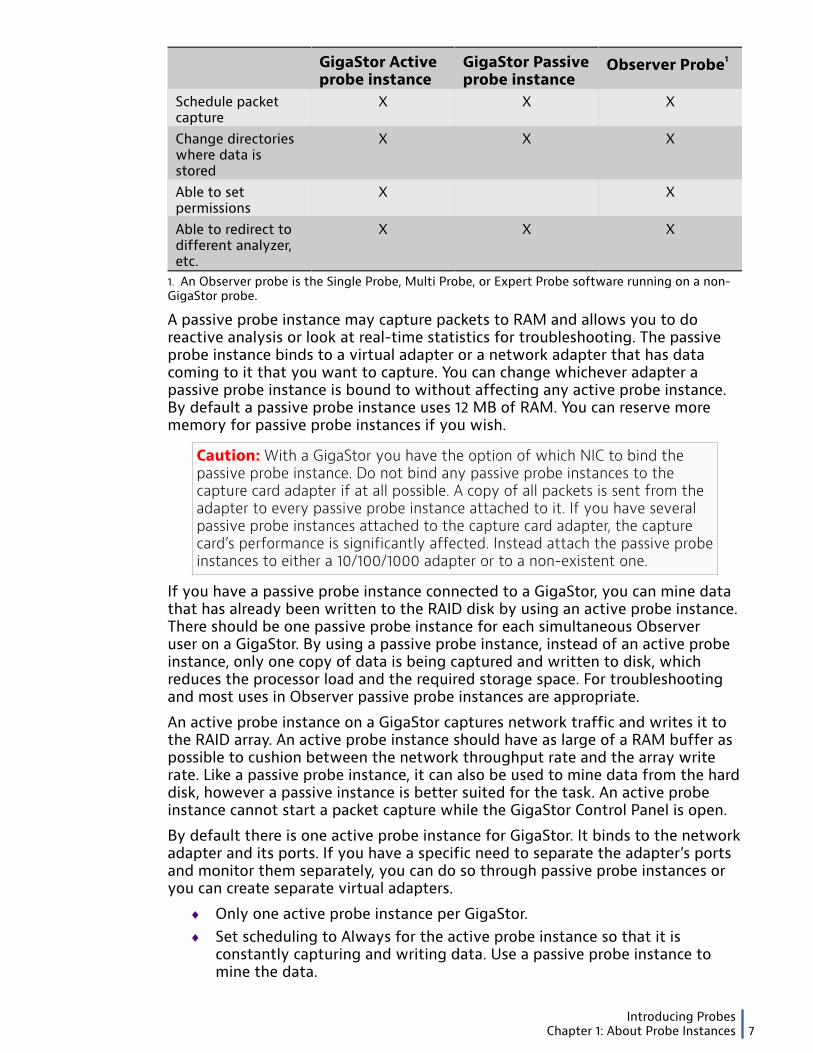
A passive probe instance may capture packets to RAM and allows you to doreactive analysis or look at real-time statistics for troubleshooting. The passiveprobe instance binds to a virtual adapter or a network adapter that has datacoming to it that you want to capture. You can change whichever adapter apassive probe instance is bound to without affecting any active probe instance.By default a passive probe instance uses 12 MB of RAM. You can reserve morememory for passive probe instances if you wish.
Caution: With a GigaStor you have the option of which NIC to bind thepassive probe instance. Do not bind any passive probe instances to thecapture card adapter if at all possible. A copy of all packets is sent from theadapter to every passive probe instance attached to it. If you have severalpassive probe instances attached to the capture card adapter, the capturecard’s performance is significantly affected. Instead attach the passive probeinstances to either a 10/100/1000 adapter or to a non-existent one.
If you have a passive probe instance connected to a GigaStor, you can mine datathat has already been written to the RAID disk by using an active probe instance.There should be one passive probe instance for each simultaneous Observeruser on a GigaStor. By using a passive probe instance, instead of an active probeinstance, only one copy of data is being captured and written to disk, whichreduces the processor load and the required storage space. For troubleshootingand most uses in Observer passive probe instances are appropriate.
An active probe instance on a GigaStor captures network traffic and writes it tothe RAID array. An active probe instance should have as large of a RAM buffer aspossible to cushion between the network throughput rate and the array writerate. Like a passive probe instance, it can also be used to mine data from the harddisk, however a passive instance is better suited for the task. An active probeinstance cannot start a packet capture while the GigaStor Control Panel is open.
By default there is one active probe instance for GigaStor. It binds to the networkadapter and its ports. If you have a specific need to separate the adapter’s portsand monitor them separately, you can do so through passive probe instances oryou can create separate virtual adapters.
♦ Only one active probe instance per GigaStor.♦ Set scheduling to Always for the active probe instance so that it is
constantly capturing and writing data. Use a passive probe instance tomine the data.
Introducing Probes8 Multi Probe (23 Feb 2018) — Archive/Non-authoritative version
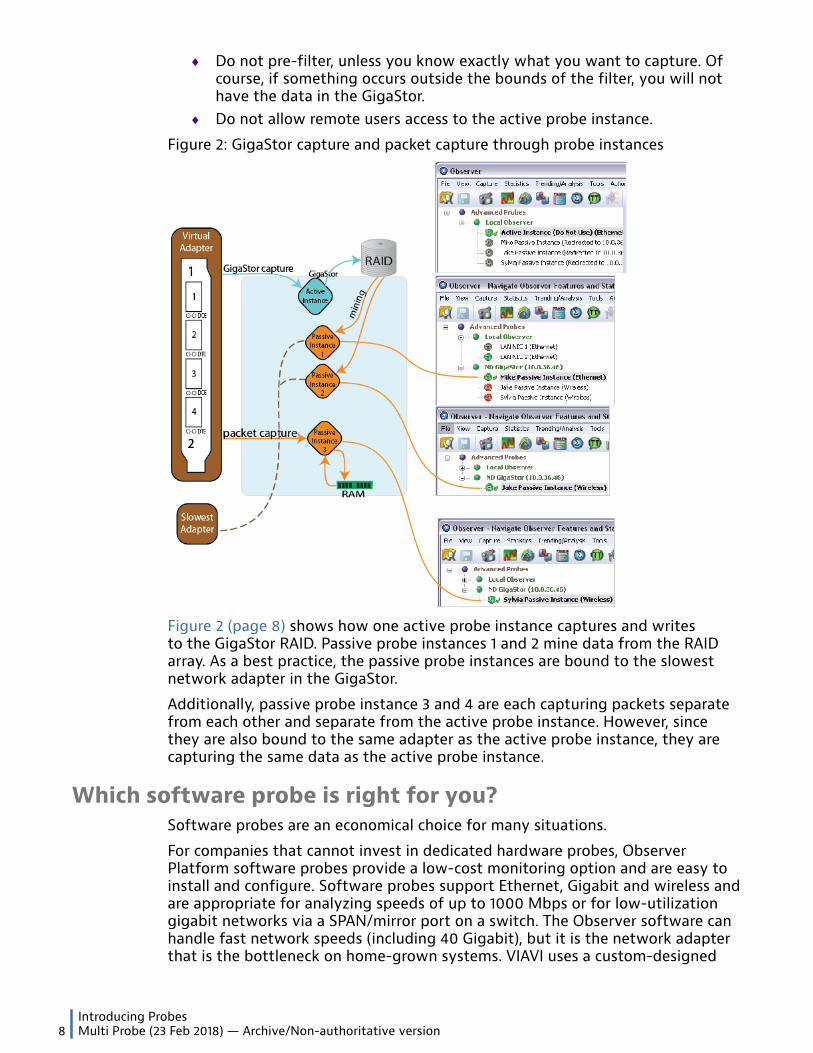
♦ Do not pre-filter, unless you know exactly what you want to capture. Ofcourse, if something occurs outside the bounds of the filter, you will nothave the data in the GigaStor.
♦ Do not allow remote users access to the active probe instance.
Figure 2: GigaStor capture and packet capture through probe instances
Figure 2 (page 8) shows how one active probe instance captures and writesto the GigaStor RAID. Passive probe instances 1 and 2 mine data from the RAIDarray. As a best practice, the passive probe instances are bound to the slowestnetwork adapter in the GigaStor.
Additionally, passive probe instance 3 and 4 are each capturing packets separatefrom each other and separate from the active probe instance. However, sincethey are also bound to the same adapter as the active probe instance, they arecapturing the same data as the active probe instance.
Which software probe is right for you?Software probes are an economical choice for many situations.
For companies that cannot invest in dedicated hardware probes, ObserverPlatform software probes provide a low-cost monitoring option and are easy toinstall and configure. Software probes support Ethernet, Gigabit and wireless andare appropriate for analyzing speeds of up to 1000 Mbps or for low-utilizationgigabit networks via a SPAN/mirror port on a switch. The Observer software canhandle fast network speeds (including 40 Gigabit), but it is the network adapterthat is the bottleneck on home-grown systems. VIAVI uses a custom-designed
Introducing ProbesChapter 1: About Probe Instances 9
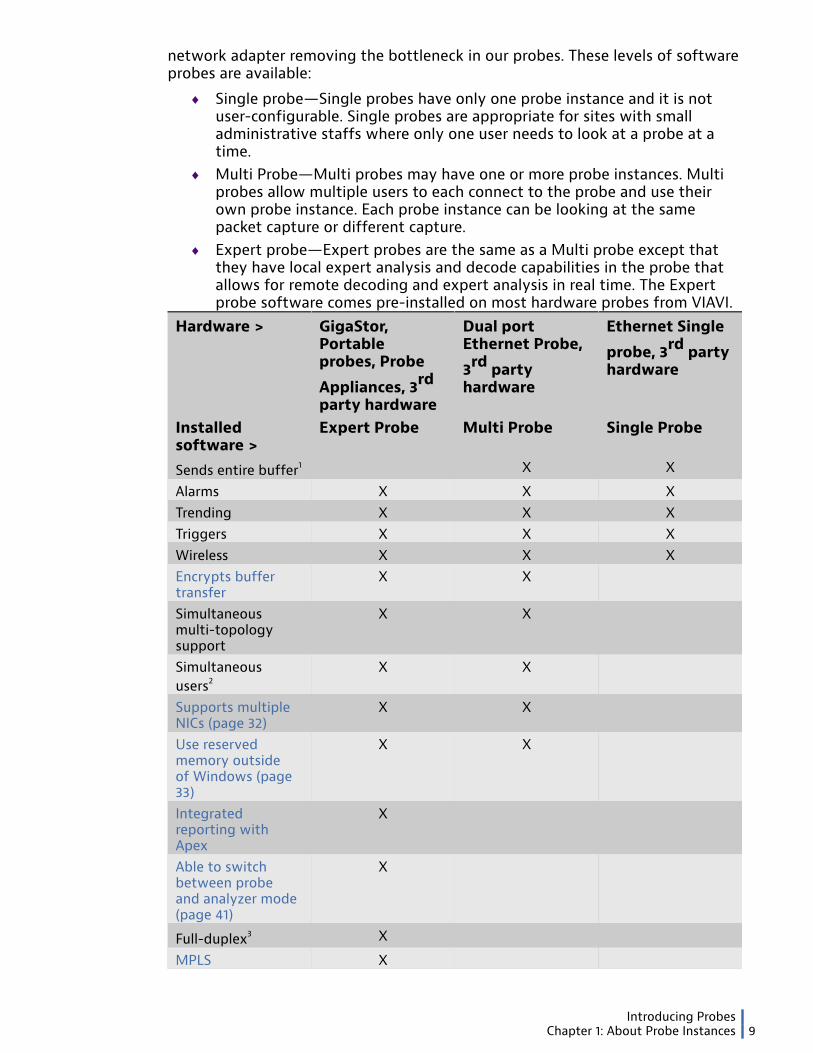
network adapter removing the bottleneck in our probes. These levels of softwareprobes are available:
♦ Single probe—Single probes have only one probe instance and it is notuser-configurable. Single probes are appropriate for sites with smalladministrative staffs where only one user needs to look at a probe at atime.
♦ Multi Probe—Multi probes may have one or more probe instances. Multiprobes allow multiple users to each connect to the probe and use theirown probe instance. Each probe instance can be looking at the samepacket capture or different capture.
♦ Expert probe—Expert probes are the same as a Multi probe except thatthey have local expert analysis and decode capabilities in the probe thatallows for remote decoding and expert analysis in real time. The Expertprobe software comes pre-installed on most hardware probes from VIAVI.
Hardware > GigaStor,Portableprobes, Probe
Appliances, 3rd
party hardware
Dual portEthernet Probe,
3rd partyhardware
Ethernet Single
probe, 3rd partyhardware
Installedsoftware >
Expert Probe Multi Probe Single Probe
Sends entire buffer1 X X
Alarms X X XTrending X X XTriggers X X XWireless X X XEncrypts buffertransfer
X X
Simultaneousmulti-topologysupport
X X
Simultaneoususers2
X X
Supports multipleNICs (page 32)
X X
Use reservedmemory outsideof Windows (page33)
X X
Integratedreporting withApex
X
Able to switchbetween probeand analyzer mode(page 41)
X
Full-duplex3 X
MPLS X
Introducing Probes10 Multi Probe (23 Feb 2018) — Archive/Non-authoritative version
Hardware > GigaStor,Portableprobes, Probe
Appliances, 3rd
party hardware
Dual portEthernet Probe,
3rd partyhardware
Ethernet Single
probe, 3rd partyhardware
Installedsoftware >
Expert Probe Multi Probe Single Probe
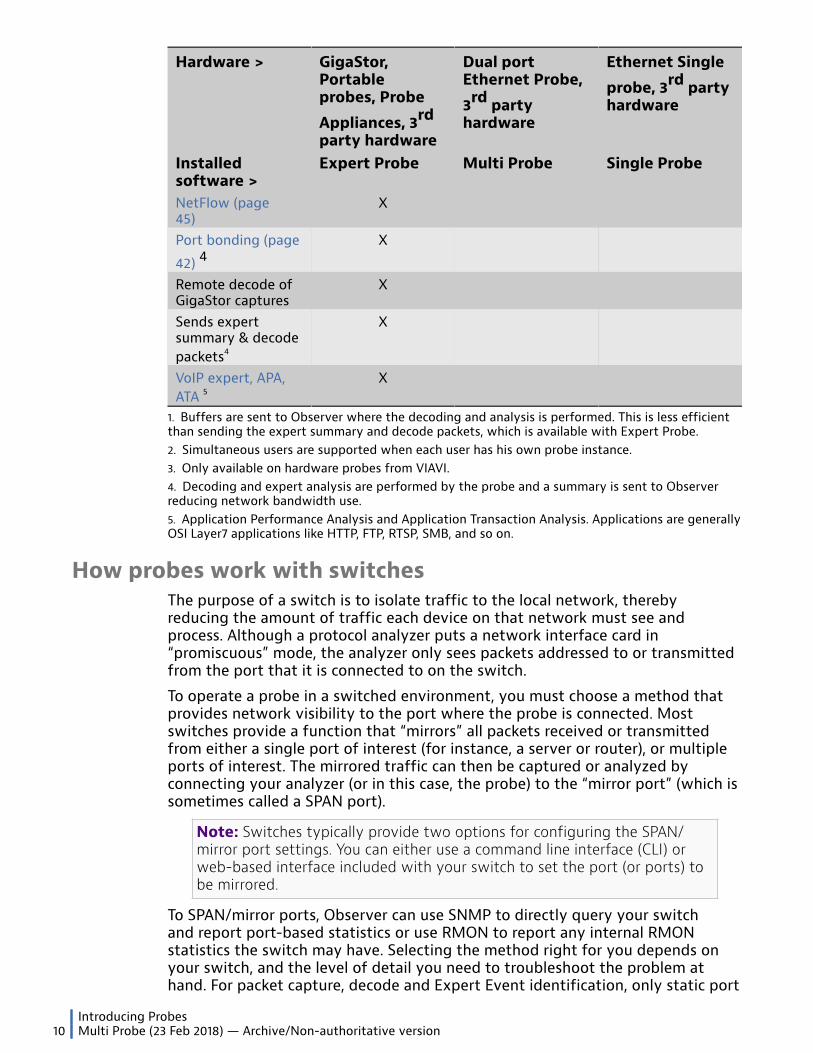
NetFlow (page45)
X
Port bonding (page
42) 4X
Remote decode ofGigaStor captures
X
Sends expertsummary & decodepackets4
X
VoIP expert, APA,ATA 5
X
1. Buffers are sent to Observer where the decoding and analysis is performed. This is less efficientthan sending the expert summary and decode packets, which is available with Expert Probe.2. Simultaneous users are supported when each user has his own probe instance.3. Only available on hardware probes from VIAVI.4. Decoding and expert analysis are performed by the probe and a summary is sent to Observerreducing network bandwidth use.5. Application Performance Analysis and Application Transaction Analysis. Applications are generallyOSI Layer7 applications like HTTP, FTP, RTSP, SMB, and so on.
How probes work with switchesThe purpose of a switch is to isolate traffic to the local network, therebyreducing the amount of traffic each device on that network must see andprocess. Although a protocol analyzer puts a network interface card in“promiscuous” mode, the analyzer only sees packets addressed to or transmittedfrom the port that it is connected to on the switch.
To operate a probe in a switched environment, you must choose a method thatprovides network visibility to the port where the probe is connected. Mostswitches provide a function that “mirrors” all packets received or transmittedfrom either a single port of interest (for instance, a server or router), or multipleports of interest. The mirrored traffic can then be captured or analyzed byconnecting your analyzer (or in this case, the probe) to the “mirror port” (which issometimes called a SPAN port).
Note: Switches typically provide two options for configuring the SPAN/mirror port settings. You can either use a command line interface (CLI) orweb-based interface included with your switch to set the port (or ports) tobe mirrored.
To SPAN/mirror ports, Observer can use SNMP to directly query your switchand report port-based statistics or use RMON to report any internal RMONstatistics the switch may have. Selecting the method right for you depends onyour switch, and the level of detail you need to troubleshoot the problem athand. For packet capture, decode and Expert Event identification, only static port

Introducing ProbesChapter 1: About Probe Instances 11
mirroring provides all the information required for a complete picture of what ishappening on your network.
2
Multi Probe - 12
Chapter 2: Multi Probe Software
How to install or upgrade the softwareThis section describes the installation process and minimum requirements ifyou are installing Observer or probe on your system. This applies to physicaland virtualized servers. If you virtualize the server, each server must meet thesespecifications.
Prerequisite(s):
♦ An administrator account is required to install and run any version ofObserver or probe software except Observer Expert Console Only (ECO).Observer ECO requires an administrator account just for installation; astandard user account can be used for running Observer ECO.
♦ Standard network cards do not support “raw” wireless packets, nor dothey enable “promiscuous” mode by default. Promiscuous mode capturesall packets for the analyzer, not just those addressed to the networkcard. Both “raw” wireless packets and promiscuous mode are required byObserver. ErrorTrak drivers were needed in earlier versions of Observer.They are no longer necessary.
♦ If you do not meet the minimum requirements, the system may seemto operate in the short term, but be aware that even if a sub-minimuminstallation works momentarily, a later, heavier load on the system cancause it to fail. VIAVI sells hardware probes that are guaranteed to keep upwith heavy loads. See the Observer Platform website for details.
♦ You may install the probe software on a virtual machine so long as itmeets the system requirements. The installation process is the same. Youmay also want to consider using a virtual TAP.

How to install or upgrade the softwareChapter 2: Multi Probe Software 13
Caution: See the important information in How to upgrade to Windows 10(page 16) if you want to upgrade the operating system!
1. Ensure your system meets the minimum requirements.
See Minimum and recommended system specifications (page 15).2. Choose one of the following:
● How to install all versions (page 16)● How to upgrade version 17 and later (page 17)● How to upgrade version 16 and earlier (page 17)
After completing this task:
♦ License your software. See FAQ: Licensing and updating (page 21).
Comparing software probe featuresSingle Probes are appropriate for sites with smaller administrative staffs. Thistype of probe communicates with only one Observer at a time.
If you have a need for multiple network administrators to view packet decodesand analysis from the same probe simultaneously, choose a Multi Probe. TheMulti Probe allows you to run multiple probe instances of the probe on a singlesystem, which means that:
♦ You can install multiple network interface cards in a single Multi Probesystem, allowing multiple “points of visibility” from that probe.
♦ You can connect multiple sessions of Observer to the same Multi Probesystem. Any Observer session can see all of the networks available on theMulti Probe. The probe instances are securely encrypted and password-protected.
Although Multi Probes behave similarly to Single Probes, the Multi Probe has adifferent user interface for configuring the probe.
For the highest level of distributed performance, choose an Expert Probe. AnExpert Probe provides Expert Analysis and capture/decode capabilities. Thissaves bandwidth when performing remote expert analysis, and also allowsremote decode views and expert analysis in real time.
The Expert Probe can be configured to run as an Observer when you need toperform troubleshooting from where the probe is located.
Hardware > GigaStor,Portableprobes, Probe
Appliances, 3rd
party hardware
Dual portEthernet Probe,
3rd partyhardware
Ethernet Single
probe, 3rd partyhardware
Installedsoftware >
Expert Probe Multi Probe Single Probe
Sends entire buffer1 X X
Alarms X X XTrending X X XTriggers X X X

How to install or upgrade the software14 Multi Probe (23 Feb 2018) — Archive/Non-authoritative version
Hardware > GigaStor,Portableprobes, Probe
Appliances, 3rd
party hardware
Dual portEthernet Probe,
3rd partyhardware
Ethernet Single
probe, 3rd partyhardware
Installedsoftware >
Expert Probe Multi Probe Single Probe
Wireless X X XEncrypts buffertransfer
X X
Simultaneousmulti-topologysupport
X X
Simultaneoususers2
X X
Supports multipleNICs (page 32)
X X
Use reservedmemory outsideof Windows (page33)
X X
Able to switchbetween probeand analyzer mode(page 41)
X
Full-duplex3 X
MPLS X
NetFlow (page45)
X
Port bonding (page
42) 4X
Remote decode ofGigaStor captures
X
Sends expertsummary & decodepackets4
X
sFlow X
VoIP expert, APA,ATA 5
X
1. Buffers are sent to Observer where the decoding and analysis is performed. This is less efficientthan sending the expert summary and decode packets, which is available with Expert Probe.2. Simultaneous users are supported when each user has his own probe instance.3. Only available on hardware probes from VIAVI.4. Decoding and expert analysis are performed by the probe and a summary is sent to Observerreducing network bandwidth use.5. Application Performance Analysis and Application Transaction Analysis. Applications are generallyOSI Layer7 applications like HTTP, FTP, RTSP, SMB, and so on.
How to install or upgrade the softwareChapter 2: Multi Probe Software 15
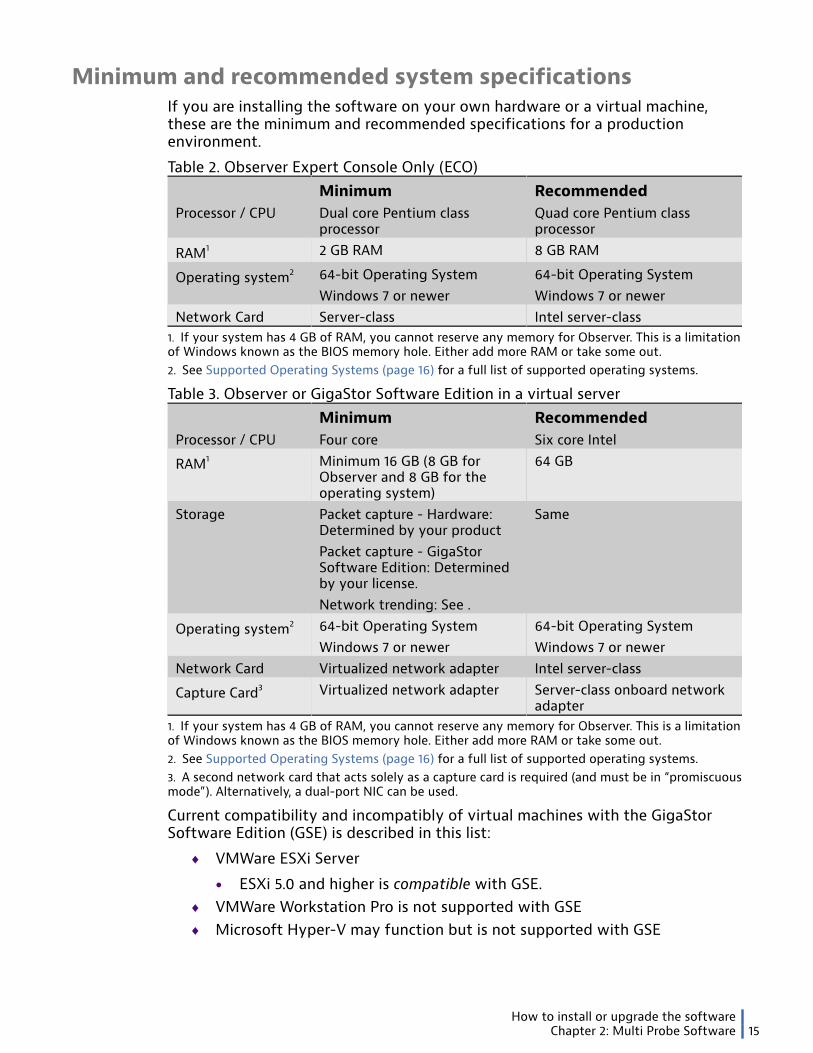
Minimum and recommended system specificationsIf you are installing the software on your own hardware or a virtual machine,these are the minimum and recommended specifications for a productionenvironment.
Table 2. Observer Expert Console Only (ECO) Minimum RecommendedProcessor / CPU Dual core Pentium class
processorQuad core Pentium classprocessor
RAM1 2 GB RAM 8 GB RAM
Operating system2 64-bit Operating SystemWindows 7 or newer
64-bit Operating SystemWindows 7 or newer
Network Card Server-class Intel server-class1. If your system has 4 GB of RAM, you cannot reserve any memory for Observer. This is a limitationof Windows known as the BIOS memory hole. Either add more RAM or take some out.2. See Supported Operating Systems (page 16) for a full list of supported operating systems.
Table 3. Observer or GigaStor Software Edition in a virtual server Minimum RecommendedProcessor / CPU Four core Six core Intel
RAM1 Minimum 16 GB (8 GB forObserver and 8 GB for theoperating system)
64 GB
Storage Packet capture - Hardware:Determined by your productPacket capture - GigaStorSoftware Edition: Determinedby your license.Network trending: See .
Same
Operating system2 64-bit Operating SystemWindows 7 or newer
64-bit Operating SystemWindows 7 or newer
Network Card Virtualized network adapter Intel server-class
Capture Card3 Virtualized network adapter Server-class onboard networkadapter
1. If your system has 4 GB of RAM, you cannot reserve any memory for Observer. This is a limitationof Windows known as the BIOS memory hole. Either add more RAM or take some out.2. See Supported Operating Systems (page 16) for a full list of supported operating systems.3. A second network card that acts solely as a capture card is required (and must be in “promiscuousmode”). Alternatively, a dual-port NIC can be used.
Current compatibility and incompatibly of virtual machines with the GigaStorSoftware Edition (GSE) is described in this list:
♦ VMWare ESXi Server
● ESXi 5.0 and higher is compatible with GSE.♦ VMWare Workstation Pro is not supported with GSE♦ Microsoft Hyper-V may function but is not supported with GSE
How to install or upgrade the software16 Multi Probe (23 Feb 2018) — Archive/Non-authoritative version
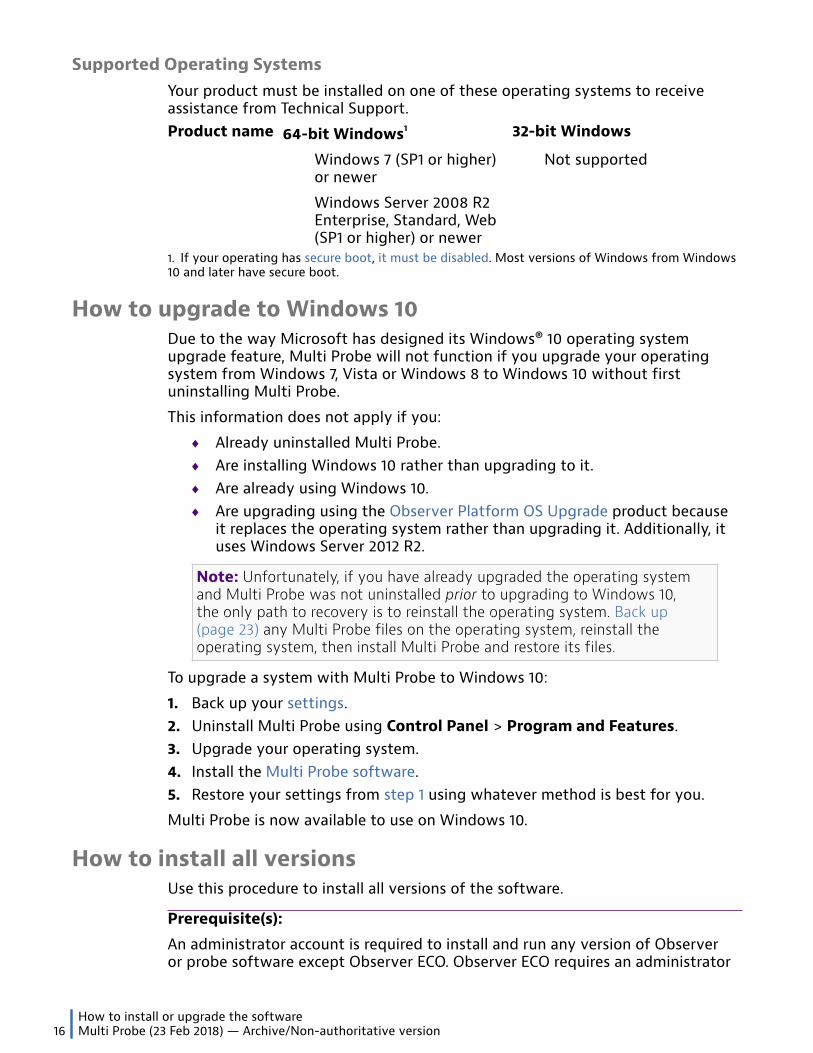
Supported Operating SystemsYour product must be installed on one of these operating systems to receiveassistance from Technical Support.Product name 64-bit Windows1 32-bit Windows
Windows 7 (SP1 or higher)or newer
Windows Server 2008 R2Enterprise, Standard, Web(SP1 or higher) or newer
Not supported
1. If your operating has secure boot, it must be disabled. Most versions of Windows from Windows10 and later have secure boot.
How to upgrade to Windows 10Due to the way Microsoft has designed its Windows® 10 operating systemupgrade feature, Multi Probe will not function if you upgrade your operatingsystem from Windows 7, Vista or Windows 8 to Windows 10 without firstuninstalling Multi Probe.
This information does not apply if you:
♦ Already uninstalled Multi Probe.♦ Are installing Windows 10 rather than upgrading to it.♦ Are already using Windows 10.♦ Are upgrading using the Observer Platform OS Upgrade product because
it replaces the operating system rather than upgrading it. Additionally, ituses Windows Server 2012 R2.
Note: Unfortunately, if you have already upgraded the operating systemand Multi Probe was not uninstalled prior to upgrading to Windows 10,the only path to recovery is to reinstall the operating system. Back up(page 23) any Multi Probe files on the operating system, reinstall theoperating system, then install Multi Probe and restore its files.
To upgrade a system with Multi Probe to Windows 10:
1. Back up your settings.2. Uninstall Multi Probe using Control Panel > Program and Features.3. Upgrade your operating system.4. Install the Multi Probe software.5. Restore your settings from step 1 using whatever method is best for you.
Multi Probe is now available to use on Windows 10.
How to install all versionsUse this procedure to install all versions of the software.
Prerequisite(s):
An administrator account is required to install and run any version of Observeror probe software except Observer ECO. Observer ECO requires an administrator
How to install or upgrade the softwareChapter 2: Multi Probe Software 17
account just for installation; a standard user account can be used for runningObserver ECO.
1. Insert the installation CD in your CD drive or use the latest installation imagefrom our update site. If you copied the installation files from our web site,start the installation program.
http://update.viavisolutions.com/latest/ObserverSetupx64.exe2. When the setup program runs, follow the onscreen instructions.3. Choose to install:
● Observer.● Advanced Probe. Choose this for Single Probe or Multi Probe. Your license
determines whether it is a Single Probe or Multi Probe.● Expert Probe
4. After the files have been installed on your system you must restart Windows.You will not be able to run the software until you restart your computer.
How to upgrade version 17 and laterVersion 17 allows you to upgrade directly from within Observer or from OMS (ifused).
If OMS is not controlling Observer, then do the following in Observer:
If OMS is controlling Observer:♦ See How to manage software versions using OMS.
The software is updated to the latest version.
How to upgrade version 16 and earlierUpgrading version 16 uses the same procedure as installing the software. Theprocess is different for version 17 and later.
1. Insert the installation CD in your CD drive or use the latest installation imagefrom our update site. If you copied the installation files from our web site,start the installation program.
http://update.viavisolutions.com/latest/ObserverSetupx64.exe2. When the setup program runs, follow the onscreen instructions.3. Choose to install:
● Observer.● Advanced Probe. Choose this for Single Probe or Multi Probe. Your license
determines whether it is a Single Probe or Multi Probe.● Expert Probe
4. After the files have been installed on your system you must restart Windows.You will not be able to run the software until you restart your computer.
Capture card driver requirementsIf you are going to use a third-party capture card in your probe, the capture cardmust meet certain requirements so that Observer can report statistics and errors.The network card used to monitor or capture network traffic must have all of
How to install or upgrade the software18 Multi Probe (23 Feb 2018) — Archive/Non-authoritative version
the mandatory and optional NDIS functions. The VIAVI capture card has all of thenecessary features.
Most NIC vendors provide solid, functional NDIS drivers for all cards availablewithin the Ethernet, Token Ring, and FDDI marketplace.
Accessing a standard network with a “normal” network device is somewhatdifferent from what a protocol analyzer requires. While both share a numberof driver functions, a protocol analyzer requires a set of features and functionsthat the average network device will never need. Examples of these optionalfunctions are promiscuous mode, error tracking, and network speed reporting.(Examples of mandatory functions would include functions to determine themaximum packet size, functions to verify the number of sent packets, andfunctions to specify or determine a packets’ protocol.)
Microsoft made a number of the less used (by “normal” network users) functions“optional”, as opposed to “mandatory” regarding driver requirements. The resulthas been that most vendors support all (or most) mandatory functions with thefirst release of the driver. As time passes, and the initial chaos of the first releaseof the card and driver passes, most manufacturers add some or all of the optionalfunctions, as well as fix or complete all of the mandatory functions.
As part of the optional section of defined NDIS functions, Microsoft specified anumber of counters that can be kept for Ethernet frame errors. These countersinclude CRC errors, Alignment errors, Packets Too Big (Jabbers), and Packets TooSmall (Runts). Collisions are counted, but there are limitations of NDIS collisionstatistics. Four important points should be considered:
♦ These optional counts only provide a numerical value to the total numberof errors on the segment (i.e. the number of CRC errors found), they donot specify where (which station) the error originated from.
♦ After the error packet is identified and the proper error counter isincremented, the packet is discarded, and not sent to Windows (this is thereason it is impossible to determine the source of an Ethernet error packetwith standard NDIS drivers).
♦ A number of vendor’s NDIS drivers return a positive acknowledgmentwhen the NDIS error function is queried for existence, but the errorstatistic is not actually kept.
♦ A few vendors (3COM, for example) do not keep any error statisticswhatsoever.
If a NIC driver both reports that the optional Ethernet error statistics are beingkept, and actually keeps data on these errors, Observer reports these statistics inthe Network Vital Sign Display.
Installing the wireless NIC driver on Windows 7/VistaSee the information in Monitoring a wireless access point (page 42), whichcontains details about raw packets and promiscuous mode for the network card.
Follow these instructions to install the wireless driver for your network card:
1. Click Start and then right-click on the ‘Computer’ icon and choose Properties.2. Click Device Manager.3. Right-click on the wireless adapter you want to use as your capture card and
choose Update Driver Software.
How to install or upgrade the softwareChapter 2: Multi Probe Software 19
4. Choose “Browse my computer for driver software.”5. Choose “Let me pick from a list of drivers on my computer.”6. Click Have Disk and use the drivers in this location:
Example: C:\Program Files\Observer\DRIVERS\Wireless\Atheros_Vista
7. Click Next and Windows installs the driver for your wireless card.
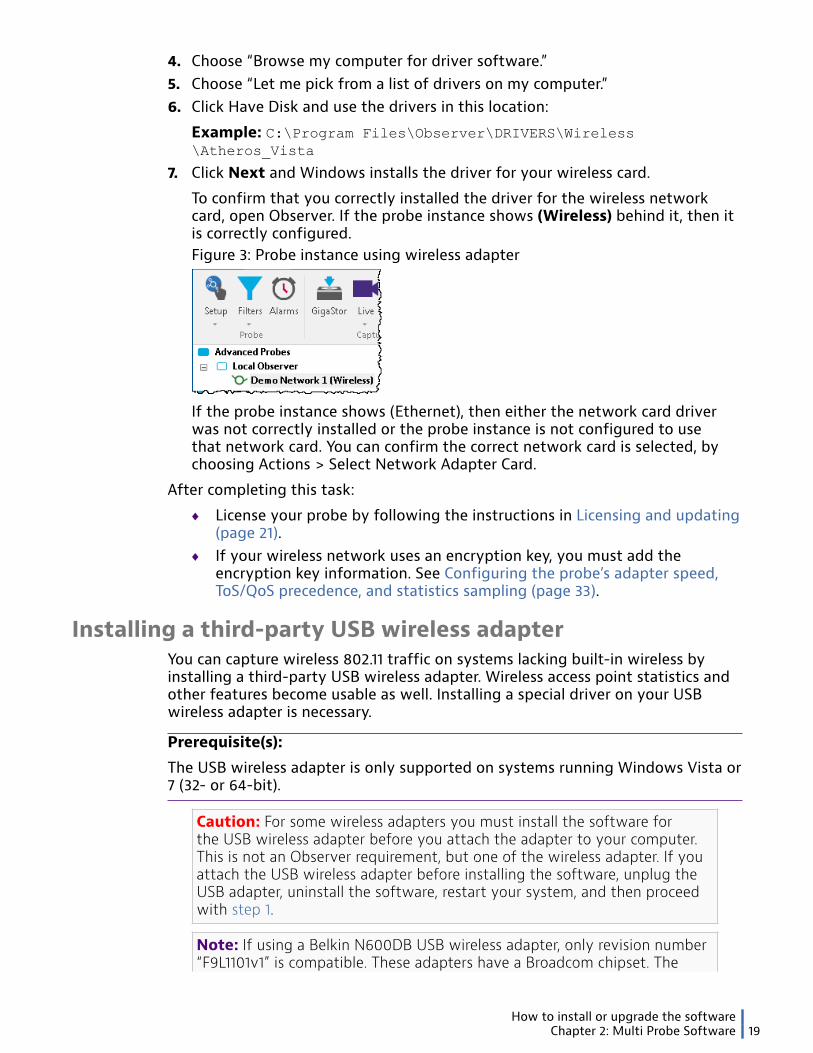
To confirm that you correctly installed the driver for the wireless networkcard, open Observer. If the probe instance shows (Wireless) behind it, then itis correctly configured.
Figure 3: Probe instance using wireless adapter
If the probe instance shows (Ethernet), then either the network card driverwas not correctly installed or the probe instance is not configured to usethat network card. You can confirm the correct network card is selected, bychoosing Actions > Select Network Adapter Card.
After completing this task:
♦ License your probe by following the instructions in Licensing and updating(page 21).
♦ If your wireless network uses an encryption key, you must add theencryption key information. See Configuring the probe’s adapter speed,ToS/QoS precedence, and statistics sampling (page 33).
Installing a third-party USB wireless adapterYou can capture wireless 802.11 traffic on systems lacking built-in wireless byinstalling a third-party USB wireless adapter. Wireless access point statistics andother features become usable as well. Installing a special driver on your USBwireless adapter is necessary.
Prerequisite(s):
The USB wireless adapter is only supported on systems running Windows Vista or7 (32- or 64-bit).
Caution: For some wireless adapters you must install the software forthe USB wireless adapter before you attach the adapter to your computer.This is not an Observer requirement, but one of the wireless adapter. If youattach the USB wireless adapter before installing the software, unplug theUSB adapter, uninstall the software, restart your system, and then proceedwith step 1.
Note: If using a Belkin N600DB USB wireless adapter, only revision number“F9L1101v1” is compatible. These adapters have a Broadcom chipset. The
How to install or upgrade the software20 Multi Probe (23 Feb 2018) — Archive/Non-authoritative version
second revision, “F9L1101v2” does not have a Broadcom chipset and isincompatible.
1. Install the software that came with your USB wireless adapter.2. Insert the USB wireless adapter into your system.3. Choose Control Panel > Network and Sharing Center > Change adapter
settings and then select your USB wireless adapter. Right-click and chooseProperties.
4. From the Networking tab, click Install > Service > Add. Click Have Disk andlocate this file:NiNdisMon.inf
64-bit: C:\Program Files\Observer\DRIVERS\Wireless
32-bit:C:\Program Files(x86)\Observer\DRIVERS\Wireless5. Click OK to install the software as a Windows service.6. Restart your system.
Restarting allows the software and adapter to be fully recognized by yoursystem and the Windows service to start. Observer will not be able to use thewireless adapter until you restart.
7. Start Observer, select the probe instance you want to associate with the USBwireless adapter.
9. Choose the USB wireless adapter you just installed.
The probe instance is now configured to use the USB wireless adapter. You canconfirm this because the word "[Wireless]" appears after the probe instancename, and the Wireless 802.11 tab of the probe instance is visible.
Installing Windows updates and updating virus protectionFrom time to time Microsoft releases updates for the operating system usedfor your probe or your virus protection software vendor updates their virusdefinitions. You should apply those updates as soon as feasible, however, youshould always apply the updates manually.
We do not recommend that you allow Windows to automatically install theupdates and restart the system. By manually applying the updates you ensurethat the system restarts properly and that the probe starts correctly whetherrunning as a Windows service or as an application.
For your anti-virus software, follow these guidelines:
♦ Ensure TCP ports 25901 and 25903 are open. All Observer Platformproducts communicate on these ports.
♦ Ensure UDP ports 25901 and 25903 are open if you use OMS.♦ For all probes, disable any scanning of the Observer installation directory
(typically C:\Program Files\Observer) and of D: (RAID) drive asscanning greatly diminishes the performance of writing data to disk.
♦ The performance of the operating system may be greatly diminishedwhen using anti-virus software.
Upgrading the probe softwareChapter 2: Multi Probe Software 21
Upgrading the probe softwareObserver and probe software must be within the same major release. This mayrequire you to upgrade your probe software.
If the version of Observer or GigaStor that you are upgrading was installed ona 32-bit operating system and you have upgraded the operating system to 64-bit, the installer upgrades existing installation to 64-bit version keeping the samepath.
Version 17 requires a 64-bit operating system. If you previously installed a 32-bitversion, the same installation directory is used.
Use information from this section when upgrading to a new major version of theprobe software. Before upgrading have the following available:
♦ Latest probe software installation program. Download the latestversion from the VIAVI http://update.viavisolutions.com/latest/ObserverSetupx64.exe update site.
♦ Your probe license information.
Note: If you are using encryption keys with Observer, you can continueto use your existing keys or transfer them to your probe (and analyzer) asnecessary.
Upgrading the probe software directlyOn the probe:
1. Start the Observer installation program.2. Follow the on-screen instructions and choose your probe type.3. After the installer completes, restart the system.
New major builds may have new drivers or other files that require a restart.4. Connect the probe to an Observer.
FAQ: Licensing and updatingSome customer concerns deal with licensing and updating issues. Explore thisgood resource for licensing and updating help, or call the Technical Supportdepartment for further assistance.
How to license Observer and GigaStorTo license and activate a compatible GigaStor, Observer, or Probe:2. After launching the application in DEMO mode, click the Help menu and
select License Observer.3. Click the Enter Name button in the lower left corner.4. Type into the Contact/Department and Company boxes exactly what is
listed in your license document.5. Click OK, and then click Accept on the confirmation dialog.6. Ensure the Identification Number matches the number on your license
document. If they do not match, click Re-Type Name? to correct anymistakes.
Upgrading the probe software22 Multi Probe (23 Feb 2018) — Archive/Non-authoritative version
7. Type the license number, from your license document, into the LicenseNumber box.
How to update your licenseIf Observer or GigaStor is already licensed and you need to modify, update, orchange that license, you can do so.
Prerequisite(s):
This task requires you have already licensed (page 21) your Observer orGigaStor.
This task cannot be completed if the license to your Observer or GigaStor ismanaged by OMS. Instead, refer to How to edit an asset license in the OMS UserGuide.
Updating your license refers to changing, editing, or updating the license that isalready applied to your product. Some reasons for needing to do this can include:
♦ Activating a new license. The new license might provide different orincreased functionality over your existing license, like increased datastorage for a GigaStor Software Edition (GSE).
♦ Changing a license. Perhaps you accidentally applied the wrong license toyour product and need to change it.
To update a license:2. Click OK to confirm you want to re-license.3. Type the license number, from your license document, into the License
Number box.4. Click the Re-Type Name? button in the lower left corner.5. Type into the Contact/Department and Company boxes exactly what is
listed in your license document.6. Click OK, and then click OK on the confirmation dialog.
You successfully updated your license. Observer begins using the license the nexttime Observer is launched.
Close and restart Observer for the new license to take effect. You may needto coordinate a suitable time to do so if restarting would affect many users orsignificantly interrupt your data collection.
Why is my license number not working?Each license number is case-sensitive, so be sure to type it in exactly the way itwas given to you. Also, if you copy-pasted the license number into the activationprompt, be sure you did not introduce a leading or trailing space character—those are not part of your license number.
Ensure you are licensing the correct version of Observer. License numbers areversion-specific. License numbers work within equal major version numbers ofthe product only. For example, an 17.0 license can be used to activate 17.x versionsbut not 16.1, 16.0, 15.1, 15.0, etc.
Could I have my license re-sent to me?Yes. If you lost the original information containing your license number, pleasecontact us so we can resend your license document(s).
Upgrading the probe softwareChapter 2: Multi Probe Software 23
What type of license do I have?The type of license you have is described in your license document. Eachlicense document contains a license number, and the document describes whichsoftware version the license number applies to. If it does not, or you notice anyother error, please call our support team for assistance.
Should I uninstall Observer before updating it?If you wish to update your existing Observer software to a newly releasedversion within the same major release number, you do not need to uninstall yourexisting version for the update process to succeed. Simply install the new versionover the old.
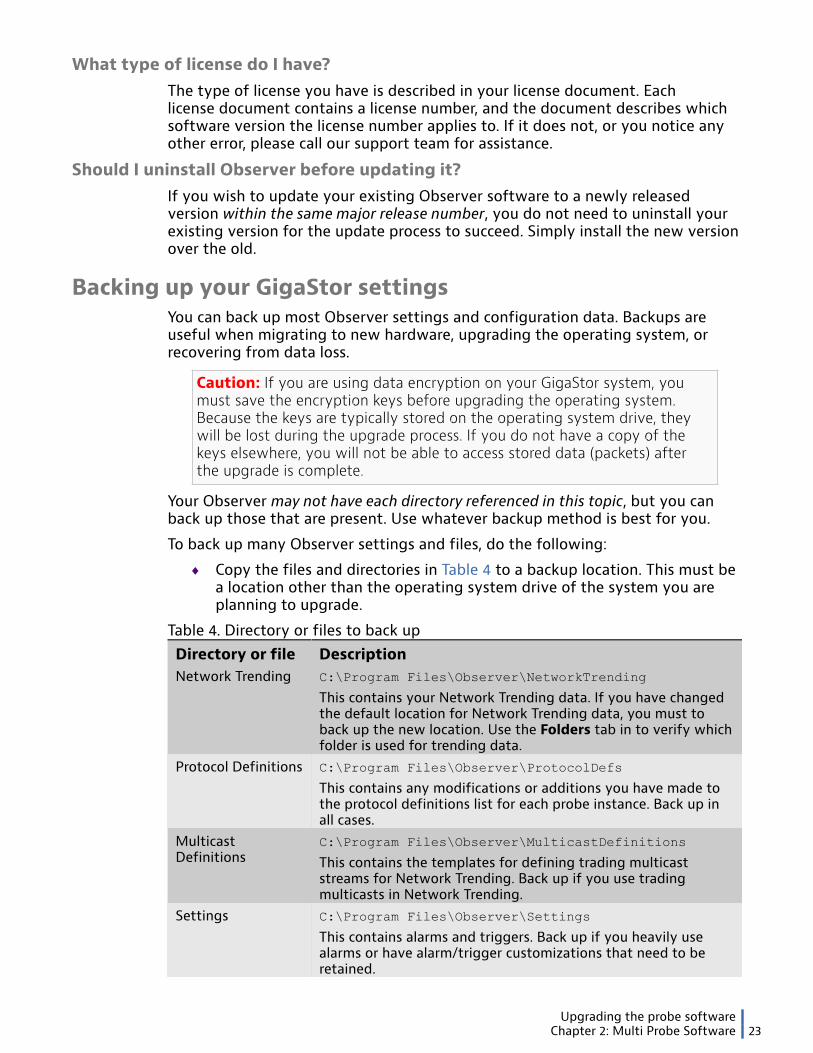
Backing up your GigaStor settingsYou can back up most Observer settings and configuration data. Backups areuseful when migrating to new hardware, upgrading the operating system, orrecovering from data loss.
Caution: If you are using data encryption on your GigaStor system, youmust save the encryption keys before upgrading the operating system.Because the keys are typically stored on the operating system drive, theywill be lost during the upgrade process. If you do not have a copy of thekeys elsewhere, you will not be able to access stored data (packets) afterthe upgrade is complete.
Your Observer may not have each directory referenced in this topic, but you canback up those that are present. Use whatever backup method is best for you.
To back up many Observer settings and files, do the following:
♦ Copy the files and directories in Table 4 to a backup location. This must bea location other than the operating system drive of the system you areplanning to upgrade.
Table 4. Directory or files to back upDirectory or file DescriptionNetwork Trending C:\Program Files\Observer\NetworkTrending
This contains your Network Trending data. If you have changedthe default location for Network Trending data, you must toback up the new location. Use the Folders tab in to verify whichfolder is used for trending data.
Protocol Definitions C:\Program Files\Observer\ProtocolDefs
This contains any modifications or additions you have made tothe protocol definitions list for each probe instance. Back up inall cases.
MulticastDefinitions
C:\Program Files\Observer\MulticastDefinitions
This contains the templates for defining trading multicaststreams for Network Trending. Back up if you use tradingmulticasts in Network Trending.
Settings C:\Program Files\Observer\Settings
This contains alarms and triggers. Back up if you heavily usealarms or have alarm/trigger customizations that need to beretained.
Creating a probe instance24 Multi Probe (23 Feb 2018) — Archive/Non-authoritative version
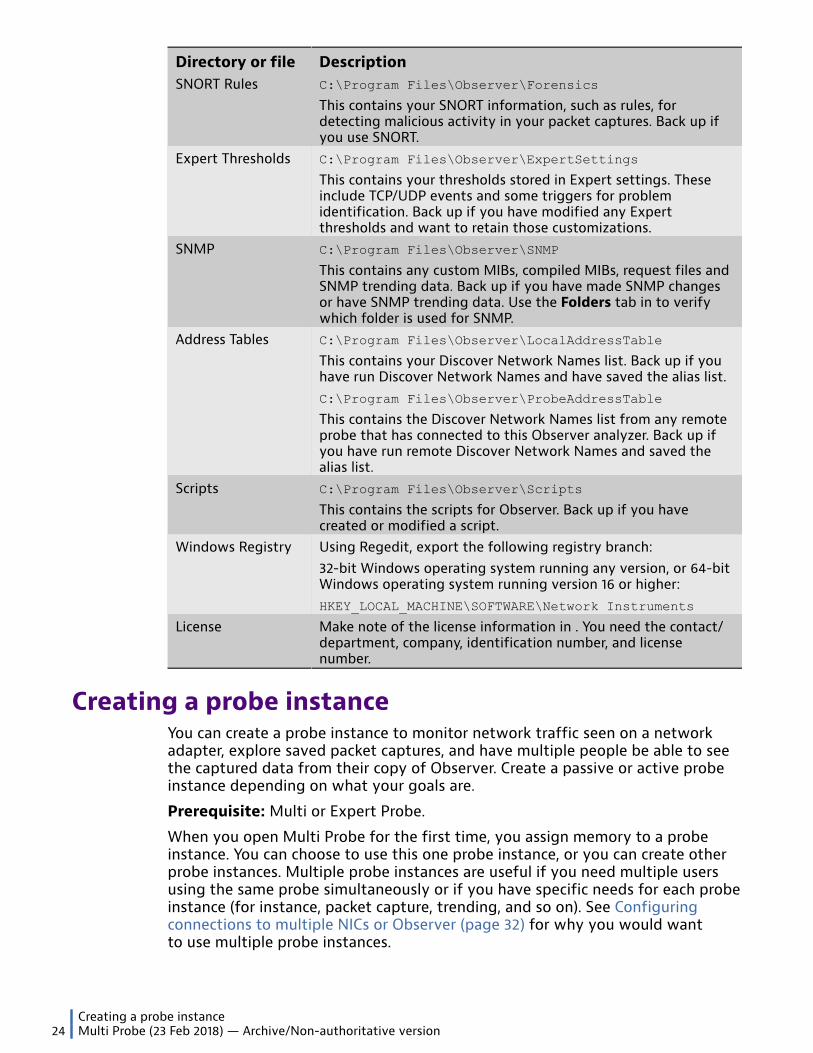
Directory or file DescriptionSNORT Rules C:\Program Files\Observer\Forensics
This contains your SNORT information, such as rules, fordetecting malicious activity in your packet captures. Back up ifyou use SNORT.
Expert Thresholds C:\Program Files\Observer\ExpertSettings
This contains your thresholds stored in Expert settings. Theseinclude TCP/UDP events and some triggers for problemidentification. Back up if you have modified any Expertthresholds and want to retain those customizations.
SNMP C:\Program Files\Observer\SNMP
This contains any custom MIBs, compiled MIBs, request files andSNMP trending data. Back up if you have made SNMP changesor have SNMP trending data. Use the Folders tab in to verifywhich folder is used for SNMP.
Address Tables C:\Program Files\Observer\LocalAddressTable
This contains your Discover Network Names list. Back up if youhave run Discover Network Names and have saved the alias list.C:\Program Files\Observer\ProbeAddressTable
This contains the Discover Network Names list from any remoteprobe that has connected to this Observer analyzer. Back up ifyou have run remote Discover Network Names and saved thealias list.
Scripts C:\Program Files\Observer\Scripts
This contains the scripts for Observer. Back up if you havecreated or modified a script.
Windows Registry Using Regedit, export the following registry branch:32-bit Windows operating system running any version, or 64-bitWindows operating system running version 16 or higher:HKEY_LOCAL_MACHINE\SOFTWARE\Network Instruments
License Make note of the license information in . You need the contact/department, company, identification number, and licensenumber.
Creating a probe instanceYou can create a probe instance to monitor network traffic seen on a networkadapter, explore saved packet captures, and have multiple people be able to seethe captured data from their copy of Observer. Create a passive or active probeinstance depending on what your goals are.
Prerequisite: Multi or Expert Probe.
When you open Multi Probe for the first time, you assign memory to a probeinstance. You can choose to use this one probe instance, or you can create otherprobe instances. Multiple probe instances are useful if you need multiple usersusing the same probe simultaneously or if you have specific needs for each probeinstance (for instance, packet capture, trending, and so on). See Configuringconnections to multiple NICs or Observer (page 32) for why you would wantto use multiple probe instances.

Creating a probe instanceChapter 2: Multi Probe Software 25
To set up a probe instance, follow these steps:
1. Do one of the following:
● On the probe: Click the Adapters and Redirection tab.● In Observer: Select a probe instance, right-click and choose Administer
Selected Probe. Then click the Adapters and Redirection tab.2. In the upper left, click New Instance. The Edit Probe Instance wizard opens.
If the New Instance button is grayed out, it probably means you do not haveenough Observer-allocated memory to add another instance.
If you get a message that says that there is not enough reserved memoryto create a probe instance, you must reduce the amount of memory used byanother probe instance. By default all of the reserved memory on a GigaStoris assigned to the “Instance 1” active instance. By releasing some of thereserved memory you re-allocate memory from one probe to the pool ofreserved memory from which you can create other probe instances, includingpassive probe instances on the GigaStor. Click the Configure Memory buttonand reduce the amount of memory for the packet capture buffer.
You must have a minimum of 256 MB RAM to run the probe with a singleinstance, plus 12 MB for each additional probe instance. See Setting the totalsystem memory reserved for probes (page 33) for details on allocatingmemory for Observer probes.
3. Ensure “Probe” is selected in the Instance type. Type a name and descriptionand click Next.
4. Choose an appropriate capture buffer size given the local system's availablememory and how much traffic you plan on capturing from the given network.
Statistical reporting uses different memory—and much less of it—than packetcapture.
Although it is possible to customize the amounts of memory used byvarious Observer statistical displays (by choosing a statistics memoryconfiguration), for most situations the defaults work perfectly well. Foradditional information, see Customizing statistics and capture buffers forprobe instances (page 31).a. If you need to create your own memory configuration, click New. The New
Statistics Memory Configuration window opens.b. Type a name and choose a default memory configuration to use. Click
Finish. After choosing the memory configuration, you can change how thememory is allocated.
c. Select your newly created memory configuration and click Edit. The EditStatistics Memory Configuration window opens.
d. Choose your network type. For each Observer statistic, choose how muchmemory is allocated for it. Click OK.
e. Click Next to continue, and the Select Network Adapter and Redirectionconfiguration dialog is displayed
5. Ensure the correct network adapter is selected and type the IP address ofyour Observer. Click Finish.
Connecting to a Probe26 Multi Probe (23 Feb 2018) — Archive/Non-authoritative version
How to use additional storage volumes on the GigaStoractive instance
When expanding your RAID array beyond 256 TB of usable disk space, you mustadd the additional volumes to your GigaStor active instance.
Prerequisite: Expert Probe
The maximum NTFS disk volume is 256 TB, but with a GigaStor you can havemore storage than that by using the expanded disk arrays or striping throughWindows.
1. On the GigaStor probe, click the GigaStor Instances tab.2. Select the Use additional storage volumes option and click Configure.3. In the message box that appears, click Yes.4. Select the additional storage volumes you want to assign to your active probe
instance, and click OK.5. In the message box that appears, click Yes.
The additional storage is allocated. This may take a few moments.
Connecting to a ProbeYou can connect to a probe from multiple direction: from or to a differentObserver analyzer, to its own probe instance (connect to itself), and change thenetwork adapter that is monitored on each probe instance.
How to change the monitored network adapterIf your probe has multiple network cards in it, you can choose which card youwant to monitor.
This section applies to all probes and all versions of them, including Single Probe,Multi Probe, and Expert Probe on VIAVI or third party hardware.
Note: If you have a network card in your system, but it is not being seenor recognized by Observer, follow the instructions in No network adapteravailable (page 87).
Tip! If you are seeing only broadcast traffic, you do not have the correctnetwork card selected or you do not have your switch port configuredcorrectly as a SPAN/mirror port. Change the network adapter you aremonitoring or configure the SPAN/mirror port.
♦ When choosing the monitored adapter from within Observer for all probeversions:
1. In the probes list, select the probe instance.2. Choose .
The Select Network Adapter window appears.3. Select the network adapter you want to monitor, and click Select.♦ When choosing the monitored adapter on the probe for Multi Probe and
Expert Probe:

Connecting to a ProbeChapter 2: Multi Probe Software 27
1. Click Adapters and Redirection.2. Select your probe instance and click Configure Adapter/Redirection.
The Edit Probe Instance window appears.3. In the Selected Network Adapter area, change the network card you are
monitoring.
The probe instance is now using the newly selected adapter.
Connecting to a probe for the first time from Observer2. Click New to add the probe to the Probe Administration and Redirection list.3. Type the IP address that you assigned to the probe and click OK. You may
leave the other fields blank. If you type a name, the name will change afterObserver connects to the probe. The probe appears in the list of availableprobes.
4. Select the probe and then click Redirect Selected Probe.5. Select the probe instance and click Redirect Selected Instance.6. Choose the “Redirect to this Observer” option, then click the Redirect button.
Within 30 seconds the probe will connect with the analyzer.
Probe redirection can be password protected or disabled. Please seeConnecting the Multi Probe or Expert Probe to an Observer (page 27)for details. If the probe is not connecting, see A probe is not connecting tothe analyzer or vice versa (page 86). After the probe is connected, seeConfiguring the probe’s adapter speed, ToS/QoS precedence, and statisticssampling (page 33).
7. Close the Probe Instance Redirection window.
Connecting the Multi Probe or Expert Probe to an ObserverPrerequisite: Multi or Expert Probe.
There are two ways to connect the probe to an Observer. The method describedhere is from the perspective of the probe. All actions are done on the probe itself.
Each probe instance can be connected to only one Observer at a time. Connectingthe probe instance with the analyzer is called “redirecting” it. This is because theprobe instance may not be connected to any Observer or it may be connected toa different Observer than the one you want to connect it to. The connection canbe done from within the analyzer or from the probe. This section describes howto redirect a probe instance from the probe and assumes that the probe softwareis running and that you already have a probe instance.
1. Click the Adapters and Redirection tab.2. Select the probe instance you want to redirect and click the Configure
Adapter/Redirection button at the top. The Edit Probe Instance windowopens.
3. Select the “Redirect to a specified IP address or DNS name” option andprovide the IP address or DNS name. When the probe instance is connectedthe “Redirected to” column lists the IP address of Observer system. If the
Redirecting a probe instance28 Multi Probe (23 Feb 2018) — Archive/Non-authoritative version
probe is not connecting, see A probe is not connecting to the analyzer or viceversa (page 86).
4. After the probe is connected, see Configuring the probe’s adapter speed, ToS/QoS precedence, and statistics sampling (page 33).
Connecting to a probe instance from an Observer analyzerPrerequisite: Multi or Expert Probe.
Probe instances can be redirected from one Observer to another or disconnectedfrom any analyzer. This is done from Observer .2. Select the probe instance you want to redirect and click the Redirect
Selected Probe Instance button at the bottom. The Edit Probe Instancewindow opens.
3. If this is the first time you are connecting to the probe from Observer , youmust add the probe to your list. See Connecting to a probe for the first timefrom Observer (page 27).
4. If the probe is not connecting, Probe redirection might be password protectedor disabled. Please see Connecting the Multi Probe or Expert Probe to anObserver (page 27) for details. If the probe is not connecting, see A probeis not connecting to the analyzer or vice versa (page 86).
5. After the probe is connected, see Configuring the probe’s adapter speed, ToS/QoS precedence, and statistics sampling (page 33).
Connecting the probe to an ObserverThere are two ways to connect the probe to an Observer. The method describedhere shows you from the perspective of the probe. The second way is describedin Connecting the Multi Probe or Expert Probe to an Observer (page 27). Allactions are done on the probe itself.
1. Choose Options > Probe Redirection Settings. The Probe RedirectionSettings dialog opens.
2. Use Table to complete the settings. If the probe is not connecting, see Aprobe is not connecting to the analyzer or vice versa (page 86).
Observer IP address Type the address of Observer you want this probe to connect to.Allow Proberedirection forremote users
Allows remote users to redirect the probe to their Observer. Ifyou want the probe to be able to connect to only one Observer,leave this option unchecked.
User name By default any user can connect to the probe and no password isrequired.
Password Password for the user account.
3. After the probe is connected, see Configuring the probe’s adapter speed, ToS/QoS precedence, and statistics sampling (page 33).
Redirecting a probe instanceYour local Observer may already have local probe instances defined, but you canadd numerous remote probes, including GigaStor, too. You must first redirect theremote probe to your local Observer.
Redirecting a probe instanceChapter 2: Multi Probe Software 29
A probe may have multiple probe instances, which are useful if you need multipleusers using the same probe simultaneously or if you have specific needs for eachprobe instance (for instance, packet capture, trending, and so on). When youconnect to a probe, ensure you select the probe instance you need and not onebeing used by someone else.
Note: Probe redirection can either be password protected or disabled,depending on the target probe.
To redirect a probe instance, complete the following steps:2. Do one of the following:
● If you see a remote probe instance you want to redirect, skip directly tostep 6.
● If your list is empty or missing the remote probe instance you want toredirect, proceed to step 3.
3. Click New.
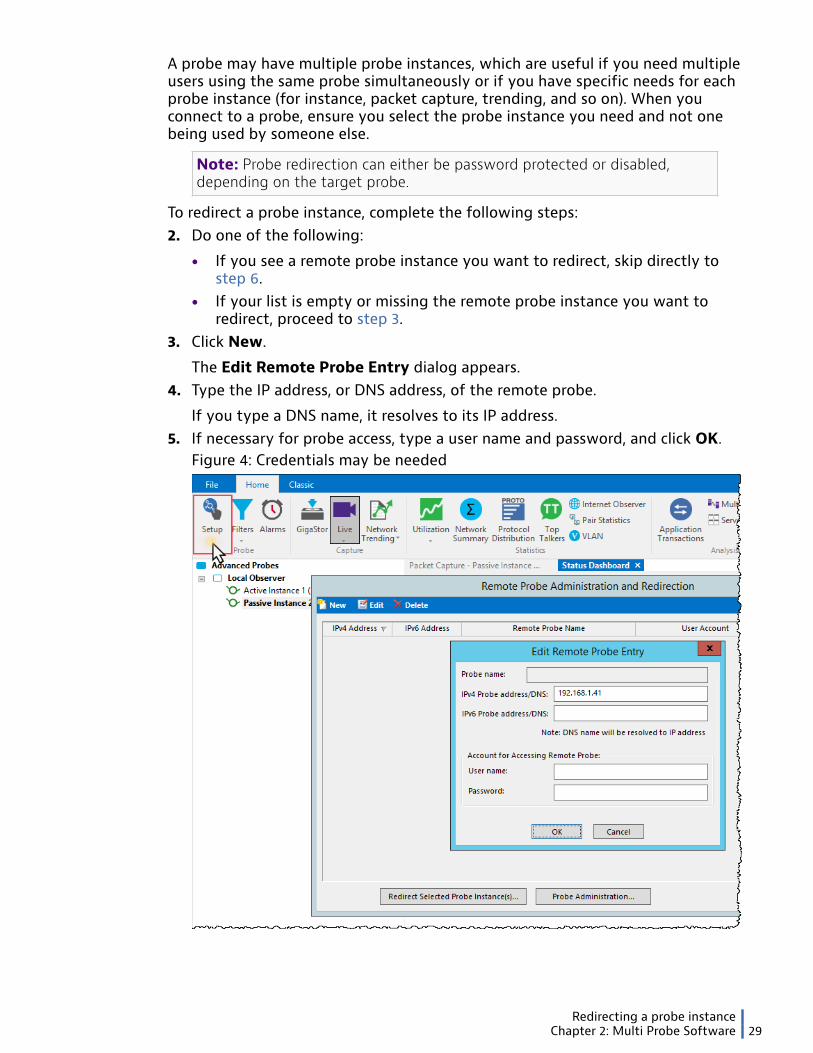
The Edit Remote Probe Entry dialog appears.4. Type the IP address, or DNS address, of the remote probe.
If you type a DNS name, it resolves to its IP address.5. If necessary for probe access, type a user name and password, and click OK.
Figure 4: Credentials may be needed

Configuring a probe’s name and other probe options30 Multi Probe (23 Feb 2018) — Archive/Non-authoritative version
6. Select the remote probe instance from the list, and click Redirect SelectedProbe Instance(s).
Allow time for the remote probe to redirect. How long this operation can takeis limited by a timeout countdown.
The probe instances of the remote probe are shown.7. Select a probe instance from the list, and click Redirect Selected Instance.8. Select the Redirect to this Observer, and click the Redirect button.
Figure 5: Redirecting Probe Instance
9. Close the Probe Instance Redirection window.
If the operation succeeds, the remote probe instance is now redirected to thelocal Observer. Now you can use the remote probe instance just as you would if itwas running on your local machine.
Configuring a probe’s name and other probe optionsSet the probe network adapter speed, reserve system memory for probes,configure connections to multiple network adapters, set “always on” trafficcapture, customize statistic and capture buffers, and more.
Prerequisite(s):
These steps assume you are viewing the probe interface, which is the only choicewhen using Expert Probe software. But if you are using a GigaStor, ensure thatyou are viewing the probe interface (page 41).

Configuring a probe’s name and other probe optionsChapter 2: Multi Probe Software 31
The probe has many options that you can configure.
1. Choose Options > Probe Options. The Probe Options dialog opens, whichlets you configure the probe.
2. Use this table to complete the settings.Setting Description
Probe name Allows you to specify a name for the probe which appearsin Observer probe list. The default name is a random mixof numbers and letters. We suggest renaming the probe tosomething meaningful to you. The name may be its physicallocation or any other standard you choose. The probe nameis not the same as the probe instance name, although with aSingle Probe you only have one probe instance. You define theprobe instance name elsewhere. See Creating a probe instance(page 24).
Network Trendingfolder
Allows you to specify where the network trending datais saved. The default is C:\Program Files\Observer\NetworkTrending. Unless you have a specific reason to useanother directory, we suggest using the default.
Folder for GigaStor Allows you to specify where the GigaStor and network packetdata will be saved. The default is C:\Program Files\Observer\Data if a software install or non-GigaStor probe or D:\Data ifa GigaStor hardware appliance. Unless you have a specific reasonto use another directory, we suggest using the default.
Maximum IP DNSresolution entries
Defines the maximum number of DNS entries the probe shouldmaintain. The probe will keep up to the number of entriesdefined or what the probe can maintain in 10 MB of storagespace, whichever is less. The probe keeps the first 10,000 entries(or whatever amount you define) it sees; it does not keep arolling list of the last 10,000. After the limit is reached, no moreentries are kept. They are discarded.
Run Probe asWindows Service
Select this option if you want to run the probe as a Windowsservice. This allows the probe to start without requiring a userto log in and start the probe. The probe starts whenever thesystem starts, which can be especially important for a remoteprobe. The change takes effect on the next system restart.When running the probe as a Windows service, some options areavailable to you that you do not have when running the probeas an application. Specifically, you can set Networking Trendingand see CPU load of each probe instance. In both modes, youcan configure memory management, configure security for eachprobe instance, reserve Windows memory for the probe, adjustfor time drifts through clock synchronization, and enable theprobe to be a virtual TAP.
View certificatesfrom otherObserver assets
Click the Certificates button to view trusted, untrusted, andpending trust, certificates that allow secure asset-to-assetcommunication. See Understanding the certificate trust modelfor details.
Customizing statistics and capture buffers for probeinstances
Prerequisite: Multi or Expert Probe.
Configuring a probe’s name and other probe options32 Multi Probe (23 Feb 2018) — Archive/Non-authoritative version
Before changing any of the buffer sizes, you should understand how any changesyou make affects the probe. See How a probe uses RAM (page 47).
♦ To change memory allocation for probe instances, see Running (page52)Observer (page 52) with reserved memory (page 52).
♦ To fine-tune the Statistics Memory Configuration, see How to adjust thestatistical buffer.
Configuring probes to collect data even when not connectedto an analyzer
Probes (and probe instances) can be configured to collect data only when youtell it to—including manually starting/stopping the collection, having collectionalways running, or based on a schedule. The schedule and settings are savedwith the probe instance. This means if you choose to have packet capture alwaysrunning or running on a schedule that the probe instance does not need to beconnected to an Observer.
To configure when packet capture should run, complete these steps:
1. In Observer, select a probe instance in the Probes list.3. Click the Settings button. The Packet Capture Settings window opens.4. Click the Schedule tab.5. Choose the schedule you want (Always, daily, or specific days).6. If you want to control the capture buffer’s size, click the Capture Options
tab. The data is saved on the probe in C:\Program Files\Observer\Data.
Setting the probe’s time clock synchronization settingsAt times your capture card drivers time clock may drift. They can be synchronizedwith the system clock, if you wish. Unless you notice a reason to enable thisfeature, we recommend that you do not synchronize your capture card’s timeclock.
Some Other things to consider:
♦ The capture card synchronizes itself with the system clock at when thesystem starts.
♦ Generally, you are interested in relative time between packets, not theactual time a packet was seen.
1. Do one of the following:
● On the probe: Click the Synchronization tab.● In Observer: Select a probe instance, right-click and choose Administer
Selected Probe. Then click the Synchronization tab.2. Click the Edit Schedule button.3. Choose when and how you want the capture card’s time clock to synchronize
with the system clock and click OK.
Configuring connections to multiple NICs or ObserverPrerequisite: Multi or Expert Probe.

Configuring a probe’s name and other probe optionsChapter 2: Multi Probe Software 33
With a Multi Probe, you can configure the probe to view multiple networks ifmultiple NICs are installed on the local system and to provide multiple Observerwith views of the local network interfaces.
The probe accomplishes these capabilities by allowing multiple instances of itself.A probe instance is a virtual probe with attributes that define:
♦ Which network interface on the local system to capture data from.♦ Which Observer (local or remote) to direct the data to.
Setting the total system memory reserved for probesPrerequisite: Multi or Expert Probe.
Memory use is an important and vital part of using an Observer probesuccessfully. Before changing any of the reserved memory, you shouldunderstand how any changes you make affects the probe.
Configuring the probe’s adapter speed, ToS/QoS precedence,and statistics sampling
After connecting the probe instance to Observer Analyzer, there still may besome additional configuration that you must do. This is completely dependent onyour network environment and your needs.
This section applies to all probes and all versions of them, including Single Probe,Multi Probe, and Expert Probe on VIAVI or third party hardware.
In Observer :
1. Select a probe instance in the Probes list.2. Right-click and choose Probe or Device Properties.3. Use the following tabs to further configure the probe for your environment.
Not all of these tabs are present at all times. What tabs are visible dependson the type of probe you are configuring. For instance, the Gigabit tab is onlyvisible when you are configuring a Gigabit Probe. For details about the fieldson each tab, see the Configuring a probe’s name and other probe options(page 30).
Tab DescriptionGeneral Set the statistics sampling divider and MPLS settings. For field
descriptions, see Probe Properties field-level descriptions (page34).
Adapter speed Verify that the adapter speed is registering correctly. Changethe adapter speed if necessary. Changing the adapter speedhere may be useful and necessary, because statistics, graphs,and reports generated by Observer are set using the adapterspeed as the maximum. If, for some reason,Observer is not ableto correctly identify your adapter speed your reports may beinaccurate. For field descriptions, see Probe Properties field-leveldescriptions (page 34).
ToS/QoS Ensure these settings match your needs paying particularattention to the IP precedence bit for the ToS/QoS of yournetwork. What you set here affects how the Observer analyzerdisplays information about VoIP, NetFlow, sFlow, and capture
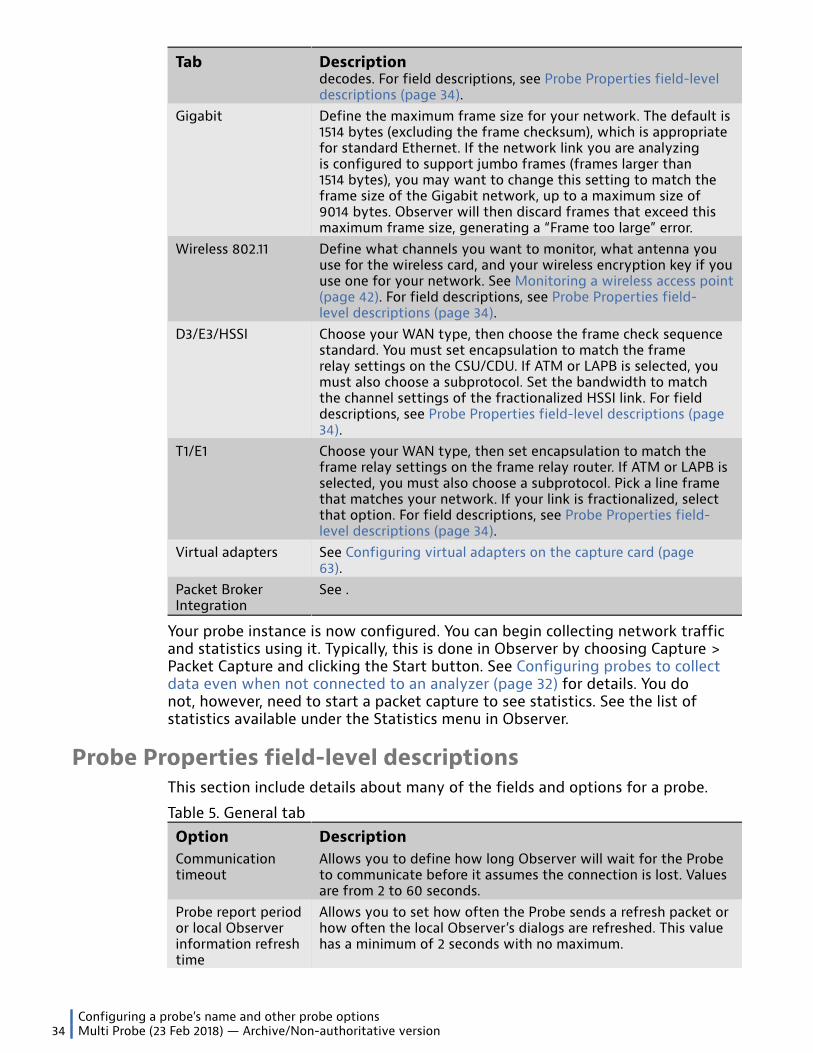
Configuring a probe’s name and other probe options34 Multi Probe (23 Feb 2018) — Archive/Non-authoritative version
Tab Descriptiondecodes. For field descriptions, see Probe Properties field-leveldescriptions (page 34).
Gigabit Define the maximum frame size for your network. The default is1514 bytes (excluding the frame checksum), which is appropriatefor standard Ethernet. If the network link you are analyzingis configured to support jumbo frames (frames larger than1514 bytes), you may want to change this setting to match theframe size of the Gigabit network, up to a maximum size of9014 bytes. Observer will then discard frames that exceed thismaximum frame size, generating a “Frame too large” error.
Wireless 802.11 Define what channels you want to monitor, what antenna youuse for the wireless card, and your wireless encryption key if youuse one for your network. See Monitoring a wireless access point(page 42). For field descriptions, see Probe Properties field-level descriptions (page 34).
D3/E3/HSSI Choose your WAN type, then choose the frame check sequencestandard. You must set encapsulation to match the framerelay settings on the CSU/CDU. If ATM or LAPB is selected, youmust also choose a subprotocol. Set the bandwidth to matchthe channel settings of the fractionalized HSSI link. For fielddescriptions, see Probe Properties field-level descriptions (page34).
T1/E1 Choose your WAN type, then set encapsulation to match theframe relay settings on the frame relay router. If ATM or LAPB isselected, you must also choose a subprotocol. Pick a line framethat matches your network. If your link is fractionalized, selectthat option. For field descriptions, see Probe Properties field-level descriptions (page 34).
Virtual adapters See Configuring virtual adapters on the capture card (page63).
Packet BrokerIntegration
See .
Your probe instance is now configured. You can begin collecting network trafficand statistics using it. Typically, this is done in Observer by choosing Capture >Packet Capture and clicking the Start button. See Configuring probes to collectdata even when not connected to an analyzer (page 32) for details. You donot, however, need to start a packet capture to see statistics. See the list ofstatistics available under the Statistics menu in Observer.
Probe Properties field-level descriptionsThis section include details about many of the fields and options for a probe.
Table 5. General tabOption DescriptionCommunicationtimeout
Allows you to define how long Observer will wait for the Probeto communicate before it assumes the connection is lost. Valuesare from 2 to 60 seconds.
Probe report periodor local Observerinformation refreshtime
Allows you to set how often the Probe sends a refresh packet orhow often the local Observer’s dialogs are refreshed. This valuehas a minimum of 2 seconds with no maximum.

Configuring a probe’s name and other probe optionsChapter 2: Multi Probe Software 35
Option DescriptionStatistics report(refresh) period
Allows you to set the statistics display refresh period. This valuehas a minimum of three seconds with no maximum.
Vital signs report(refresh) period
Allows you to set the Network Vital Signs refresh period. Valuesare from 10 to 600 seconds.
Sampling Divider On probes with less processing power, high traffic rates (suchas those typical of gigabit connections) can overwhelm theprobe’s ability to keep up. A sampling divider tells Observer toonly consider one of every n packets when calculating statisticaldisplays, where n is the sampling divider. This setting onlyaffects statistical displays such as Top Talkers, Internet Observer,etc. (packet captures are unaffected). A sampling divider of 2registers every other packet; a sampling divider of 10 registersevery tenth packet. Some statistical displays consider everypacket regardless of this setting. Bandwidth Utilization looks attraffic as whole, so does Wireless Site Survey.
EncapsulatedTraffic Analysis
GRE (Generic Routing Encapsulation) and GTP (GPRS TunnelingProtocol) are two encapsulation protocols that may havebeen deployed on your network. To show the encapsulationIP addresses, leave the box unchecked; to show the nested IPaddresses, check the box. This setting also applies to L2TP andIPv4.
Nortel OEL2 MetroEthernet AnalysisSettings
Choose if frame headers should be analyzed as OEL2 headers.
MPLS AnalysisSettings
Choose whether Observer should auto determine IPv4 and IPv6,what all other traffic is (ATM or Mac Header), and whether touse a four byte pseudowire word. Also choose whether to usethe MAC addresses from encapsulated MPLS header.
Table 6. Parameters tabOption DescriptionNetwork type Displays the probe’s network topology, such as Ethernet, Token
Ring, wireless, and WAN.Network speed Displays the network speed. The distinction here is between
the actual, measured speed of the network and the speed thatthe NIC card, possibly incorrectly, reads from its connection. Forexample, a 10/100Mb NIC card on a 10/100Mb connection to aswitch on a network where all the other stations are running at10Mb will report the network speed as 100Mb. This item is theactual number that the NIC card driver sends Observer, so 10MbEthernet will be reported as 10,000,000. 100Mb Ethernet will bereported as 100,000,000.
NIC card name Displays the name of the card as reported by the NDIS driver tothe registry.
Probe version Displays the probe version used by the local Observer or probe.Number ofadapters
Displays the number of cards the local Observer or probe hasconfigured.
Instance memory(MB) and CaptureBuffer (MB)
Displays the amount of RAM the instance or probe has availablefor statistics and capture buffer. Observer has no limitations onthe amount of RAM that can be used for a buffer. The maximumallowable buffer size is displayed in the Options > SelectedProbe or SNMP Device Properties > Probe Parameters tab.
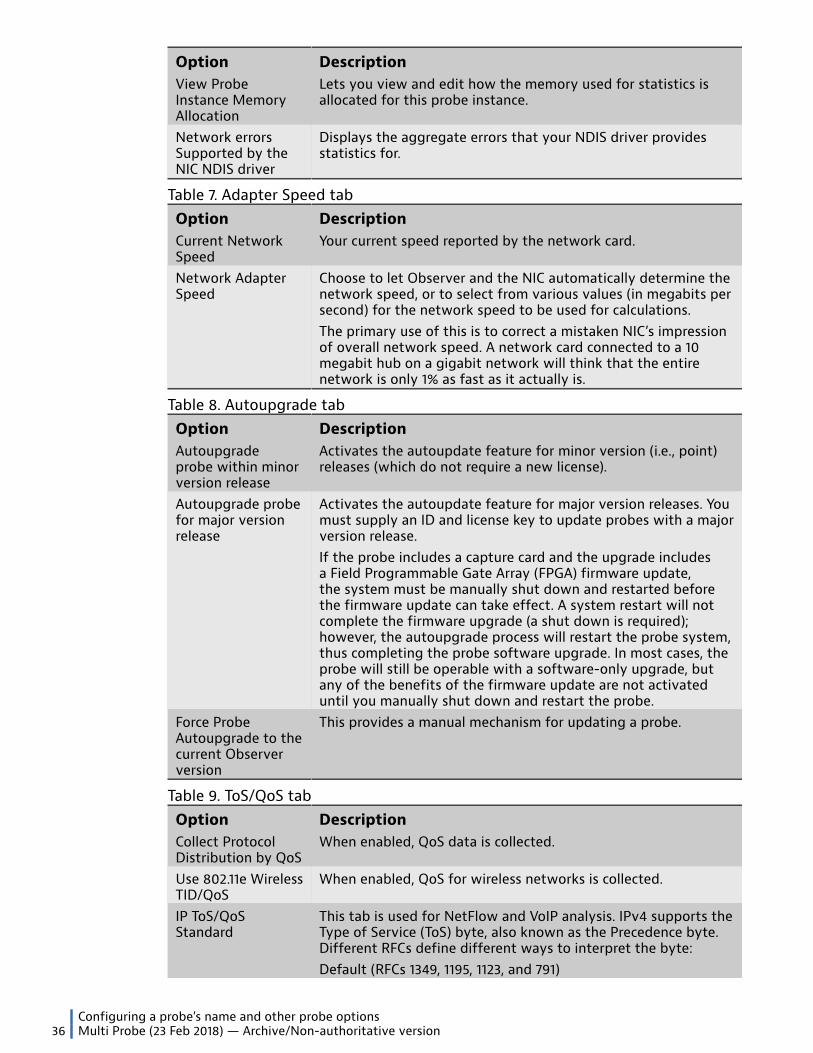
Configuring a probe’s name and other probe options36 Multi Probe (23 Feb 2018) — Archive/Non-authoritative version
Option DescriptionView ProbeInstance MemoryAllocation
Lets you view and edit how the memory used for statistics isallocated for this probe instance.
Network errorsSupported by theNIC NDIS driver
Displays the aggregate errors that your NDIS driver providesstatistics for.
Table 7. Adapter Speed tabOption DescriptionCurrent NetworkSpeed
Your current speed reported by the network card.
Network AdapterSpeed
Choose to let Observer and the NIC automatically determine thenetwork speed, or to select from various values (in megabits persecond) for the network speed to be used for calculations.The primary use of this is to correct a mistaken NIC’s impressionof overall network speed. A network card connected to a 10megabit hub on a gigabit network will think that the entirenetwork is only 1% as fast as it actually is.
Table 8. Autoupgrade tabOption DescriptionAutoupgradeprobe within minorversion release
Activates the autoupdate feature for minor version (i.e., point)releases (which do not require a new license).
Autoupgrade probefor major versionrelease
Activates the autoupdate feature for major version releases. Youmust supply an ID and license key to update probes with a majorversion release.If the probe includes a capture card and the upgrade includesa Field Programmable Gate Array (FPGA) firmware update,the system must be manually shut down and restarted beforethe firmware update can take effect. A system restart will notcomplete the firmware upgrade (a shut down is required);however, the autoupgrade process will restart the probe system,thus completing the probe software upgrade. In most cases, theprobe will still be operable with a software-only upgrade, butany of the benefits of the firmware update are not activateduntil you manually shut down and restart the probe.
Force ProbeAutoupgrade to thecurrent Observerversion
This provides a manual mechanism for updating a probe.
Table 9. ToS/QoS tabOption DescriptionCollect ProtocolDistribution by QoS
When enabled, QoS data is collected.
Use 802.11e WirelessTID/QoS
When enabled, QoS for wireless networks is collected.
IP ToS/QoSStandard
This tab is used for NetFlow and VoIP analysis. IPv4 supports theType of Service (ToS) byte, also known as the Precedence byte.Different RFCs define different ways to interpret the byte:Default (RFCs 1349, 1195, 1123, and 791)
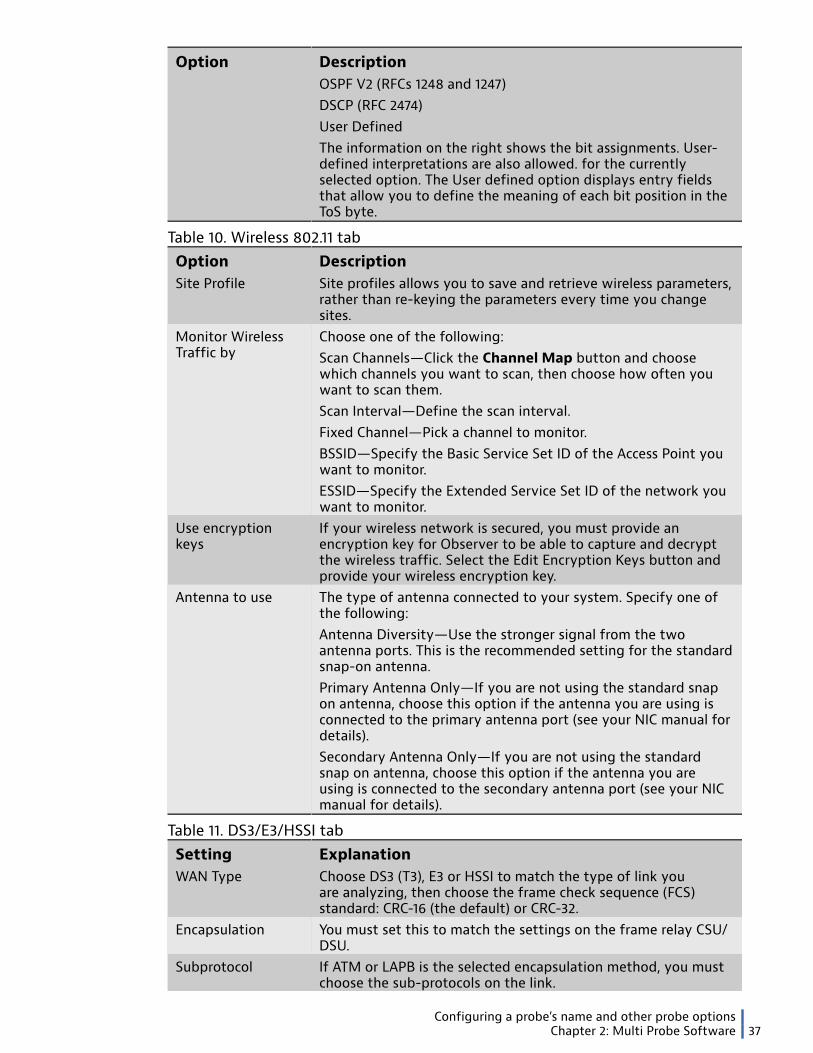
Configuring a probe’s name and other probe optionsChapter 2: Multi Probe Software 37
Option DescriptionOSPF V2 (RFCs 1248 and 1247)DSCP (RFC 2474)User DefinedThe information on the right shows the bit assignments. User-defined interpretations are also allowed. for the currentlyselected option. The User defined option displays entry fieldsthat allow you to define the meaning of each bit position in theToS byte.
Table 10. Wireless 802.11 tabOption DescriptionSite Profile Site profiles allows you to save and retrieve wireless parameters,
rather than re-keying the parameters every time you changesites.
Monitor WirelessTraffic by
Choose one of the following:Scan Channels—Click the Channel Map button and choosewhich channels you want to scan, then choose how often youwant to scan them.Scan Interval—Define the scan interval.Fixed Channel—Pick a channel to monitor.BSSID—Specify the Basic Service Set ID of the Access Point youwant to monitor.ESSID—Specify the Extended Service Set ID of the network youwant to monitor.
Use encryptionkeys
If your wireless network is secured, you must provide anencryption key for Observer to be able to capture and decryptthe wireless traffic. Select the Edit Encryption Keys button andprovide your wireless encryption key.
Antenna to use The type of antenna connected to your system. Specify one ofthe following:Antenna Diversity—Use the stronger signal from the twoantenna ports. This is the recommended setting for the standardsnap-on antenna.Primary Antenna Only—If you are not using the standard snapon antenna, choose this option if the antenna you are using isconnected to the primary antenna port (see your NIC manual fordetails).Secondary Antenna Only—If you are not using the standardsnap on antenna, choose this option if the antenna you areusing is connected to the secondary antenna port (see your NICmanual for details).
Table 11. DS3/E3/HSSI tabSetting ExplanationWAN Type Choose DS3 (T3), E3 or HSSI to match the type of link you
are analyzing, then choose the frame check sequence (FCS)standard: CRC-16 (the default) or CRC-32.
Encapsulation You must set this to match the settings on the frame relay CSU/DSU.
Subprotocol If ATM or LAPB is the selected encapsulation method, you mustchoose the sub-protocols on the link.

How to encrypt captured data at rest38 Multi Probe (23 Feb 2018) — Archive/Non-authoritative version
Setting ExplanationFractionalized Check if your link is configured for fractionalized operation.
Fractionalized DS3 and E3 are not supported.Bandwidth (HSSI) Set to match the bandwidth and channel settings of the
fractionalized HSSI link under analysis.
Table 12. T1/E1 tabSetting ExplanationWAN/Frame RelayType
Choose T1 or E1 to match the type of link you are analyzing.
Encapsulation You must set this to match the settings on the frame relay CSU/DSU.
Subprotocol If ATM or LAPB is the selected encapsulation method, you mustchoose the sub-projects on the link.
Link 1 and Link 2 Channel Settings (Note that for the link and settings to beactivated, you must check the On check box for that link).Fractionalized Check if this link is configured for fractionalized operation.Channel selectorcheck boxes
Choose the channels you want to be included in the analysis.
Include in Util.Thermometer.
Check if you want to include statistics from this link in theBandwidth Utilization Thermometer.
How to encrypt captured data at restCaptured data at rest can be encrypted using the 256-bit Advanced EncryptionStandard (AES) algorithm. This significantly increases the security of your at-restdata.
Prerequisite(s):
♦ You must have a special Observer license to enable and use this feature.There is no extra charge for the license.
♦ You must have a GigaStor hardware appliance. This feature is not availableto GigaStor Software Edition. See the differences in software andhardware offerings for GigaStor.
Data at rest encryption is prevents visibility into any packets or even themetadata about the packets stored on the GigaStor. Any packets that arecaptured by the GigaStor are considered "data" and while they are stored on theGigaStor they are considered "at rest." Should any of the drives in the GigaStorbe removed or misplaced, the data on the drives is protected. There is no remoteaccess to this data apart from Observer’s own analyzer, and the data taggingmethods for organizing and retrieving data can only be used in conjunction withObserver.
The GigaStor can capture 10 Gb line rate while simultaneously encrypting thetraffic with AES-256 encryption without any significant performance impact onwrite or read speeds of the GigaStor. The RAID hardware is responsible for theencryption, and the data is encrypted before it is written to disk.
These instructions describe how to apply data at rest encryption to a GigaStoralready in your possession. If your GigaStor shipped from the warehouse with thedata at rest security already enabled, you do not need to complete this processunless two or more drives in your RAID have failed.

How to encrypt captured data at restChapter 2: Multi Probe Software 39
Caution: This procedure deletes all of the data on your GigaStor! Ensureyou have a backup of any data you wish to keep.
1. Download the latest firmware for the Areca 1882 Series RAID card or contactVIAVI Support for the file.
2. Choose Start > All Programs > Areca Technology Corp > ArcHttpSrvGui> Areca HTTP Proxy Server GUI. The program starts. You should seesomething similar to the Figure 6 (page 39) image.
Figure 6: Areca RAID application
3. Select Controller#01 and click Launch Browser. If the controller is not running,click the Start button then launch the browser. The Areca RAID applicationattempts to connect to its web server.
4. Type the user name and password. The default user name is admin. There isno default password. Click OK to open the browser.
In the browser you can see the RAID set, IDE channels, Volume, and capacity.5. In the web browser, choose System Controls > Upgrade Firmware. In
the Browse field, choose each of the four files from the firmware packageyou downloaded or received from Technical Support in step 1 and clickSubmit. Choose the files in the order they are listed below. After adding thearch1882firm.bin file you are prompted to restart the system. Ignore thatrestart request and add the fourth file.
ARC1882BIOS.BIN
ARC1882BOOT.BIN
arc1882firm.bin
ARC1882MBR0.BIN
6. Restart the GigaStor.7. Choose Volume Set Functions > Delete Volume Set. Select the volume,
then select Confirm The Operation and click Submit. This deletes all of theexisting data on the RAID.

How to encrypt captured data at rest40 Multi Probe (23 Feb 2018) — Archive/Non-authoritative version
8. Choose Volume Set Functions > Create Volume Set. Set the followingoptions to these values, select Confirm The Operation, and click Submit.
Volume RAID Level Raid 5Greater Two TBVolume Support
64bit LBA
VolumeInitialization Mode
Foreground Initialization. It may take several hours (six hoursfor 48 TB) to initialization the volume. While the volume isbeing initialized, the GigaStor cannot be used. If you chooseBackground Initialization, you may use your GigaStor, but it willtake significantly longer to complete and performance will benegatively affected.
Volume Stripe Size 128Volume CacheMode
Write Back
Volume WriteProtection
Disabled
Full VolumeEncryption
256Bit Key, AES Key
Tagged CommandQueueing
Enabled
SCSI Channel 0:0:0Volumes To BeCreated
1
9. Open Observer and apply your new license. Restart Observer.
Because this is the first time that Observer is opened with the new license,it does not yet have a key for the encrypted volume. A window appearsindicating that the volume is locked.
10. Click Generate Key and save the key file in a secure location following yourorganization's security policy.
● When rebooting, the system needs access to key in order to unlockthe drive. This is the key necessary to write to and read from the RAIDvolume.
● Observer will not open unless it can find the key. Without the keypresent neither packet capture nor packet analysis can occur. You canchoose to remember the key file location so that Observer opensautomatically, or, if left cleared, each time Observer is opened youmust provide the path to the key file.
● Securely storing the key is a critical part of your responsibility.11. Close Observer until the rest of this procedure is complete.12. In Control Panel > Administrative Tools > Computer Management >
Storage > Disk Management select the RAID volume, right-click and chooseInitialize. In the Initialize Disk window, select Disk 1 and GPT (GUID PartitionTable). Convert the volume to a Simple Layout, assign a drive letter (typically,D:), and provide a name (typically, DATA).
13. Repeat this process for each RAID volume for your GigaStor.14. Open Observer.

Using the ProbeChapter 2: Multi Probe Software 41
Using the ProbeThe probe has two interfaces: the probe service and the analyzer user interfaces.You can switch between the two depending on what you want to accomplish.Also learn about monitoring a wireless access point (AP) and where to enablenetwork trending.
Switching between the probe and analyzer user interfacesMost probes can be run as either a Windows service or in application mode. Somesettings can only be made when the probe is in application mode.
Prerequisite: Multi or Expert Probe.
Depending on how you want or need to use your Expert Probe, it can be eitheran Observer to help you view your network data or it can be a probe to capturedata and to which other Observer can connect. The Expert Probe software cannotsimultaneously be an analyzer and a probe.
To change the Expert Probe interface to load as a fully-featured Observer, clickFile and . You must restart the application to see the change.
Note: For a GigaStor, the Expert Probe software is running as a Windowsservice. You must stop the Expert Probe service before you can change itsinterface.
1. Right-click the Probe Service Configuration Applet in the system tray andchoose Open Probe Configuration.
Figure 7: Probe Service Configuration Applet
The Probe Administration window opens.2. Choose Options > Probe Options.3. Clear the option Run Probe as a Windows Service option, and click OK.
This removes the VIAVI Expert Probe service from Windows.4. Start Observer.6. Choose Observer, click OK, and click OK again when prompted.
This closes Observer.7. Start Observer.
Observer is now set to use the analyzer interface.
When switching back to an Expert Probe on the GigaStor, you must reverse thesesteps and then you must manually start Expert Probe from the Windows ServiceControl Manager. It may take a moment before the service starts. You may needto restart the GigaStor for the setting changes to fully set.
How to assign physical ports to probe instances42 Multi Probe (23 Feb 2018) — Archive/Non-authoritative version
Enabling Network Trending and setting which statistics arecollected
A probe can provide many different statistics about your network, but you mustenable the collection of those statistics. Network Trending does not capturepackets, but collects statistics about the traffic on your network. Many reports inObserver use the trending information, and we recommend you enable NetworkTrending.
1. To turn on the collection of a specific statistic, in Observer choose Statistics >and then select the statistic you want to have the probe collect and report.
Monitoring a wireless access pointYou can capture all wireless traffic with a wireless network card on a laptop orany system with a wireless network card if you use the VIAVI wireless driver. Thedefault driver for your wireless card is not sufficient for Observer.
Standard network cards do not support “raw” wireless packets, nor do theyenable “promiscuous” mode by default. Promiscuous mode captures all packetsfor the analyzer, not just those addressed to the network card. Both “raw”wireless packets and promiscuous mode are required by Observer. The VIAVIwireless driver enables these options.
When a network card is running in promiscuous mode, it cannot connect to awireless access point. It can only capture traffic. If you are using a laptop andwant to capture traffic and at the same time connect to a wireless access point,your laptop must have two wireless cards.
If you are using the probe software on your laptop, you need two networkadapters. Typically, one adapter is an Ethernet card for communication and onewireless adapter for analysis. You could also use two wireless cards. You may alsoneed special drivers.
If your wireless network uses an encryption key or specific wireless channels, youcan specify that information for the wireless adapter.
Note: use private keys to authenticate with a RADIUS server, then dynamickeys are used to encrypt communication on a user by user basis, with notwo users ending up with the same keys. Observer cannot decrypt the datafrom a site that implemented EAP/LEAP, but this does not mean Observer isnot useful. Because all management and control packets are not encrypted,wireless troubleshooting is not affected even if you use EAP/LEAP. If youwant to troubleshoot the actual data in the conversation, collect the dataon the wired side where there is no encryption and all protocols can bedecoded. Observer supports both wired topologies (i.e. Ethernet, Token Ringand FDDI) as well as wireless topologies to troubleshoot both sides of aconversation (wireless management+control AND full wired data) you onlyneed one product.
How to assign physical ports to probe instancesBy default, the active instance monitors network traffic from every physical portof your capture card—all the traffic is aggregated. If you want to instead “divide”your monitored network traffic by physical ports, to help you monitor certain

How to assign physical ports to probe instancesChapter 2: Multi Probe Software 43
SFPs separately from others, then you can use virtual adapters to assign specificphysical ports to probe instances.
Prerequisite(s):
Your hardware appliance must have one of the following:
♦ Gen2 capture card♦ Gen3 capture card
For example, suppose you are deploying an 8-port Gen3 capture card as follows:
♦ Ports 1-4 are monitoring a collection of trunked links♦ The remaining ports are each connected to the SPAN (or mirror) port on a
switch
In this scenario, it makes sense for Observer to view ports 1-4, for example, as asingle stream of network traffic and to separate each of the four remaining portsinto separate data streams. Virtual adapters are a convenient way to accomplishthis separation or aggregation in real time, rather than depending on filters tosort through the traffic post-capture.
These are the general steps for assigning physical ports to a probe instance:
♦ Create a virtual adapter (or have one already).♦ Assign physical ports to this virtual adapter.♦ Set a probe instance to use this virtual adapter as its NIC.
Tip! As a general reminder, you risk severe performance loss when usingmore than one active instance. These instructions do not create multipleactive instances.
To assign physical ports to a specific probe instance:
1. In Observer, right-click the Gen3 capture card-equipped probe instance fromthe probe list, and click Probe or Device Properties.
A Gen3 capture card-equipped probe instance shows (Gigabit) or similarafter the name.
2. Click the Virtual Adapters tab.
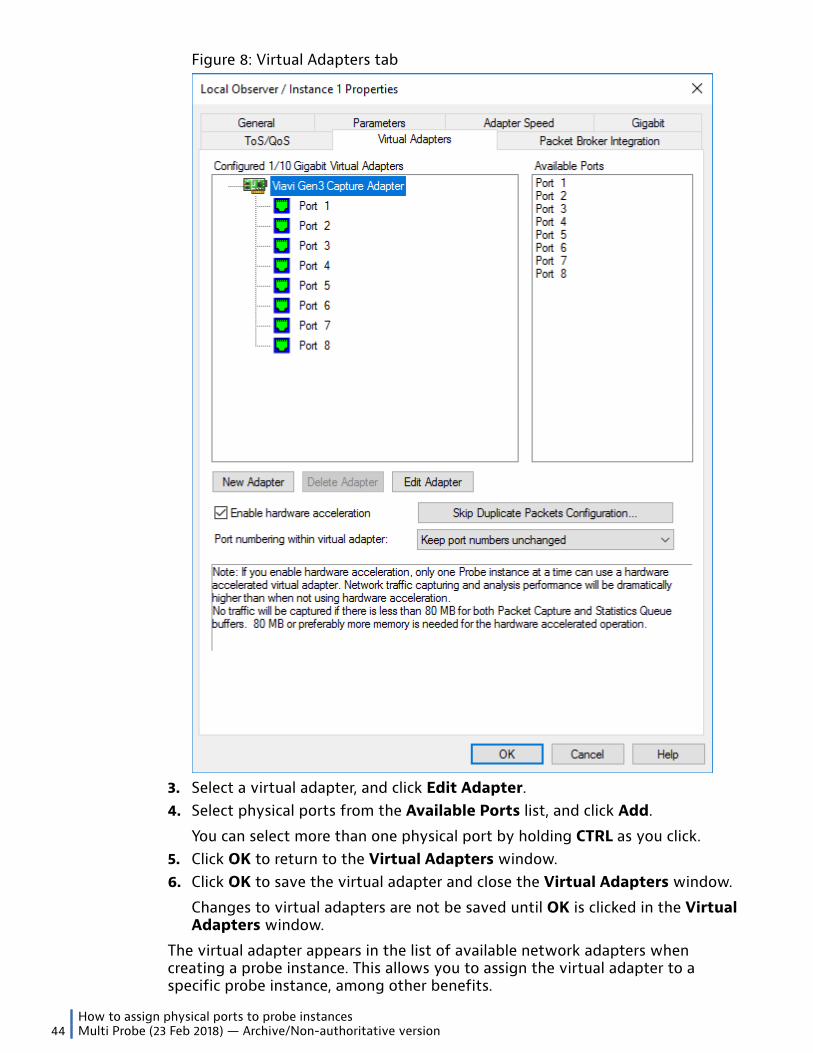
How to assign physical ports to probe instances44 Multi Probe (23 Feb 2018) — Archive/Non-authoritative version
Figure 8: Virtual Adapters tab
3. Select a virtual adapter, and click Edit Adapter.4. Select physical ports from the Available Ports list, and click Add.
You can select more than one physical port by holding CTRL as you click.5. Click OK to return to the Virtual Adapters window.6. Click OK to save the virtual adapter and close the Virtual Adapters window.
Changes to virtual adapters are not be saved until OK is clicked in the VirtualAdapters window.
The virtual adapter appears in the list of available network adapters whencreating a probe instance. This allows you to assign the virtual adapter to aspecific probe instance, among other benefits.

Using the NetFlow features in ObserverChapter 2: Multi Probe Software 45
Next, you should change the monitored network adapter (page 26) of a probeinstance to use the virtual adapter.
Using the NetFlow features in ObserverWatch a video about NetFlow in Observer, and see a list of some importantNetFlow considerations to know.
Like many things in Observer a feature is not in just one place, but spreadthroughout the product. NetFlow is no different. Use this section as a startingplace to find what you need regarding NetFlow in Observer.
♦ Choose the right probe for you.♦ Ensure your ToS/QoS is set for your network so that your statistics are
correct.♦ There are two different types of NetFlow collectors. Learn the differences
and see how to create one.♦ Capturing NetFlow statistics does have some limitations that are different
from packet capture.
♦ Decoding a NetFlow flow. This section also details how you may need toconfigure your NetFlow device so that Observer can see the flows.
♦ Open a saved NetFlow capture.♦ Most NetFlow information comes from Network Trending.
Creating a NetFlow collector or NetFlow Trendingcollector
There are two types of NetFlow collectors in Observer. Choose the correct onefor your needs, or create two different probe instances—one for the NetFlowcollector and another for the NetFlow Trending collector.
Prerequisite: Expert Probe
Note: If you want to have scheduled collection of your NetFlow devices,use the settings on the Schedule tab.
NetFlow and sFlow collectors support the following versions of thesetechnologies:
♦ NetFlow: 1, 5, 7, 9, and 10 (IPFIX)♦ sFlow: 2, 4, and 5
There are two types of NetFlow collectors in Observer. Choose the correct onefor your needs, or create two different probe instances—one for the NetFlowcollector and another for the NetFlow Trending collector. In most cases, it willlikely be the NetFlow Trending collector. The NetFlow Trending collector supportsup to 50 NetFlow devices, whereas the NetFlow collector only supports oneNetFlow device. That means you must add and configure a NetFlow collector foreach NetFlow device in your environment.
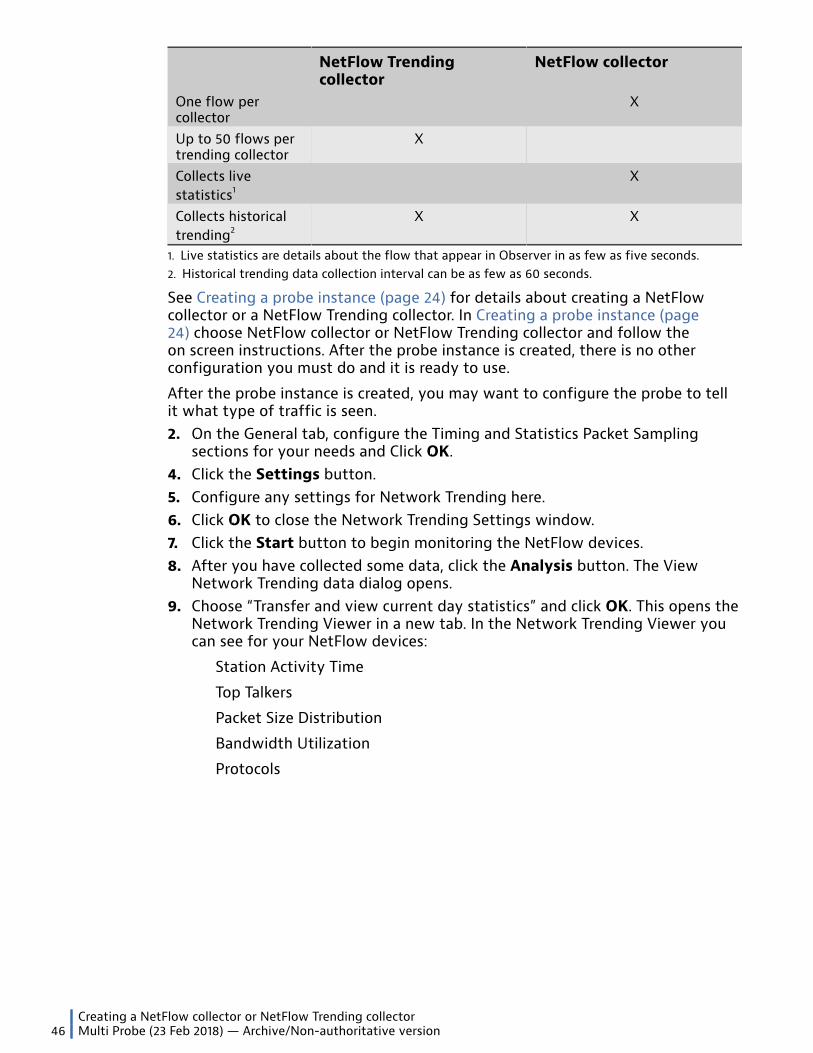
Creating a NetFlow collector or NetFlow Trending collector46 Multi Probe (23 Feb 2018) — Archive/Non-authoritative version
NetFlow Trendingcollector
NetFlow collector
One flow percollector
X
Up to 50 flows pertrending collector
X
Collects livestatistics1
X
Collects historicaltrending2
X X
1. Live statistics are details about the flow that appear in Observer in as few as five seconds.2. Historical trending data collection interval can be as few as 60 seconds.
See Creating a probe instance (page 24) for details about creating a NetFlowcollector or a NetFlow Trending collector. In Creating a probe instance (page24) choose NetFlow collector or NetFlow Trending collector and follow theon screen instructions. After the probe instance is created, there is no otherconfiguration you must do and it is ready to use.
After the probe instance is created, you may want to configure the probe to tellit what type of traffic is seen.2. On the General tab, configure the Timing and Statistics Packet Sampling
sections for your needs and Click OK.4. Click the Settings button.5. Configure any settings for Network Trending here.6. Click OK to close the Network Trending Settings window.7. Click the Start button to begin monitoring the NetFlow devices.8. After you have collected some data, click the Analysis button. The View
Network Trending data dialog opens.9. Choose “Transfer and view current day statistics” and click OK. This opens the
Network Trending Viewer in a new tab. In the Network Trending Viewer youcan see for your NetFlow devices:
Station Activity Time
Top Talkers
Packet Size Distribution
Bandwidth Utilization
Protocols

3
Chapter 3: UnderstandingHow a Probe Uses RAM
How a probe uses RAMA Windows computer uses Random Access Memory (RAM) as a form oftemporary data storage. Windows separates all available memory into threesections: protected memory, user memory, and reserved memory. An Observerprobe, depending on how it is configured, uses these types of memorydifferently.
The protected memory is used to load critical operating system files, such asdevice drivers. If any of this RAM is dedicated to a driver or some other criticalfile, it cannot be used by another program. However, after Windows finishesloading its drivers, the memory is freed and any program may access theremaining protected memory.
User memory is all available memory beyond the protected memory. It is availableto any application at any time. The probe uses this memory to temporarily storestatistical information, such as Top Talkers data.
Reserved memory is user memory that you have specifically set aside for use bythe Observer probe. Only the probe may use that portion of RAM. When the RAMis reserved for the probe not even the operating system may access it—evenwhen Observer is closed.
By having RAM reserved specifically for the Observer probe, you ensure that theprobe has the memory necessary to capture packets and store these packets forstatistical processing. If Observer runs without any reserved memory, it requestsand uses the operating system’s protected memory for capturing packets. Thereis no adverse effect of running an Observer probe without reserved memory, butit is not the most efficient way to run the probe. By default, the probe uses noreserved memory. Our recommendation is that you reserve memory for Observer
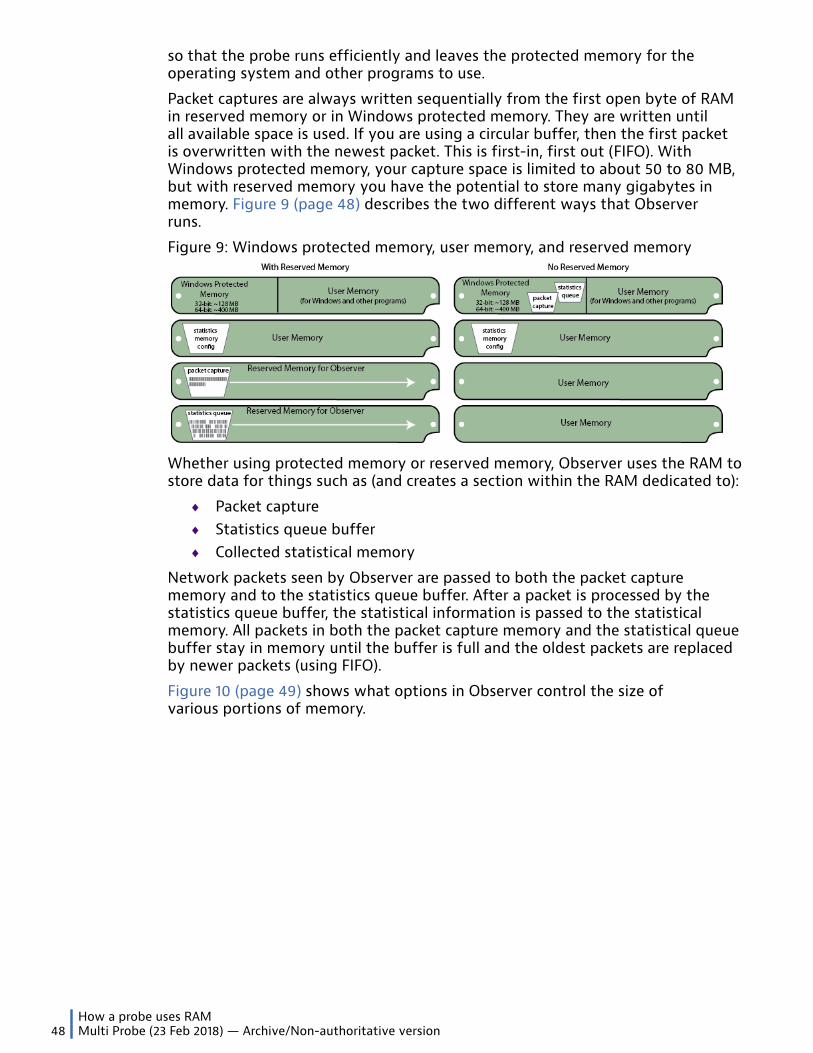
How a probe uses RAM48 Multi Probe (23 Feb 2018) — Archive/Non-authoritative version
so that the probe runs efficiently and leaves the protected memory for theoperating system and other programs to use.
Packet captures are always written sequentially from the first open byte of RAMin reserved memory or in Windows protected memory. They are written untilall available space is used. If you are using a circular buffer, then the first packetis overwritten with the newest packet. This is first-in, first out (FIFO). WithWindows protected memory, your capture space is limited to about 50 to 80 MB,but with reserved memory you have the potential to store many gigabytes inmemory. Figure 9 (page 48) describes the two different ways that Observerruns.
Figure 9: Windows protected memory, user memory, and reserved memory
Whether using protected memory or reserved memory, Observer uses the RAM tostore data for things such as (and creates a section within the RAM dedicated to):
♦ Packet capture♦ Statistics queue buffer♦ Collected statistical memory
Network packets seen by Observer are passed to both the packet capturememory and to the statistics queue buffer. After a packet is processed by thestatistics queue buffer, the statistical information is passed to the statisticalmemory. All packets in both the packet capture memory and the statistical queuebuffer stay in memory until the buffer is full and the oldest packets are replacedby newer packets (using FIFO).
Figure 10 (page 49) shows what options in Observer control the size ofvarious portions of memory.
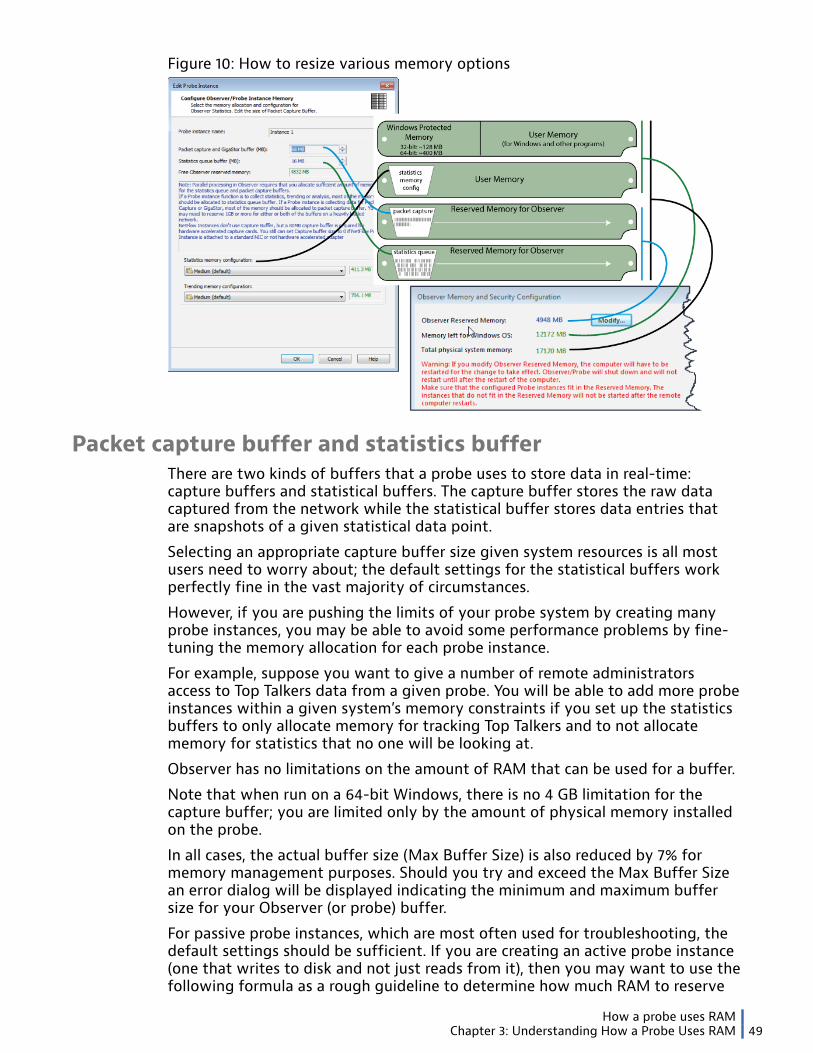
How a probe uses RAMChapter 3: Understanding How a Probe Uses RAM 49
Figure 10: How to resize various memory options
Packet capture buffer and statistics bufferThere are two kinds of buffers that a probe uses to store data in real-time:capture buffers and statistical buffers. The capture buffer stores the raw datacaptured from the network while the statistical buffer stores data entries thatare snapshots of a given statistical data point.
Selecting an appropriate capture buffer size given system resources is all mostusers need to worry about; the default settings for the statistical buffers workperfectly fine in the vast majority of circumstances.
However, if you are pushing the limits of your probe system by creating manyprobe instances, you may be able to avoid some performance problems by fine-tuning the memory allocation for each probe instance.
For example, suppose you want to give a number of remote administratorsaccess to Top Talkers data from a given probe. You will be able to add more probeinstances within a given system’s memory constraints if you set up the statisticsbuffers to only allocate memory for tracking Top Talkers and to not allocatememory for statistics that no one will be looking at.
Observer has no limitations on the amount of RAM that can be used for a buffer.
Note that when run on a 64-bit Windows, there is no 4 GB limitation for thecapture buffer; you are limited only by the amount of physical memory installedon the probe.
In all cases, the actual buffer size (Max Buffer Size) is also reduced by 7% formemory management purposes. Should you try and exceed the Max Buffer Sizean error dialog will be displayed indicating the minimum and maximum buffersize for your Observer (or probe) buffer.
For passive probe instances, which are most often used for troubleshooting, thedefault settings should be sufficient. If you are creating an active probe instance(one that writes to disk and not just reads from it), then you may want to use thefollowing formula as a rough guideline to determine how much RAM to reserve

How a probe uses RAM50 Multi Probe (23 Feb 2018) — Archive/Non-authoritative version
for the probe instance when doing a packet capture. (This formula does not applywhen doing a Observer GigaStor capture to disk. It is only for probe instancesdoing packet captures.)
Use this formula to determine your RAM buffer size: Network Speed× Average Throughput (MB/second) Seconds of data storable in RAM
Tip! You want a buffer that will handle your largest, worst case unfilteredburst.
Use this formula to determine how much hard drive space a capture requires (inGB) and Observer’s write-to-disk capability. There is no limitation to the amountdata Observer can write to disk other than the disk size itself. (Traffic Level / 8 bit) × 3600 Seconds÷ 1024 bytes Gigabytes per hour
For instance a fully utilized 1 Gb port (1 Gbps is 125 MBps): (125 MBps / 8 bit) × 3600 Seconds÷ 1024 bytes ~54.93 GB per hour
Running Observer without reserved memorySingle probes cannot use reserved memory. By default, no memory is reserved forObserver if you install it on your own system.
Prerequisite(s):
♦ All versions of Observer Expert, Observer Suite, Expert Probe software,and Multi Probe software installed on your own hardware, unlessmodified.
♦ Single Probe software at all times♦ NetFlow probes
Observer without reserved memory is the default, but not recommended,configuration. It is the default because each network is unique and you mustdetermine how you want Observer to be configured for your system.
Note: This section does not apply to the GigaStor or other hardwareproducts from VIAVI. They are properly configured at the factory.
Tip! If you need more RAM for the statistics queue buffer, you may needto lower the amount of RAM dedicated to packet capture so that it is freedand available to add to the statistics queue.
After you install Observer and first open the program it does not have anyreserved memory. Observer allocated a portion of the available protectedmemory for its use. This creates a “Windows memory pool” for Observer of about50 to 80 MB (depending on the amount available from Windows, and cannot beincreased). This is a limitation of the Windows memory pool and the Windowsoperating system.

How a probe uses RAMChapter 3: Understanding How a Probe Uses RAM 51
Single Probes, unlike Multi-Probes and Expert Probes, cannot use reservedmemory because of their design. By default, 16 megabytes is available for thePacket Capture and Statistics Queue buffer. Single Probes have a maximum of52 megabytes that can be assigned from the Windows memory pool. Becauseof the Windows memory pool constraint, Single Probes are limited to a Packetcapture buffer maximum of 72 megabytes, assuming you set the Statistics queuebuffer to its minimum (12 megabytes). The Statistics queue buffer maximum is 76megabytes if the Packet capture buffer is set to 0 megabytes.
1. Click the Memory Management tab to display the list of probe instancesand their buffer sizes.
2. Click the Configure Memory button at the top of the window to view andmodify how Observer uses the protected memory for this probe instance. TheEdit Probe Instance window opens.
On the Edit Probe Instance window, you can see how memory is allocated for:
● Packet capture● Statistics queue buffer
You can also see how much protected memory is still available in theWindows memory pool.
Figure 11: Edit Probe Instance
3. Use the arrows to the right of the Packet capture and Statistics queue bufferto increase or decrease the amount of RAM you want dedicated to each. SeeHow to allocate the reserved RAM (page 55) to help determine how todivide the memory.

How a probe uses RAM52 Multi Probe (23 Feb 2018) — Archive/Non-authoritative version
Running Observer with reserved memoryReserved memory helps Observer run more efficiently by dedicating memory forits exclusive use.
Prerequisite(s):
♦ Observer Expert♦ Observer Suite♦ Expert Probe software♦ Multi Probe software
Observer uses reserved memory for packet capture and the statistics queuebuffer. It is highly-recommended that you use reserved memory. (GigaStorappliances running Observer are preconfigured this way.) You must determinehow you want Observer to be configured for your system.
Caution: Never change the reserved memory settings of VIAVI hardwareunless VIAVI instructs you do so. Reserved memory settings should onlybe modified on non-VIAVI hardware, such as a desktop computer runningObserver.
Tip! If you need more RAM for the statistics queue buffer, you may needto lower the amount of RAM dedicated to packet capture so that it is freedand available to add to the statistics queue.
Reserving memory allows Observer to allocate RAM for its exclusive use. Thisensures that Observer has the necessary memory to store packets for statisticalanalysis, or for capturing large amounts of data for decoding. The more memoryyou reserve for Observer, the larger the packet capture and statistical queuebuffers can be.
If the memory buffer for the statistics queue buffer is too small, you may end upwith inaccurate statistical data because some data may get pushed out before itcan be processed. Observer processes packets on a first-in, first out (FIFO) basis,so it is important that the buffer be large enough to allow for processing.
When reserving RAM for Observer you are taking RAM away from the operatingsystem. Table 13 (page 52) shows how much memory is required by theoperating system. Anything beyond this amount may be reserved for Observer.
Table 13. Reserved memory requirementsOperatingSystem
RAM required for the operating system
64-bit with lessthan 4 GB RAM
800 MB
64-bit with 4 GBRAM
4 GB 1
64-bit with 6+ GBRAM
4 GB
32-bit2 256 MB (although 400+ MB is recommended)
1. Because of how 64-bit Windows loads its drivers when 4 GB of RAM is installed all 4 GB is usedby Windows. This is sometimes referred to as the BIOS memory hole and means you cannot reserve

How a probe uses RAMChapter 3: Understanding How a Probe Uses RAM 53
any memory for Observer. To capture packets on 64-bit Windows install either more than or lessthan 4 GB of RAM.2. 32-bit operating systems do not support more than 4 GB of RAM. Observer cannot use any RAMabove 4 GB.
1. To see how much protected memory the probe has, click the MemoryManagement tab.
2. Click the Configure Memory button at the top of the window to view andmodify how Observer uses the protected memory for this probe instance. TheEdit Probe Instance window opens.
On the Edit Probe Instance window, you can see how memory is allocated for:
● Packet capture● Statistics queue buffer
You can also see how much protected memory is still available in theWindows memory pool.
3. Use the arrows to the right of the Packet capture and Statistics queue bufferto increase or decrease the amount of RAM you want dedicated to each. SeeHow to allocate the reserved RAM (page 55) to help determine how todivide the memory.
4. After reserving memory for Observer you must restart the system for thechanges to take affect. After you restart the system you can allocate thememory to the different probe instances.
How packet capture affects RAMWhen you start a packet capture (Capture > Packet Capture and click Start), allpackets that Observer sees are placed into the packet capture buffer (a specificportion of the protected memory). The packets stay in this protected memoryuntil the buffer is cleared. If you are using a circular packet buffer, new packetsoverwrite old ones after the buffer is full.
Figure 12 (page 54) shows how Observer receives a packet and distributes itthroughout RAM, and how it is written to disk for packet capture and GigaStorcapture.
Packets received by the network card are passed to Observer, where Observerputs each packet into RAM, specifically in the packet capture memory bufferand the statistical queue buffer. If a packet must be written to disk for either aGigaStor capture or a Packet Capture, it is copied from the RAM and written tothe disk.
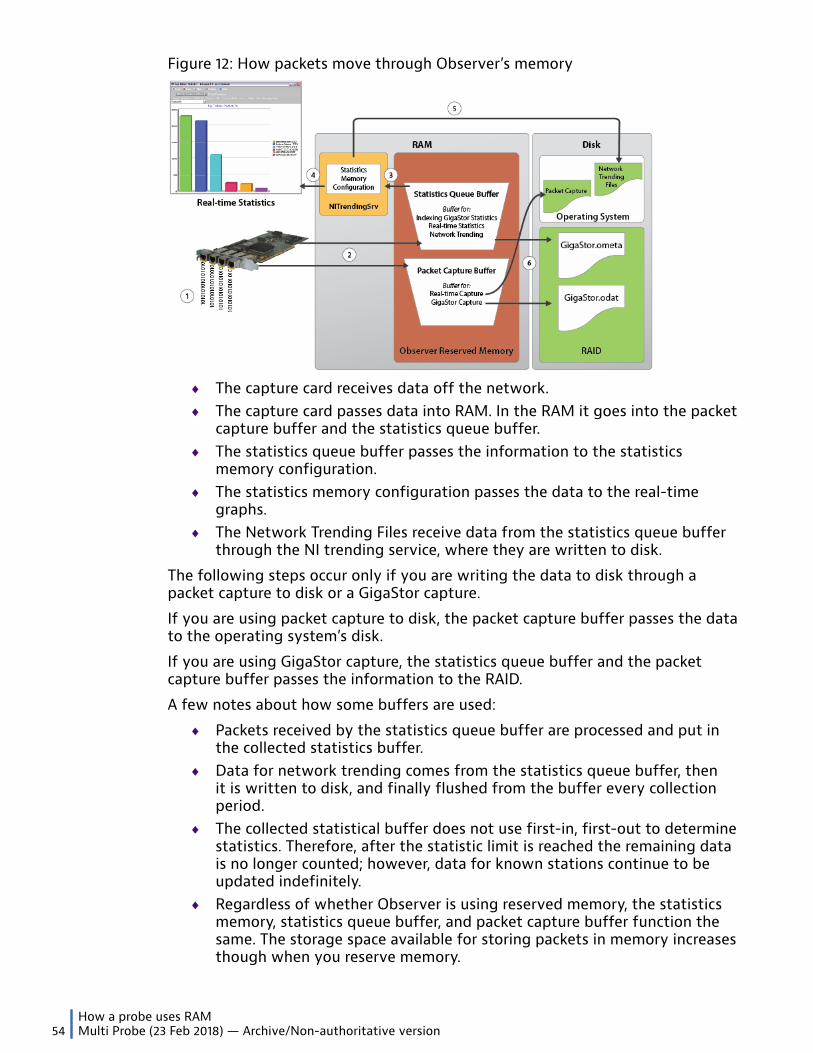
How a probe uses RAM54 Multi Probe (23 Feb 2018) — Archive/Non-authoritative version
Figure 12: How packets move through Observer’s memory
♦ The capture card receives data off the network.♦ The capture card passes data into RAM. In the RAM it goes into the packet
capture buffer and the statistics queue buffer.♦ The statistics queue buffer passes the information to the statistics
memory configuration.♦ The statistics memory configuration passes the data to the real-time
graphs.♦ The Network Trending Files receive data from the statistics queue buffer
through the NI trending service, where they are written to disk.
The following steps occur only if you are writing the data to disk through apacket capture to disk or a GigaStor capture.
If you are using packet capture to disk, the packet capture buffer passes the datato the operating system’s disk.
If you are using GigaStor capture, the statistics queue buffer and the packetcapture buffer passes the information to the RAID.
A few notes about how some buffers are used:
♦ Packets received by the statistics queue buffer are processed and put inthe collected statistics buffer.
♦ Data for network trending comes from the statistics queue buffer, thenit is written to disk, and finally flushed from the buffer every collectionperiod.
♦ The collected statistical buffer does not use first-in, first-out to determinestatistics. Therefore, after the statistic limit is reached the remaining datais no longer counted; however, data for known stations continue to beupdated indefinitely.
♦ Regardless of whether Observer is using reserved memory, the statisticsmemory, statistics queue buffer, and packet capture buffer function thesame. The storage space available for storing packets in memory increasesthough when you reserve memory.
How to allocate the reserved RAMChapter 3: Understanding How a Probe Uses RAM 55
How to allocate the reserved RAMAfter you have the RAM reserved for Observer, you must allocate it for theprobe instances. Here are our basic recommendations for allocating the memory.These are just recommendations and may be changed or modified for yourcircumstances.
If you are using a GigaStor hardware appliance, read this section, but also besure to consider the information in Recommendations for the VIAVI capture cards(page 55).
How many probe instances will you have on this system? How are you using theprobe instance(s)? Are you using it to capture packets or to analyze statistics?After you know how you want to use the probe instance, you can decide howto properly divide the memory amongst the probe instances, and further howyou will allocate the memory between the packet capture and statistics queuebuffers.
You want to create and use as few probe instances as absolutely necessary. Eachprobe instance you create divides the memory pool into smaller chunks. Themore probe instances you have, the more processing the system must do.
Note: If you have a lot of network traffic, then you may need to allocate atleast one gigabyte of RAM to the packet capture buffer, the statistics queuebuffer, or both.
For each probe instance determine:
♦ If you want to mostly capture packets, then allocate 90% of the reservedRAM to packet capture and 10% to the statistics queue buffer. At aminimum, you should allocate 12 MB to collect statistics. If you are usinga GigaStor, you should allocate the vast majority of the reserved RAM forthe active probe instance to packet capture.
♦ If you want to collect statistics or trending data, or use analysis, thenallocate 90% (or even 100%) of the reserved RAM to the statistics queuebuffer.
♦ If you want to do both, determine which you want to do more of andallocate the memory accordingly.
Recommendations for the VIAVI capture cardsThere are capture card requirements and considerations if you are using aGigaStor appliance, as the appliance may have a Gen3 capture card or Gen2capture card installed.
Here are some special configuration issues to consider when dealing with thesecapture cards:
♦ For either the Gen3 capture card or Gen2 capture card, you need aminimum of 100 MB allocated to the capture buffer of any probe instancethat is bound to the capture card. Allocating less than 100 MB to a probeinstance monitoring a VIAVI capture card may cause instability.
♦ If you are using any hardware accelerated probe instance, you must haveat least 80 MB for both packet capture and the statistics queue buffer.No packets are captured if either or both are below 80 MB. 80 MB is the

How to allocate the reserved RAM56 Multi Probe (23 Feb 2018) — Archive/Non-authoritative version
minimum, but consider substantially raising this amount. The more RAMthat you can allocate to packet capture and statistics, the better yourGigaStor probe will perform.
♦ When using multiple probe instances on a GigaStor, ensure that only oneprobe instance is associated with the capture card. (If you are using virtualadapters to monitor disparate networks, then you may have more thanone active instance bound to the capture card.) For performance reasons,all other probe instances should be associated with a different networkcard.
If you feel a capture card is not performing as expected, ensure that there isonly one probe instance bound to it. If there is more than one, verify that theother probe instances are not collecting any statistics. It is possible that theprobe instance you are looking at is not collecting any statistics, but one of theother probe instances may be. (This is only an issue if there are multiple probeinstances connected to the Gen3 capture card or Gen2 capture card. This does notapply if the other probe instances are connected to a regular network card.)
4
Chapter 4: Gen3 Capture Card
The Gen3 capture card is a GigaStor appliance exclusive. Learn about its features,configuration options, supported SFP/SFP+ media types, and more.
Hardware configurationUsing SFP modules, the Gen3 capture card can be configured to monitor nearlyany source of network traffic at a variety of connection speeds. The Gen3 capturecard hardware also unlocks certain features in Observer/GigaStor.
Understanding the capture cardThe Gen3 capture card is designed and manufactured exclusively by VIAVI. Thiscapture card is optimized for the Observer Platform and comes pre-installed inmany GigaStor hardware and probe appliances.
The Gen3 capture card is a special network adapter for high-speed packetcapture. The card is full-duplex and can monitor up to eight ports1 in real time.Also, the Gen3 capture card is for capturing only, so it does not send IP trafficfrom any of its ports.
More features of the Gen3 capture card include:
♦ Hardware acceleration in Observer/GigaStor♦ Deduplication to remove duplicate packets in real time♦ Virtual adapters allow the creation of several logical network adapters♦ Accurate and reliable time stamps♦ Ports have individually configurable auto-negotiation
1. The number of ports varies from 2, 4, or 8, depending on the physical configuration of yourhardware appliance.

Hardware configuration58 Multi Probe (23 Feb 2018) — Archive/Non-authoritative version
♦ Able to mix-and-match 1Gb and 10Gb modules♦ Compatible with most SFP/SFP+ module choices
Note: All packets captured by the probe are time-stamped immediately asthey are seen by the capture card interface. The packets are then passed tothe capture buffer. This ensures the most accurate time stamp.
Supported QSFP+/SFP/SFP+ media typesThe Gen3 capture card requires SFP modules. These are the supported mediatypes.
♦ 10 Gb Ethernet SFP+ Transceivers
● 10GBASE-SR● 10GBASE-LR
♦ 1 Gb Ethernet SFP Transceivers
● 1000BASE-SX● 1000BASE-LX● 1000BASE-T (includes copper at 10/100/1000)
Note: For 40 Gb connections, then QSFP+ may be used and only if yourexact capture card model supports it.
How to configure the card for an optical TAP, SPAN, or otherYou must make configuration changes to the capture card depending uponwhether you connect to a SPAN/mirror port, a passive optical TAP, or to a switchaggregator or conversion TAP using fiber.
Prerequisite(s):
For fiber optic connections that require a splitter: these steps assume you areusing the VIAVI optical Y-splitter cable, as it is unable to inject light back into theupstream network link and the provided steps assume the cable is being used. Ifa third-party optical splitter cable is used instead when Tx Enable is enabled onthose capture card ports, it could cause interference with the upstream networklink because the cable could inject light back into the upstream network link. Tosummarize, the steps listed for fiber optic connections in this document mightnot represent the best course of action if you are using a third-party opticalsplitter.
Auto-negotiation sets the correct port speed between a capture card port anda network device. The network devices connected to the capture card typicallyinclude network TAPs, SPANs or mirror ports from a switch, and feeds froma network packet broker or switch aggregator. Here are some general bestpractices:
♦ Auto-negotiation must be disabled when connecting the capture card to apassive, fiber-optic TAP.
♦ Auto-negotiation must be enabled when connecting the capture card tocopper SPAN or mirror ports.
Hardware configurationChapter 4: Gen3 Capture Card 59
To configure the capture card to properly connect to a network device:
1. In your version of Windows, open Device Manager.2. In the tree on the right, expand Viavi Solutions Inc. Capture Adapters.3. Right-click the capture card entry and choose Properties.4. Click the Advanced Properties tab.5. Do one of the following, and ensure the same settings are set for each
capture card port that makes up a link:
● If you are connecting a passive, optical TAP to the capture card:
♦ Clear Auto-Neg Enable (off).♦ Clear Tx Enable (off).
● If you are connecting a copper SPAN/mirror port to the capture card:
♦ Select Auto-Neg Enable (on).♦ Select Tx Enable (on).
● If you are connecting a fiber optic mirror port from a switch or conversionTAP to the capture card:
♦ Clear Auto-Neg Enable (on).♦ Select Tx Enable (on).
For connecting a fiber optic mirror port from a switch, some switches needTx Enable turned on for those capture card ports to establish a connection. Ifthis results in problems, turn off Tx Enable. Similarly, the correct setting forAuto-Neg Enable can change depending on your hardware and environment,so enable or disable it if you encounter problems.
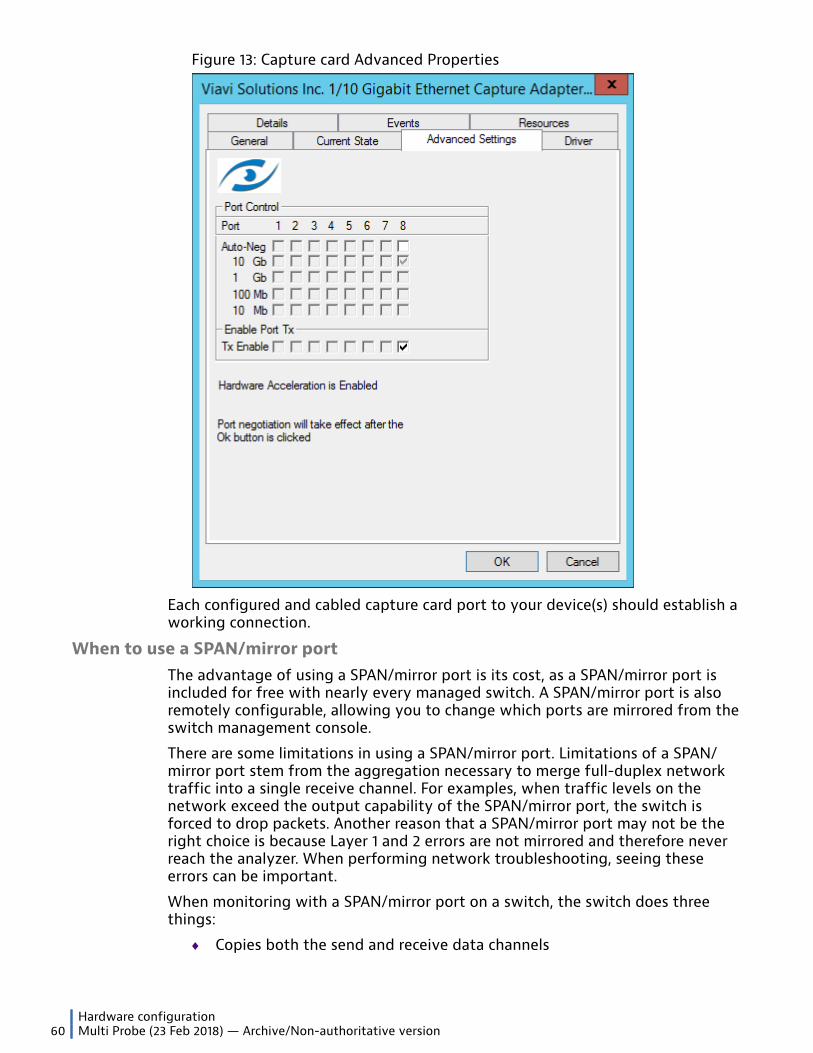
Hardware configuration60 Multi Probe (23 Feb 2018) — Archive/Non-authoritative version
Figure 13: Capture card Advanced Properties
Each configured and cabled capture card port to your device(s) should establish aworking connection.
When to use a SPAN/mirror portThe advantage of using a SPAN/mirror port is its cost, as a SPAN/mirror port isincluded for free with nearly every managed switch. A SPAN/mirror port is alsoremotely configurable, allowing you to change which ports are mirrored from theswitch management console.
There are some limitations in using a SPAN/mirror port. Limitations of a SPAN/mirror port stem from the aggregation necessary to merge full-duplex networktraffic into a single receive channel. For examples, when traffic levels on thenetwork exceed the output capability of the SPAN/mirror port, the switch isforced to drop packets. Another reason that a SPAN/mirror port may not be theright choice is because Layer 1 and 2 errors are not mirrored and therefore neverreach the analyzer. When performing network troubleshooting, seeing theseerrors can be important.
When monitoring with a SPAN/mirror port on a switch, the switch does threethings:
♦ Copies both the send and receive data channels
Software configurationChapter 4: Gen3 Capture Card 61
♦ Reconstructs an integrated data stream from the two channels♦ Routes the integrated signal to the send channel of the SPAN/mirror port
Each of these activities burdens the switch’s internal processor. These demandson the switch’s CPU have implications for both your monitoring equipment andgeneral network performance. Using a SPAN/mirror port to capture networktraffic for analysis presents the following risks:
♦ As total bandwidth usage for both channels exceeds the capacity of theoutbound link to the analyzer, the excess traffic is dropped from theanalyzer stream. There simply is not enough bandwidth to transmit bothsides of the full-duplex traffic across a single standard interface.
♦ The switch’s CPU must act as both a network switch and a packet-copier.The switch’s CPU must also integrate the two data streams (send andreceive) together correctly. Both packet copy/re-direction and channelintegration is affected by switch load. This means the SPAN/mirror portmay not deliver accurate captures when the switch is under heavy load.Monitoring a 10/100 network through a Gigabit SPAN/mirror port andanalyzer does not alleviate these concerns. Also, there is no notificationwhen the SPAN/mirror port is dropping packets or delivering inaccuratetime stamps.
A SPAN/mirror port can deliver satisfactory results when used to monitor lightlyused, non-critical networks. If network utilization exceeds the capacity of theoutbound (analyzer) link, packet loss results—which invalidates many types ofanalysis, and makes monitoring for certain kinds of network activity impractical.For example, you might miss a virus signature because packets are beingdropped. When analyzing a transaction or connection problem, the analyzer maydetect problems where none exist because expected packets are being droppedby the SPAN/mirror port. Hardware and media errors will also be impossible totroubleshoot through a SPAN/mirror port, as these errors are not mirrored to theanalyzer.
Software configurationThe Gen3 capture card hardware unlocks certain features in Observer/GigaStor.You can configure and use these settings inside the Observer application andWindows Device Manager.
How to view the capture card propertiesViewing the Gen3 capture card properties allows you to verify what you think ishappening at the card level (such as SFP activity, link speed, auto-negotiation) isactually happening. Additionally, configuration changes to the card can be madehere.
Tip! These settings can be viewed remotely using Windows RDP or anequivalent remote desktop application. You might find this useful forchecking SFP and link states when physical access to the GigaStor is notfeasible.
Some benefits of viewing the Gen3 capture card properties include:
♦ Verifying if an SFP...
● is present and in which port.
Software configuration62 Multi Probe (23 Feb 2018) — Archive/Non-authoritative version
● is active or idle.● is operating at the speed you expect.
♦ Verifying the board’s...
● hardware acceleration (HA) status.● auto-negotiation settings per port.● ID string that also contains the firmware version.● PCIe lane speed2.● power range (good /bad)● operating temperature (good/bad)
♦ Seeing configurable options for...
● per port auto-negotiation.
Tip! Be sure to disable auto-negotiation for TAP connections, and enableauto-negotiation for SPAN connections.
To view the Gen3 capture card properties:
1. In your version of Windows, open Device Manager.2. In the tree on the right, expand Viavi Solutions Inc. Capture Adapters.3. Right-click the capture card entry and choose Properties.
The Gen3 capture card device properties window is now visible.
2. PCIe lane speed is reported per lane, and the Gen3 capture card uses multiple lanestogether.
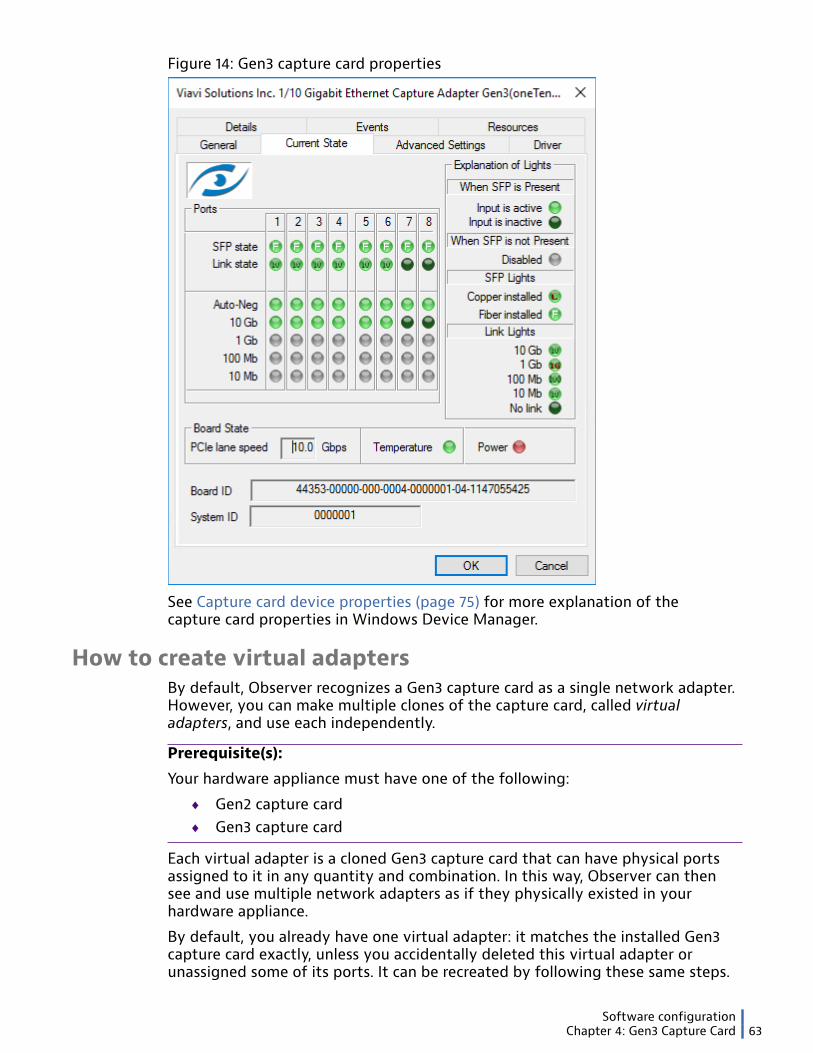
Software configurationChapter 4: Gen3 Capture Card 63
Figure 14: Gen3 capture card properties
See Capture card device properties (page 75) for more explanation of thecapture card properties in Windows Device Manager.
How to create virtual adaptersBy default, Observer recognizes a Gen3 capture card as a single network adapter.However, you can make multiple clones of the capture card, called virtualadapters, and use each independently.
Prerequisite(s):
Your hardware appliance must have one of the following:
♦ Gen2 capture card♦ Gen3 capture card
Each virtual adapter is a cloned Gen3 capture card that can have physical portsassigned to it in any quantity and combination. In this way, Observer can thensee and use multiple network adapters as if they physically existed in yourhardware appliance.
By default, you already have one virtual adapter: it matches the installed Gen3capture card exactly, unless you accidentally deleted this virtual adapter orunassigned some of its ports. It can be recreated by following these same steps.

Software configuration64 Multi Probe (23 Feb 2018) — Archive/Non-authoritative version
To create a virtual adapter:
1. In Observer, right-click the Gen3 capture card-equipped probe instance fromthe probe list, and click Probe or Device Properties.
A Gen3 capture card-equipped probe instance shows (Gigabit) or similarafter the name.
2. Click the Virtual Adapters tab.
Figure 15: Virtual Adapters tab
3. Click New Adapter.
The Assign Ports to Virtual Adapter window opens.4. Type a name in the Adapter Name box.

Software configurationChapter 4: Gen3 Capture Card 65
5. Select physical ports from the Available Ports list, and click Add.
You can select more than one physical port by holding CTRL as you click.6. (Optional) If this virtual adapter should operate during certain days and times
only, select Schedule virtual adapter ports and follow the prompts.
(Optional) If you choose to set a schedule for your virtual adapter, theremaining steps in this procedure may not be followable as written.
7. (Optional) If the virtual adapter should skip (discard) duplicate packets, selectSkip duplicate packets.
8. Select each added port, click Edit Port, and type a useful description for eachport such as its connected device.
This description appears in the GigaStor Control Panel in Observer.
Note: If you want to filter on physical ports, an option in the hardwareacceleration settings is described at .
9. Click OK to save the virtual adapter and close the Virtual Adapters window.
Changes to virtual adapters are not be saved until OK is clicked in the VirtualAdapters window.
The virtual adapter appears in the list of available network adapters whencreating a probe instance. This allows you to assign the virtual adapter to aspecific probe instance, among other benefits.
You should create a new probe instance for any virtual adapter you create, andassign the virtual adapter to that probe instance (page 26). This is because, bydefault, new virtual adapters are not assigned to any probe instance, so no datais collected with that virtual adapter until the virtual adapter is assigned to aprobe instance.
How to remove duplicate packets in real timeUse hardware acceleration on the Gen3 capture card to remove duplicate packetsbefore they are captured to disk or acknowledged by Observer. This is calledpacket deduplication.
Prerequisite(s):
Hardware acceleration must be enabled on your Gen3 capture card for thisfeature to function. Hardware acceleration for your virtual adapter is enabled bydefault.
To use hardware acceleration to skip duplicate packets:
1. Right-click the Gen3 capture card-equipped probe instance and choose Probeor Device Properties.
2. Click the Virtual Adapters tab.3. Click Edit Adapter.4. In the Assign Ports to Virtual Adapter window, select Skip duplicate
packets and click OK.5. (Optional) Click Skip Duplicate Packets Configuration.
The Skip Duplicate Packets Using Hardware Accelerated Capture Adapterdialog appears.

Software configuration66 Multi Probe (23 Feb 2018) — Archive/Non-authoritative version
Figure 16: Skip Duplicate Packets Using Hardware Accelerated Capture Adapter
6. (Optional) Select how duplicate packets are recognized by the Gen3 capturecard and click OK.
Example: (Optional) For example, by selecting Examine IP time to live(TTL), the packet time to live is considered when determining a duplicatepacket. If the option is cleared, TTL is ignored for all consideration of what is,and what is not, a duplicate packet.
7. Click OK to enable packet deduplication.
The Gen3 capture card now skips duplicate packets that it receives on the activeinstance. The duplicate packets will not be saved to disk or acknowledged byObserver.
How to assign physical ports to probe instancesBy default, the active instance monitors network traffic from every physical portof your capture card—all the traffic is aggregated. If you want to instead “divide”your monitored network traffic by physical ports, to help you monitor certain
Software configurationChapter 4: Gen3 Capture Card 67
SFPs separately from others, then you can use virtual adapters to assign specificphysical ports to probe instances.
Prerequisite(s):
Your hardware appliance must have one of the following:
♦ Gen2 capture card♦ Gen3 capture card
For example, suppose you are deploying an 8-port Gen3 capture card as follows:
♦ Ports 1-4 are monitoring a collection of trunked links♦ The remaining ports are each connected to the SPAN (or mirror) port on a
switch
In this scenario, it makes sense for Observer to view ports 1-4, for example, as asingle stream of network traffic and to separate each of the four remaining portsinto separate data streams. Virtual adapters are a convenient way to accomplishthis separation or aggregation in real time, rather than depending on filters tosort through the traffic post-capture.
These are the general steps for assigning physical ports to a probe instance:
♦ Create a virtual adapter (or have one already).♦ Assign physical ports to this virtual adapter.♦ Set a probe instance to use this virtual adapter as its NIC.
Tip! As a general reminder, you risk severe performance loss when usingmore than one active instance. These instructions do not create multipleactive instances.
To assign physical ports to a specific probe instance:
1. In Observer, right-click the Gen3 capture card-equipped probe instance fromthe probe list, and click Probe or Device Properties.
A Gen3 capture card-equipped probe instance shows (Gigabit) or similarafter the name.
2. Click the Virtual Adapters tab.

Software configuration68 Multi Probe (23 Feb 2018) — Archive/Non-authoritative version
Figure 17: Virtual Adapters tab
3. Select a virtual adapter, and click Edit Adapter.4. Select physical ports from the Available Ports list, and click Add.
You can select more than one physical port by holding CTRL as you click.5. Click OK to return to the Virtual Adapters window.6. Click OK to save the virtual adapter and close the Virtual Adapters window.
Changes to virtual adapters are not be saved until OK is clicked in the VirtualAdapters window.
The virtual adapter appears in the list of available network adapters whencreating a probe instance. This allows you to assign the virtual adapter to aspecific probe instance, among other benefits.
Understanding hardware accelerationChapter 4: Gen3 Capture Card 69
Next, you should change the monitored network adapter (page 26) of a probeinstance to use the virtual adapter.
How to change the monitored network adapterIf your probe has multiple network cards in it, you can choose which card youwant to monitor.
This section applies to all probes and all versions of them, including Single Probe,Multi Probe, and Expert Probe on VIAVI or third party hardware.
Note: If you have a network card in your system, but it is not being seenor recognized by Observer, follow the instructions in No network adapteravailable (page 87).
Tip! If you are seeing only broadcast traffic, you do not have the correctnetwork card selected or you do not have your switch port configuredcorrectly as a SPAN/mirror port. Change the network adapter you aremonitoring or configure the SPAN/mirror port.
♦ When choosing the monitored adapter from within Observer for all probeversions:
1. In the probes list, select the probe instance.2. Choose .
The Select Network Adapter window appears.3. Select the network adapter you want to monitor, and click Select.♦ When choosing the monitored adapter on the probe for Multi Probe and
Expert Probe:1. Click Adapters and Redirection.2. Select your probe instance and click Configure Adapter/Redirection.
The Edit Probe Instance window appears.3. In the Selected Network Adapter area, change the network card you are
monitoring.
The probe instance is now using the newly selected adapter.
Understanding hardware accelerationHardware acceleration optimizes a GigaStor active instance for its fastest possibleoperating speed by using the Gen3 capture card instead of the system CPU.
Hardware acceleration significantly increases the performance of an activeinstance than without it. By using hardware acceleration with the Gen3 capturecard, the fastest capture rates and post-capture analysis can be achieved inyour GigaStor hardware or probe appliance. Turning off hardware accelerationis not recommended, as packet capture performance will be greatly degradedbecause this work is offloaded from Gen3 capture card to the CPU instead whereit competes for resources.
Do not turn off hardware acceleration unless you have a specific need to.The feature provides performance benefits only; there are only advantages to
Understanding hardware acceleration70 Multi Probe (23 Feb 2018) — Archive/Non-authoritative version
gain by using hardware acceleration. However, two situations require that youdisable hardware acceleration on the active instance:
1. If you need the GigaStor active instance to filter network traffic in real timeusing a “deeper” set of filters than the following:
MAC/IP Address
MPLS
Port
VLAN Tag (802.1Q)
VNTag
It is a best practice to use the supported broad filters (page 73) listed or nofilters when capturing real-time network traffic with the GigaStor activeinstance. As soon as the network traffic is written to the RAID array, itbecomes available for data mining and more complex filters can be used. Ifunwanted traffic is entering your GigaStor system, it is instead recommendedthat the connected switches, SPAN, or aggregator switch be configured todiscard those packets before they reach the Gen3 capture card.
2. If you have an eight (8) port Gen3 capture card and intend to create onevirtual adapter for each physical port, then hardware acceleration must bedisabled. This is because only four virtual adapters can be created whilehardware acceleration is enabled. In practice, this is not a typical setup, andbetter use of your hardware is gained by leaving hardware accelerationenabled than separating more than four ports of traffic.
Tip! You can verify if hardware acceleration is enabled by viewing thecapture card properties (page 61).
The active instance is the only probe instance that can be configured forhardware acceleration. This means you cannot configure a passive instanceto use hardware acceleration—the option simply does not exist—but passiveinstances can always be created from your hardware-accelerated active instance.Each GigaStor appliance with a Gen3 capture card is configured to use the cardfor the active instance, so the best capture performance is ready out-of-the-box.
Hardware acceleration does not affect or speed-up statistics-basedfeatures like Network Trending. Statistic-based features behave exactly thesame whether hardware acceleration is enabled or disabled, and this is becausehardware acceleration affects packet capture modes only.
Note: When allocating memory for any probe instance with the VIAVIcapture card as the chosen adapter, at least 80 MB of memory must beallocated to both the capture buffer and statistics queue buffers. Failure todo so will result in the inability to capture data. This must also be followedfor any Gen3 capture card that has hardware acceleration enabled.
How to enable hardware accelerationHardware acceleration must be turned on for certain features in Observer and theGigaStor Control Panel to become usable. Hardware acceleration is exclusive tothe Gen3 capture card.
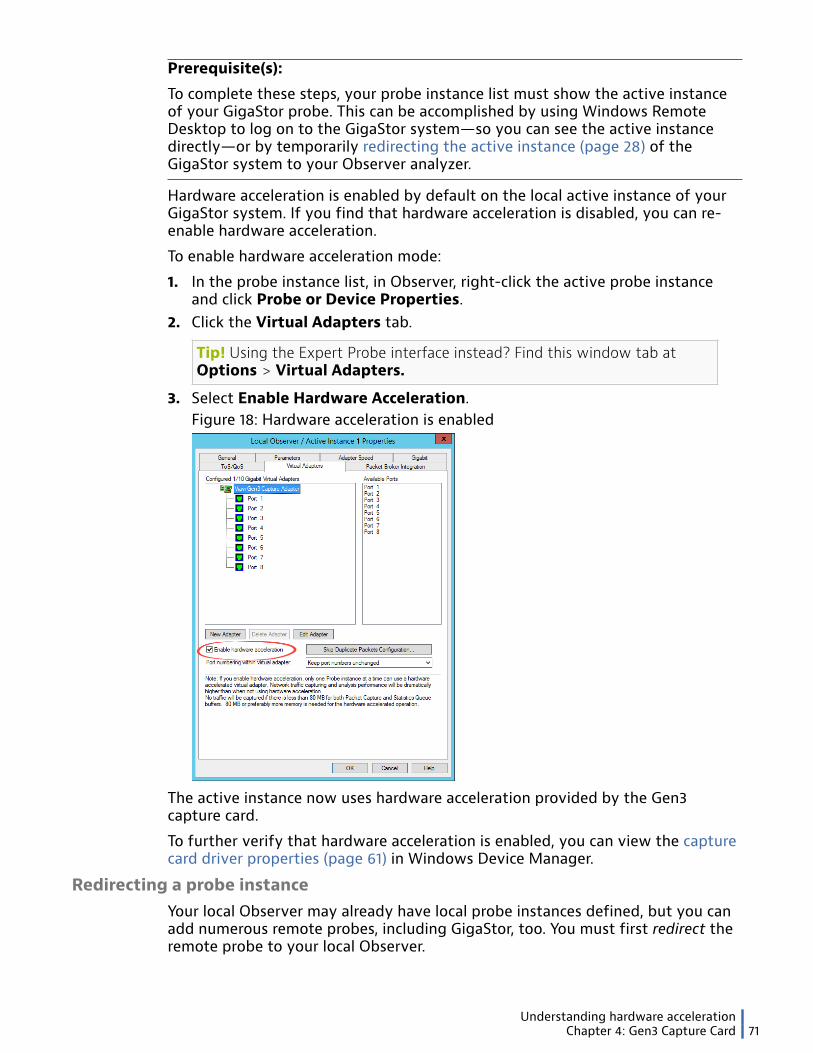
Understanding hardware accelerationChapter 4: Gen3 Capture Card 71
Prerequisite(s):
To complete these steps, your probe instance list must show the active instanceof your GigaStor probe. This can be accomplished by using Windows RemoteDesktop to log on to the GigaStor system—so you can see the active instancedirectly—or by temporarily redirecting the active instance (page 28) of theGigaStor system to your Observer analyzer.
Hardware acceleration is enabled by default on the local active instance of yourGigaStor system. If you find that hardware acceleration is disabled, you can re-enable hardware acceleration.
To enable hardware acceleration mode:
1. In the probe instance list, in Observer, right-click the active probe instanceand click Probe or Device Properties.
2. Click the Virtual Adapters tab.
Tip! Using the Expert Probe interface instead? Find this window tab atOptions > Virtual Adapters.
3. Select Enable Hardware Acceleration.
Figure 18: Hardware acceleration is enabled
The active instance now uses hardware acceleration provided by the Gen3capture card.
To further verify that hardware acceleration is enabled, you can view the capturecard driver properties (page 61) in Windows Device Manager.
Redirecting a probe instanceYour local Observer may already have local probe instances defined, but you canadd numerous remote probes, including GigaStor, too. You must first redirect theremote probe to your local Observer.
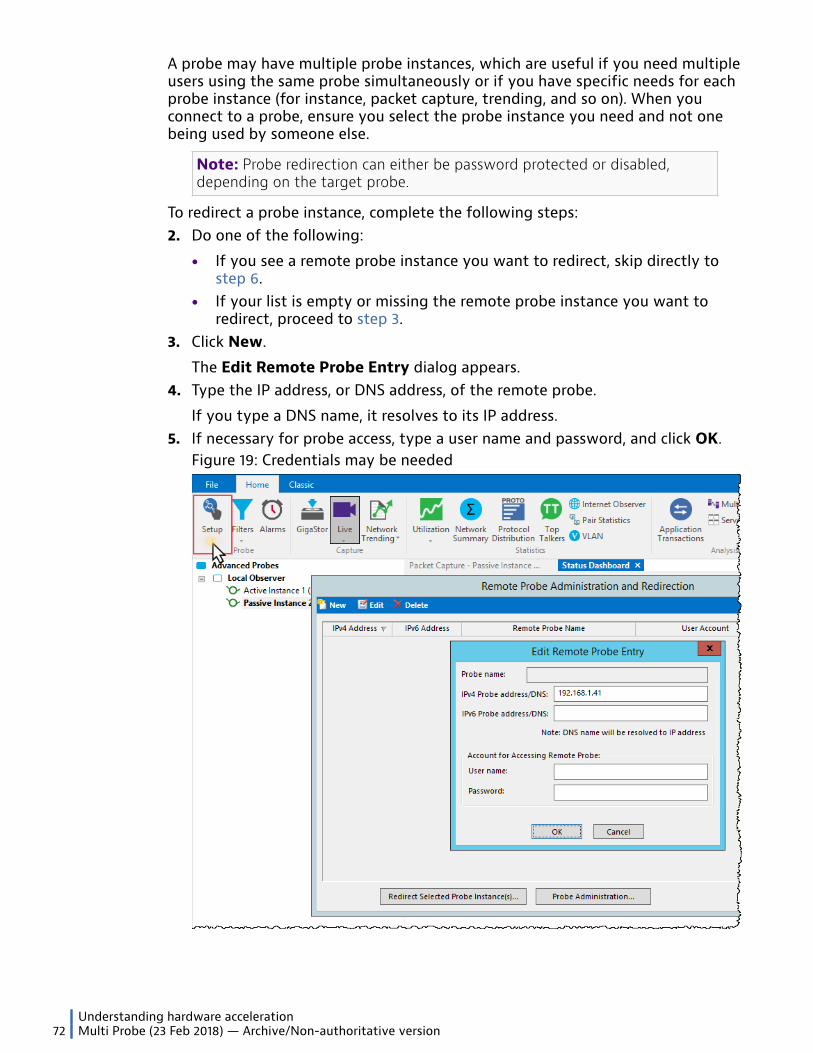
Understanding hardware acceleration72 Multi Probe (23 Feb 2018) — Archive/Non-authoritative version
A probe may have multiple probe instances, which are useful if you need multipleusers using the same probe simultaneously or if you have specific needs for eachprobe instance (for instance, packet capture, trending, and so on). When youconnect to a probe, ensure you select the probe instance you need and not onebeing used by someone else.
Note: Probe redirection can either be password protected or disabled,depending on the target probe.
To redirect a probe instance, complete the following steps:2. Do one of the following:
● If you see a remote probe instance you want to redirect, skip directly tostep 6.
● If your list is empty or missing the remote probe instance you want toredirect, proceed to step 3.
3. Click New.
The Edit Remote Probe Entry dialog appears.4. Type the IP address, or DNS address, of the remote probe.
If you type a DNS name, it resolves to its IP address.5. If necessary for probe access, type a user name and password, and click OK.
Figure 19: Credentials may be needed

Understanding hardware accelerationChapter 4: Gen3 Capture Card 73
6. Select the remote probe instance from the list, and click Redirect SelectedProbe Instance(s).
Allow time for the remote probe to redirect. How long this operation can takeis limited by a timeout countdown.
The probe instances of the remote probe are shown.7. Select a probe instance from the list, and click Redirect Selected Instance.8. Select the Redirect to this Observer, and click the Redirect button.
Figure 20: Redirecting Probe Instance
9. Close the Probe Instance Redirection window.
If the operation succeeds, the remote probe instance is now redirected to thelocal Observer. Now you can use the remote probe instance just as you would if itwas running on your local machine.
Hardware-accelerated mode restrictionsThe Gen3 capture card has a very short list of restrictions while running inhardware-accelerated mode. These restrictions are designed to keep yourhardware operating at peak performance when hardware acceleration is enabled.
While a Gen3 capture card runs in hardware-accelerated mode, it cannot:
♦ Connect itself to multiple probe instances without the aid of virtualadapters (page 63).
♦ Use overly complex filters that would affect hardware-acceleratedperformance (rare occurrence). An error message will alert you if the filteris too complex for hardware acceleration, but the filter can be rewritten ortweaked to be accepted.

Understanding hardware acceleration74 Multi Probe (23 Feb 2018) — Archive/Non-authoritative version
♦ Use software-based pre-filters. They are mutually exclusive; only one maybe used.
♦ Affect statistics-based information, such as Network Trending.
There are two types of filtering that occurs in GigaStor: hardware filtering on thecapture card and software filtering in Observer. Hardware filtering only affectswhich packets are captured on the capture card and saved to the RAID; it doesnot work with any statistics-based filtering that may occur in the Observersoftware, such as for Network Trending, Bandwidth Utilization with Filter, andso on. Any packets excluded by the hardware filter are never saved to disk andsearchable by the software. In general, you want your hardware filter to allowas many packets through as possible. This ensures the largest number of packetsare available for troubleshooting. In some cases, it is desirable to use hardwarefiltering because you know you do not need certain types of traffic capturedand saved by GigaStor. Hardware filtering is only available when using hardwareacceleration; it also disables the use of software-based pre-filters. Softwarefiltering has two of its own possibilities when using hardware filtering: 1) siftingthrough packets after they were written to the RAID by the capture card and 2)controlling what is available for network trending when collecting statistics.
Hardware filtering Filters packets before they are saved to the RAID. This disablesthe ability to use software pre-filters in Observer, which rely onthe CPUs rather than the capture card to do the processing.
Software post-filtering of packets
Filters packets saved to disk by the capture card, which may ormay not have a hardware filter applied. See Observer Filters.
Software filteringof networktrending
Filters statistics-based trending data, which is entirely unrelatedto packet capture. See Choosing your network trending types.
These are the filtering types usable on a hardware-accelerated virtual adapter:
MAC/IP Address
MPLS
Port
VLAN Tag (802.1Q)
VNTag
Features that require hardware accelerationSome functions or features of your hardware appliance require that hardwareacceleration is turned on.
These cannot operate if hardware acceleration is turned off:
♦ Real-time packet deduplication♦ Physical ports reused in multiple virtual adapters♦ Hardware filters♦ Disk read and write speeds that match advertised values
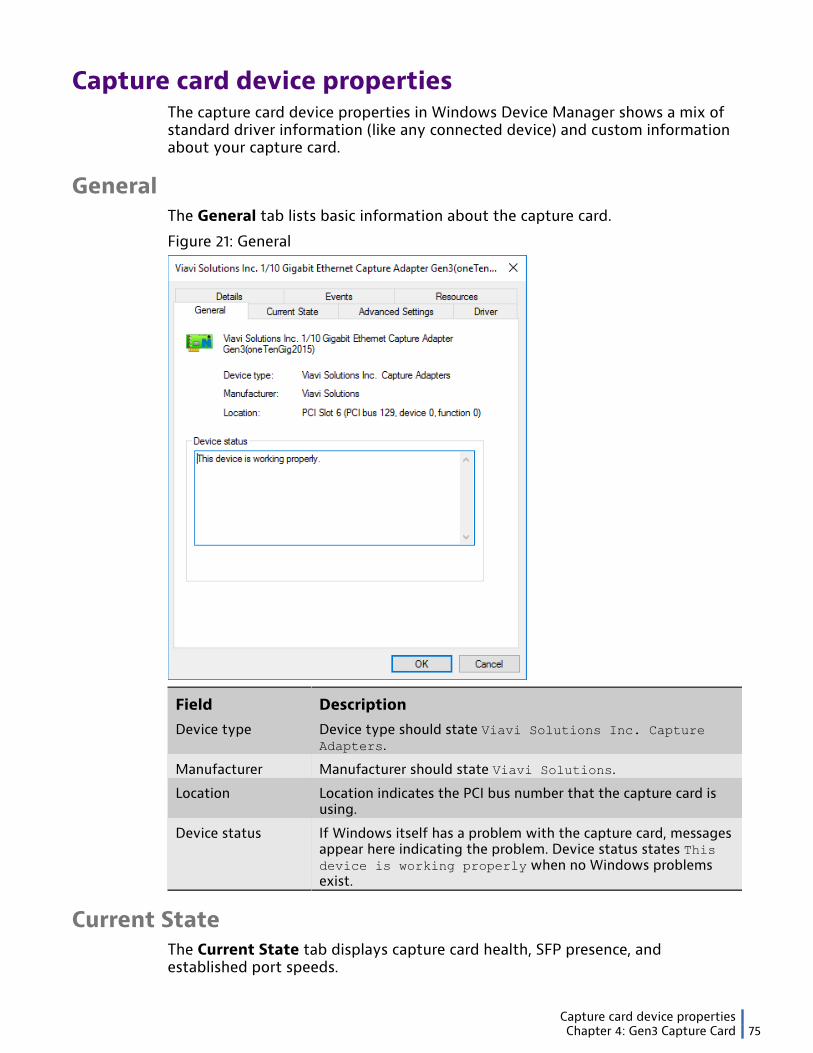
Capture card device propertiesChapter 4: Gen3 Capture Card 75
Capture card device propertiesThe capture card device properties in Windows Device Manager shows a mix ofstandard driver information (like any connected device) and custom informationabout your capture card.
GeneralThe General tab lists basic information about the capture card.
Figure 21: General
Field DescriptionDevice type Device type should state Viavi Solutions Inc. Capture
Adapters.
Manufacturer Manufacturer should state Viavi Solutions.
Location Location indicates the PCI bus number that the capture card isusing.
Device status If Windows itself has a problem with the capture card, messagesappear here indicating the problem. Device status states Thisdevice is working properly when no Windows problemsexist.
Current StateThe Current State tab displays capture card health, SFP presence, andestablished port speeds.

Capture card device properties76 Multi Probe (23 Feb 2018) — Archive/Non-authoritative version
Figure 22: Current State
Field DescriptionSFP state SFP state shows capture card ports that have a supported SFP
installed (page 58), if that SFP is operational, and if the SFPis fiber (F) or copper (C). If a capture card port does not have anSFP installed, its icon remains dimmed.
Link state Link state is a way to see if the Gen3 capture card issynchronized with the SPAN/TAP/Observer Matrix. If the linkstate is not green, there is a problem. Click the AdvancedSettings tab to try and change the adapter speed or auto-negotiation.
Enabled(Autonegotiation)
The icon is lit when auto-negotiation is enabled for that capturecard port. Conversely, the icon is dimmed when auto-negotiationis disabled for that capture card port.
10 Gig This icon is lit when a 10 gigabit connection is established.
1 Gig This icon is lit when a 1 gigabit connection is established.
100 Mb This icon is lit when a 100 megabit connection is established.
10 Mb This icon is lit when a 10 megabit connection is established.
PCIe lane speed The reported 1x lane bus speed of the PCIe slot used by thecapture card. Multiple lanes are used by the capture card, sothis value represents a fraction of actually available bandwidthbetween the capture card and the motherboard.
Temperature A green icon means the temperature of vital board componentsis lower than 75°C and therefore normal. Seeing a yellow icon isa caution that this temperature has risen above 75°C. A red iconis shown when this temperature is greater than 80°C, and you

Capture card device propertiesChapter 4: Gen3 Capture Card 77
Field Descriptionrisk immediate damage to the capture card. Always maintainproper case airflow and ambient temperature.
Power This icon shows a red color if there is a power problem. A powerproblem could occur if the 12v power supply (PSU) rail, typicallyfor MOLEX and auxiliary connections, is operating out-of-rangeand could indicate a dying power supply. A power problem couldalso be caused by the PCIe slot providing too little or too muchwattage to the capture card relative to the PCIe specification.This could indicate a motherboard problem or a dying PSU. Agreen icon means that power to the card is normal.
Board ID The unique ID of the capture card is shown here.
System ID The system ID is shown here.
Figure 23: Explanation of lights
Advanced SettingsThe Advanced Settings tab allows you to view and modify auto-negotiationand port Tx settings for the capture card. Each port has its own settings.

Capture card device properties78 Multi Probe (23 Feb 2018) — Archive/Non-authoritative version
Figure 24: Advanced Settings
Field DescriptionEnable (Port) Each box represents a physical port on the capture card. These
cannot be modified.
Auto-Neg Each box represents the auto-negotiation setting for a port onthe capture card. If selected, auto-negotiation for this port isturned on. If cleared, auto-negotiation is disabled for this port.See How to configure the card for an optical TAP, SPAN, or other(page 58) when using this setting.
Enable Port Tx Each box represents the a port on your capture card. All areenabled, and none can be disabled. See How to configure thecard for an optical TAP, SPAN, or other (page 58) when usingthis setting.
DriverThe Driver tab

Capture card device propertiesChapter 4: Gen3 Capture Card 79
Figure 25: Driver
Field DescriptionDriver provider Driver provider should state Viavi Solutions.
Driver date Shows the date that your currently installed capture card driverswere made.
Driver version Shows the version of your currently installed capture carddrivers. These do not always match your application versions forthe Observer Platform.
Driver signer
DetailsThe Details tab lists device properties that are reported by the driver.
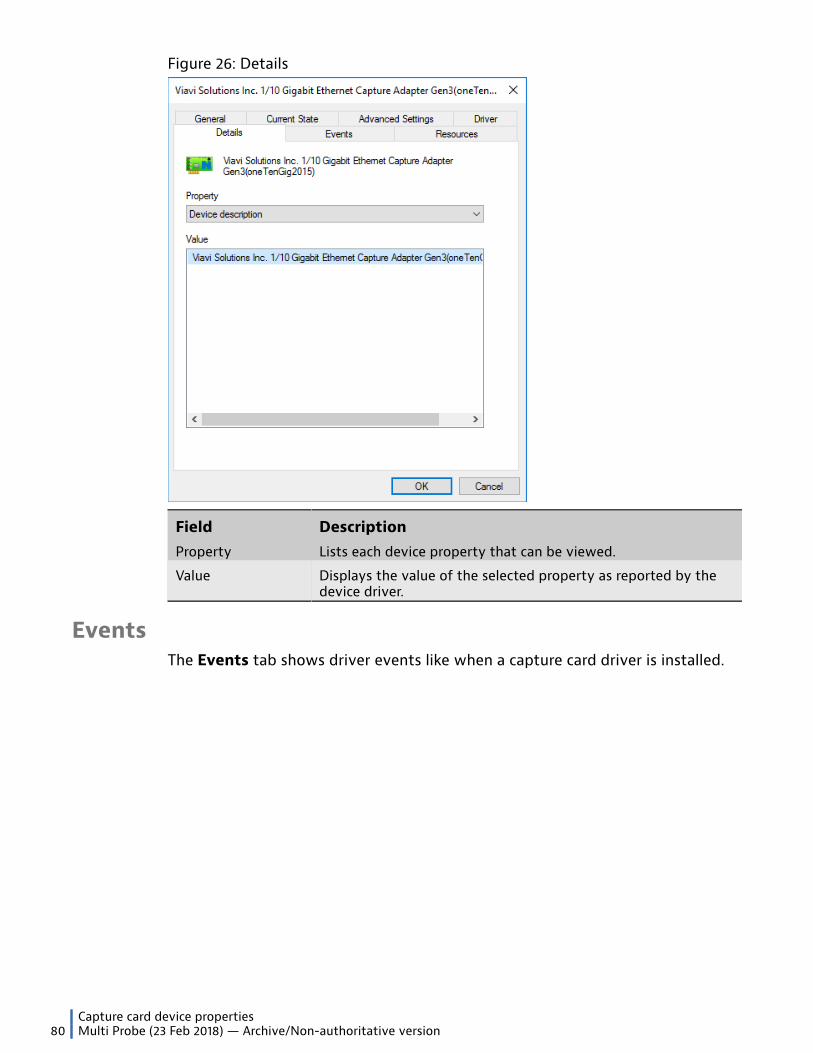
Capture card device properties80 Multi Probe (23 Feb 2018) — Archive/Non-authoritative version
Figure 26: Details
Field DescriptionProperty Lists each device property that can be viewed.
Value Displays the value of the selected property as reported by thedevice driver.
EventsThe Events tab shows driver events like when a capture card driver is installed.

Capture card device propertiesChapter 4: Gen3 Capture Card 81
Figure 27: Events
Field DescriptionEvents Each Windows event regarding the capture card is logged. This
can help you understand when the drivers were updated andcan be useful when troubleshooting.
Information The full event message shows here for the selected Windowsevent.
ResourcesThe Resources tab lists the interrupt request number and memory rangeassigned to the capture card. These values cannot be modified.
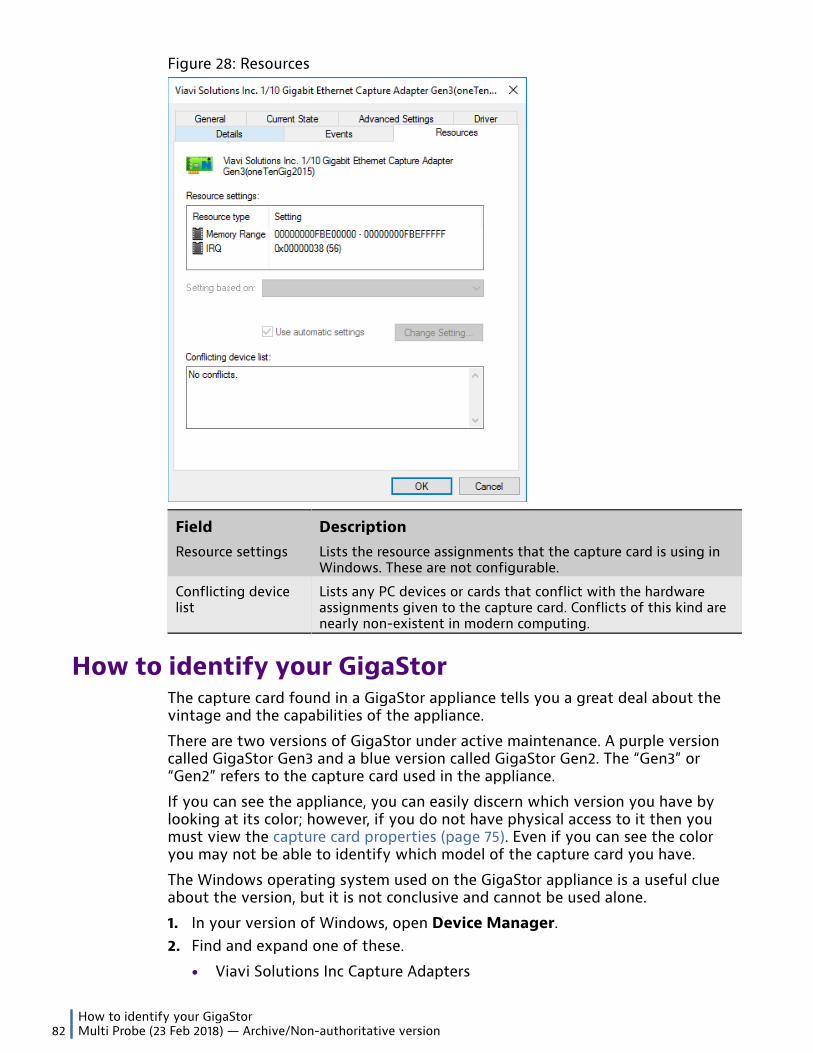
How to identify your GigaStor82 Multi Probe (23 Feb 2018) — Archive/Non-authoritative version
Figure 28: Resources
Field DescriptionResource settings Lists the resource assignments that the capture card is using in
Windows. These are not configurable.
Conflicting devicelist
Lists any PC devices or cards that conflict with the hardwareassignments given to the capture card. Conflicts of this kind arenearly non-existent in modern computing.
How to identify your GigaStorThe capture card found in a GigaStor appliance tells you a great deal about thevintage and the capabilities of the appliance.
There are two versions of GigaStor under active maintenance. A purple versioncalled GigaStor Gen3 and a blue version called GigaStor Gen2. The “Gen3” or“Gen2” refers to the capture card used in the appliance.
If you can see the appliance, you can easily discern which version you have bylooking at its color; however, if you do not have physical access to it then youmust view the capture card properties (page 75). Even if you can see the coloryou may not be able to identify which model of the capture card you have.
The Windows operating system used on the GigaStor appliance is a useful clueabout the version, but it is not conclusive and cannot be used alone.
1. In your version of Windows, open Device Manager.2. Find and expand one of these.
● Viavi Solutions Inc Capture Adapters
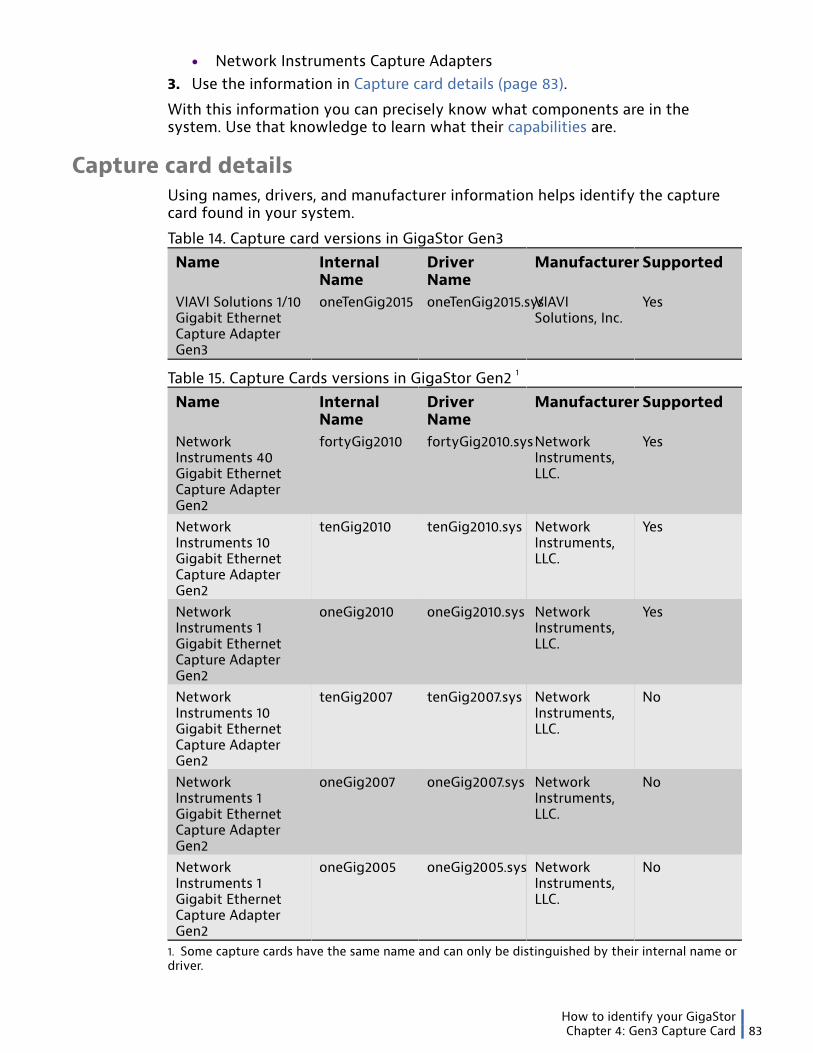
How to identify your GigaStorChapter 4: Gen3 Capture Card 83
● Network Instruments Capture Adapters3. Use the information in Capture card details (page 83).
With this information you can precisely know what components are in thesystem. Use that knowledge to learn what their capabilities are.
Capture card detailsUsing names, drivers, and manufacturer information helps identify the capturecard found in your system.
Table 14. Capture card versions in GigaStor Gen3Name Internal
NameDriverName
Manufacturer Supported
VIAVI Solutions 1/10Gigabit EthernetCapture AdapterGen3
oneTenGig2015 oneTenGig2015.sysVIAVISolutions, Inc.
Yes
Table 15. Capture Cards versions in GigaStor Gen2 1
Name InternalName
DriverName
Manufacturer Supported
NetworkInstruments 40Gigabit EthernetCapture AdapterGen2
fortyGig2010 fortyGig2010.sysNetworkInstruments,LLC.
Yes
NetworkInstruments 10Gigabit EthernetCapture AdapterGen2
tenGig2010 tenGig2010.sys NetworkInstruments,LLC.
Yes
NetworkInstruments 1Gigabit EthernetCapture AdapterGen2
oneGig2010 oneGig2010.sys NetworkInstruments,LLC.
Yes
NetworkInstruments 10Gigabit EthernetCapture AdapterGen2
tenGig2007 tenGig2007.sys NetworkInstruments,LLC.
No
NetworkInstruments 1Gigabit EthernetCapture AdapterGen2
oneGig2007 oneGig2007.sys NetworkInstruments,LLC.
No
NetworkInstruments 1Gigabit EthernetCapture AdapterGen2
oneGig2005 oneGig2005.sys NetworkInstruments,LLC.
No
1. Some capture cards have the same name and can only be distinguished by their internal name ordriver.
How to identify your GigaStor84 Multi Probe (23 Feb 2018) — Archive/Non-authoritative version
Can I upgrade a Network Instruments-manufactured, blue GigaStor to Observer 17.2 orlater?
Yes, if you have an active maintenance contract. No new features are available onthe Gen2 capture card as a result of this name change.
Can I put a Gen3 capture card in a Network Instruments-manufactured, blue GigaStor?
No, the Gen3 capture card is only available in the GigaStor Gen3 appliance.
Are firmware upgrades separately available?
Firmware and driver updates are only provided through the Observer installationprogram. Not every release contains firmware or driver updates; in fact, most donot.
5
Chapter 5: Troubleshooting
Troubleshooting common issuesUse the information in this section to assist you if you have a problem with yourprobe not connecting to your analyzer, your probe does not have a networkadapter available, or if you are using an nTAP and want to capture NetFlow trafficor several other common issues.
If you feel your probe is slow, see Troubleshooting a slow probe system (page86).
Although most installations of Observer Analyzer proceed without any trouble,due to the vast number of network configurations and hardware/softwareoptions that Observer supports, sometimes difficulty arises.
If you experience trouble in setting up Observer, keep a number of things inmind.
First and foremost, try to simplify your configuration in any way possible. Thismeans if you have a screen saver loaded, disable it. If you are running somenetwork add-on peer-to-peer jet engine turbo stimulator, remove it. This doesnot mean that you will not be able to use Observer with your other products but,if you can determine where the problem is, you can focus on that piece of thepuzzle and you may be well on your way to solving the problem.
Second, do not trust anyone or anything. The only way to really know whatyour hardware settings are is to have the card or device in one hand and thedocumentation in the other. Programs which discover interrupts and othersettings only function properly when everything is working correctly — exactlywhen you do not need them. Do not blindly trust other network drivers — theymay or may not be reporting the correct information.
Third, do not, under any circumstances, share interrupts, I/O ports, or memoryaddresses between adapters. No matter what has worked before or what

Troubleshooting common issues86 Multi Probe (23 Feb 2018) — Archive/Non-authoritative version
might work in the future, sharing interrupts or memory settings is not a validconfiguration.
Troubleshooting checklist:
Does your network work without any Observer programs or drivers loaded? Ifnot, check your network installation instructions. After your network appears tobe running correctly, install Observer again. Try installing Observer on a differentsystem and see if you experience the same problem. This does not mean thatyou will not be able to use Observer on the desired system. It may give you someinsight into the problem that you are having.
Troubleshooting a slow probe systemIf a probe is overloaded, consider whether any of the following affect thesystem. You can clear these one at a time to see if that resolves the system’sissue.
Although all of the settings discussed in this section are configured in Observer ,they are saved to the probe.
♦ A scheduled capture can be causing a system slow down. Determine if anyscheduled capture is occurring. On the Home tab, in the Capture group,click Live > Packet Capture and then Settings > Schedule.
♦ Some extra processing happens when you have triggers and alarmsconfigured. Determine what alarms are enabled by clicking the AlarmSettings button in the lower left.
♦ Are you running real-time Expert Analysis? Observer requires someprocessing resources to get through the data, which could be a lot of data.Real-time expert processes data as it is received. This requires continuousprocessing of incoming data while the real-time expert is running.
♦ Are you collecting combined station statistics or protocol distributionsummary for your network? If so, these could be causing the system toslow down. To determine if you are, click the File tab, and click Options >General Options. Scroll to Startup and runtime settings and clear thesesettings, if necessary:
● Collect combined station statistics at all times● Collect protocol distribution for the whole network
♦ Are you collecting network trending statistics? If so, is the samplingdivider less than 10? If so, increase the sampling divider to 10 or greater.To determine your sampling divider, on the Home tab, in the Capturegroup, click Network Trending > Network Trending. Then click Settings> General tab. In the Collection Settings section, change the samplingdivider.
A probe is not connecting to the analyzer or vice versaIf the probe is not connecting, it could be one of several reasons. The log windowin Observer has useful information to give you an idea of why the connection isfailing.
Verify the following:
♦ The probe is licensed. See Licensing and updating (page 21).

Troubleshooting common issuesChapter 5: Troubleshooting 87
♦ Check that the Observer Platform ports are open on the firewall andif traffic is actually passing through it. Observer uses these ports tocommunicate with the probe. See or Ports used by Observer productsv16 and earlier (page 92) depending on your version. Check any localsystem firewall as well as any network firewall. See also the information inSuspected NAT or VPN issues (page 90).
♦ Check that the security certificates are trusted between the Observer andthe probe. If the settings do not match, you might get a message thatsays “Probe redirection Error <IPAddress> Authentication NegotiationError” or “Probe authentication failed <IPAddress>.” Either a certificate isuntrusted by one of the assets or a certificate is pending your approval.In Observer, click and click the Security tab. Verify that the specificcertificates are in a trusted state.
♦ The probe and Observer are within the same minor build range.♦ You can access the VLAN if the probe or Observer are on different VLANs.
There is nothing you need to configure in Observer or the probe to enablea connection when they are on different VLANs. However, if you do nothave network permissions to access a probe on a different VLAN, it is anetwork configuration issue (usually for security reasons) and you shouldcontact the network administrator.
No network adapter availableAfter starting Observer, if you do not see any available adapters listed in the“Select Network Adapter” list, it means your NIC does not have the necessarydriver or VMONI Protocol settings installed. Use this information to enable youradapter and to install the proper drivers.
1. If Observer is running, close it.2. Ensure you are logged in to the system with an account with administrator
rights.3. From the Windows Start menu, choose Control Panel > Network and
Sharing Center.4. Click Change Adapter Settings.5. Right-click any of the Local Area Connections and choose Properties.6. Look at the list of installed components to verify that the VMONI Protocol
Analyzer is listed. Then do one of the following:
● If it is not installed, skip to step 7.● If the VMONI driver is listed, remove it. Select VMONI Protocol Analyzer
and click the Uninstall button. After the VMONI driver is removed, restartthe system and continue with step 7.
7. From the Local Area Connection Properties (step 5), choose Install > Protocol> Add > VIAVI – VMONI Protocol Analyzer and click OK. If the VMONI driveris not listed, click Have Disk, then browse to the VMONI.SYS file located in theObserver directory on your hard drive, select it, and click OK.
The VMONI Protocol Analyzer will now be available to install.8. Restart the computer after you have completed installing the driver.
You should now be able to select an adapter when starting Observer.
Troubleshooting common issues88 Multi Probe (23 Feb 2018) — Archive/Non-authoritative version
Integrated adapters report all sent packets with bad TCPchecksum
Symptoms: All TCP packets sent from Observer or probe station across anintegrated network adapter contain bad TCP checksums.
Causes: Default driver settings for the card are incorrect. You must update thedriver and then disable the “Offload Transmit TCP Checksum” option.
Solutions: Upgrade the driver for the integrated network adapter to theNetwork Instruments/Intel Pro 1000 adapter driver. This driver is located inthe:\<Observer installation directory>\Drivers\IntelPro1000directory.
1. After upgrading the driver, right-click the adapter and go to Control Panel >Network Connections > Properties.
2. On the General tab, click the Configure button.3. Click the Advanced tab and find the Offload Transmit TCP Checksum option
and disable it.4. Restart your system.
“No VLAN” shown while using a Gigabit NICSymptoms: “No VLAN” is displayed in VLAN Statistics and/or no 802.1Q taginformation is shown in your decode. The network adapter you use to capturetraffic is a Gigabit NIC.
Causes: Observer is not seeing the 802.1Q tag on packets being captured. Thisis sometimes caused by your switch not sending tagged packets to Observer.See VLAN Statistics tool is not working (page 88) for explanation/resolutionbefore proceeding.
Solutions: If you are using a Gigabit NIC to capture the traffic and you havechecked the switch configuration, then try using this solution. For BCM5751MNetXtreme Gigabit chips found in IBM T43, HP laptops, and Dell Latitude laptops;there is a registry key HKEY_LOCAL_MACHINE\SYSTEM\CurrentControlSet cancause the driver and chip not to strip the 802.1Q headers. To set that key, youmust find the correct instance of the driver in Windows registry and change it.
1. Open the Windows registry editor. Start > Run > Command and typeregedit.
2. Search for “TxCoalescingTicks” and ensure this is the only instance that youhave.
3. Right-click the instance number (e.g., 0008) and add a new string value.4. Type PreserveVlanInfoInRxPacket and give it the value 1.5. Restart the computer.
The Gigabit NIC no longer strips VLAN tags, so the symptom in Observer isresolved.
VLAN Statistics tool is not workingSymptoms: “No VLAN” is the only VLAN ID that shows up in the VLANs columnin VLAN Statistics. You are not seeing all VLANs you have on the network.
Troubleshooting common issuesChapter 5: Troubleshooting 89
Causes: To display VLAN Statistics, Observer checks each packet for a VLANtag; if no tag is present, the packet is logged as “No VLAN.” Both 802.1Q or ISLVLAN tags are stripped unless the SPAN destination port to which the analyzer isattached has been configured to include VLAN tags.
Solutions: Configure the switch to retain the VLAN tags through the monitorport. This may be an option in the Mirror or SPAN command on the switch, oryou may have to configure the port as a trunk prior to defining it as a SPAN port.Even if the switch is monitoring a trunk or uplink port it may strip VLAN tagsunless you configure that port to retain the tags. Refer to the documentationfrom your switch for details on configuring VLANs, trunks, and analyzer ports.
If connecting Observer to a Cisco switch, see the following link (it does requirea TAC account): http://www.cisco.com/en/US/customer/products/hw/switches/ps708/products_tech_note09186a008015c612.shtml.
If you use a Cisco Catalyst 4500/4000, 5500/5000, or 6500/6000 Series Switchrunning CatOS you must configure the destination port as a trunk port prior toconfiguring the SPAN port using the set trunk and set span commands: set trunk module/port [on | off | desirable | auto | nonegotiate] [vlan_range] [isl | dot1q | negotiate] set span source_port destination_port [rx | tx | both]
For example, to configure module 6, port 2 for monitoring an 802.1Q VLAN setup,you would enter the following commands: switch (enable) set trunk 6/2 nonegotiate dot1Q switch (enable) set span 6/1 6/2
For Cisco Catalyst 2900/3500, 4500/4000 and 5500/5000 Series Switches RunningIOS 12.1 or later, encapsulation forwarding is set as a part of the SPAN command,which has the following syntax: monitor session session_number (source | destination) interface type/num [encapsulation (dot1q | isl)]
To monitor 802.1Q VLAN traffic passing through Fast Ethernet 02 via a SPAN portset up on Fast Ethernet 0/6, you would enter the following commands: C4000 (config) # monitor session 1 source interface fastethernet 0/2 C4000 (config) # monitor session 1 destination interface fastethernet 0/6 encapsulation dot1Q
For a 6500/6000 Series Switch running Native IOS 12.1 or later you must configurethe destination port as a trunk port prior to configuring the SPAN, which havethe following syntax: C6500(config)#Interface Type slot/port C6500(config-if)#Switchport C6500(config-if)#Switchport trunk encapsulation { ISL | dot1q } C6500(config-if)#Switchport mode trunk C6500(config-if)#Switchport nonnegotiate
Troubleshooting common issues90 Multi Probe (23 Feb 2018) — Archive/Non-authoritative version
To monitor 802.1Q VLAN traffic passing through Fast Ethernet 02 via a SPAN portset up on Fast Ethernet 0/6, you would enter the following commands: C6500 (config) # interface fastethernet 0/6 C6500 (config-if) #switchport C6500 (config-if) #switchport trunk encapsulation dot1q C6500 (config-if) #switchport mode trunk C6500 (config-if) #switchport nonnegotiate C6500 (config-if) #exit C6500 (config) # monitor session 1 source interface fastethernet 0/2 C6500 (config) # monitor session 1 destination interface fastethernet 0/6
Using Discover Network Names on a Layer 3 switch that usesVLANS
Symptoms: While running Discover Network Names against a Layer 3 Switchthat uses VLANs, you see only a limited number of MAC addresses, whichtypically have multiple IP Addresses associated with them.
Causes: Layer 3 Switches that have been configured to perform routing replacethe originating station's MAC Address with the MAC Address of the switch port.For example, suppose CADStation1 has a MAC Address of 00:00:03:AB:CD:00 andan IP Address of 10.0.0.1. It is connected to switch port 1 through a hub. Port 1 ofthis switch has a MAC Address of 00:11:22:33:44:55.
When a probe is connected to a SPAN or mirror port of that switch, it showsCADStation1 with an IP of 10.0.0.1 and MAC address of 00:11:22:33:44:55 ratherthan 00:00:03:AB:CD:00 because of this substitution.
Now, suppose there is another station (CADStation2) with MAC address of00:00:03:AB:EF:01 and has an IP address of 10.0.0.2 that is also connected toport 1 of the switch through a hub. Because Discover Network Names storesstation information by MAC address (i.e., the MAC address is the unique stationidentifier), it changes the IP address of switch port 1's MAC address.
Because a switch configured as such hides originating station MAC addressesfrom Observer, MAC-based station statistics (such as Top Talkers-MAC, PairStatistics matrix, etc.) can only be calculated by port. To make the Observerdisplays more useful, follow this solution.
Solutions: By examining the switch configuration you can obtain a list ofMAC addresses that are associated with each port of your switch. Then, useDiscover Network Names to edit the alias entry for 00:11:22:33:44:55, labeling it“SwitchPort1.“
The IP based statistical modes (Internet Observer, Top Talkers – IP (by IP Address)still show you statistics calculated from individual stations by their IP address.But MAC-based statistical modes (Pairs Statistics Matrix, Protocol Distribution,Size Distribution Statistics, Top Talkers –MAC (by hardware Address) will nowshow data by Port.
Suspected NAT or VPN issuesIf you use network address translation (NAT) in your environment, you mustmake some configuration changes in Observer. Using the TCP/IP port informationin Ports used by Observer products v16 and earlier (page 92), you should beable to set up the NAT properly.
Troubleshooting common issuesChapter 5: Troubleshooting 91
If the probe is outside the network where Observer is running, you must forwardport 25901 from the probe’s address to the system running Observer.
When redirecting the probe, you must specify the NAT outside IP address insteadof the address that Observer puts in automatically. By default, Observer tries touse its local IP address, which the probe will not be able to find. Select “Redirectto a specified IP address” in the Redirecting Probe or Probe Instance dialog andtype the VPN client’s IP address.
Running Observer passively affects NetFlowWhen analyzing a link using a TAP, which is common, Observer runs “passively.”Passive operation guarantees that analysis will not affect the link; however, itdoes have some implications when running NetFlow. Because there is no linkover which the system can transmit packets or frames, the following features areunavailable:
♦ Traffic Generation♦ Collision Test♦ Replay Packet Capture
Daylight Savings TimeObserver is not coded with a specific date in mind. Daylight Savings Time iscontrolled by the operating system. When the clock rolls backwards or forwardsObserver rolls with it, with one exception: packet capture/decode.
Packet capture provides nanosecond time resolution, which none of the rest ofthe product does. Because of this, packet capture does not rely on the systemclock to provide time stamps. It relies on the processor time ticks. When Observeropens it requests the system time and the number of processor time ticks anduses those. This allows Observer to know what date and time it is when a packetis seen.
Because the Observer only asks the operating system for the system time whenObserver is started, packet capture does not know that the time has jumpedforward or backward. To get this to happen you need restart Observer after thetime change. It is that simple.
Configuring Cisco 6xxx switches using a SPAN port to a full-duplex Gigabit Probe
When using a full-duplex Gigabit Probe to capture directly from a SPAN/mirrorport, use a straight-through cable from the Gigabit port on the switch to eitherport A or B on the Gigabit card in the probe. Do not use the Y-cable or TAP (theTAP and Y-cable should only be used inline).
To use Observer with the Cisco 6xxx switch, you must disable auto negotiation.With auto negotiation enabled, the switch and probe may create a link when firststarting the probe, but if the cable is unplugged or if a configuration change tothe SPAN/mirror port is applied, you will lose connectivity to the switch. To turnauto negotiation off on the switch, follow the directions based on the OS you areusing on your switch.
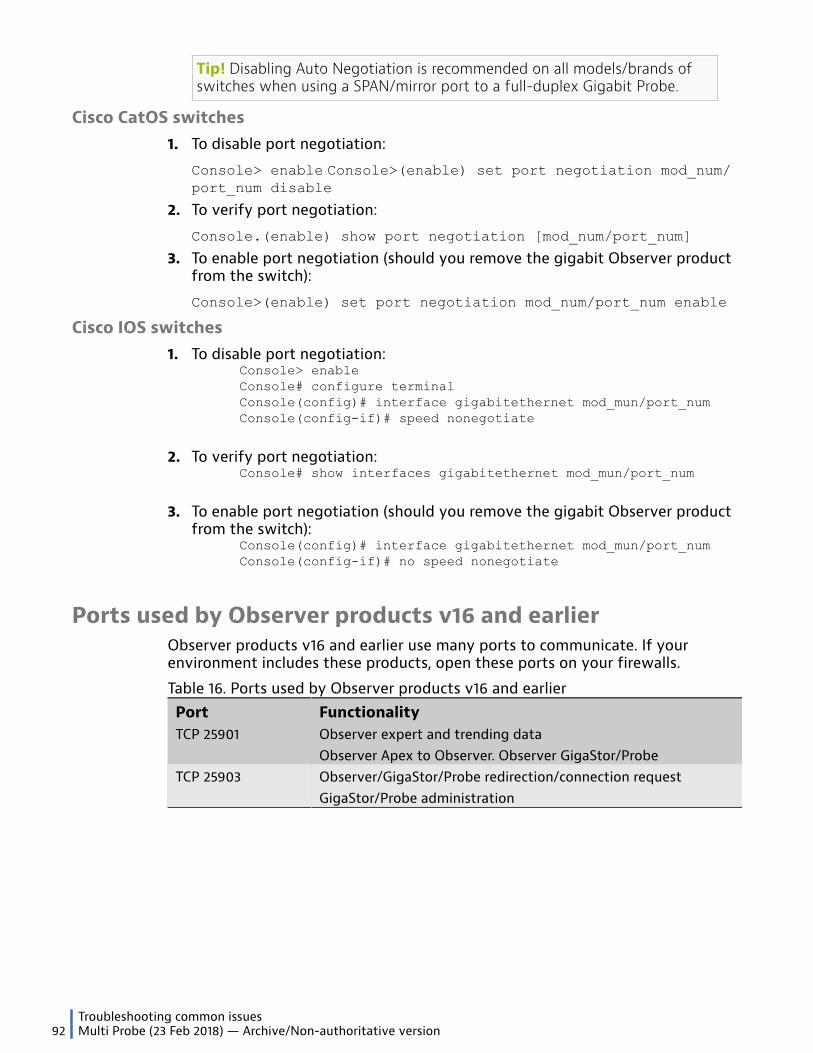
Troubleshooting common issues92 Multi Probe (23 Feb 2018) — Archive/Non-authoritative version
Tip! Disabling Auto Negotiation is recommended on all models/brands ofswitches when using a SPAN/mirror port to a full-duplex Gigabit Probe.
Cisco CatOS switches1. To disable port negotiation:
Console> enable Console>(enable) set port negotiation mod_num/port_num disable
2. To verify port negotiation:
Console.(enable) show port negotiation [mod_num/port_num]
3. To enable port negotiation (should you remove the gigabit Observer productfrom the switch):
Console>(enable) set port negotiation mod_num/port_num enable
Cisco IOS switches1. To disable port negotiation:
Console> enable Console# configure terminal Console(config)# interface gigabitethernet mod_mun/port_num Console(config-if)# speed nonegotiate
2. To verify port negotiation: Console# show interfaces gigabitethernet mod_mun/port_num
3. To enable port negotiation (should you remove the gigabit Observer productfrom the switch): Console(config)# interface gigabitethernet mod_mun/port_num Console(config-if)# no speed nonegotiate
Ports used by Observer products v16 and earlierObserver products v16 and earlier use many ports to communicate. If yourenvironment includes these products, open these ports on your firewalls.
Table 16. Ports used by Observer products v16 and earlierPort FunctionalityTCP 25901 Observer expert and trending data
Observer Apex to Observer. Observer GigaStor/ProbeTCP 25903 Observer/GigaStor/Probe redirection/connection request
GigaStor/Probe administration

6
Chapter 6: Backups and Restoring
Many of the tools in Observer have the ability to import and export settings. Youcan use this functionality to back up or restore certain parts of your softwareconfiguration.
Backing up your GigaStor settingsYou can back up most Observer settings and configuration data. Backups areuseful when migrating to new hardware, upgrading the operating system, orrecovering from data loss.
Caution: If you are using data encryption on your GigaStor system, youmust save the encryption keys before upgrading the operating system.Because the keys are typically stored on the operating system drive, theywill be lost during the upgrade process. If you do not have a copy of thekeys elsewhere, you will not be able to access stored data (packets) afterthe upgrade is complete.
Your Observer may not have each directory referenced in this topic, but you canback up those that are present. Use whatever backup method is best for you.
To back up many Observer settings and files, do the following:
♦ Copy the files and directories in Table 17 (page 93) to a backup location.This must be a location other than the operating system drive of thesystem you are planning to upgrade.
Table 17. Directory or files to back upDirectory or file DescriptionNetwork Trending C:\Program Files\Observer\NetworkTrending
This contains your Network Trending data. If you have changedthe default location for Network Trending data, you must to

Backing up your GigaStor settings94 Multi Probe (23 Feb 2018) — Archive/Non-authoritative version
Directory or file Descriptionback up the new location. Use the Folders tab in to verify whichfolder is used for trending data.
Protocol Definitions C:\Program Files\Observer\ProtocolDefs
This contains any modifications or additions you have made tothe protocol definitions list for each probe instance. Back up inall cases.
MulticastDefinitions
C:\Program Files\Observer\MulticastDefinitions
This contains the templates for defining trading multicaststreams for Network Trending. Back up if you use tradingmulticasts in Network Trending.
Settings C:\Program Files\Observer\Settings
This contains alarms and triggers. Back up if you heavily usealarms or have alarm/trigger customizations that need to beretained.
SNORT Rules C:\Program Files\Observer\Forensics
This contains your SNORT information, such as rules, fordetecting malicious activity in your packet captures. Back up ifyou use SNORT.
Expert Thresholds C:\Program Files\Observer\ExpertSettings
This contains your thresholds stored in Expert settings. Theseinclude TCP/UDP events and some triggers for problemidentification. Back up if you have modified any Expertthresholds and want to retain those customizations.
SNMP C:\Program Files\Observer\SNMP
This contains any custom MIBs, compiled MIBs, request files andSNMP trending data. Back up if you have made SNMP changesor have SNMP trending data. Use the Folders tab in to verifywhich folder is used for SNMP.
Address Tables C:\Program Files\Observer\LocalAddressTable
This contains your Discover Network Names list. Back up if youhave run Discover Network Names and have saved the alias list.C:\Program Files\Observer\ProbeAddressTable
This contains the Discover Network Names list from any remoteprobe that has connected to this Observer analyzer. Back up ifyou have run remote Discover Network Names and saved thealias list.
Scripts C:\Program Files\Observer\Scripts
This contains the scripts for Observer. Back up if you havecreated or modified a script.
Windows Registry Using Regedit, export the following registry branch:32-bit Windows operating system running any version, or 64-bitWindows operating system running version 16 or higher:HKEY_LOCAL_MACHINE\SOFTWARE\Network Instruments
License Make note of the license information in . You need the contact/department, company, identification number, and licensenumber.

Index 95
Index
Numerics10 Gb Probe 2110/100 network 6025901 (port) 86, 92, 9225903 (port) 86, 9232-bit 5264-bit 5264-bit, RAM 52802.11 5, 5, 8, 13, 33802.1Q 88
Aactive instance vs. passive instance 6adapter speed 33Adapter Speed tab 33additional volumes, using 26address tables 23, 93Advanced Settings 61, 75AES 30, 30, 38alarms 8, 13, 86allocating 55analyzer connection 86Anyone account 86, 86as probe or analyzer 41ATM 33, 34auto-negotiation 58, 61, 75, 77
SPAN port 58autoupgrade 30Autoupgrade tab 33autoupgrading 30, 33
Bbackup
installation 21backups 23, 93bad TCP checksums 88
troubleshooting 88best practices 6BIOS memory hole 52Board ID 61, 75broadcast traffic 26, 69buffer 49buffer size 6buffer statistics 49buffer, see capture buffer and statistics buffer 49buffers 6, 8, 8, 8, 13, 13, 13, 52, 53
Ccapture buffer
64-bit Windows 49
Max Buffer Size 49RAM limitations 49size 49
capture card 32, 57, 57, 61, 83advanced settings 77Advanced Settings 61, 75auto-negotiation 58Board ID 61, 75current state 75details 79driver 78driver requirements 17events 80general 75passive probe instance 6performance 6probe instance warning 6properties 61, 75recommendations 55resources 81SPAN port, 10 Gb link 58time synchronization 32troubleshooting SPAN port 58virtual adapters 63
capture card driver 17capture decodes 33CDU 33Cisco 6xxx switches 91
troubleshooting 91Cisco EAP/LEAP 42clock synchronization 32collecting data 32collection interval 45collision test 91, 91common issues 85common problems with 86, 86configuring 30, 33, 33, 33, 33, 33, 33, 33
network trending folder 30probe name 30
configuring statistics memory 31connecting 28connecting to analyzer 27, 27, 27, 28, 32CRC-16 34CRC-32 34CSU 33
encapsulation 34, 34
DD3 33D3/E3/HSSI 33daylight savings time 91Daylight Savings Time 91, 91

96 Index (23 Feb 2018) — Archive/Non-authoritative version
decoding 8, 8, 8, 13, 13, 13deduplication 65, 74defining its purpose 55defining probe as 63definition 5device manager 75, 75, 77, 78, 79, 80, 81Discover Network Names 90, 90, 90
VLANs 90DNS resolution 30driver requirements 17, 17, 17drivers 61drivers, wireless 18DS3
fractionalized 34DSU
encapsulation 34, 34
EE1 33
WAN relay type 34E3 33
fractionalized 34EAP/LEAP 42Edit Probe Instance 50effects of packet capture 53encapsulation 33, 34, 34, 34, 34, 34, 34, 34, 34encryption 30, 30
AES 38see also security 38
encryption key 21, 30, 42, 86encryption keys 21ErrorTrak 12Ethernet 5, 5, 8, 33
full-duplex 8, 13jumbo frames 33
Expert Probe 8, 8, 8, 13, 13, 30as probe or analyzer 41changing NIC 26, 69configuring 33, 33connecting to analyzer 27NetFlow 45port bonding 42, 66redirection 27
expert summary 8, 13
Ffilters 45, 45filters, hardware 74firewall 92firewall, ports 86fractionalized 33, 34, 34, 34, 34frame check sequence 33frame checksum 33frame relay 33frame size 33Frame too large 33full-duplex 8, 13full-duplex Ethernet 8, 13
GGen2 capture card 83Gen3 57, 57, 61Gen3 capture card 83General tab 33
Gigabit 8, 33defining probe as 63jumbo frames 33
Gigabit Probe 21Gigabit tab 33gigabytes 49, 49GigaStor 27, 55
AES 30collision test 91encryption 30RAM 55recommendations 55reserved memory 55traffic generation 91
GigaStor capture 6, 8, 13GigaStor Portable 91
HHA
See hardware acceleration 96hardware 15, 50hardware acceleration 55, 69, 70, 73, 74hardware filters 74hardware requirements 12HSSI 33, 34HSSI, fractionalized 33
Iin a switched environment 10install 16installation 16, 17, 17, 21installer 16installing 16, 17, 17interface switching 8, 13IP address
GigaStor 27NAT 90
IP masquerading, see NAT 90IP precedence 33, 33
Jjumbo frames 33, 33, 33
LLAPB 33laptop
NICs 42using as probe 42wireless 42
Layer 3 Switch 90license 23, 93license update 22licenses
redeeming 21troubleshooting 21
licensing 22line frame 33load, preprocessor 6
MMAC addresses 90matching between probe and analyzer 86

Index 97
Max Buffer Size 49megabytes 6memory 50, 50memory allocation 31memory management 49memory tuning 49memory, see RAM 53Microsoft 20minimum specifications 15minimum specs 15mirror port 10, 63mirror port, see also SPAN ports 10mirror port, see SPAN 60missing 87missing from Observer 26, 69moving through RAM 53MPLS 8, 13, 24, 33, 33Multi Probe 8, 8, 13
changing NIC 26, 69configuring 33, 33connecting to analyzer 27redirection 27
multicast 23, 93multiple in a system 32
Nname, changing 30NAT 90, 90, 90NetFlow 8, 13, 33, 45, 91
TAPs and 91versions supported 45
NetFlow collector 45NetFlow Trending collector 45network adapter, see also NIC 26, 69network card
See capture card 95network masquerading, see NAT 90network trending 8, 13, 42, 86
filters 45sampling divider 45
Network Trending 23, 93network trending folder 30NIC 8, 13, 18
broadcast traffic 26, 69changing 26, 69missing 26, 69, 87missing from Observer 26, 69multiple in a system 32See capture card 95
NICs 42NIProbe.exe 21no network card 26, 69not connecting 86
OObserver
no network card 26, 69ports used 92switching to probe 8, 13system requirements 12
Observer Analyzer 21Observer GigaStor 21Observer Management Server 30observer.exe 21
OMS 8, 13, 30operating system 16options 30OSI Layer 1 & 2 errors
SPAN 60
Ppacket capture 33, 33, 53
active instance vs. passive instance 6buffer 49daylight savings time 91decoding 8, 13GigaStor Portable 91memory 50RAM 53
packet captureswireless 12, 42
packetsdeduplication 65moving through RAM 53RAM 53
passive probe instance 6performance 6port bonding 8, 13, 42, 66port Tx 77ports used 92Probe administration, port required 92probe connection 86probe instance
active 6, 49active vs. passive 6assigning to adapter 63best practices 6configuring 33configuring statistics memory 31connecting 28connecting to analyzer 32defining its purpose 55definition of 6memory allocation 31memory tuning 49passive 6passive to active 63redirecting 27reserving memory 49specifying NIC 32virtual adapters 63
probe instance warning 6probe instances
redirecting 28, 71probe name 30probe redirection 27Probe redirection error 86Probe Service Configuration Applet 41probes 28, 71
Adapter Speed tab 33Autoupgrade tab 33autoupgrading 30, 33backing up 23, 93clock synchronization 32collecting data 32common problems with 86, 86configuring 30connecting to analyzer 27, 28D3/E3/HSSI 33

98 Index (23 Feb 2018) — Archive/Non-authoritative version
definition 5encryption keys 21General tab 33Gigabit tab 33hardware 50hardware acceleration 55in a switched environment 10IP precedence 33MPLS 33name, changing 30not connecting 86options 30port bonding 42, 66see probe instances 28, 71protecting 20running as Windows service 30security 28, 71software, versions 8SPAN ports 8statistics sampling divider 33switching to analyzer 8, 13T1/E1 tab 33updating 20upgrading 21, 21Virtual Adapters tab 33VLAN access 86WAN 33wireless 33Wireless 802.11 tab 33
see probe instances 28, 71promiscuous mode 10, 12, 42protected memory 47, 50, 50, 50, 52, 53protecting 20
QQoS 33QSFP
See SFP/SFP+ 98
RRAID 6, 6, 26RAM 15, 53, 53, 53, 55
allocating 55buffer size 6effects of packet capture 53formula 49GigaStor 55limitations 49packet capture 6, 49see also buffer 49see also protected memory, user memory, andreserved memory 47recommendations 52reserving for Observer 33resizing 47statistics 49tuning 49used in Observer 47Windows 49
RAM limitations 49RAM needed for busy networks 55Random Access Memory, see also RAM 47recommendations 52recommended specifications 15
recommended specs 15redirecting 27, 28, 71redirecting, see probes 28redirection 27, 27, 27, 27registry 23, 93requirements, hardware/software 12reserved memory 8, 13, 50, 50, 52, 53, 55
see also RAM 47reserved memory from 8, 13reserved memory in Observer 33reserving for Observer 33reserving memory 49resizing 47risks, SPAN 60RMON 10running as Windows service 30running Observer or Probe 41
Ssampling divider 45, 45, 86scripts 23, 93secure boot 16security 8, 13, 28, 71
encryption 38encryption key 86matching between probe and analyzer 86personal information 21Probe redirection error 86probes 28, 71
service 30services 41settings 10sFlow 8, 13, 33sFlow, versions supported 45SFP/SFP+ 58, 61, 75simultaneous 8, 13Single Probe 8, 8, 13
Anyone account 86changing NIC 26, 69configuring 33, 33redirection 27
Single Probe memory limit 50slow 24slow probe system 86SNMP 10, 23, 93SNORT 23, 93software probes 8, 21software requirements 12software, versions 8SPAN 63
auto-negotiation 58risks 60VLANs 88
SPAN port 58, 88SPAN port, 10 Gb link 58see also mirror port 10SPAN ports 8
broadcast traffic 26, 69settings 10software probes 8see also mirror port 10
SPANOSI Layer 1 & 2 errorsOSI Layer 1 & 2 errors 60
specifications 15specifying NIC 32

Index 99
specs 15statistics 33, 42, 49
collection interval 45memory 50packet capture 33RAM needed for busy networks 55sampling divider 45, 86
statistics buffer 49, 49statistics queue buffer 47, 50, 52, 53, 53, 55, 55statistics sampling divider 33storage 15switching to analyzer 8, 13switching to probe 8, 13synchronization 32, 91system requirements 12system specification 15
TT1 33
WAN relay type 34T1/E1 tab 33TAP
NetFlow 91TAPs and 91TCP 90TCP 25901 92TCP 25903 92TCP/IP 90third-party capture card
driver requirements 17third-party hardware 15time synchronization 32, 32, 91Top Talkers 49topologies 5, 8, 13
802.11 5Ethernet 5
ToS 33traffic generation 91, 91transceiver
See SFP/SFP+ 98triggers 8, 13, 86troubleshooting 88, 91
analyzer connection 86bad TCP checksums 88Cisco 6xxx switches 91common issues 85probe connection 86slow probe system 86VLAN Statistics tool 88, 88VLAN visibility 90
troubleshooting SPAN port 58
UUDP 25903 92updating 20
Observer 21updating virus protection 20upgrade 17, 17upgrading 17, 17, 21, 21, 21upgrading version 16 17upgrading version 17 17upgrading, encryption keys 21user memory 47users 8, 13, 86
simultaneous 8, 13using as probe 42
Vv16 17v17 17version 16 17version 17 17versions supported 45virtual adapter 6, 33, 42, 66, 69, 70, 73, 74virtual adapter, probe instances 63virtual adapters 63Virtual Adapters tab 33, 63virtual machine 12, 15virus protection 20VLAN 88, 88
"No VLAN" 88, 88VLAN access 86VLAN Statistics 88VLAN Statistics tool 88, 88VLAN visibility 90VLANs 88, 88, 90
Discover Network Names 90SPAN port 88
VM specs 15VMONI 87VMONI Protocol Analyzer 87VMware 15VoIP 8, 13, 33VPN 90vSphere 15
WWAN 33, 33, 33
fractionalized 33WAN relay type 34, 34WAN Type 34, 34Windows 18
32-bit 23, 52, 9364-bit 23, 49, 52, 93registry 23, 93reserved memory from 8, 13reserved memory in Observer 33service 30services 41
Windows 10 16Windows 2003 16Windows 2008 16Windows 2012 16Windows 2016 16Windows 7 16Windows 8 16Windows memory pool 50, 50Windows protected memory 47Windows updates 20Windows Vista 16wireless 5, 8, 8, 12, 13, 33, 33, 42, 42Wireless 802.11 tab 33wireless access point 42wireless driver 18wireless network, encryption key 42wireless packets, raw 12, 42
Symbols

100 Index (23 Feb 2018) — Archive/Non-authoritative version
"No VLAN" 88, 88