multi-parameter petrophysical characterization of … · doch genutzt werden, um gesteine mit hohen...
TRANSCRIPT
AbstractUnderstanding the variation and correlation between physical properties of ore bodies of interest is vital for every exploration
project. Therefore comprehensive petrophysical laboratory measurements on representative sample material from two disperse-mineralized greisen bodies of the Southern Bohemian Batholith (Austria) and the Eastern Erzgebirge Vulcano-Plutonic Complex (Germany), respectively, are presented in this study. As many greisen bodies host mineral deposits of economic interest, the aim of the study was to identify petrophysical properties which are suitable for distinguishing greisen bodies from the surrounding rocks. The gathered physical information (density, porosity, velocity, magnetic susceptibility, gamma spectroscopy, electrical resis-tivity, spectral induced polarization (SIP)) indicates that a differentiation of mineralized greisen zones of interest from the surroun-ding rocks is only possible based on a combined investigation of several parameters. Elevated grain and bulk densities (mean:
32.75 g/cm and 2.67 g/cm , respectively) are indicative of the Erzgebirge low-porosity (mostly < 3%) mineralized greisen rocks in comparison to the lower densities of the surrounding Teplice rhyolite and albite granite. Bulk density, however, is critically influ-enced by porosity and is therefore not suitable to distinguish the Austrian greisen rocks from the surrounding two-mica granites,
3despite the greisens’ comparably high grain density (mean: 2.74 g/cm ). Their higher porosity (mean: 5.7%) also results in lower elastic wave velocities (mostly < 2900 m/s) and lower electrical resistivities (mostly < 2100 Ohmm) than the surrounding rocks. The electrical resistivities and elastic wave velocities of the German greisen samples are, in contrast, rather variable with no dis-tinct level above or below the neighboring rocks. Magnetic susceptibility also delivers a good contrast between the greisens and their surrounding rocks as it is highly responsive to elevated mica contents or the presence of oxidic ore minerals. If quartz con-tent predominates or oxidic ores are absent, however, there is no contrast in the magnetic susceptibility of the greisens and the surrounding rocks. With regard to natural gamma radiation, the greisens are characterized by generally low absolute readings as well as low U counts, while K and Th counts seem to be dependent on mica type. Results from SIP measurements suggest that especially phase information can be used to adequately differentiate greisen zones associated with Li-mineralization from country rocks in the Erzgebirge. In Austrian greisen rocks, however, the characteristics of the SIP spectra are less distinct. A crossplot of the real vs. the imaginary part of complex conductivity, however, is suitable for identification of rocks with high mica content. Based on these results a combined investigation of density, magnetic susceptibility, and spectral gamma seems to be most promising for identification of greisen bodies.
Entscheidend für jedes Explorationsprojekt ist eine genaue Kenntnis der Beziehungen und Unterschiede zwischen den physikali-schen Eigenschaften der Erzkörper von Interesse und deren Nebengesteinen. In dieser Studie werden daher umfassende petroph-ysikalische Labormessungen an repräsentativem Probenmaterial zweier Greisenkörper des Südböhmischen Batholiths (Österreich) und des vulkano-plutonischen Komplexes des Osterzgebirges (Deutschland) vorgestellt. Da viele Greisenkörper Erzlagerstätten von wirtschaftlichem Interesse beinhalten, war das Ziel der Studie, petrophysikalische Eigenschaften zu identifizieren, in denen sich die Greisenkörper entscheidend von den Nebengesteinen unterscheiden. Die gewonnenen physikalischen Informationen (Dichte, Porosität, Kompressionswellengeschwindigkeit, magnetischen Suszeptibilität, natürliche Gammastrahlung, spektral indu-zierte Polarisation (SIP)) legen nahe, dass eine Unterscheidung mineralisierter Greisenzonen vom Nebengestein nur basierend auf
3einer kombinierten Untersuchung mehrerer Parameter möglich ist: Erhöhte Korn- und Gesamtdichten (im Mittel 2,75 g/cm bzw. 32,67 g/cm ) sind für die gering porösen (< 3%) Greisengesteine des Erzgebirges charakteristisch. Im Vergleich dazu sind die Dich-
ten der Nebengesteine (Teplice-Rhyolith und Albitgranit) durchwegs niedriger. Die Gesamtdichte wird jedoch entscheidend von 3der Porosität beeinflusst und kann daher, trotz deren hoher Korndichte von 2,74 g/cm , nicht allein herangezogen werden, um die
poröseren österreichischen Greisengesteine vom untersuchten Nebengestein (Zweiglimmergranit) zu unterscheiden. Deren hohe Porosität von etwa 5,7% resultiert auch in niedrigeren Geschwindigkeiten von < 2900 m/s und niedrigerem elektrischen Wider-stand (meist < 2100 Ohmm) als im Nebengestein. Die untersuchten Greisenproben aus dem Erzgebirge besitzen vergleichsweise variable elektrische Widerstände und Geschwindigkeiten, die sich nicht signifikant von denen der Nebengesteine unterscheiden. Im Gegensatz dazu stellt die magnetische Suszeptibilität einen guten Indikator dar, da sie stark mit erhöhten Glimmergehalten
3
_______________________________________________________________________________
Austrian Journal of Earth Sciences Vienna Volume 110/12017 DOI: 10.17738/ajes.2017.0006
Multi-parameter petrophysical characterization of Variscan greisen rocks from the Southern Bohemian Batholith (Austria) and the Eastern Erzgebirge Volcano-Plutonic Complex (Germany)_________
*)Edith MÜLLER-HUBER & Frank BÖRNERDepartment of Applied Geophysics, Technische Universität Berlin, Ernst-Reuter-Platz 1, BH 1-1, 10587 Berlin, Germany;*) Corresponding author, [email protected]
Greisen; porosity; density; magnetic susceptibility; gamma spectroscopy; spectral induced polarizationKEYWORDS
78
78 - 100

und dem Auftreten von oxidischen Erzmineralen korreliert. Wenn jedoch der Quarzgehalt dominiert oder oxidische Erze fehlen, liegen die magnetischen Suszeptibilitäten der Greisen und der Nebengesteine in einem ähnlichen Bereich. Hinsichtlich der natür-lichen Gammastrahlung kann festgehalten werden, dass die Greisen generell niedrigere absolute Gammawerte und U-Gehalte aufweisen, während die registrierte Zahl der K- und Th-Impulse vom enthaltenen Glimmertyp abhängig zu sein scheint. Die Ergeb-nisse der SIP-Messungen zeigen, dass besonders die Phaseninformation genutzt werden kann, um die Greisenzonen mit Li-Mine-ralisierung des Erzgebirges von den Nebengesteinen zu unterscheiden. In den österreichischen Greisenzonen zeigen die SIP-Spek-tren kein typisches Muster. Ein Crossplot des Realteils aufgetragen gegen den Imaginärteil der komplexen Leitfähigkeit kann je-doch genutzt werden, um Gesteine mit hohen Glimmergehalten zu identifizieren. Basierend auf diesen Ergebnissen scheint eine Untersuchung der Dichte und magnetischen Suszeptibilität kombiniert mit einer spektralen Gammamessung zur Abgrenzung von Greisenkörpern am aussagekräftigsten.____________________________________________________________________________
Edith MÜLLER-HUBER & Frank BÖRNER
Figure 1: Geological map of the Bohemian Massif and its adjacent areas with the location of the more detailed map sections A and B (Southern Bohemian Batholith and Eastern Erzgebirge, respectively; modified from Franke and Żelaźniewicz, 2000)._________________________________
1. IntroductionCrucial aspects of every exploration project such as resource
estimation, the choice of geophysical data acquisition and interpretation, and rock stability are critically influenced by the 3D statistical distribution of the physical properties of the ore bodies of interest and their variation and correlation in comparison to the properties of the surrounding rocks. Especially a solid petrophysical database provides invaluable background information for geophysical data acquisition and interpretation programs aimed at delineating such ore depo-sits (Bongajum et al., 2009). In this paper, results from petro-physical data analysis aimed at characterizing two Variscan greisen bodies are presented. Two sets of samples were se-lected for petrophysical investigation: the first set of greisen rocks originates from alteration of a granite suite located in Austria at the southernmost tip of the Southern Bohemian
Batholith. They are predominantly enriched in molybdenum (hundreds of ppm), and to a low degree, in tin, tungsten and copper (e.g. Göd, 1989). The second set of greisen samples was formed by alteration of a lithium-albite granite cupola located at Zinnwald/Cínovec at the border of Germany and the Czech Republic. Elements of interest in the second set of greisen samples include lithium, tin, and tungsten (e.g. Štem-prok et al., 2014). In addition, selected samples of the surroun-ding rocks hosting the greisen bodies (two-mica granite, lithi-um-albite granite, and Teplice rhyolite) were investigated.
1.1 Geological introductionThe Variscan fold belt of central Europe formed during the
early Paleozoic by Collison of Laurentia, Baltica, Africa, and a number of Gondwana-derived microplates (Tait et al., 1997).
__
79
Multi-parameter petrophysical characterization of Variscan greisen rocks from the Southern Bohemian Batholith (Austria) and the Eastern Erzgebirge Volcano-Plutonic Complex (Germany)
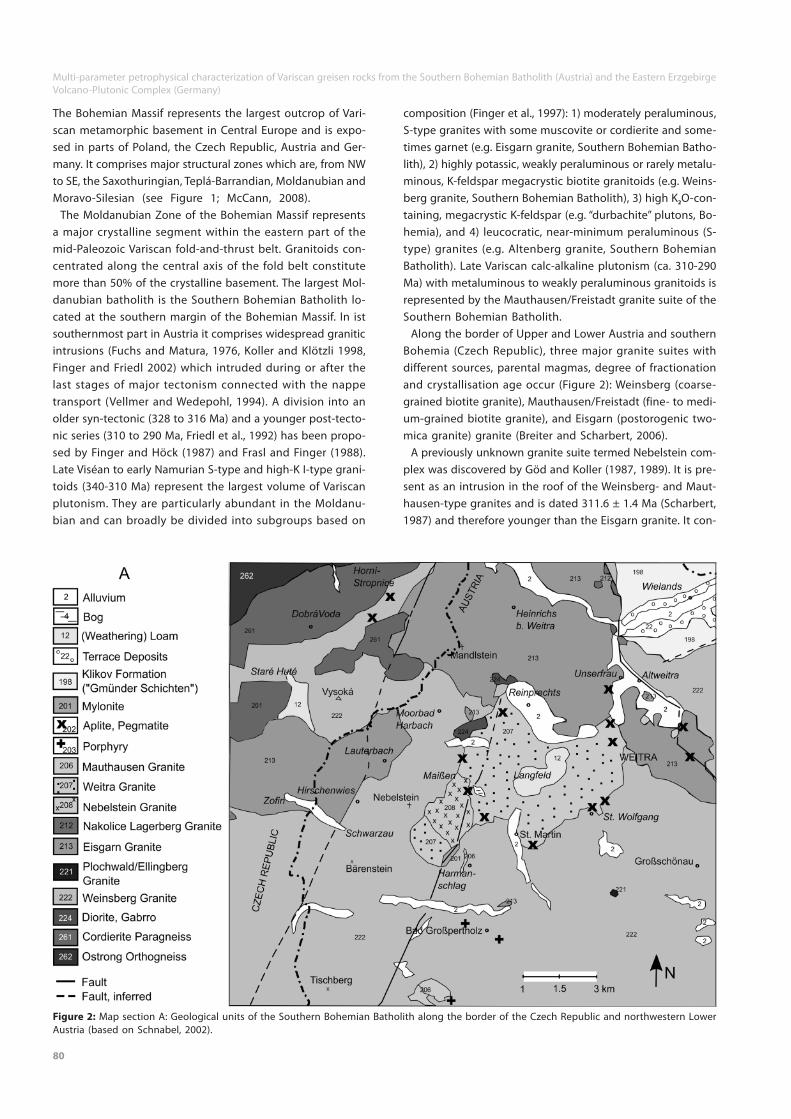
Figure 2: Map section A: Geological units of the Southern Bohemian Batholith along the border of the Czech Republic and northwestern Lower Austria (based on Schnabel, 2002)._____________________________________________________________________________________________
The Bohemian Massif represents the largest outcrop of Vari-scan metamorphic basement in Central Europe and is expo-sed in parts of Poland, the Czech Republic, Austria and Ger-many. It comprises major structural zones which are, from NW to SE, the Saxothuringian, Teplá-Barrandian, Moldanubian and Moravo-Silesian (see Figure 1; McCann, 2008).
The Moldanubian Zone of the Bohemian Massif represents a major crystalline segment within the eastern part of the mid-Paleozoic Variscan fold-and-thrust belt. Granitoids con-centrated along the central axis of the fold belt constitute more than 50% of the crystalline basement. The largest Mol-danubian batholith is the Southern Bohemian Batholith lo-cated at the southern margin of the Bohemian Massif. In ist southernmost part in Austria it comprises widespread granitic intrusions (Fuchs and Matura, 1976, Koller and Klötzli 1998, Finger and Friedl 2002) which intruded during or after the last stages of major tectonism connected with the nappe transport (Vellmer and Wedepohl, 1994). A division into an older syn-tectonic (328 to 316 Ma) and a younger post-tecto-nic series (310 to 290 Ma, Friedl et al., 1992) has been propo-sed by Finger and Höck (1987) and Frasl and Finger (1988). Late Viséan to early Namurian S-type and high-K I-type grani-toids (340-310 Ma) represent the largest volume of Variscan plutonism. They are particularly abundant in the Moldanu-bian and can broadly be divided into subgroups based on
_________
composition (Finger et al., 1997): 1) moderately peraluminous, S-type granites with some muscovite or cordierite and some-times garnet (e.g. Eisgarn granite, Southern Bohemian Batho-lith), 2) highly potassic, weakly peraluminous or rarely metalu-minous, K-feldspar megacrystic biotite granitoids (e.g. Weins-berg granite, Southern Bohemian Batholith), 3) high K O-con-2
taining, megacrystic K-feldspar (e.g. “durbachite” plutons, Bo-hemia), and 4) leucocratic, near-minimum peraluminous (S-type) granites (e.g. Altenberg granite, Southern Bohemian Batholith). Late Variscan calc-alkaline plutonism (ca. 310-290 Ma) with metaluminous to weakly peraluminous granitoids is represented by the Mauthausen/Freistadt granite suite of the Southern Bohemian Batholith.
Along the border of Upper and Lower Austria and southern Bohemia (Czech Republic), three major granite suites with different sources, parental magmas, degree of fractionation and crystallisation age occur (Figure 2): Weinsberg (coarse-grained biotite granite), Mauthausen/Freistadt (fine- to medi-um-grained biotite granite), and Eisgarn (postorogenic two-mica granite) granite (Breiter and Scharbert, 2006).
A previously unknown granite suite termed Nebelstein com-plex was discovered by Göd and Koller (1987, 1989). It is pre-sent as an intrusion in the roof of the Weinsberg- and Maut-hausen-type granites and is dated 311.6 ± 1.4 Ma (Scharbert, 1987) and therefore younger than the Eisgarn granite. It con-
_________________________
________
80

Edith MÜLLER-HUBER & Frank BÖRNER
sists of minor two-mica granite and predominantly of musco-vite granite which was formed by slight alteration of the two-mica granites (Koller et al., 1992). Most of the outcropping Nebelstein granites are peraluminous S-type granites with 73-76% SiO content, medium grain size, rare porphyritic K-2
feldspar, and idiomorphic quartz crystals. They are mostly reddish in color due to hematitization (Gnojek and Přichystal, 1997). The two-mica granites are characterized by a mica content of up to 5%, while the muscovite granites may have a mica content of up to 18%. Biotite contains numerous zircon inclusions and becomes less abundant from the two-mica to the muscovite granites. Accessory minerals are apatite, mo-nazite, xenotime, zircon, rare ilmenite, uraninite, and a mine-ral of the euxenite group (Göd and Koller, 1989).
Irregular-shaped greisen bodies or zones of some meters thickness parallel to the contacts occur within this suite. Grei-sen drill cores were intensely studied by Göd and Koller (1989), Göd (1989) or Koller et al. (1992): Some of the greisens are surrounded by "patchy muscovite" granite, which is a coarse-grained and highly altered subtype of muscovite granite with postmagmatic recrystallized mica patches up to 2 cm in dia-meter. Quartz veins or veinlets are rare in the Nebelstein grei-sens. Both Weinsberg- and Mauthausen-type granites forming the roof of the Nebelstein complex are not affected by the ore-forming processes.
The degree of alteration increases from the two-mica to the muscovite granites and the patchy muscovite granites. Altera-tion starts with replacement of biotite by muscovite, followed by a successive replacement of both feldspars even though some greisen rocks still contain minor amounts of altered, more resistant plagioclase. The final alteration stage resulted in a quartz-muscovite greisen with an average grain size of 5 mm (Koller et al., 1992). The ore mineralization includes both sulfide (pyrite, molybdenite, rare pyrrhotite, and chalcopyrite) and oxide minerals (xenomorphic aggregates of pure mag-netite of up to 2 cm in diameter). Secondary pyrite coats the open vugs (Koller et al., 1992). With respect to trace elements, the greisens are predominantly enriched in molybdenum and, to a far lesser degree, in tin, tungsten and copper, while only minor fluorite is present and lithium-, beryllium- or bo-ron-enrichment are absent (Göd, 1989; Göd and Koller, 1989). Göd and Koller (1989) also indicated a homogenous genetic magnetite content in the greisen rocks which include relictic plagioclase and in the surrounding granites. Minor amounts of apatite, monazite, thorianite, zircon and very rare ilmenite have also been found.
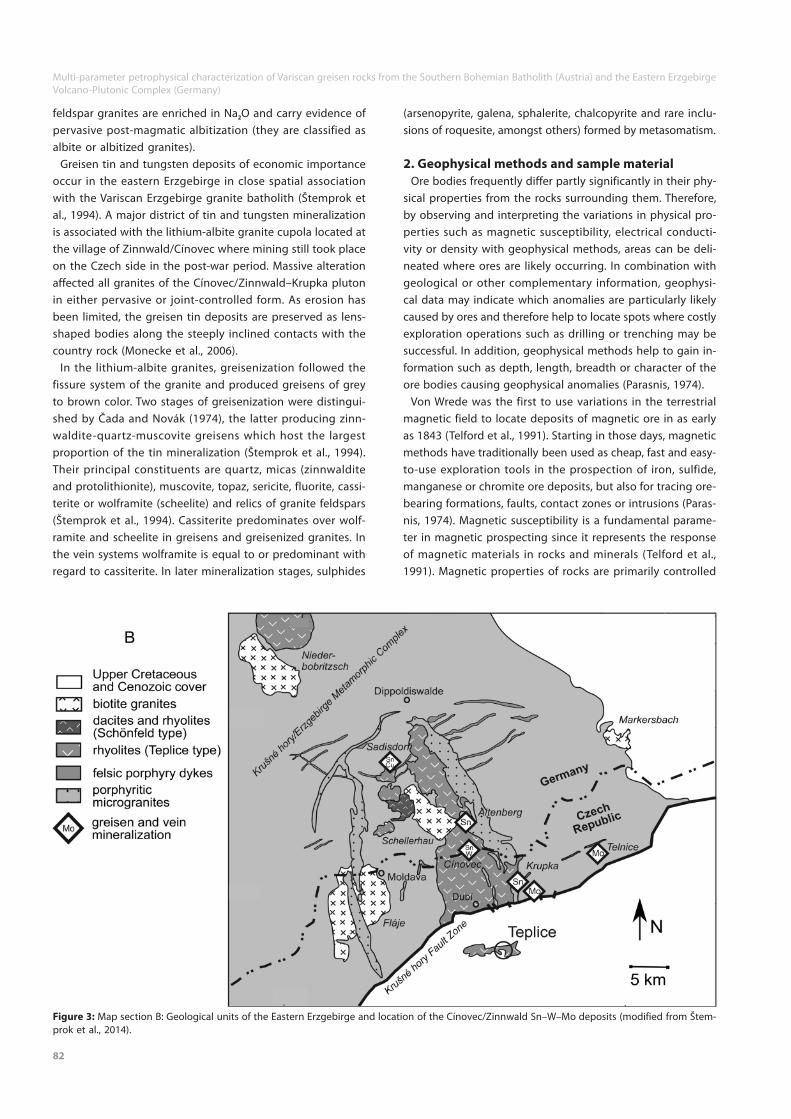
The Erzgebirge antiform is located in the Saxothuringian Zone of the Variscan belt at the northwestern margin of the Bohemian Massif. In its main part the Erzgebirge is composed of crystalline units – the Erzgebirge Crystalline Complex – which comprises various tectonic units of different metamor-phic grades that received their last metamorphic and defor-mation imprint during the Lower Carboniferous (Figure 3; Štemprok et al., 2003). In the eastern Erzgebirge late- to post-orogenic Variscan uplift and exhumation processes accom-
___________
________________________________
________________________________
panied intense felsic (rhyolitic and granitic) magmatism which formed the eastern Erzgebirge volcano-plutonic complex (McCann, 2008). The principal structure of the area is the deeply eroded Altenberg–Teplice Caldera which is younger with respect to some granite bodies (Mlčoch and Skácelová, 2010). This huge volcano-tectonic structure rimmed by mas-sive dykes of granite porphyries is filled with a complex se-quence of acid volcanic products. The Teplice rhyolite com-plex forms the predominant part of the thick volcanic succes-sion, which was formed during four volcanic phases, filling the Altenberg caldera (Breiter, 1997). It is dominated by crystal-rich ignimbrites (e.g., Breiter et al., 2001) and was described by Štemprok et al. (1994) as a medium- to coarse-grained, porphyritic brown to violet rock with phenocrysts of quartz, potassium feldspar and minor plagioclase, biotite, amphibole and pyroxene in a matrix of potassium feldspar, quartz, sub-ordinate plagioclase, biotite, muscovite and accessory hema-tite, magnetite, ilmenite, rutile and secondary topaz, cassiteri-te, sericite, chlorite, fluorite and pyrite based on earlier works.
Granites in the Erzgebirge area were assigned to groups ba-sed on different principles. A widely used classification (e.g., Lange et al., 1972; Štemprok, 1986) subdivides them into two groups – the Older Intrusive Complex comprising granites of predominantly monzogranite composition (pre-caldera or pre-Westphalian intrusions), and the Younger Intrusive Complex comprising more felsic granitic varieties, corresponding to syenogranite or alkali-feldspar granite (post-caldera, post-Westphalian intrusions; Štemprok, 1993). Förster et al. (1999) proposed a subdivision based on mineralogical and chemical composition and their setting with respect to Variscan colli-sion. Late-collisional granites comprise 1) low-F biotite grani-tes, 2) low-F two-mica granites and 3) high-F, high-P O Li-2 5
mica granites.The Younger Intrusive Complex – mostly peraluminous with
minor exceptions of metaluminous – granites are concentra-ted in the central parts of the Erzgebirge volcano-plutonic complex. These rocks are poorly exposed and mostly hidden beneath the Teplice rhyolite and metamorphic rocks. The Cínovec/Zinnwald –Krupka pluton as part of the Younger In-trusive Complex is located at the border between Germany and the Czech Republic and composed of two distinct se-quences (Štemprok et al., 2003): Lithium-poor biotite to pro-tolithionite granites (porphyritic medium-grained protolithio-nite granites with zones of fine-grained porphyritic granites in the footwall) and lithium-rich mainly lepidolite and zinn-waldite granites (lithium-rich albite granites in the hanging wall). Lithium-albite medium-grained granite represents the predominant lithium-albite granite type in the Cínovec/Zinn-wald–Krupka pluton and is characterized by greenish or grey-ish-white color caused by pervasive sericitization accompa-nied by kaolinization (Štemprok et al., 1994). It consists of quartz, slightly perthitic potassium feldspar, albite and zinn-waldite. Accessories include topaz, fluorite, cassiterite, colum-bite, rutile, monazite, bastnaesite, zircon, scheelite, wolfram-ite. It may occur in strongly altered forms. The Li-rich alkali-
81
Multi-parameter petrophysical characterization of Variscan greisen rocks from the Southern Bohemian Batholith (Austria) and the Eastern Erzgebirge Volcano-Plutonic Complex (Germany)
feldspar granites are enriched in Na O and carry evidence of 2
pervasive post-magmatic albitization (they are classified as albite or albitized granites).
Greisen tin and tungsten deposits of economic importance occur in the eastern Erzgebirge in close spatial association with the Variscan Erzgebirge granite batholith (Štemprok et al., 1994). A major district of tin and tungsten mineralization is associated with the lithium-albite granite cupola located at the village of Zinnwald/Cínovec where mining still took place on the Czech side in the post-war period. Massive alteration affected all granites of the Cínovec/Zinnwald–Krupka pluton in either pervasive or joint-controlled form. As erosion has been limited, the greisen tin deposits are preserved as lens-shaped bodies along the steeply inclined contacts with the country rock (Monecke et al., 2006).
In the lithium-albite granites, greisenization followed the fissure system of the granite and produced greisens of grey to brown color. Two stages of greisenization were distingui-shed by Čada and Novák (1974), the latter producing zinn-waldite-quartz-muscovite greisens which host the largest proportion of the tin mineralization (Štemprok et al., 1994). Their principal constituents are quartz, micas (zinnwaldite and protolithionite), muscovite, topaz, sericite, fluorite, cassi-terite or wolframite (scheelite) and relics of granite feldspars (Štemprok et al., 1994). Cassiterite predominates over wolf-ramite and scheelite in greisens and greisenized granites. In the vein systems wolframite is equal to or predominant with regard to cassiterite. In later mineralization stages, sulphides
____________________________
_____________________
(arsenopyrite, galena, sphalerite, chalcopyrite and rare inclu-sions of roquesite, amongst others) formed by metasomatism.
2. Geophysical methods and sample materialOre bodies frequently differ partly significantly in their phy-
sical properties from the rocks surrounding them. Therefore, by observing and interpreting the variations in physical pro-perties such as magnetic susceptibility, electrical conducti-vity or density with geophysical methods, areas can be deli-neated where ores are likely occurring. In combination with geological or other complementary information, geophysi-cal data may indicate which anomalies are particularly likely caused by ores and therefore help to locate spots where costly exploration operations such as drilling or trenching may be successful. In addition, geophysical methods help to gain in-formation such as depth, length, breadth or character of the ore bodies causing geophysical anomalies (Parasnis, 1974).
Von Wrede was the first to use variations in the terrestrial magnetic field to locate deposits of magnetic ore in as early as 1843 (Telford et al., 1991). Starting in those days, magnetic methods have traditionally been used as cheap, fast and easy-to-use exploration tools in the prospection of iron, sulfide, manganese or chromite ore deposits, but also for tracing ore-bearing formations, faults, contact zones or intrusions (Paras-nis, 1974). Magnetic susceptibility is a fundamental parame-ter in magnetic prospecting since it represents the response of magnetic materials in rocks and minerals (Telford et al., 1991). Magnetic properties of rocks are primarily controlled
__
Figure 3: Map section B: Geological units of the Eastern Erzgebirge and location of the Cínovec/Zinnwald Sn–W–Mo deposits (modified from Štem-prok et al., 2014)._____________________________________________________________________________________________________________
82

Edith MÜLLER-HUBER & Frank BÖRNER
by their content of ferromagnetic minerals such as magnetite, ilmenite or pyrrhotite (e.g. Parasnis, 1974). The most abun-dant minerals in common rocks are, however, paramagnetic (e.g. iron-containing minerals such as biotite or zinnwaldite) or diamagnetic such as quartz or feldspars. The volume sus-ceptibility is defined as the ratio of the material magnetiza-tion per unit volume to the external magnetic field strength and therefore dimensionless, whereas the mass susceptibility is defined as the ratio of the material magnetization per unit
3mass to the magnetic field strength in [m /kg]. In general, the susceptibility is a tensor of rank two and the symbol κ usually means a “mean, quasi-isotropic” susceptibility (Schön, 2011).
Observing small-scale variations in the gravitational field of the earth is another well-established geophysical exploration method. In gravity measurements, the variation in the true gravitational attraction from one point to another along the earth’s surface caused by local variations in the density of rocks near the surface is observed (Dobrin, 1976). Many types of rocks have characteristic ranges of density which differ from adjacent rocks. Not only high-density ores such as chro-mites but also comparably low-density buried channels con-taining gold or uranium minerals can directly be located by gravity surveys (Dobrin, 1976).
Nuclei of certain elements disintegrate spontaneously emit-ting, amongst others, electromagnetic radiation consisting of gamma rays which does not alter the nuclear charge. Gamma rays possess high energy and can be used for locating radio-active elements in the earth’s crust (Parasnis, 1974). Of all na-turally occurring radioactive elements, only uranium, thorium and an isotope of potassium are of importance in exploration and trace quantities of radioactive materials are found in all rocks (Telford et al., 1991). Geophysical exploration based on radioactivity has experienced increased interest related to the demand of uranium for generation of power in nuclear reac-tors. Nevertheless, radioactivity methods are not restricted to exploration of radioactive metals or associated minerals, but are also of use with regard to geological and structural inves-tigations (Parasnis, 1986).
Seismic exploration methods make use of contrasts in elas-tic wave velocities of different rocks (Parasnis, 1986). Elastic waves are reflected and refracted at the interfaces of rocks with different acoustic impedances – the product of a medi-um’s density and velocity. The location of the interfaces can then be inferred from arrival time analysis of the seismic wa-ves. Being used predominantly in oil prospection, seismic in-vestigations are also employed in civil engineering, building site investigations, the determination of bedrock depth, or the delineation of sand and gravel deposits (Parasnis, 1974). Contrast in elastic properties is a fundamental factor gover-ning the seismic response of an ore-body. Elastic properties of rocks are dominated by the properties of the solid rock skeleton including pores, fractures, and cracks (Schön, 2011) and are therefore influenced by factors such as mineral con-tent and fluid saturation.
Electrical prospection methods map the potential distribu-
_________________________
______________________________
______________________________
tion between two electrodes when sending an electrical cur-rent into the ground. Inhomogeneities such as well- or poorly conducting rock bodies deflect the current and thus distort the normal potentials. These electric anomalies depend on the electrical resistivity contrast between the more or less conductive ore bodies and the host rock. When the current source is shut off, the voltage does, however, not drop to zero immediately but persists for some time with decreasing mag-nitude (Parasnis, 1974). This phenomenon is called induced polarization and represents a delayed voltage response in earth materials resulting from a capacitive behavior (Ward, 1990). IP is observed when electronically conducting mine-rals or clay minerals are present and is therefore frequently used in exploration of ore, particularly disseminated sulfide ores (Dobrin, 1976; Parasnis, 1986). This capacity effect can be described and measured in the time domain and in the frequency domain.
Many geophysical methods that can be used on the surface are also available for borehole measurements. Parasnis (1973) already mentioned measurements of magnetic components in boreholes for locating ore masses that the hole did not en-counter or electrical measurements to determine the rocks’ and ores’ electrical resistivity in situ for, e.g., correlation of ore veins or fissures from one hole to another. Nowadays, sophis-ticated borehole probes based on combined radiometric prin-ciples in combination with magnetic measurements are deve-loped for fast and cost-effective characterization of resources of low concentrations in small-diameter exploration boreholes (e.g., Maurer et al., 2012; Müller-Huber et al., 2015; Müller-Hu-ber et al., 2016).
To delineate the subsurface structure of interest and identify different mineralized bodies, suitable geophysical investiga-tion methods need to be used. A priori information about physical properties of various earth materials in the study area helps to choose geophysical methods that yield signifi-cant differences in the responses over the structure of impor-tance (Biswas and Sharma, 2015). To identify physical rock pro-perties which show a characteristic contrast between greisen rocks and the rocks they are embedded in, a range of petro-physical parameters was determined on two sets of greisen rocks from Austria and Germany. Four Austrian greisen rock samples (14 plugs) were taken at an outcropping greisen body in the Nebelstein area. In addition, three pieces of the neigh-boring two-mica granite (8 plugs) were collected for a com-parative investigation. Eleven greisen rock pieces (20 plugs) from Germany were selected among blasted rock at an exhi-bition mine in Zinnwald. In addition, two pieces of the neigh-boring albite granite (6 plugs) and four pieces of Teplice rhyo-lite (6 plugs) were taken. The original orientation of the rock samples was not preserved. Cylindrical plugs of 5.5 cm length and 3.5 cm diameter were drilled with a water-cooled diamond coring drill. This sample geometry was chosen because of measurement system requirements and it is less susceptible to small-scale sample heterogeneities which often occur in ore rocks. Sample ends were trimmed and paralleled, which
___________________________________
83

Multi-parameter petrophysical characterization of Variscan greisen rocks from the Southern Bohemian Batholith (Austria) and the Eastern Erzgebirge Volcano-Plutonic Complex (Germany)
proved to be difficult for the greisen samples because of mica crystals breaking loose. Therefore, no perfectly cylindrical shape could be ensured. Afterwards, the samples were dried until a constant mass was measured and equilibrated to room temperature before the measurements in dry state were con-ducted. For measurements in water-saturated state, samples were evacuated until no further escaping air could be obser-ved and saturated with water with conductivities of 750 µS/cm and 450 µS/cm at 19°C representing the electrical conductivi-ty of the surface waters in the Nebelstein area and the mine waters at Zinnwald, respectively.
3. Petrophysical methods, investigations, and resultsPetrophysical investigations in this study focus on physical
rock properties, which can not only be measured on the sur-face, but also in boreholes with borehole probes: Density/ porosity, elastic wave velocity, magnetic susceptibility, gam-ma radiation, and electrical resistivity/spectral induced po-larization.
3.1 Density and Porosity MeasurementsSchön (2011) states that bulk density represents the mean
density of a volume of rock including pores, while grain den-sity is the mean density of the solid matrix material (mineral or mixture of minerals). Total porosity is defined as the frac-
_______________________
tion of bulk volume occupied by total pore space, while the effective porosity represents the fraction of the bulk volume occupied by interconnected pore space.
For calculation of bulk density and porosity at the labora-tory, the samples' dry and water-saturated mass and their mass in water-submerged state were determined. Due to the sometimes irregular sample shape caused by breaking of fra-gile minerals during drilling or trimming, the exact sample volume could not be inferred from the samples’ length and diameter and was thus determined by immersion weighing and application of Archimedes’ principle. Dry bulk density ρ bwas then calculated from dry mass and sample volume and effective porosity Φ was calculated from dry, saturated, and eff
buoyant mass. Grain density ρ and grain volume were deter-g
mined with an AccuPyc 1330 helium pycnometer (Microme-ritics) employing the gas displacement method and used along with the sample volume to derive total porosity Φ .total
Figure 4 shows that Teplice rhyolite and albite granite are 3characterized by similar grain densities of 2.648-2.674 g/cm
3and 2.641-2.672 g/cm , respectively. The mineralized greisen 3samples possess grain densities of 2.639-2.911 g/cm depen-
ding on their quartz and Li-bearing zinnwaldite contents. Comparative tests on quartz and zinnwaldite samples sup-port these observations as they delivered grain densities of
32.646 and 2.986 g/cm , respectively, indicating that high zinn-
_________________
_
3Figure 4: Grain (left) and bulk density [g/cm ] (right) of Teplice rhyolite, greisen and albite granite samples from Zinnwald.____________________
Figure 5: Total (left) and effective porosity [%] (right) of Teplice rhyolite, greisen and albite granite samples from Zinnwald.____________________
84

Edith MÜLLER-HUBER & Frank BÖRNER
waldite content significantly increases grain density, while high quartz content is associated with the lowest grain den-sities among the greisen samples. Bulk density, in compari-son, indicates that the highest values are still associated with the greisen samples. This indicates that their porosity is ge-nerally rather low, which is supported by Figure 5. 75% of all greisen samples possess total and effective porosities of be-low 4%. Only one exceptionally high value of total porosity (12%) could be measured for a greisen sample with about 60% zinnwaldite content. But due to the fragile condition of the sample, it could not be saturated with water to determine its effective porosity.
Both Teplice rhyolite and albite granite samples have a lower 3bulk density of less than 2.60 g/cm with densities as low as
32.402 and 2.478 g/cm , respectively. This goes along with comparably higher total porosities of 2-9% and 3-7%, respec-tively and comparable ranges of effective porosity (Figure 5).
Figure 6 shows that two-mica granite and greisen samples 3are characterized by grain densities of 2.647-2.674 g/cm and
32.732-2.750 g/cm , respectively. This means that the grain den-sity of the greisen samples is still significantly higher in com-parison to two-mica granite, but its absolute values are not as high as in the zinnwaldite-bearing greisen of Zinnwald.
In contrast to the trend observed for the samples from Zinn-wald, bulk density of the samples from the Nebelstein area
__
indicates that the highest values are now associated with the granite samples. This is due to the high porosity of the greisen samples (Figure 7). Total porosity of the greisen samples ran-ges from 2-8% and from 2-5% for the two-mica granites with ranges of 1-7% and 2-3%, respectively, for effective porosity.
Similar ranges for density and porosity were presented by Zaraisky (1995) for samples from the Akchatau W-Mo greisen deposit of Central Kazakhstan which occurs in cupolas of up-per Permian leucocratic granites: bulk densities of the quartz-topaz-greisen and quartz-muscovite-greisen range from 2.60
3 3to 2.84 g/cm and 2.57 to 2.70 g/cm , respectively with grain 3 3densities of 2.96 to 3.21 g/cm and 2.74 to 2.87 g/cm , respec-
tively. Porosity reaches values as high as 12.2% in the quartz-topaz-greisen and 6.2% in the quartz-muscovite-greisen. The surrounding medium-grained granite is characterized by a
3 3bulk density of 2.57 g/cm and a grain density of 2.68 g/cm with a porosity of 4.1%.
3.2 Velocity MeasurementsFor determination of dry compressional wave velocity v at
the laboratory (ambient conditions), a setup including an ul-trasonic transmitter–receiver pair with piezoelectric trans-ducers (Geotron Elektronik) was used. The transducers were pressed against the plug faces with a pressure of about 1 bar and an 80 kHz impulse was used to generate the compres-
_______________________________
p
3Figure 6: Grain (left) and bulk density [g/cm ] (right) of greisen and two-mica granite samples from the Nebelstein area.______________________
Figure 7: Total (left) and effective porosity [%] (right) of greisen and two-mica granite samples from the Nebelstein area.______________________
85
Multi-parameter petrophysical characterization of Variscan greisen rocks from the Southern Bohemian Batholith (Austria) and the Eastern Erzgebirge Volcano-Plutonic Complex (Germany)
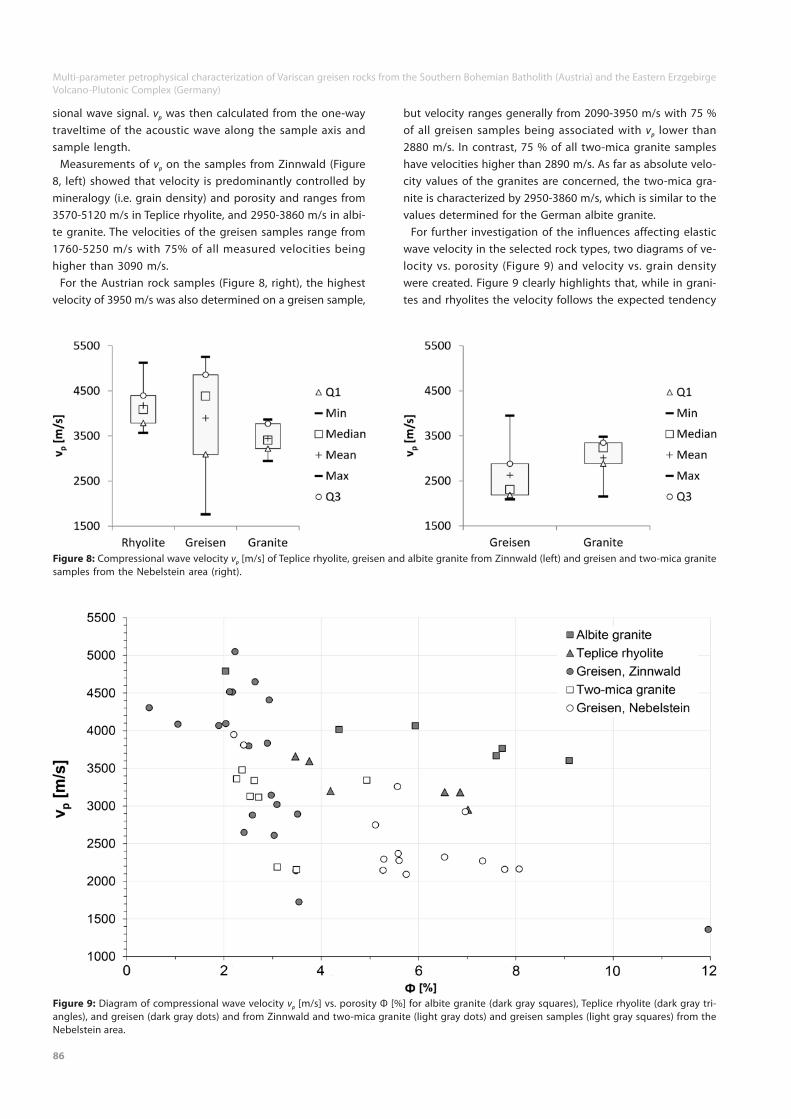
Figure 9: Diagram of compressional wave velocity v [m/s] vs. porosity Ф [%] for albite granite (dark gray squares), Teplice rhyolite (dark gray tri-angles), and greisen (dark gray dots) and from Zinnwald and two-mica granite (light gray dots) and greisen samples (light gray squares) from the Nebelstein area.
p
Figure 8: Compressional wave velocity v [m/s] of Teplice rhyolite, greisen and albite granite from Zinnwald (left) and greisen and two-mica granite samples from the Nebelstein area (right).
p
________________________________________________________________________________________
but velocity ranges generally from 2090-3950 m/s with 75 % of all greisen samples being associated with v lower than 2880 m/s. In contrast, 75 % of all two-mica granite samples have velocities higher than 2890 m/s. As far as absolute velo-city values of the granites are concerned, the two-mica gra-nite is characterized by 2950-3860 m/s, which is similar to the values determined for the German albite granite.
For further investigation of the influences affecting elastic wave velocity in the selected rock types, two diagrams of ve-locity vs. porosity (Figure 9) and velocity vs. grain density were created. Figure 9 clearly highlights that, while in grani-tes and rhyolites the velocity follows the expected tendency
p
__________
sional wave signal. v was then calculated from the one-way traveltime of the acoustic wave along the sample axis and sample length.
Measurements of v on the samples from Zinnwald (Figure 8, left) showed that velocity is predominantly controlled by mineralogy (i.e. grain density) and porosity and ranges from 3570-5120 m/s in Teplice rhyolite, and 2950-3860 m/s in albi-te granite. The velocities of the greisen samples range from 1760-5250 m/s with 75% of all measured velocities being higher than 3090 m/s.
For the Austrian rock samples (Figure 8, right), the highest velocity of 3950 m/s was also determined on a greisen sample,
p
______________________________________
p
________________________________
p
p
86

Edith MÜLLER-HUBER & Frank BÖRNER
3Figure 10: Diagram of compressional wave velocity v [m/s] vs. grain density ρ [g/cm ] for albite granite (dark gray squares), Teplice rhyolite (dark p g
gray triangles), and greisen (dark gray dots) and from Zinnwald and two-mica granite (light gray dots) and greisen samples (light gray squares) from the Nebelstein area.
of decreasing velocity with increasing porosity, the greisen rocks only partly show this trend and rather exhibit a large velocity scatter at a given porosity. This contrast in behavior could be due to the fact that in the granites and rhyolites no pores except for occasionally occurring fractures could be ob-served, while in some of the greisen samples from Zinnwald druses or small cavities are present which may have a stron-ger impact on the velocity-porosity relationship than a limi-ted number of probably partly cemented fractures.
Figure 10 shows that the expected trend of increasing velo-city with increasing grain density cannot be observed in the studied rock types. Remarkably among the greisen samples from Zinnwald the sample with the highest grain density (i.e. the highest zinnwaldite content) is associated with the lowest velocity at all. This indicates that the fragile condition of some of the greisen samples with especially high mica content may indeed increase porosity values, but the obviously weak grain contacts of the mica packets and their large grain size in com-parison to the quartz and minor feldspar grains seem to have the most pronounced effect on elastic wave velocity.
These findings clearly demonstrate that, despite the usually significant influence of a rock’s mineralogical composition and porosity on elastic wave velocity, textural properties have a critical effect on the velocity of the studied rock types. Es-pecially the velocities of the greisen samples with high zinn-waldite content are sensitive to the contact conditions at grain boundaries where the frail condition of zinnwaldite crystals decreases velocity. Another fact one has to consider is that
________
_______
the assumption of isotropy with a random distribution of mi-nerals, microcracks, and pores (Schön, 2011) is likely not valid in the greisen samples where preferred orientations are visib-le with the naked eye due to the arrangements of the mica packets. Nevertheless one has to keep in mind that velocity and porosity measurements suffer from systematic errors such as the unquantified effects of stress relaxation, samp-ling procedures and sample preparation methods (Schild et al., 2001). Therefore the structural effects encountered at the lab may not be as pronounced in field or in borehole mea-surements where microcracks or fissile mica packets are usu-ally investigated under undisturbed in situ stress conditions.
3.3 Magnetic Susceptibility MeasurementsVolume magnetic susceptibility was determined with a
MS2B susceptibility meter (Bartington Instruments Ltd.). This sensor is designed for granular or liquid samples in 10 or 20
3cm sample pots and 1" drill cores. Since the samples used in this study were too large to completely fit into the instru-ment’s sample chamber, the magnetic susceptibilities had to be calibrated to the reference volume to receive absolute values. The calibration function was received from studying the relative increase in measured magnetic susceptibility of tap water by increasing the water volume in sample contai-ners with different diameters.
Susceptibility measurements on pure mineral samples re-presenting the major constituents of the studied rock samp-
-5 -5les delivered absolute values of -1.5•10 SI for quartz, 1.3•10
__________________________
87

Multi-parameter petrophysical characterization of Variscan greisen rocks from the Southern Bohemian Batholith (Austria) and the Eastern Erzgebirge Volcano-Plutonic Complex (Germany)
-5SI for albite and -0.9•10 SI for a potassium feldspar (ortho-clase), while a relative measurement on an irregularly shaped
-3zinnwaldite sample delivered a susceptibility of 1.5•10 SI. This demonstrates that magnetic susceptibility is another in-dicator for high zinnwaldite contents in the greisen samples from Zinnwald. This is supported by Figure 11 which shows a diagram of magnetic susceptibility vs. zinnwaldite content for selected greisen samples which were studied with XRD Rietveld analysis. The samples with the highest zinnwaldite content also possess the highest magnetic susceptibilities (up
-4to 4.9•10 SI at about 60% zinnwaldite), while samples with-5higher quartz content possess significantly lower (6.6•10
SI at 95% quartz content) or even negative susceptibilities -5(-1.5•10 SI at 99% quartz content, Figure 12).
Teplice rhyolite and albite granite are characterized by a smal--5 -5 -5 -5ler range of susceptibilities (5.9•10 -8.1•10 and 2.6•10 -4.5•10
SI, respectively) which are distinctly lower than in the greisen samples with zinnwaldite contents exceeding a few per cent (Figure 12).
In contrast to the samples from Zinnwald, where the greisen samples are characterized by a broad range of susceptibilities and mostly higher values than in the surrounding rocks, the greisen samples from the Nebelstein area are characterized by
-5 -4susceptibilities of 8.8•10 -1.4•10 SI and thus distinctly lower
Figure 11: Magnetic susceptibility κ [-] of selected greisen samples from Zinnwald vs. zinnwaldite content from XRD Rietveld analysis.
Figure 12: Magnetic susceptibility κ [-] of Teplice rhyolite, greisen and albite granite from Zinnwald (left) and greisen and two-mica granite samples -5from the Nebelstein area (right). Note that the minimum of magnetic susceptibility of the greisen samples from Zinnwald is -1.5•10 [SI] and could
not be displayed on logarithmic scale.__________________________________________________________________________________________
88

Edith MÜLLER-HUBER & Frank BÖRNER
-4 -3values than the two-mica granites with 5.9•10 -1.9•10 SI.
3.4 Gamma Spectroscopic MeasurementsSpectroscopic measurements of natural gamma radiation
were carried out with a portable GRS-2000 Multispec Gamma-Ray Spectrometer (GF Instruments s.r.o.). The spectrometer has 512 channels and is equipped with a NaI(TI) detector
137with a shielded photomultiplier and a Cs reference source of 16 kBq activity. In geophysical field or borehole measure-ments, two measurement techniques are common: Integral measurements register all incoming counts above a fixed energy level and integral activity I [API] is the combined effect of three contributions (e.g., Schön, 2011)
(1)
where k is a tool constant, K [%], U [ppm] and Th [ppm] are the concentrations of the elements and a [ppm] and b [ppm] are the U concentrations equivalent to the counts of 1% K and 1 ppm Th, respectively.
Spectral measurements commonly divide the energy spec-trum into three distinct windows specific of the energies of K, U, and Th. Regions of interest were set as follows: 1.360-1.558 MeV for K, 1.564-1.953 MeV for U, and 2.414-2.804 MeV for Th. Each measurement was carried out over a measurement
__
___________
____________________________
API
period of 60 min and repeated three times. Ambient back-ground radiation data were collected twice a week during measurement periods and used for correction of the measu-red data. Based on IAEA K-, U-, and Th-reference material, ca-libration functions for derivation of the contents of these ele-ments of interest from gamma spectroscopy were established.
The results of the gamma spectroscopic measurements show that the greisen rocks from Zinnwald and their surrounding rocks possess distinct characteristics with regard to integral gamma counts as well as their K, U, and Th contents: All Tep-lice rhyolite are associated with integral gamma counts ex-ceeding 1.02 cps, which represents the highest values mea-sured at all (Figure 13). The greisen samples are associated with the overall lowest and quite variable integral gamma response with a range of 0.86-0.94 cps for 50% of all samples, while the albite granites seem to occupy an intermediate po-sition with values between 0.95-0.98 cps. Similar conclusions can be drawn for potassium content which is calculated with 7.6-10.1% for Teplice rhyolite, 6.05-6.98 % for albite granite and >1.5 for 75% of all greisen samples based on the gamma spectroscopic measurements. Th content is generally highest in the Teplice rhyolite (89.5-110.4 ppm), while it ranges from 6.9-59.7 ppm in albite granite and 37.7-75.4 ppm in the grei-sen samples. In contrast, U content is highest in the granite samples and varies from 7.3-25.7 ppm in Teplice rhyolite, 6.9-
I =k(a∙K+U+b∙Th)API
Figure 13: Results of gamma spectroscopic measurements of Teplice rhyolite, greisen and albite granite from Zinnwald: integral gamma counts [cps], derived K [%], U [ppm], and Th [ppm] contents (from top, left to bottom, right).___________________________________________________
89
Multi-parameter petrophysical characterization of Variscan greisen rocks from the Southern Bohemian Batholith (Austria) and the Eastern Erzgebirge Volcano-Plutonic Complex (Germany)
28.4 ppm in albite granite and >5.7 ppm in the greisen samp-les. However, the overall highest Th and U contents of 165.0 and 40.4 ppm, respectively were found in greisen samples.
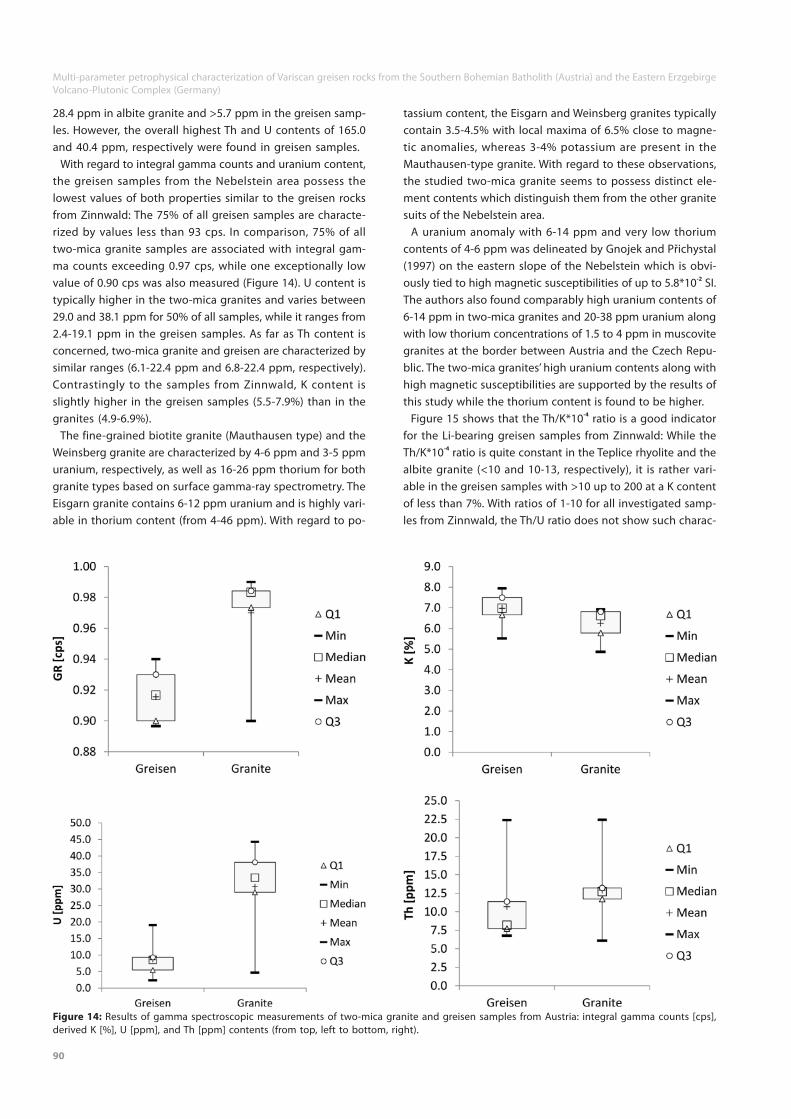
With regard to integral gamma counts and uranium content, the greisen samples from the Nebelstein area possess the lowest values of both properties similar to the greisen rocks from Zinnwald: The 75% of all greisen samples are characte-rized by values less than 93 cps. In comparison, 75% of all two-mica granite samples are associated with integral gam-ma counts exceeding 0.97 cps, while one exceptionally low value of 0.90 cps was also measured (Figure 14). U content is typically higher in the two-mica granites and varies between 29.0 and 38.1 ppm for 50% of all samples, while it ranges from 2.4-19.1 ppm in the greisen samples. As far as Th content is concerned, two-mica granite and greisen are characterized by similar ranges (6.1-22.4 ppm and 6.8-22.4 ppm, respectively). Contrastingly to the samples from Zinnwald, K content is slightly higher in the greisen samples (5.5-7.9%) than in the granites (4.9-6.9%).
The fine-grained biotite granite (Mauthausen type) and the Weinsberg granite are characterized by 4-6 ppm and 3-5 ppm uranium, respectively, as well as 16-26 ppm thorium for both granite types based on surface gamma-ray spectrometry. The Eisgarn granite contains 6-12 ppm uranium and is highly vari-able in thorium content (from 4-46 ppm). With regard to po-
_
___________________________________
tassium content, the Eisgarn and Weinsberg granites typically contain 3.5-4.5% with local maxima of 6.5% close to magne-tic anomalies, whereas 3-4% potassium are present in the Mauthausen-type granite. With regard to these observations, the studied two-mica granite seems to possess distinct ele-ment contents which distinguish them from the other granite suits of the Nebelstein area.
A uranium anomaly with 6-14 ppm and very low thorium contents of 4-6 ppm was delineated by Gnojek and Přichystal (1997) on the eastern slope of the Nebelstein which is obvi-
-2ously tied to high magnetic susceptibilities of up to 5.8*10 SI. The authors also found comparably high uranium contents of 6-14 ppm in two-mica granites and 20-38 ppm uranium along with low thorium concentrations of 1.5 to 4 ppm in muscovite granites at the border between Austria and the Czech Repu-blic. The two-mica granites’ high uranium contents along with high magnetic susceptibilities are supported by the results of this study while the thorium content is found to be higher.
-4Figure 15 shows that the Th/K*10 ratio is a good indicator for the Li-bearing greisen samples from Zinnwald: While the
-4Th/K*10 ratio is quite constant in the Teplice rhyolite and the albite granite (<10 and 10-13, respectively), it is rather vari-able in the greisen samples with >10 up to 200 at a K content of less than 7%. With ratios of 1-10 for all investigated samp-les from Zinnwald, the Th/U ratio does not show such charac-
__
Figure 14: Results of gamma spectroscopic measurements of two-mica granite and greisen samples from Austria: integral gamma counts [cps], derived K [%], U [ppm], and Th [ppm] contents (from top, left to bottom, right)._______________________________________________________
90

Edith MÜLLER-HUBER & Frank BÖRNER
teristic patterns. Nevertheless, the absolute U content seems to be mostly lower than 11 ppm combined with a Th content of less than 80 ppm.
-4In contrast, the Th/K*10 ratio does not seem to be a sui-table indicator for greisen zones with regard to the greisen
-4samples from the Nebelstein area. Here Th/K*10 ratios are generally below 5.0 for both two-mica granite and greisen samples with values closer to 1.0 for the greisen rocks. The Th/U ratio shows, however, distinct patterns for greisen and two-mica granites: While the Th/U ratio is mostly between <1 and 3 with U contents lower than 11 ppm in the greisen samples, it is consistently lower than 1 combined with U con-tents exceeding 11 ppm in the two-mica granite. These ob-
__________________________________
servations agree with the fin-dings of Gnojek and Přichystal
-4(1997) who gave Th/K*10 ra-tios of 5.77±1.82, Th/U ratios of 4.0±3.0, and U/K ratios of 1.22± 0.55 for the studied region of the Southern Bohemian Batho-lith. They also state that the tho-rium to potassium or uranium to thorium ratios can be used to map, for instance, thorium- or uranium-enriched magnetic structures. Koller et al. (1992) state that the Th/U ratio in the Mauthausen and Eisgarn grani-tes is >2 while it ranges from <1 in the biotite granite to 0.08 in the greisen rocks of the Ne-belstein suite. The authors ex-plain these observations by in-creasing U and decreasing Th contents with progressing grei-senization.
3.5 Specific Electrical Resis-tivity and Spectral Induced Polarization Measurements
Electrical current may be pro-pagated in rocks and minerals either electronically (ohmic; con-duction via free electrons such as in metals), electrolytically (comparably slow conduction via ions) or dielectrically (con-duction in poor conductors or insulators with few charge car-riers) (Telford et al., 1991). Using Ohm’s law the resistance RES between the end faces of a rock sample can be determined from the flowing current I (amperes) and the voltage drop U (volts):
Figure 15: Crossplots of K vs. Th (top) and Th vs. U (bottom) for albite granite (dark gray squares), Teplice rhyolite (dark gray triangles), and greisen samples (dark gray dots) from Zinnwald and two-mica granite (light gray dots) and greisen samples (light gray squares) from the Nebelstein area._________________
(2)
Using a geometry factor describing the geometry of the current distribution, the electrical resistance can be connec-ted to specific electrical resistivity ρ [Ohmm] as follows:
(3)
where L is sample length and A is the sample cross sectional area in case of cylindrical samples with axial current flow.
Specific electrical resistivity in clay-free rocks which are also free of metallic minerals is controlled by electrolytic conduc-tivity in the water-filled pore space (Archie, 1942) and is thus
____
___
RES=U/I
ρ=RES∙A⁄L
91
Multi-parameter petrophysical characterization of Variscan greisen rocks from the Southern Bohemian Batholith (Austria) and the Eastern Erzgebirge Volcano-Plutonic Complex (Germany)
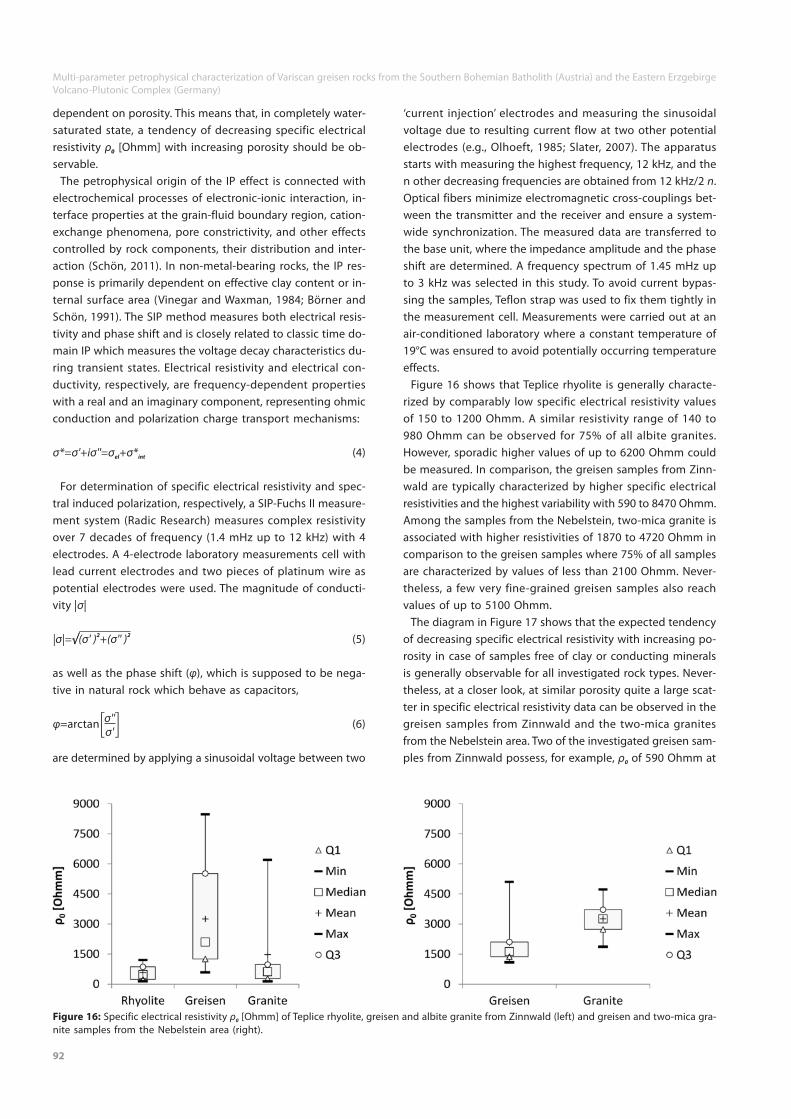
Figure 16: Specific electrical resistivity ρ [Ohmm] of Teplice rhyolite, greisen and albite granite from Zinnwald (left) and greisen and two-mica gra-0
nite samples from the Nebelstein area (right).____________________________________________________________________________________
dependent on porosity. This means that, in completely water-saturated state, a tendency of decreasing specific electrical resistivity ρ [Ohmm] with increasing porosity should be ob-servable.
The petrophysical origin of the IP effect is connected with electrochemical processes of electronic-ionic interaction, in-terface properties at the grain-fluid boundary region, cation-exchange phenomena, pore constrictivity, and other effects controlled by rock components, their distribution and inter-action (Schön, 2011). In non-metal-bearing rocks, the IP res-ponse is primarily dependent on effective clay content or in-ternal surface area (Vinegar and Waxman, 1984; Börner and Schön, 1991). The SIP method measures both electrical resis-tivity and phase shift and is closely related to classic time do-main IP which measures the voltage decay characteristics du-ring transient states. Electrical resistivity and electrical con-ductivity, respectively, are frequency-dependent properties with a real and an imaginary component, representing ohmic conduction and polarization charge transport mechanisms:
(4)
For determination of specific electrical resistivity and spec-tral induced polarization, respectively, a SIP-Fuchs II measure-ment system (Radic Research) measures complex resistivity over 7 decades of frequency (1.4 mHz up to 12 kHz) with 4 electrodes. A 4-electrode laboratory measurements cell with lead current electrodes and two pieces of platinum wire as potential electrodes were used. The magnitude of conducti-vity |σ|
(5)
as well as the phase shift (φ), which is supposed to be nega-tive in natural rock which behave as capacitors,
(6)
are determined by applying a sinusoidal voltage between two
0
_
___________
‘current injection’ electrodes and measuring the sinusoidal voltage due to resulting current flow at two other potential electrodes (e.g., Olhoeft, 1985; Slater, 2007). The apparatus starts with measuring the highest frequency, 12 kHz, and the n other decreasing frequencies are obtained from 12 kHz/2 n. Optical fibers minimize electromagnetic cross-couplings bet-ween the transmitter and the receiver and ensure a system-wide synchronization. The measured data are transferred to the base unit, where the impedance amplitude and the phase shift are determined. A frequency spectrum of 1.45 mHz up to 3 kHz was selected in this study. To avoid current bypas-sing the samples, Teflon strap was used to fix them tightly in the measurement cell. Measurements were carried out at an air-conditioned laboratory where a constant temperature of 19°C was ensured to avoid potentially occurring temperature effects.
Figure 16 shows that Teplice rhyolite is generally characte-rized by comparably low specific electrical resistivity values of 150 to 1200 Ohmm. A similar resistivity range of 140 to 980 Ohmm can be observed for 75% of all albite granites. However, sporadic higher values of up to 6200 Ohmm could be measured. In comparison, the greisen samples from Zinn-wald are typically characterized by higher specific electrical resistivities and the highest variability with 590 to 8470 Ohmm. Among the samples from the Nebelstein, two-mica granite is associated with higher resistivities of 1870 to 4720 Ohmm in comparison to the greisen samples where 75% of all samples are characterized by values of less than 2100 Ohmm. Never-theless, a few very fine-grained greisen samples also reach values of up to 5100 Ohmm.
The diagram in Figure 17 shows that the expected tendency of decreasing specific electrical resistivity with increasing po-rosity in case of samples free of clay or conducting minerals is generally observable for all investigated rock types. Never-theless, at a closer look, at similar porosity quite a large scat-ter in specific electrical resistivity data can be observed in the greisen samples from Zinnwald and the two-mica granites from the Nebelstein area. Two of the investigated greisen sam-ples from Zinnwald possess, for example, ρ of 590 Ohmm at0
___________________________
σ*=σ'+iσ''=σ +σ*el int
2 2|σ|=√(σ' ) +(σ'' )
σ'σ''φ=arctan
92

Edith MÜLLER-HUBER & Frank BÖRNER
a porosity of 3.5% and 1,180 Ohmm at a porosity of 3%.To investigate this potentially occurring additional conduc-
tivity effect, information received from SIP measurements was used. Phase and resistivity spectra for each of the stu-died lithologies are shown in Figure 18 to Figure 21. For the samples from Zinnwald, distinct curve patterns can be identi-fied for each rock type: The Teplice rhyolite samples are cha-racterized by a minimum in the absolute phase value at the lowest measured frequency followed either by a slight posi-tive slope until a small phase maximum of 10 to 15 mrad is reached at 5 to 15 Hz (Figure 18) with a subsequent slightly negative slope until about 100 Hz, or a constantly increasing phase level.
The albite granite samples are also characterized by a mini-mum in the absolute phase value (6 to 16 mrad) at the lowestfrequency followed by a phase increase until a prominent
_________________________________________
maximum of 10 to 25 mrad is reached between 0.5 and 10 Hz (Figure 19). At higher frequencies of up to 100 Hz the phase decreases again until the minimum level is reached.
In contrast, most greisen samples reach a maximum in the absolute phase value at a level of 10 to 23 mrad at the lowest measured frequency followed by a negative slope in the pha-se spectrum and a phase minimum of 5 to 10 mrad between 0.5 and 5 Hz (Figure 20). A limited number of the greisen sam-ples, however, show a quite variable phase spectrum where even after repeated measurements no specific curve type could be identified. These samples are characterized by high quartz contents exceeding 90 %.
The samples from the Nebelstein area are associated with a different curve type (Figure 21): Both granite and greisen sam-ples show a more or less constant behavior of the absolute phase value up to frequencies of 10 Hz with a constant phase
_______
________________________
Figure 17: Diagram of specific electrical resistivity ρ [Ohmm] in water-saturated state vs. porosity Ф [%] for albite granite (dark gray squares), Tep-0
lice rhyolite (dark gray triangles), and greisen samples (dark gray dots) from Zinnwald and two-mica granite (light gray dots) and greisen samples (light gray squares) from the Nebelstein area.____________________________________________________________________________________
Figure 18: Complex conductivity (left) and phase spectrum (right) of Teplice rhyolite from Zinnwald.______________________________________
93

Multi-parameter petrophysical characterization of Variscan greisen rocks from the Southern Bohemian Batholith (Austria) and the Eastern Erzgebirge Volcano-Plutonic Complex (Germany)
of less than 10 mrad in case of granite samples less than be-low 5 in case of greisen samples. Only two very fine-grained greisen samples exhibit phases of about 15 mrad.
A crossplot of the real vs. the imaginary part of complex con-ductivity at 1 Hz (Figure 22) suggests that the mineralogical composition as well as distinct textural associated with it have a dominant influence on both parameters. While the investi-gated samples from Zinnwald which were clearly dominated by their quartz content (exceeding 90%) are characterized by
_________
-4 -6σ'<2.0•10 [S/m] and σ''<1.0•10 [S/m], while samples with -4significant mica content of at least 10% plot between 2.0•10
-3 -6 -5≤σ'≤2.0•10 [S/m] and 1.0•10 ≤σ''≤2.0•10 [S/m]. These fin-dings are supported by selected literature data of garnet-silli-manite-biotite-gneiss and garnet-biotite-hornblende-gneiss from the KTB borehole project (Börner and Schön, 1995; sum-marized as gneiss in Figure 22) which clearly plot in the mica-dominated region.
-3 -2 -5 The highest values of 9.0•10 σ' 1.0•10 [S/m] and 1.0•10 [S/m]
Figure 19: Complex conductivity (left) and phase spectrum (right) of albite granite samples from Zinnwald.________________________________
Figure 20: Selected complex conductivity (left) and phase spectra (right) of greisen rocks from Zinnwald.__________________________________
Figure 21: Complex conductivity of two-mica granite (top, left) and greisen samples (bottom, left) and phase spectrum of two-mica granite (top, right) and greisen samples (bottom, right) from the Nebelstein area._________________________________________________________________
94

Edith MÜLLER-HUBER & Frank BÖRNER
-5 -4and 1.0•10 σ'' 1.0•10 [S/m] seem to be associated with with samples containing several per cent of kaolinite. Further data of kaolinite-bearing shaly sandstone samples (Börner, 1992) also plot in the clay-dominated region and support this assumption. Three clay samples (88% montmorillonite, 87% Kaolinite and 11% illite, and 43% kaolinite and 24% illite, respectively) from Börner et al. (1993) also plot close to the region where the clayey crystalline rocks and sandstones are found but with significantly higher values of σ’, which can be explained by their high absolute content of clay minerals. This may be due to their extremely high clay content or the different properties of illite or montmorillonite as compared to kaolinite. The two-mica granites from the Nebelstein, how-ever, also plot in the mica-dominate region due to their high volumetric mica content of at least 5% increasing up to 18% as alteration progresses and successively replaces feldspars by muscovite.
4. Discussion and ConclusionsResults from a petrophysical study aimed to characterize
two greisen bodies from the Southern Bohemian Batholith and the Eastern Erzgebirge Volcano-Plutonic Complex and their surrounding rocks are presented. Comprehensive petro-physical laboratory measurements of density, porosity, velo-city, magnetic susceptibility, gamma spectroscopy, electrical resistivity, and spectral induced polarization were conducted on representative material from sampling locations in the Ne-belstein area (Austria) and the Eastern Erzgebirge (Germany).
The petrophysical results show that greisen rocks’ properties generally differ from the surrounding rocks’ but influencing factors such as porosity may reduce this contrast: Greisens are characterized by elevated grain densities and, if porosity is sufficiently low, also by high bulk densities in comparison to the surrounding rocks. The measured ranges of grain and
3 3bulk density (2.70 to 2.91 g/cm and 2.58 to 2.80 g/cm ) of the greisen rocks from Zinnwald (Germany) indicate that both parameters increase with decreasing quartz content and in-creasing zinnwaldite content, which has a density of about
32.65 and 2.99 g/cm . Exceptions from this tendency can be found with regard to bulk density for samples with extremely high zinnwaldite content of fragile condition, which signifi-cantly increases porosity (up to 12%). The grain density of the Austrian greisen samples is lower than the grain density of the samples from Zinnwald due to their high content of mus-
3covite which has a density of 2.78-2.88 g/cm (Schumann, 2002).The Austrian greisen samples are characterized by com-parably high porosity (2.2-7.8%), which was already observed by Koller et al. (1992) who stated that the final alteration stage resulted in high porosity of up to 5% in the greisen rocks of the Nebelstein area. This high porosity level causes bulk den-
3sity to decrease (2.51-2.69 g/cm ) to the level of the surroun-ding two-mica granite despite their higher mica content. Be-ginning greisenization of the granite decreases bulk density due to an increase in porosity and increases grain density in most cases. The highest bulk densities along with the lowest porosities were measured on very fine-grained greisen varie-ties indicating that grain size also critically influences porosity.
These observations indicate that there is a good contrast bet-ween greisen and surrounding rocks with regard to grain den-sity. For both greisen sample sets grain density is significantly elevated in comparison to granite or rhyolite and ist absolute values are dependent on the specific mineral assemblage, es-pecially mica type. Bulk density, the quantity directly measure-able with geophysical methods, is, however, critically influen-ced by porosity-causing genetic processes and may be both higher and lower in greisen rocks in comparison to their sur-rounding rocks depending on the average porosity contrast.
The influence of porosity is also found with regard to com-pressional wave velocity: v is mostly higher than 3100 m/s in the low-porosity greisen rocks from Zinnwald and is neither characteristically higher nor lo-wer than in the neighboring rocks. v is, however, also influ-p
enced by pore structure, mi-crocracks, and grain contacts (Schön, 2011), which helps to explain why samples of similar porosity and comparably high grain density possess low v : At p
a porosity of 4%, for instance, v of one greisen sample was p
2.192 m/s at a grain density of 32.733 g/cm , while v of another p
sample was 4.860 m/s at a grain 3density of 2.629 g/cm . The grei-
sen samples’ high grain density is mostly associated with high
p
Figure 22: Crossplot of real vs. imaginary part of complex conductivity [S/m] at 1 Hz for albite granite (dark gray squares), Teplice rhyolite (dark gray triangles), and greisen samples (dark gray dots) from Zinn-wald and two-mica granite (light gray dots) and greisen samples (light gray squares) from the Nebelstein area. Literature data of gneiss (black rhombs, Börner and Schön, 1995), shaly sandstone (black squares, Börner, 1992) and clay samples (black dots, Börner et al., 1993) were included.______________________
95

Multi-parameter petrophysical characterization of Variscan greisen rocks from the Southern Bohemian Batholith (Austria) and the Eastern Erzgebirge Volcano-Plutonic Complex (Germany)
zinnwaldite content. Zinnwaldite, however, is highly cleavable, meaning that single grains or pieces can easily be detached from the sample and may therefore influence the measured velocities. In the samples from the Nebelstein it is mostly lo-wer than 2900 m/s and thus generally lower than in the sur-rounding two-mica granite. This trend is most likely a result of the high porosities of the greisen samples of the Nebelstein area in comparison with two-mica granite. Nevertheless, tex-tural properties and contact conditions at grain boundaries are equally important velocity-controlling factors as they may overprint the expected velocity-porosity and velocity-grain density relationships. However, it seems likely that the influ-ence of microcracks or friable texture due to fissile mica may be less pronounced in field measurements under undisturbed stress conditions.
Specific electrical resistivity is another petrophysical para-meter influenced by porosity: Even though the German grei-sens may have a wide range of specific electrical resistivity, their mean value of 2100 Ohmm is characteristically higher than in the surrounding rocks. The quite low values of elec-trical resistivity in the rhyolites and albite granites (140 to 1200 Ohmm) cannot fully be explained by the porosity level encountered and may therefore be a hint at clay minerals such as kaolinite being present due to beginning degradation of the feldspars. Low values of specific electrical resistivity of, for instance, 590 Ohmm at a low porosity of, for example, 3.5% in some of the greisen samples from Zinnwald indicate that an additional conductivity component such as interface conductivity or conductivity due to metallic conductors or semiconductors may be effective, which may be due to oxi-des or sulfides being present in the greisen samples and po-tentially decreases the measured specific electrical resistivity values. In comparison, the greisens from the Nebelstein are associated with a narrow range of resistivity and their mean value of 2070 Ohmm is lower than in the surrounding rocks. With regard to SIP measurements, the greisens from Zinnwald are characterized by a lower absolute range of the real σ' and
-3 -4imaginary part σ'' of complex conductivity (1•10 -1•10 and -5 -71•10 -1•10 S/m, respectively) than the surrounding rocks and
a distinct phase spectrum with a negative phase maximum between 0.5-5 Hz. Similar phase patterns with a local maxi-mum phase at the lowest measured frequency of 0.01 Hz, a phase minimum at 10 to 100 Hz and a subsequent increase in phase were observed by Shin et al. (2016) in skarn ores. They attributed this specific frequency response below 100 Hz to the abundance and grain size of the magnetite and minor pyrite observed in the samples. They found a phase minimum at about 10 Hz with high magnetite content and large magne-tite grain size, while they found a minimum of 100 to 1000 Hz indicative of a lower magnetite content and smaller particle size. The albite granites, in contrast, are characterized by a mi-nimum in the absolute phase value at the lowest frequency followed by a phase increase until a prominent maximum is reached between 0.5 and 10 Hz and a subsequent decrease in phase. Similar curve types were observed by Mao et al. (2016)
who investigated, amongst others, a commercially available bentonite representing a mix of silt and smectite with very
3high cation exchange capacity of 48•10 C/kg and a similar bell-shaped phase spectrum with a phase maximum of 5 mrad at a frequency of about 1 Hz. This may support the assump-tion that kaolinite from feldspar degradation may affect the resistivity response of the albite granites of Zinnwald. In con-trast, both complex electrical conductivity and phase spec-trum of the greisens from the Nebelstein area and their sur-rounding rocks do not differ characteristically and both gra-nite and greisen samples show a more or less constant phase behavior. Similar phase spectra were reported by Shin et al. (2016) for igneous rocks affected by sericitization predomi-nantly composed of dielectric minerals such as quartz, albite and orthoclase. The proposed crossplot of σ'' vs σ' helps to separate quartz-dominated zones from mica- and clay-domi-nated ones and may therefore present a helpful means of identifying greisen zones due to their high mica content. The Austrian two-mica granites, however, also plot in the micado-minated region as they are also characterized by a high mica content and obviously low clay content.
With regard to spectral gamma measurements, it can be sta-ted that the integral gamma as well as U content are gene-rally lower in the greisens than in the surrounding rocks and in similar ranges (mean 0.92 cps and 8.6 ppm U for the greis-ens from the Nebelstein and 0.89 cps and 10.95 ppm U for the ones from Zinnwald). As far as K and Th counts are con-cerned, the studied greisen types differ significantly: while the German samples have a far lower mean K content (3.0%) than the surrounding rocks, the Austrian ones have a slightly higher mean K content (7.0%) than the two-mica granite. Th content is quite variable in both greisen types but the mean Th content of the greisens from Zinnwald is with 61 ppm lo-wer than in the surrounding rhyolite but higher than in albite granite. The overall highest Th and U contents, however, were found in greisen samples, which may be due to sporadically occurring thorite and thorianite in the albite granite (Breiter and Škoda, 2012) which potentially concentrates during grei-senization as Th is insoluble. The greisens from the Nebelstein area, in contrast, have a far lower mean Th content of 10.7 ppm which is only little lower than in the surrounding two-mica
-4granite. Therefore, the Th/K*10 ratio is indicative of the grei-sens from Zinnwald and ranges from >11 to >50 in most ca-ses and is thus mostly higher than in the surrounding rocks
-4where the Th/K*10 ratio is <13. In contrast, the Austrian greisens do not differ significantly from the two-mica granite
-4with regard to the Th/K*10 ratio. In contrast, their Th/U ratio ranges mostly from 0.9 to about 3.0 and is higher than in the two-mica granite where Th/U is <0.7. Gnojek and Přichystal (1997) stated that the granites of the Southern Bohemian Ba-tholith which can be found in the Nebelstein area are not uni-form with regard to their radiogeochemical features. Especi-ally Th and U and locally also K contents are reported to be variable. Such variations may be caused by differences in the primary content of K-, U- and Th-bearing minerals but also by
_________________
96
Edith MÜLLER-HUBER & Frank BÖRNER
secondary redistribution. While K occurs in many rock-forming minerals such as feldspars, micas, or clays, U content is con-trolled by chemical conditions as it forms soluble salts and may therefore be transported by water. Precipitation of U fi-nally occurs due to chemical precipitation in acid-reducing en-vironments, adsorption by organic matter or chemical reac-tions. Th, in contrast, is very stable and insoluble (Schön, 2011).
The investigated greisen samples are also characterized by magnetic susceptibilities which distinctly differ from their surrounding rocks in most cases: The greisens from Zinnwald mostly possess significantly higher susceptiblities than the surrounding Teplice rhyolite and albite granite due to their high zinnwaldite content and its significantly higher suscep-tibilities as compared to quartz or feldspar. In contrast, the high muscovite content of the Austrian greisen samples does not seem to increase magnetic susceptibility sufficiently in comparison to the surrounding granites, which is likely due to muscovite’s less elevated values in comparison to quartz or feldspars. This indicates that the magnetic susceptibility of the greisens and granites from the Nebelstein area is not de-
-4 -4termined by their mica content – values of 1.2•10 -2.2•10 SI are given by Schön (2011) for muscovite – as it is the case for the samples from Zinnwald. The magnetic behavior rather seems to be determined by the absence or presence of oxidic ore minerals, which has already been observed by Gnojek and Přichystal (1997). Based on surface in-situ magnetic sus-ceptibility measurements the authors reported that musco-vite granites of the Nebelstein granitic complex were partly
-2associated with high magnetic susceptibilities of 1.3•10 --25.8•10 SI caused by hematitization. They also found quite
variable magnetic susceptibilities in greisen rocks and hydro-thermally altered granites from Hirschenschlag (Southern Bo-
-2hemian Batholith) with up to 2.0•10 SI where clusters of mag-netite, sometimes with small pyrite inclusions, occur, which are also present in the Nebelstein granite. Very low magnetic susceptibilities were reported for greisenized rocks without oxidic ore minerals. The studied greisen samples from the Ne-belstein area obviously lack significant contents of sulfidic or oxidic minerals and are thus characterized by characteristical-ly lower magnetic susceptibilities than the surrounding two-mica granite where hematitization accounts for high values.
The above observations clearly demonstrate that no single parameter alone is sufficiently characteristic of the investiga-ted disperse-mineralized greisen rocks to differentiate them from their surrounding rocks. Due to their low concentrations of oxidic, sufidic, or silicatic ores, especially mica type and its absolute content in the greisens and country rocks seem to be critical for their distinction based on, for example, logging data. Therefore, a combined investigation of density, magne-tic susceptibility, and spectral gamma seems to be very pro-mising as all three parameters are highly sensitive to high mica contents which are characteristic of greisen rocks. Addi-tional borehole or surface SIP measurements may be helpful if phase information or the ranges of the real and imaginary part of complex conductivity of the greisen rocks are expec-
ted to differ from the surrounding rocks due to contrasts in mica type or content. Apart from that, measurements of elas-tic wave velocity may also be useful if stress conditions are more or less undisturbed and velocity is expected to be do-minantly influenced by grain density and porosity. Resistivity measurements, in contrast, are not only influenced by poro-sity, but also by pore-fluid salinity, clay and mica content and the content of metallic ores and it may be difficult to separate these effects. If the content of metallic ores in the greisens is, however, sufficiently high, it may increase their electrical con-ductivity in comparison to the surrounding rocks and may be a good indicator for mineralized greisen zones.
5. NomenclatureAa
b
IIAPI
KkLRESThUUvp
κΦφρρ0
ρb
ρg
σ‘σ''σ*σel
σ*int
AcknowledgementsThe authors gratefully acknowledge Johannes Prince of Fürs-
tenberg and SolarWorld Solicium GmbH for sampling permis-sion. The authors would also like to express their gratitude to F. Huber, H. Müller, and W. Peschke as well as H. Giegling for their assistance in sampling at the Nebelstein and Zinnwald, respectively. K. Kühn (G.E.O.S. Ingenieurgesellschaft mbH), M. Maurer, W. Voigt, and S. Schmidt (BBi – Brunnen- und Bohr-lochinspektion GmbH) are thanked for constructive discus-sions. The authors thank D. Siegel and P. Pinkowski for con-ducting measurements as part of their bachelor theses, Dr. S. Herting-Agthe (TU Berlin) for her mineralogical expertise and Dr. R. Käppler (TU Bergakademie Freiberg) for providing the
____________
Cross-sectional area of rock model [m]Uranium concentration [ppm] equivalent to the count rate of 1% PotassiumUranium concentration [ppm] equivalent to the count rate of 1 ppm ThoriumCurrent [A]Integral gamma activity [API]Potassium content [%]tool constantLength of rock sample [m]Resistance [Ohm]Thorium content [ppm]Voltage drop [V]Uranium content [ppm]Compressional wave velocity [m/s]Magnetic susceptibility [SI]Porosity [%]Phase shift [-]Specific electrical resistivity [Ohmm]Resistivity of 100 % water-saturated rock [Ohmm]
3Bulk density [g/cm ]3Grain density [g/cm ]
Real part of complex conductivity [S/m]Imaginary part of complex conductivity [S/m]Complex electrical conductivity [S/m]Electrolytic conductivity [S/m]Interface conductivity [S/m]
97

Multi-parameter petrophysical characterization of Variscan greisen rocks from the Southern Bohemian Batholith (Austria) and the Eastern Erzgebirge Volcano-Plutonic Complex (Germany)
susceptibility meter. Mineral samples were provided by the Mineralogical Collections of TU Berlin. XRD Rietveld analyses were carried out at Institut für Mineralogie und Kristallogra-phie, Faculty of Geosciences, Geography and Astronomy, Uni-versity of Vienna. The authors gratefully acknowledge BMWi for supporting project ”ExploreTec“ under grant number KF 2346203RH3. We thank J. Schön and one further reviewer for their most comprehensive reviews and the editor M. Wagreich for handling the review process quickly and carefully.
ReferencesArchie, G.E., 1942. The electrical resistivity log as an aid in de-
termining some reservoir characteristics. Transactions of the American Institute of Mining, Metallurgical and Petroleum Engineers, 146, 54-62.
Biswas, A. and Sharma, S.P., 2016. Integrated geophysical stu-dies to elicit the subsurface structures associated with Ura-nium mineralization around South Purulia Shear Zone, India: A review. Ore Geology Reviews, 72/2, 1307–1326. http://dx. doi.org/10.1016/j.oregeorev.2014.12.015
Bongajum, E., White, I., Milkereit, B., Qian, W., Morris, W.A., Nas-seri, M.H.B., and Collins, D.S., 2009. Multiparameter petrophy-sical characterization of an orebody: an exploration case his-tory. In: M. Diederichs and G. Grasselli (eds.), ROCKENG09 – Proceedings of the 3rd CANUS Rocks Mechanics Symposium, 9-15 May, Toronto, Canada, Paper 4157, pp. 1–6.
Börner, F., 1992. Complex conductivity measurements of reser-voir properties. In: P.F. Worthington (ed.), Advances in Core Evaluation III (Reservoir Management). Gordon and Breach Science Publishers, London, Reading, pp. 359–368.
Börner, F.D. and Schön, J.H., 1991. A relationship between the quadrature component of electrical conductivity and the specific surface area of sedimentary rocks. The Log Analyst, 32, 612–613.
Börner, F. and Schön, J., 1995. Low frequency complex conducti-vity measurements of microcrack properties. Surveys in Geo-physics, 16/1, 121–139. http://dx.doi.org/10.1007/BF00682716
Börner, F., Gruhne, M. and Schön, J., 1993. Contamination in-dications derived from electrical properties in the low fre-quency range. Geophysical Prospecting, 41/1, 83–98. http:// dx.doi.org/10.1111/j.1365-2478.1993.tb00566.x/pdf
Breiter, K., 1997. The Teplice rhyolite (Krušné hory Mts., Czech Republic): Chemical evidence of a multiply exhausted strati-fied magma chamber. Bulletin of the Czech Geological Sur-vey, 72/2, 205–213.
Breiter, K. and Škoda, R., 2012. Vertical zonality of fractionated granite plutons reflected in zircon chemistry: the Cínovec A-type versus the Beauvoir S-type suite. Geologica Carpathica, 63/5, 383—398. http://dx.doi.org/10.2478/v10096-012-0030-6
Breiter, K. and Scharbert, S., 2006. Two-mica and biotite grani-tes in the Weitra-Nové Hrady area, Austria – Czech Republic. Journal of the Czech Geological Society, 51/3-4, 217–230. http://dx.doi.org/10.3190/JCGS.995
______
Breiter, K., Novák, J.K. and Chlupáová, M., 2001. Chemical Evo-lution of Volcanic Rocks in the Altenberg-Teplice Caldera (Eastern Krušné Hory Mts., Czech Republic, Germany). Geo-lines, 13, 17–22.
Čada, M. and Novák, J.K., 1974. Spatial distribution of greisen types at the Cínovec-South tin deposit. In: M. Štemprok (ed.), Metallization associated with acid magmatism. 1. Ústř. úst. geol. Praha, 383–388.
Dobrin, M.B., 1976. Introduction to geophysical prospecting, 3rd ed. McGraw-Hill, New York, 630 pp.
Finger, F. and Höck, V., 1987. Zur magmatischen Entwicklung des Moldanubikums in Oberösterreich. Jahrbuch der Geolo-gischen Bundesanstalt Wien, 129, 641–642.
Finger, F. and Friedl, G., 2002. Der südböhmische Batholith: Granitoide der Sauwald- und Mühlzone. Exkursionsführer PANGEO Austria 2002, Salzburg, 17 pp.
Finger, F., Roberts, M.P., Haunschmid, B., Schermaier, A. and Steyrer, H.P., 1997. Variscan granitoids of central Europe: their typology, potential sources and tectonothermal rela-tions. Mineralogy and Petrology, 61, 67–96. http://dx.doi. org/10.1007/BF01172478
Förster, H.-J., Davis, J.C., Tischendorf, G. and Seltmann, R., 1999. Multivariate analyses of Erzgebirge granite and rhyolite com-position: implications for classification of granites and their genetic relations. Computers & Geosciences, 25, 533–546. http://dx.doi.org/10.1016/S0098-3004(98)00171-X
Franke, W. and Żelazniewicz, A., 2000. The eastern termination of the Variscides: terrane correlation and kinematic evolution. In: Franke, W., Haak, V., Oncken, O. and Tanner, D. (eds.), Oro-genic Processes: Quantification and Modelling in the Variscan Belt. Geological Society, London, Special Publications, 179, 63–68. http://dx.doi.org/10.1144/GSL.SP.2000.179.01.06
Frasl, G. and Finger, F., 1988. Führer zur Exkursion der Öster-reichischen Geologischen Gesellschaft ins Mühlviertel und in den Sauwald am 22. Und 23. September 1988. Reihe Ex-kursionsführer Österreichische Geologische Gesellschaft, Wien, 28 pp.
Friedl, G., Frasl, G., von Quadt, A. and Finger, F., 1992. Neue U/ Pb Altersdaten aus der südlichen Böhmischen Masse. Frank-furter Geowiss. Arb., A11, 217–218.
Fuchs, G. and Matura, A., 1976. Zur Geologie des Kristallins der südlichen Böhmischen Masse. Jahrbuch der Geologi-schen Bundesanstalt Wien, 119, 1–43.
Gnojek, I. and Přichystal, A., 1997. Ground Geophysical and Geological Mapping in the Central Part of the Moldanubian Pluton. Jahrbuch der Geologischen Bundesanstalt, 140/2, 193–250.
Göd R., 1989. A contribution to the Mineral Potential of the Southern Bohemian Massif, Austria. Arch. Lagerst.-forsch. Ostalpen, Bd. 11, 147 153, Jahrbuch der Geologischen Bun-desanstalt, Wien.
Göd, R. and Koller, F., 1987. Molybdän-führende Greisen in der südlichen Böhmischen Masse. Mitteilungen der Österreichi-schen Mineralogischen Gesellschaft, 132, 87 101.
Göd, R. and Koller, F., 1989. Molybdenite magnetite bearing
98
Edith MÜLLER-HUBER & Frank BÖRNER
greisens associated with peraluminous leucogranites, Nebel-stein, Bohemian Massif (Austria). Chemie der Erde, 49, 185– 200.
Koller, F., Högelsberger, H., Koeberl, C., 1992, Fluid-Rock Inter-action in the Mo-bearing Nebelstein Greisen complex, Bohe-mian Massif (Austria). Mineralogy and Petrology 45, 261 276.
Koller, F. and Klötzli, U., 1998. The evolution of the Southern Bohemian Pluton. In: K. Breiter (ed.), Genetic significance of phosphorus in fractionated granites. Excursion guide, ČGÚ Praha, pp. 11 14.
Lange, H., Tischendorf, G., Pälchen, W., Klemm, I. and Ossen-kopf, E., 1972. Fortschritte der Metallogenie im Erzgebirge. B. Zur Petrographie und Geochemie der Granite des Erzge-birges. Geologie, 21/4-5, 491 520.
Mao, D., Revil, A. and Hinton, J., 2016. Induced polarization response of porous media with metallic particles – Part 4: Dectection of metallic and nonmetallic targets in time-do-main-induced polarization tomography. Geophysics, 81/4, D359 D375. http://dx.doi.org/10.1190/geo2015-0480.1
Maurer, M., Stiller, D., Voigt, W., Förster, K., 2012, Einsatz bohr-lochgeophysikalischer Messverfahren zum Erz- und Spat-nachweis. In: H.-J. Kümpel, H.-G. Röhling, V. Steinbach (eds.), GeoHannover 2012 - GeoRohstoffe für das 21. Jahrhundert, Schweizerbart Science Publishers, Stuttgart, p. 481.
McCann, T. (ed.), 2008. The Geology of Central Europe. Volume 1: Precambrian and Paleozoic. Geological Society, London, 748 pp.
Monecke, T., Dulski, P. and Kempe, U., 2006. Origin of convex tetrads in rare earth element patterns of hydrothermally al-tered siliceous igneous rocks from the Zinnwald Sn-W de-posit, Germany. Geochimica et Cosmochimica Acta, 71/2, 335 353. http://dx.doi.org/10.1016/j.gca.2006.09.010
Mlčoch, B. and Skácelová, Z., 2010. Geometry of the Alten-berg-Teplice Caldera revealed by the borehole and seismic data in its Czech part. Journal of Geosciences, 55, 217 229. http://dx.doi.org/ 10.3190/jgeosci.071
Müller-Huber, E., Kühn, K., Maurer, M., Schmidt, S. and Börner, F., 2015. Petrophysical, mineralogical, and geochemical inves-tigations of a Li-Sn-W deposit – A contribution to develop a borehole probe for quantitative element determination in ores of natural deposits. In: J. Wagner and K. Elger (eds.), Geo-Berlin2015 - Dynamic Earth from Alfred Wegener to today and beyond - Abstracts. Annual Meeting of DGGV and DMG, 4-7 October 2015, Berlin, GFZ German Research Centre, pp. 272 273. http://doi.org/10.2312/GFZ.LIS.2015.003
Müller-Huber, E., Kühn, K., Maurer, M., Schmidt, S. and Börner, F., 2016. Ein petrophysikalisches Modell für die Quantifizie-rung von Nutzmineralgehalten in einer Greisenlagerstätte aus Bohrlochlogs. In: Westfälische Wilhelms-Universität Müns-ter, Institut für Geophysik (ed.), 76. Jahrestagung der Deut-schen Geophysikalischen Gesellschaft - Abstracts, 14 17 March 2016, Münster, p. 283. http://doi.org/10.2312/dgg76
Olhoeft, G.R., 1985. Low-frequency electrical properties. Geo-physics, 50/12, 2492 2503. http://dx.doi.org/10.1190/1.1441880
Parasnis, D.S., 1974. Mining Geophysics, 2nd ed. Methods in
Geochemistry and Geophysics 3. Elsevier Scientific Publi-shing Company, Amsterdam, 356 pp.
Parasnis, D.S., 1986. Principles of applied geophysics, 4th ed. Chapman and Hall, New York, 402 pp.
Scharbert, S., 1987. Zur Altersstellung der Magmatite im Mol-danubikum. Mitteilungen der Österreichischen Mineralogi-schen Gesellschaft, 132, 21 37.
Schild, M., Siegesmund, S., Vollbrecht, A. and Mazurek, M., 2001. Characterization of granite matrix porosity and pore-space geometry by in situ and laboratory methods. Geo-physical Journal International, 146/1, 111 125. http://dx.doi. org/10.1046/j.0956-540x.2001.01427.x
Schnabel, W., 2002. Geologische Karte von Niederösterreich 1:200.000., Geologische Bundesanstalt, Wien.
Schön, J.H., 2011. Physical Properties of Rocks – a Workbook, 1st ed. Elsevier B.V., Oxford, 494 pp. http,//www.elsevierdirect. com/companion.jsp?ISBN=9780444537966
Shin, S.W., Park, S. and Shin, D.B., 2016. Spectral-induced po-larization characterization of rocks from the Handuk iron mine, South Korea. Environ. Earth Sci., 75, 827. http://dx.doi. org/10.1007/s12665-016-5618-1
Slater, L., 2007. Near Surface Electrical Characterization of Hy-draulic Conductivity: From Petrophysical Properties to Aqui-fer Geometries—A Review. Surveys in Geophysics, 28, 169– 197. http://dx.doi.org/10.1007/s10712-007-9022-y
Štemprok, M., 1986. Petrology and geochemistry of the Cze-choslovak part of the Krušné hory Mts. Granite pluton. Czech Republic. Sborník geologických věd, ložisková geologie a mineralogie, 27, 111–156.
Štemprok, M., 1993. Magmatic evolution of the Krušné hory-Erzgebirge batholith. Zeitschrift für Geologische Wissen-schaften, 21/1-2, 237–245.
Štemprok, M., Holub, F.V. and Novák, J.K., 2003. Multiple mag-matic pulses of the Eastern Volcano-Plutonic Complex, Kruš-né hory/Erzgebirge batholith and their phosphorus contents. Bulletin of Geoscience, 78/3, 277–296.
Štemprok, M., Dolejš, D. and Holub, F.V., 2014. Late Variscan calc-alkaline lamprophyres in the Krupka ore district, Eas-tern Krušné hory/Erzgebirge: their relationship to Sn-W mi-neralization. Journal of Geosciences, 59/1, 41–68. http://dx. doi.org/10.3190/jgeosci.156
Štemprok, M., Novák, J.K. and David, J., 1994. The association of the granites and tin-tungsten mineralization in the eas-tern Krušné hory (Erzgebirge), Czech Republic. In: K. von Gehlen and D.D. Klemm (eds.), Monograph Series on Mine-ral Deposits, Gebrüder Bornträger, Berlin-Stuttgart, 31, pp. 97–129.
Tait, J.A., Bachtadse, V., Franke, W. and Soffel, H.C., 1997. Geody-namic evolution of the European Variscan fold belt: palaeo-magnetic and geological constraints. Geologische Rundschau, 86/3, 585–598. http://dx.doi.org/10.1007/s005310050165
Telford, W., Geldart, L., Sheriff, R. and Keys, D., 1991. Applied Geophysics, 2nd ed. Cambridge University Press, New York, 792 pp.
Vellmer, C. and Wedepohl, K.H., 1994. Geochemical characte-
99

Multi-parameter petrophysical characterization of Variscan greisen rocks from the Southern Bohemian Batholith (Austria) and the Eastern Erzgebirge Volcano-Plutonic Complex (Germany)
rization and origin of granitoids from the South Bohemian Batholith in Lower Austria. Contributions to Mineralogy and Petrology, 118/1, 13–32. http://dx.doi.org/10.1007/BF00310608
Vinegar, H.J. and Waxman, M.H., 1984. Induced polarization of shaly sands. Geophysics, 49/8, 1267–1287. http://dx.doi. org/10.1190/1.1441755
Ward, S.H., 1990. Resistivity and Induced Polarization Methods. In: S.H. Ward (ed.), Investigations in Geophysics 5, Geotechni-cal and Environmental Geophysics: Volume I: Review and Tu-torial, Society of Exploration Geophysicists, Tulsa, Oklahoma, pp. 147-190. http://dx.doi.org/10.1190/1.9781560802785.ch6
Zaraisky, G.P., 1995. The influence of acidic fluoride and chlo-ride solutions on the geochemical behavior of Al, Si and W. In: K.I. Shmulovich, B.W.D. Yardley and G.G. Gonchar (eds.), Fluids in the Crust – Equilibrium and transport properties. Springer Science + Business Media, B.V., Dordrecht, pp. 139– 162. http://dx.doi.org/10.1007/978-94-011-1226-0_6
Received: 29 September 2016Accepted: 31 March 2017
*)Edith MÜLLER-HUBER & Frank BÖRNERDepartment of Applied Geophysics, Technische Universität Berlin,
Ernst-Reuter-Platz 1, BH 1-1, 10587 Berlin, Germany;*)
______________
Corresponding author, [email protected]______________
100