multi-level virtual machine debugging using the java platform
TRANSCRIPT
Multi-Level Virtual Machine Debugging using
the Java Platform Debugger Architecture⋆
Thomas Wurthinger1, Michael L. Van De Vanter2, and Doug Simon2
1 Institute for System SoftwareJohannes Kepler University Linz
Linz, Austria2 Sun Microsystems Laboratories
Menlo Park, California, [email protected], [email protected], [email protected]
Abstract. Debugging virtual machines (VMs) presents unique chal-lenges, especially meta-circular VMs, which are written in the same lan-guage they implement. Making sense of runtime state for such VMs re-quires insight and interaction at multiple levels of abstraction simultane-ously. For example, debugging a Java VM written in Java requires under-standing execution state at the source code, bytecode and machine codelevels. However, the standard debugging interface for Java, which hasa platform-independent execution model, is itself platform-independent.By definition, such an interface provides no access to platform-specificdetails such as machine code state, stack and register values. Debuggersfor low-level languages such as C and C++, on the other hand, havedirect access only to low-level information from which they must syn-thesize higher-level views of execution state. An ideal debugger for ameta-circular VM would be a hybrid: one that uses standard platform-independent debugger interfaces but which also interacts with the exe-cution environment in terms of low-level, platform-dependent state.This paper presents such a hybrid architecture for the meta-circularMaxine VM. This architecture adopts unchanged a standard debugginginterface, the Java Platform Debugger Architecture (JPDA), in com-bination with the highly extensible NetBeans Integrated DevelopmentEnvironment. Using an extension point within the interface, additionalmachine-level information can be exchanged between a specialized serverassociated with the VM and plug-in extensions within NetBeans.
1 Introduction
Higher level programming languages are increasingly implemented by a virtual
machine (VM), which is implemented in a lower-level language, which is in turncompiled into the machine language of each target platform. Standard debuggersfor the VM implementation language, often C or C++, suffice in simple situa-tions, but not when parts of the VM (for example critical libraries) are written
⋆ This work was supported by Sun Microsystems, Inc.

in the implemented language. This is also the case for applications written in theJavaTMprogramming language [4] that combine Java and C code via the JavaNative Interface(JNI) [5]. This creates a demand for mixed-mode debuggers thatsupport both languages: implementation and implemented.
The debugging challenge is even more complex and subtle for meta-circularVM implementations where the implementation and implemented languages areone and the same. A solution requires what we call multi-level debugging. A VMdeveloper would like to debug at the source-level of the implementation language,but since that language is also being implemented by the VM, one must oftendrop to a lower level: the machine language of the platform into which theimplementation is compiled. At this lower level one must be able to examineevery aspect of machine state (registers, stacks, data layouts, compiled code,etc.) and to interpret that state in terms of the implementation language, evenwhen the implementation may be broken. Such a tool is necessarily specialized,with the consequence that the many advantages of debugging with a modernIntegrated Development Environment (IDE) are unavailable.
For example, the Maxine Inspector is a multi-level debugger that is of ne-cessity highly specialized for the meta-circular Maxine Virtual Machine [6], forwhich Java is both the implementation and implemented language. The MaxineInspector is an out-of-process, machine-level debugger that has the additionalability to interpret machine data at multiple levels of abstraction; it does thisthrough extensive code sharing with and knowledge of the Maxine VM imple-mentation. For example, Java objects can be viewed either abstractly or in termsof a concrete memory layout that may vary across implementation platforms andVM configurations. Java methods can be viewed as source code, bytecodes, ormachine code produced by one of Maxine’s compilers. Register values and mem-ory words can be interpreted either as bits, as primitive values, as addresses,or as pointers to known Java objects. Figure 1 shows a Java object and a Javamethod, each viewed in both in source- and machine-level representations.
There are Java debuggers as well as machine code debuggers, but to thebest of our knowledge, no system successfully combines both worlds as does theMaxine Inspector. The original Inspector, however, stood alone and lacked boththe productivity features and sophisticated user interface that Java programmersexpect. As an alternative to replicating those advantages, we explored integratingthe core of the Inspector, the out-of-process Inspector Debugging Agent thatreads and interprets machine state, with the extensible NetBeans IDE [14].
This has been made possible through development of a new framework forintegration that depends on NetBeans support for the Java Platform Debugger
Architecture (JPDA) [13], which specifies contracts between a Java VM and aJava debugger. This framework depends on JPDA’s Java Debug Interface (JDI)[11] and uses JPDA’s Java Debug Wire Protocol (JDWP) [12] to communicatewith the debugged process over a network stream. This approach emphasizesJava-level functionality and is extended when needed for displaying additionalmachine-level information. A new “protocol within the JDWP protocol” enables

Fig. 1. Multiple view levels on a Java object and Java code during debugging.
the transfer of extended kinds of information via JDWP, a technique of generalinterest to VM developers seeking such extensions to debugging support.
Section 2 introduces this technique in the context of the Maxine VM andInspector. Section 3 describes the extended JDWP server implementation addedto the Inspector, along with a new mechanism using Java dynamic proxy classes[10] to transmit additional information via the unchanged JDWP protocol. Sec-tion 4 shows how a new “protocol with the JDWP protocol” communicates withNetBeans, in particular with plug-in extensions that allow the debugger to usethe mechanism. Section 5 comments on the advantages of this approach, Section6 reviews related work, and Section 7 concludes.
2 System Architecture
The Maxine Inspector requires almost no active support from the Maxine VM;this is necessary because there is no separate implementation language whoseown implementation can be relied upon. The Inspector runs in its own pro-cess, reads VM memory via inter-process communication, and implements basicdebugging commands by managing the VM process. The original Inspector in-ternally comprises two software layers: an agent that both communicates withthe VM and interprets its state, and a front end that adds graphical views anduser interaction.
The alternative architecture developed for multi-level Maxine debugging withNetBeans uses JDWP: an asynchronous protocol that defines a standard forcommunication between Java debugger and VM. Important JDWP commandgroups are:
– VirtualMachine: get general information, loaded classes, current threads.– ReferenceType: reflective information about types, class fields and methods.

– ObjectReference: retrieve the values of an object; invoke an instance method.– ThreadReference: get data about the current call stack and thread status.– EventRequest : install callbacks for events, e.g. class loading and breakpoints.
The Java Platform Debugger Architecture specifies how a Java debugger, usinga standard interface (JDI) and wire protocol (JDWP), can connect to a remoteserver for debugging Java programs via a network connection.
Figure 2 shows how Maxine system components interact in this architecture;new components are dark gray, and the others are unchanged. The new Max-ine JDWP Server delegates commands to the existing Maxine Inspector Agent.New plugins extend the NetBeans debugger and communicate directly with theJDWP server. These plugins use both the standard JDWP protocol and a newtechnique, described in Section 4, to access additional information not directlysupported by JDWP. Examples of such information include the address of ob-jects in memory and compiled machine code for a Java method.
3 The Maxine JDWP Server
Most JDWP commands are queries from the client (debugger) that produce an-swers from the server (agent), for example to gather information about loadedclasses and thread state. Events that originate in the VM are transmitted tothe client only when the client has registered for the events with a JDWP com-mand. Current Maxine VM limitations delayed a complete implementation ofthe JDWP protocol by the server, but the implemented subset already sufficesfor debugging the Maxine VM using NetBeans.
In addition to standard Java debugging operations, the Maxine JDWP Servercan set machine code breakpoints, perform a machine code single-step, examinememory contents, and more. When a breakpoint is reached, the server transmitsinformation about threads and their instruction pointers. The NetBeans debug-ger always needs a correct Java bytecode position, which is then matched backto the source code and highlighted as the current line in the program. The servercalculates the bytecode position based on the current machine code address; theposition can be either exact or approximate, depending on which Maxine com-piler produced the code. For setting a breakpoint in the Java source code, theserver performs the reverse approximation, because the command sent by theclient Java debugger contains the bytecode location only.
Fig. 2. System architecture.
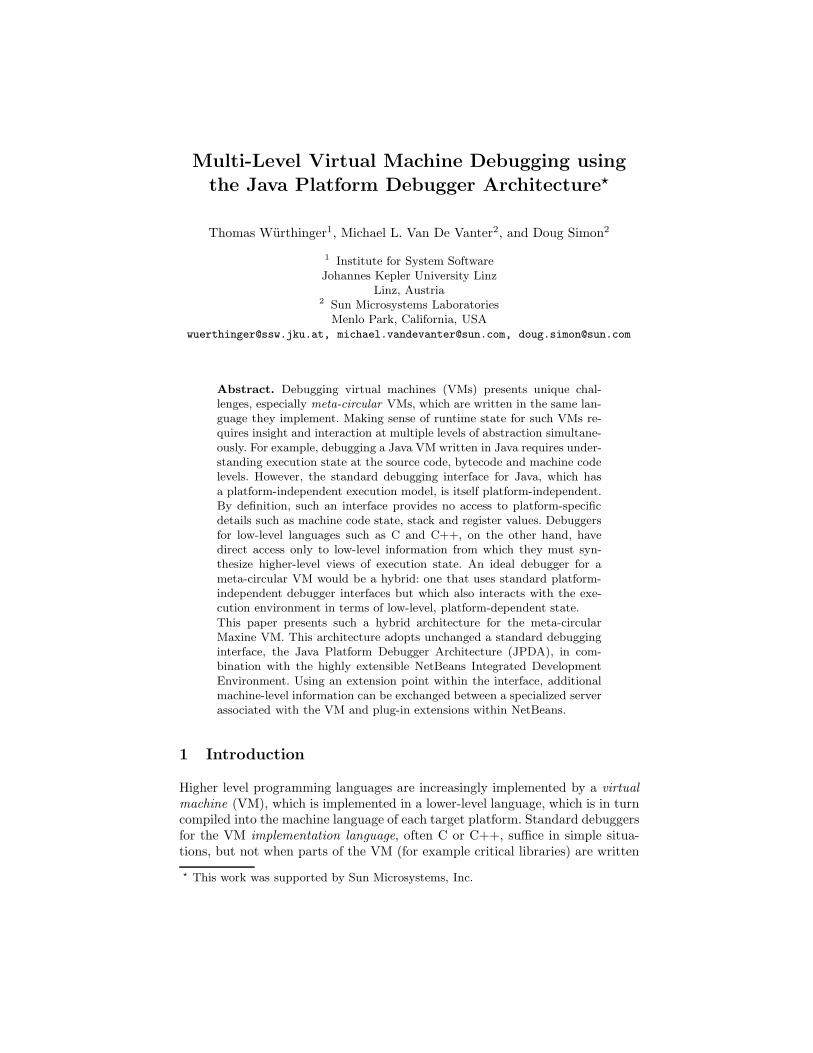
The Maxine JDWP Server holds information about all loaded classes. Re-quests for object field access are delegated to the Maxine Inspector Agent, whichreads the raw bytes and converts them, if possible, to valid JDWP types. This al-lows IDE windows that display watch expressions and local variables to work asexpected. Current implementation restrictions in the Inspector Agent preventevaluation of method calls in watch expressions, but all other kinds of watchexpressions work as expected.
The Maxine JDWP Server creates artificial fields for the transmission of ad-ditional, implementation-related information about Java objects. It can do thisbecause the server controls class layout information transmitted to the client.Requests for read access to artificial fields are handled directly by the server,whereas access to other fields requires reading from VM memory via the Inspec-tor Agent. Figure 3 shows an example Java object and how it would appear inthe debugger client. At this time the server simulates fields for the address andthe header word of an object, both of which are machine-level VM implemen-tation artifacts. The server also simulates a field that points to an object’s hub:a Maxine VM implementation object describing the type and other meta-datarelated to the object. The client debugger requires no modification to displayartificial fields, since they appear as ordinary Java fields.
Fig. 3. Artificial object fields help transmitting additional information about objectsto the debugger.

Fig. 4. Code example for the Java dynamic proxy mechanism combined with JDWP.
4 A Protocol within the JDWP Protocol
Although artificial fields permit the display of additional information about ob-jects without modification to the JDWP debugger client, a more general mech-anism is also needed. This is done without change to the protocol by leveragingthe JDWP invoke command, which was originally intended to support methodcalls in watch expressions. Java’s dynamic proxy mechanism [10] makes it pos-sible to create proxy objects behind an interface, objects that delegate methodcalls to JDWP invoke commands. The Maxine JDWP Server creates artificial
methods that provide access to machine-level information via reflective delega-tion to appropriate methods in the Inspector Agent. The net effect is a kind

of specialized “remote method invocation” available to the client through aninterface.
Code samples in Figure 4 show how the dynamic proxy mechanism is im-plemented. Interface A is defined on both server and client. On the server it isimplemented by class AImpl; on the client a dynamic proxy object is created. Theclient-side proxy implements the interface InvocationHandler, which allows thedelegation of Java calls; it delegates method calls to the invoke method.
Figure 5 diagrams the interaction among objects in this architecture. Theclient implements the interface with a Java dynamic proxy object; it is basedon a JDI Object Reference to which it delegates method calls. This JDI ObjectReference is also known to the NetBeans Debugger and can be referenced inJDWP commands. The Maxine JDWP Server delegates invoke commands ona specific JDWP ID to the corresponding Java object. In conventional usage,server-side invoke commands are delegated to the VM via the Inspector Agent,but in this case they are redirected via reflective call to the implementer of theinterface. Glue code for these interactions is automated, so neither the user ofthe interface nor the implementer need any special handling.
Fig. 5. Dynamic proxy objects for implementing a protocol within the protocol.
Three important optimizations address performance concerns:
– State Change: The client normally presumes that a conventional JDWPinvoke invalidates previously retrieved VM state. We can guarantee, how-ever, that an invoke on an artificial method in the Maxine JDWP Serverexecutes no VM code. In these cases Java reflection is used to bypass thebuilt-in refresh mechanisms of JDI, thus avoiding unnecessary overhead onthe client.
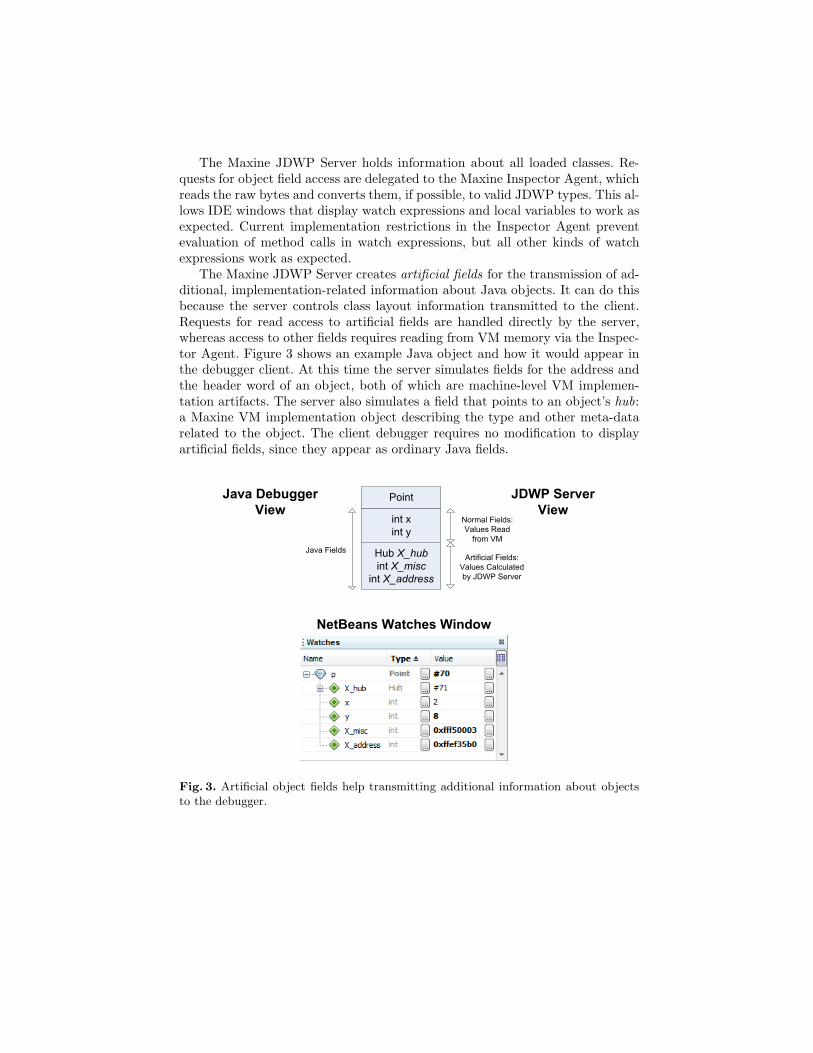
– Multiple Objects: Although transmitting data is typically fast, the roundtrip needed to perform a JDWP invoke is not. Some return values (e.g.the information about all registers of a thread) are represented by multipleobjects, and transmitting them individually could introduce undesirable la-tency. Such values are instead returned from server to client as a unit: a bytearray containing the serialized data needed to reconstruct the object graph.
– Cache: Many of the interface methods used in this architecture are guaran-teed to return the same result when called with the same parameters. Theclient further optimizes network traffic by caching these results, based onannotations applied to such methods. This grants client side implementa-tions the freedom to invoke remote commands without undue performanceconcerns.
This approach, by virtue of specialization, has advantages over Java RMI orother Java remote technologies in this context:
– It shares an existing JDWP network connection.– Interfaces can be used to extend standard JDWP objects. For example, a
special interface adds methods to a thread object that provide access toregister state.
– JDWP objects can appear as method parameters and return types.
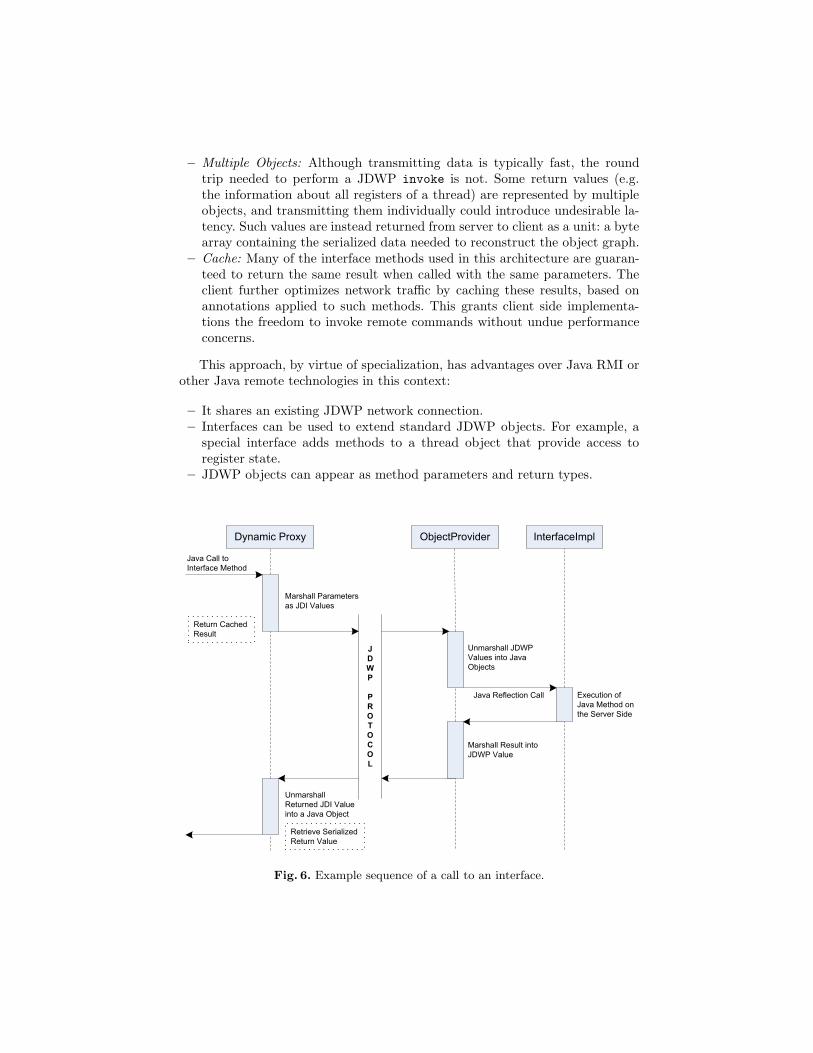
Fig. 6. Example sequence of a call to an interface.

Figure 6 diagrams the interactions that follow when the client invokes anartificial method on the Maxine JDWP Server. The client’s dynamic proxy im-plements the call, checking first whether the result is cached and can be returnedimmediately. If not cached, the client marshalls parameters as JDI values fortransmission via JDWP invoke. Primitive types are marshalled by encapsula-tion in a JDI data object, reference types by JDWP identifiers managed on theserver. Array types are simply copied to the server and filled with marshalledprimitive or reference values.
The Maxine JDWP Server first unmarshalls the invoke parameters, usinga map to convert JDWP identifiers to object references. The call is then dele-gated via Java reflection to the implementer of the interface. Finally the servermarshalls the return value into a JDWP value for return to the client.
The client’s dynamic proxy receives the return value as a JDI object andconverts it to a Java object. In case of an array this can again require additionalJDWP commands to retrieve array contents. In case of a byte array containingthe serialized form of a Java object, the bytes are retrieved and deserialized. Theoriginal caller receives a normal Java object in return without special treatment.
Fig. 7. Screenshot of the enhanced NetBeans debugger showing both machine codeand Java source code position.
5 Status and Results
The architecture of our approach makes it possible for any client that imple-ments JDWP to debug the Maxine VM at the Java-level. Multi-level debugging,however, requires additional functionality, for which we chose to extend Net-Beans. NetBeans already implements JDWP, has a flexible plugin architecture,

and provides standard techniques for extending debugger functionality withoutmodification.
Our approach succeeds in making it simple to transport additional informa-tion between the Maxine Inspector Agent and the NetBeans IDE. Client-sidecode for displaying data can use simple interfaces that are implemented on theserver. The Java dynamic proxy mechanism hides the complications implied bydata marshalling and unmarshalling to transmit the data over the network.
The Maxine JDWP server implements both a useful subset of the standardsource-level JDWP protocol and access to the VM’s machine-level state. We haveprototyped additional machine-level views; Figure 7 shows NetBeans debuggingthe Maxine VM with these extensions enabled. The Java-level call stack, localvariables, and current position in Java code appear in NetBeans components. TheMaxine Code View highlights the current machine code location based on thecurrent position in Java code. Also shown are register contents for the currentlyselected thread. The address of each Java object appears in an artificial field, andthis address can be used to retrieve the raw memory contents at that location.
The full reuse of the NetBeans Java debugger frees us from implementingmany concepts that are part of a modern Java debugger, and ensures ongoingbenefit as NetBeans evolves. On the other hand, it remains to be seen whetherthe tight integration among views at different levels of abstraction will be as easyas it has been in the specialized Maxine Inspector. Implementing the prototypedescribed here has already required the use of Java reflection in order to accessNetBeans functionality for which no public API is provided. This difficulty is nota limitation of the transport architecture described in this paper, but rather thenature of an IDE for which this type of extension was perhaps not anticipated.
The prototype described here is integrated into the Maxine open sourceproject. We plan to continue exploring this approach to multi-level debuggingfor the Maxine VM with work on additional components and mutli-level views.
6 Related Work
Ungar et al. developed a meta-circular VM for the Self programming language[15], which they debugged with a debug server written in C++. Remote debug-ging in Self relies upon a custom network protocol as well as a custom debugger.
The meta-circular Jikes Research Virtual Machine is also written in Java [1];it uses a remote reflection technique for accessing VM data that is similar to ours[7]. The Jikes debugger itself however, is not based on an existing Java debugger.
Simon et al. [9] developed the Squawk VM, a small Java VM written mostlyin Java that runs on a wireless sensor platform. Squawk includes a debug agentthat implements a subset of JDWP, but there are no extensions of the sort thatpermit multi-level debugging.
Printezis and Jones created GCspy framework for the analysis of VM mem-ory management behavior [8]. They considered and rejected using an enhancedversion of JDWP for transmitting their data for two reasons: GCspy data hasnothing to do with debugging, the focus of the JDWP protocol, and its use would

needlessly confine GCspy technology to Java applications. These, however, areactually advantages in the context of Maxine debugging.
Dimitriev extended the JDWP protocol with additional commands for re-defining classes in the VM [2][3]. Although this approach is reasonable for func-tionalities that are of general interest for virtual machines, it would complicatethe protocol significantly in our case. By defining a protocol within the JDWPprotocol, we retained flexibility and avoided the need for further standardization.
7 Conclusions
Multi-level debugging for a meta-circular VM presents technical challenges thatare not easily met with conventional development tools, even mixed-mode toolsdesigned to support multiple languages. Faced with the choice between the de-velopment cost of a specialized, isolated tool (our original approach), and thechallenges of directly extending an existing IDE, we have explored an alternateapproach. Leveraging a single-level standard architecture (JPDA) for remote de-bugging, we were able to transport information at additional levels of abstractionby implementing a remote invocation protocol within the JPDA’s Java Debug-ging Wire Protocol (JDWP). The advantages of this approach, prototyped usingthe Maxine Inspector Agent on the server side and NetBeans as the client, arethat a wide array of rich functionality becomes available for debugging the Max-ine VM at the Java-level. This dramatically reduces Maxine development costfor this level of functionality, both present and future as the NetBeans platformevolves.
Solving the transport problem, however, is only part of the solution. The nextchallenge is to provide the advantages of tightly integrated multi-level views,easily developed in the stand-alone Maxine Inspector, in a rich platform thatwas originally designed for single-level debugging.
8 Acknowledgements
The authors would like to thank Maxine team members Ben Titzer and BerndMathiske for their support and many helpful suggestions.
References
1. Alpern, B., Attanasio, C.R., Cocchi, A., Hummel, S.F., Lieber, D., Mergen, M.,Shepherd, J.C., Smith, S.: Implementing jalapeno in Java. In: OOPSLA ’99: Pro-ceedings of the 14th ACM SIGPLAN conference on Object-oriented programming,systems, languages, and applications, ACM Press (1999) 314–324
2. Dmitriev, M.: Safe class and data evolution in large and long-lived JavaTM appli-cations. Technical report, Sun Microsystems Laboratories (2001)
3. Dmitriev, M.: Towards flexible and safe technology for runtime evolution of Javalanguage applications. In: Proceedings of the Workshop on Engineering ComplexObject-Oriented Systems for Evolution, in association with OOPSLA 2001 Inter-national Conference. (2001)

4. Gosling, J., Joy, B., Steele, G., Bracha, G.: JavaTM Language Specification, The(3rd Edition) (Java Series). Addison-Wesley Professional (2005)
5. Liang, S.: The Java Native Interface: Programmers Guide and Specification.Addison-Wesley Publishing Co., Inc. (1999)
6. Mathiske, B.: The maxine virtual machine and inspector. In: OOPSLA Compan-ion ’08: Companion to the 23rd ACM SIGPLAN conference on Object orientedprogramming systems languages and applications, ACM (2008) 739–740
7. Ngo, T., Barton, J.: Debugging by remote reflection. In: Proceedings of Euro-Par2000 - Parallel Processing, Springer LNCS (2000) 1031–1038
8. Printezis, T., Jones, R.: Gcspy: an adaptable heap visualisation framework. In:OOPSLA ’02: Proceedings of the 17th ACM SIGPLAN conference on Object-oriented programming, systems, languages, and applications, ACM (2002) 343–358
9. Simon, D., Cifuentes, C., Cleal, D., Daniels, J., White, D.: JavaTM on the baremetal of wireless sensor devices: the squawk Java virtual machine. In: VEE ’06:Proceedings of the 2nd international conference on Virtual execution environments,ACM (2006) 78–88
10. Sun Microsystems, Inc.: Java Dynamic Proxy Classes. (1999)http://java.sun.com/j2se/1.5.0/docs/guide/reflection/proxy.html.
11. Sun Microsystems, Inc.: Java Debug Interface. (2004)http://java.sun.com/javase/6/docs/jdk/api/jpda/jdi/index.html.
12. Sun Microsystems, Inc.: Java Debug Wire Protocol. (2004)http://java.sun.com/javase/6/docs/technotes/guides/jpda/jdwp-spec.html.
13. Sun Microsystems, Inc.: Java Platform Debugger Architecture. (2004)http://java.sun.com/javase/6/docs/technotes/guides/jpda/.
14. Sun Microsystems, Inc.: NetBeans. (2009) http://www.netbeans.org.15. Ungar, D., Spitz, A., Ausch, A.: Constructing a metacircular virtual machine in
an exploratory programming environment. In: OOPSLA ’05: Companion to the20th annual ACM SIGPLAN conference on Object-oriented programming, systems,languages, and applications, ACM (2005) 11–20