multi-hazard mitigation plan update
TRANSCRIPT
Prepared for Hamilton County, Indiana Town of Arcadia, Indiana Town of Atlanta, Indiana City of Carmel, Indiana Town of Cicero, Indiana Town of Fishers, Indiana
City of Noblesville, Indiana Town of Sheridan, Indiana Town of Westfield, Indiana
November 2013
Prepared by
Christopher B. Burke Engineering, LLC
115 West Washington Street, Suite 1368 South Indianapolis, Indiana 46204
CBBEL Project No. 10-149
MULTI-HAZARD MITIGATION PLAN UPDATE
Hamilton County, Indiana

DISCLAIMER Exhibits and any GIS data used within this report are not intended to be used as legal documents or references. They are intended to serve as an aid in graphic representation only. Information shown on exhibits is not warranted for accuracy or merchantability.
LOCAL PROJECT CONTACT: Thomas Sivak, Director Hamilton County Emergency Management Agency 18100 Cumberland Road Noblesville IN 46060 317-770-3381 [email protected]

Hamilton County MHMP Update November 2013
i
TABLE OF CONTENTS Chapter 1 Introduction ................................................................................................................1
1.1 Disaster Life Cycle .......................................................................................................................... 1
1.2 Project Scope and Purpose ........................................................................................................... 2
1.3 Planning Process ............................................................................................................................ 3
1.3.1 Planning Committee.............................................................................................................. 4
1.3.2 Public Involvement ................................................................................................................ 6
1.3.3 Involvement of Other Interested Parties .............................................................................. 6
1.4 Plans, Studies, Reports, and Technical Information ...................................................................... 6
Chapter 2 Community Information ...............................................................................................9
2.1 Population and Demographics ...................................................................................................... 9
2.2 Employment ................................................................................................................................ 10
2.3 Transportation and Commuting Patterns ................................................................................... 10
2.4 Critical and Non-Critical Infrastructure ....................................................................................... 13
2.5 Major Waterways and Watersheds ............................................................................................ 16
2.6 NFIP Participation ........................................................................................................................ 16
2.7 Topography ................................................................................................................................. 17
2.8 Climate ........................................................................................................................................ 17
Chapter 3 Risk Assessment......................................................................................................... 19
3.1 Hazard Identification ................................................................................................................... 19
3.1.1 Hazard Selection ................................................................................................................. 19
3.2 Hazard Ranking ............................................................................................................................ 20
3.2.1 Probability ........................................................................................................................... 21
3.2.2 Magnitude/Severity ............................................................................................................ 21
3.2.3 Warning Time ...................................................................................................................... 21
3.2.4 Duration .............................................................................................................................. 22
3.2.5 Calculating the CPRI ............................................................................................................ 22
3.3 Hazard Profiles ............................................................................................................................ 23
3.3.1 Drought ............................................................................................................................... 24
3.3.2 Earthquake .......................................................................................................................... 30
3.3.3 Flood ................................................................................................................................... 36

Hamilton County MHMP Update November 2013
ii
3.3.4 Hailstorms, Thunderstorms, and Windstorms .................................................................... 48
3.3.5 Snow Storms and Ice Storms .............................................................................................. 53
3.3.6 Tornado ............................................................................................................................... 59
3.3.7 Dam and Levee Failure ........................................................................................................ 64
3.3.8 Hazardous Materials Incident ............................................................................................. 70
3.4 Hazard Summary ......................................................................................................................... 74
Chapter 4 Mitigation Goals and Practices ................................................................................... 77
4.1 Mitigation Goal ............................................................................................................................ 77
4.2 Mitigation Practices ..................................................................................................................... 77
Chapter 5 Implementation Plan ................................................................................................. 89
5.1 Emergency Preparedness & Warning Systems ........................................................................... 89
5.2 Management of High Hazard Dams & Levees ............................................................................. 90
5.3 Tree Maintenance ....................................................................................................................... 91
5.4 Power Back-Up generators.......................................................................................................... 91
5.5 Safe Rooms & Community Shelters ............................................................................................ 92
5.6 Water Conservation Ordinance ................................................................................................... 92
5.7 Geographic Information Systems ................................................................................................ 93
5.8 Public Education & Outreach ...................................................................................................... 93
5.9 Building Protection ...................................................................................................................... 93
5.10 Community Rating System .......................................................................................................... 94
5.11 Emergency Response & Recovery ............................................................................................... 95
5.12 Floodplain Management ............................................................................................................. 95
Chapter 6 Plan Maintenance Process .......................................................................................... 97
6.1 Monitoring, Evaluating, and Updating the Plan .......................................................................... 97
6.2 Incorporation into Existing Planning Mechanisms ...................................................................... 98
6.3 Continued Public Inolvement ...................................................................................................... 99

Hamilton County MHMP Update November 2013
iii
LIST OF TABLES Table 1-1 MHMP Planning Committee ......................................................................................................... 5 Table 2-1 List of Major Employers and Number of Employees .................................................................. 10 Table 2-2 NFIP Participation........................................................................................................................ 17 Table 3-1: Hazard Identification .................................................................................................................. 20 Table 3-2 Determination of Weighted Value for NFIP Communities ......................................................... 23 Table 3-3 CPRI for Drought ......................................................................................................................... 26 Table 3-4 CPRI for Earthquake .................................................................................................................... 32 Table 3-5 Repetitive Loss Claims and Payments ......................................................................................... 39 Table 3-6 Flood Insurance Premiums and Coverage .................................................................................. 40 Table 3-7 CPRI for Flood .............................................................................................................................. 40 Table 3-8 Manual GIS Analysis Utilizing Most Recent Preliminary DFIRM Data and Hamilton County Building Inventory ....................................................................................................................................... 42 Table 3-9 Critical Infrastructure in SFHA by NFIP Community .................................................................... 43 Table 3-10 Number of Structures within the SFHA and Number of Flood Insurance Policies ................... 43 Table 3-11 HAZUS-MH GIS Analysis with the 1% Annual Chance Flood Hazard and the Hamilton County Building Inventory ....................................................................................................................................... 44 Table 3-12 CPRI for Hailstorm, Thunderstorm, and Windstorm ................................................................. 50 Table 3-13 CPRI for Snow Storms and Ice Storms ....................................................................................... 55 Table 3-14Fujita Scale of Tornado Intensity ............................................................................................... 60 Table 3-15 CPRI for Tornado ....................................................................................................................... 60 Table 3-16 Summary of Hypothetical Tornado Damages ........................................................................... 61 Table 3-17 CPRI for Dam and Levee Failure ................................................................................................ 66 Table 3-18 Estimated Damages for Keystone Woods Lake Dam Failure .................................................... 67 Table 3-19 Estimated Damages for Morse Reservoir Dam Failure ............................................................. 67 Table 3-20 Critical Structures in the Morse Reservoir Potential Dam Inundation Area ............................. 68 Table 3-21 CPRI for Hazardous Materials Incident ..................................................................................... 71 Table 3-22 Combined CPRI .......................................................................................................................... 75 Table 3-23 Hazard Relationship .................................................................................................................. 76 Table 4-1 Proposed Mitigation Practices .................................................................................................... 83
LIST OF FIGURES Figure 2-1 Hamilton County Location ........................................................................................................... 9 Figure 2-2 Hamilton County Transportation Routes ................................................................................... 11 Figure 2-3 Workers Commuting into Hamilton County .............................................................................. 12 Figure 2-4 Workers Commuting out of Hamilton County ........................................................................... 12 Figure 2-5 Major Waterways of Hamilton County ...................................................................................... 16 Figure 3-1 Drought Affected Soil ................................................................................................................. 24 Figure 3-2 Indiana Drought Conditions ....................................................................................................... 25

Hamilton County MHMP Update November 2013
iv
Figure 3-3 Crops Affected by Drought ........................................................................................................ 28 Figure 3-4 Earthquake Hazard Areas in the US ........................................................................................... 30 Figure 3-5 Earthquake Damaged Porch ...................................................................................................... 31 Figure 3-6 Minor Earthquake Damages ...................................................................................................... 33 Figure 3-7 White River in Noblesville .......................................................................................................... 37 Figure 3-8 Fire Engine in Flood Waters ....................................................................................................... 45 Figure 3-9 High Water at Cicero .................................................................................................................. 46 Figure 3-10 Damage to Vehicle Caused by Hailstones ................................................................................ 48 Figure 3-11 Hailstones from Carmel Resident ............................................................................................ 49 Figure 3-12 Uprooted Tree ......................................................................................................................... 51 Figure 3-13 Ice Covered Power Lines .......................................................................................................... 53 Figure 3-14 Travel Impacted During Snow Storm ....................................................................................... 56 Figure 3-15 Flooding Caused by Snow Melt ................................................................................................ 57 Figure 3-16 Funnel Cloud During a Lightning Storm at Night ..................................................................... 59 Figure 3-17 Outdoor Warning Siren Coverage ............................................................................................ 62 Figure 3-18 Morse Reservoir Dam .............................................................................................................. 65 Figure 3-19 Drums of Potentially Hazardous Waste ................................................................................... 70 Figure 3-20 Fuel Tanker Fire ....................................................................................................................... 73
LIST OF APPENDICES Appendix 1 – List of Acronyms
Appendix 2 – Committee Meeting Agendas and Summaries
Appendix 3 – Public Participation and Involvement of Other Interested Parties
Appendix 4 – Critical Infrastructure by NFIP Community
Appendix 5 – USGS Stream Gage Locations and Major Waterways
Appendix 6 – NCDC Hazard Data
Appendix 7 – CRS Checklist
Appendix 8 – Potential Funding Sources
Appendix 9 – Implementation Checklist

Hamilton County MHMP Update November 2013
1
CHAPTER 1 INTRODUCTION
1.1 DISASTER LIFE CYCLE
The Federal Emergency Management Agency (FEMA) defines the disaster life cycle as the process through which emergency managers respond to disasters when they occur; help people and institutions recover from them; reduce the risk of future losses; and prepare for emergencies and disasters. The disaster life cycle includes 4 phases:
• Response – the mobilization of the necessary emergency services
and first responders to the disaster area (search and rescue; emergency relief)
• Recovery – to restore the affected area to its previous state (rebuilding destroyed property, re-employment, and the repair of other essential infrastructure)
• Mitigation – to prevent or to reduce the effects of disasters (building codes and zoning, vulnerability analyses, public education)
• Preparedness – planning, organizing, training, equipping, exercising, evaluation and improvement activities to ensure effective coordination and the enhancement of capabilities (preparedness plans, emergency exercises/training, warning systems)
The Hamilton County Multi-Hazard Mitigation Plan (MHMP) focuses on the mitigation phase of the disaster life cycle. According to FEMA, mitigation is most effective when it’s based on an inclusive, comprehensive, long-term plan that is developed before a disaster occurs. The MHMP planning process identifies hazards, the extent that they affect the municipality, and formulates mitigation practices to ultimately reduce the social, physical, and economic impact of the hazards.

Hamilton County MHMP Update November 2013
2
REQUIREMENT §201.6(d)(3): A local jurisdiction must review and revise its plan to reflect changes in development, progress in local mitigation efforts, and changes in priorities, and resubmit it for approval within five (5) years in order to continue to be eligible for mitigation project grant funding.
1.2 PROJECT SCOPE AND PURPOSE
A MHMP is a requirement of the Federal Disaster Mitigation Act of 2000 (DMA 2000). According to DMA 2000, the purpose of mitigation planning is for State, local, and Indian tribal governments to identify the natural hazards that impact them, to identify actions and activities to reduce any losses from those hazards, and to establish a coordinated process to implement the plan, taking advantage of a wide range of occurrences.
A FEMA-approved MHMP is required in order to apply for and/or receive project grants under the Hazard Mitigation Grant Program (HMGP), Pre-Disaster Mitigation (PDM), Flood Mitigation Assistance (FMA), and Severe Repetitive Loss (SRL). FEMA may require a MHMP under the Repetitive Flood Claims (RFC) program. Although the Hamilton County MHMP meets the requirements of DMA 2000 and eligibility requirements of these grant programs, additional detailed studies may need to be completed prior to applying for these grants.
In order for National Flood Insurance Program (NFIP) communities to be eligible for future mitigation funds, they must adopt either their own MHMP or participate in the development of a multi-jurisdictional MHMP. The Indiana Department of Homeland Security (IDHS) and the United States Department of Homeland Security (DHS)/FEMA Region V offices administer the MHMP program in Indiana. As noted above, it is required that local jurisdictions review, revise, and resubmit the MHMP every 5 years. MHMP updates must demonstrate that progress has been made in the last 5 years to fulfill the commitments outlined in the previously approved MHMP. The updated MHMP may validate the information in the previously approved Plan, or may be a major plan rewrite. The updated MHMP is not intended to be an annex to the previously approved Plan; it stands on its own as a complete and current MHMP.
The Hamilton County MHMP Update is a multi-jurisdictional planning effort led by the Hamilton County Emergency Management Agency (EMA). This Plan was prepared in partnership with the Hamilton County, the Town of Atlanta, the Town of Arcadia, the City of Carmel, the Town of Cicero, the Town of Fishers, the City of Noblesville, the Town of Sheridan, and the Town of
Hamilton County MHMP Update November 2013
3
REQUIREMENT §201.6(c)(1): The plan shall document the planning process used to prepare the plan, including how it was prepared, who was involved in the process, and how the public was involved.
Westfield. Representatives from these communities attended the Planning Committee meetings, provided valuable information about their community, reviewed and commented on the draft MHMP, and assisted with local adoption of the approved Plan. As each of the communities had an equal opportunity for participation and representation in the planning process, the process used to update the Hamilton County MHMP satisfies the requirements of DMA 2000 in which multi-jurisdictional plans may be accepted.
Throughout this Plan, activities that could count toward Community Rating System (CRS) points are identified with the NFIP/CRS logo. The CRS is a voluntary incentive program that recognizes and encourages community floodplain activities that exceed the minimum NFIP requirements. As a result, flood insurance premiums are discounted to reflect the reduced flood risk resulting from community actions that meet the 3 goals of the CRS: (1) reduce flood losses; (2) facilitate accurate insurance rating; and (3) promote education and awareness of flood insurance. Savings in flood insurance premiums are proportional to the points assigned to various activities. A minimum of 500 points are necessary to enter the CRS program and receive a 5% flood insurance premium discount. This MHMP could contribute as many as 294 points toward participation in the CRS. At the time of this planning effort, Hamilton County and the City of Noblesville participate in the CRS and are recognized as a Class 7 and Class 8 respectively. For this reason, flood insurance policyholders receive a 15% discount in the unincorporated areas of Hamilton County and a 10% discount within the City of Noblesville.
Funding to update the MHMP was made available through a FEMA/DHS PDM grant awarded to the Hamilton County Commissioners and administered by IDHS. Hamilton County provided the local 25% match required by the grant. Christopher B. Burke Engineering, LLC (CBBEL) was hired to facilitate the planning process and prepare the Hamilton County MHMP under the direction of an American Institute of Certified Planners (AICP) certified planner.
1.3 PLANNING PROCESS
Preparation for the Hamilton County MHMP Update began in 2010 when the Hamilton County EMA submitted a PDM Grant application to IDHS. The grant request was approved by FEMA and grant funds were awarded in 2012.

Hamilton County MHMP Update November 2013
4
Once the grant was awarded, the planning process to update the 2006 MHMP took 12 months. This includes a 8 month planning process, followed by 3 months for IDHS and FEMA to review and conditionally approve the draft MHMP Update, and another month for Hamilton County, the Town of Atlanta, the Town of Arcadia, the City of Carmel, the Town of Cicero, the Town of Fishers, the City of Noblesville, the Town of Sheridan, and the Town of Westfield to adopt the final MHMP Update.
1.3.1 Planning Committee
The EMA compiled a list of Planning Committee members to guide the MHMP Update planning process. These individuals were specifically invited to serve on the Committee because they were knowledgeable of local hazards; have been involved in hazard mitigation; have the tools necessary to reduce the impact of future hazard events; and/or served as a representative on the original Planning Committee in 2006. Table 1-1 lists the individuals that participated on the Planning Committee and the entity they represented.

Hamilton County MHMP Update November 2013
5
Table 1-1 MHMP Planning Committee NAME TITLE REPRESENTING
Paul Ayers District 4 Hamilton County Council Jon Baldwin ESF-5 Representative EMA Mark Bowen Sheriff Hamilton County Sheriff’s Department Kristina Chapman ESF-6 Representative Red Cross William Curl Captain Sheridan Police Department Brad Davis Director Hamilton County Highway Department Mark Elder Division Chief Fishers Fire & Emergency Services Carl Erickson Deputy Director EMA Brooke Gajownik Coordinator 911 Addressing & Mapping Rob Gaylor Deputy Chief Westfield Fire Department Tom Gehlhausen Chief Deputy Hamilton County Sheriff’s Department Chris Gilbert ESF-6 Representative Red Cross Ken Gilliam Chief Noblesville Fire Department Tim Green Chief Carmel Police Department Adam Harrington Training Captain Carmel Fire Department Steve Haston Fire Fighter Noblesville Fire Department Mitch Hazelbaker Chief Westfield FD Amber Hawkins GIS Specialist Hamilton County Communications Mitch Hazelbaker Chief Wayne Township Fire Department Dave Hildebrand Chief Cicero Police Department Matthew Hoffman Chief Carmel Fire Department Kevin Jowitt Chief Noblesville Police Department Greg Kehl Chief Fishers Police Department Chuck Kiphart Director Hamilton County Plan Commission Scott Kirby Assistant Chief Noblesville Police Department Jason Lemon Chief Westfield Fire Department Jerry Liston ESF-3 Representative Hamilton County Surveyor’s Office Steve Orusa Chief Fishers Fire Department Allen Patterson Director Hamilton County Parks & Recreation Steven Peachey Chief Cicero Fire Department Joel Rush Chief Westfield Police Department Tom Sivak Director EMA Dan Stevens Administration Director Hamilton County Commissioner’s Office Larry Stout GIS Director Hamilton County ISSD Dave Strong Major Carmel Police Department Kent Ward Surveyor Hamilton County Surveyor’s Office Steve White Chief Jackson Fire Territory Greg Wyant Assistant Chief Noblesville Fire Department
The Planning Committee met 4 times during the MHMP Update. Meetings were held monthly between March and June 2013 at the Hamilton County Emergency Operation Center (EOC). During these meetings, the Planning Committee revisited existing (in the 2006 MHMP) and identified new critical

Hamilton County MHMP Update November 2013
6
REQUIREMENT §201.6(c)(1): The plan shall include a review and incorporation, if appropriate, of existing plans, studies, reports, and technical information.
infrastructure and local hazards; reviewed the State’s mitigation goals and updated the local mitigation goals; reviewed the most recent local hazard data, vulnerability assessment, and maps; evaluated the effectiveness of existing mitigation measures and identified new mitigation projects; and reviewed materials for public participation. A sign-in sheet recorded those present at each meeting to document participation. Meeting agendas and summaries are included in Appendix 2. Members of the Planning Committee attended the public meeting in November 2013 and assisted with adoption of the Hamilton County MHMP Update.
1.3.2 Public Involvement
Drafts of the Hamilton County MHMP Update were posted online and a paper copy was placed in the EMA office for public review and comment. Planning Committee members were also provided with an informational flyer to display in their respective offices and forward electronically to colleagues, family, and friends.
A public meeting was held on November 14, 2013 at the Hamilton County EMA Training Room. Members of the Planning Committee were present to describe details of the plan as well as to answer questions presented by attendees. The media release and power point presentation are located in Appendix 3.
1.3.3 Involvement of Other Interested Parties
Neighboring EMA Directors in Boone, Clinton, Hancock, Hendricks, Madison, Marion, and Tipton Counties as well as interested agencies, businesses, academia, and nonprofits were invited to review and comment on the draft Hamilton County MHMP Update (Appendix 3). Information related to the planning process, the public meeting, and the availability of the draft Hamilton County MHMP was directly provided to such potentially interested parties via personal conversations, informational flyer, and press releases. Successful implementation and future updates of the Hamilton County MHMP Update will rely on the partnership and coordination of efforts between such groups.
1.4 PLANS, STUDIES, REPORTS, AND TECHNICAL INFORMATION
During the development of the Hamilton County MHMP Update, several relevant sources of information were reviewed either as a document, or

Hamilton County MHMP Update November 2013
7
through discussions with local personnel. This exercise was completed to gather updated information since the development of the original Hamilton County MHMP, and to assist the Planning Committee in developing potential mitigation measures to reduce the social, physical, and economic losses associated with hazards affecting Hamilton County.
For the purposes of this planning effort, the following materials were discussed and utilized:
• Comprehensive Plans o Carmel-Clay Township (2009) o Cicero-Jackson Township (2004) o Fishers (2010) o Hamilton County (2006) o Noblesville (2007) o Westfield-Washington Township (2007)
• Fishers Town Center Key Concepts and Design Guidelines (2011) • Hamilton County Comprehensive Emergency Management Plan
(2010) • Hamilton County Hazard Analysis (2012) • Hamilton County Mass Evacuation Plan (2006) • Hamilton County Multi-Hazard Mitigation Plan (2006) • The Indianapolis Star, The Noblesville Times (archived and current
articles) • Hamilton County Flood Insurance Rate Maps (FIRMS)
The CRS program credits NFIP communities a maximum of 100 points for organizing a planning committee composed of staff from various departments; involving the public in the planning process; and coordinating among other agencies and departments to resolve common problems relating to flooding and other known natural hazards.

Hamilton County MHMP Update November 2013
8
This page intentionally blank

Hamilton County MHMP Update November 2013
9
CHAPTER 2 COMMUNITY INFORMATION
Although much of the information within this Section is not required by DMA 2000, it is important background information about the physical, social, and economical composition of Hamilton County necessary to better understand the Risk Assessment discussed in Chapter 3.
Hamilton County, established in 1823 and named after Alexander Hamilton, is located in Central Indiana, just north of Marion County and the City of Indianapolis. The total area of Hamilton County is approximately 402.5 square miles, including Geist and Morse Reservoirs. The County Seat, the City of Noblesville, is approximately 23 miles northeast of the City of Indianapolis. The location of Hamilton County within the State of Indiana is identified in Figure 2-1.
2.1 POPULATION AND DEMOGRAPHICS
The most recent census data for Hamilton County estimates that the 2011 population was 282,810, which ranks 1st in the State. Of that total, the City of Carmel accounts for 81,564, or 28.8% of the county’s population while the Town of Fishers is the second largest community with 79,127 or 28.0% of the population. Based on growth rates between 2000 and 2010, the metropolitan area between Indianapolis and Carmel accounted for 57% of the state’s total growth, according to the Indiana University Kelley School of Business. Further, it is estimated that by 2050, the population of Hamilton County will double in size to just fewer than 550,000 people and will surpass Lake and Allen Counties in population. The top three fastest growing communities in the State of Indiana are also located in Hamilton County; the City of Carmel, the Town of Fishers, and the City of Noblesville.
In 2011, the median age of the population in the County was 35.9 years of age. Similar to the rest of Indiana, the largest demographic age groups in the County are young adults (25-44 years) with a population of 83,519, and older adults (45-64
years) with a population of 73,522. School aged children (5-17 years) are the
Figure 2-1 Hamilton County Location

Hamilton County MHMP Update November 2013
10
third largest age group with a population of 62,644 individuals living in Hamilton County. The approximate median household income in 2010 was reported to be $82,054 while the poverty rate in the same year was reported at 4.9% county-wide and 6.3% among children under 18. In total, 34% of households are married with children, and 29.2% of households are married without children.
Nearly 96.1% of the adults older than 25 within Hamilton County have reportedly completed a High School education. Further, 53.8% of those same adults have also completed a Bachelor of Arts or higher degree.
2.2 EMPLOYMENT
US Census data indicates that of the Hamilton County work force, 36.1% are employed in unspecified private employment positions. Retail Trade and Health Care/Social Services account for 10% and 9.8% respectively. The total resident labor force according to estimates in 2011 is 141,952 with 8,901 unemployed and a rank in the State of 6th of 92 counties. Table 2-1 lists the major employers and approximate number of employees within Hamilton County as reported by The Hamilton County Alliance.
Table 2-1 List of Major Employers and Number of Employees Sallie Mae (2,500) Firestone (825) CNO Financial Group LLC (1,750) SMC Corporation (800) Liberty Mutual (1,200) Midwest ISO (700) The Capital Group (1,000) Roche Diagnostics (600) RCI (900) Indiana Mills & Mfg, Inc (500)
(Hamilton County Alliance, 2012)
2.3 TRANSPORTATION AND COMMUTING PATTERNS
There are several major transportation routes passing through Hamilton County and the municipalities within. Interstates 69 and 465, Highway 31, and State Roads 13, 19, 32, 38, 47, 213, 238, and 431 serve as main routes between the various municipalities. These transportation routes are identified in Figure 2-2.

Hamilton County MHMP Update November 2013
11
Figure 2-2 Hamilton County Transportation Routes
According to the Indiana Business Research Center, more than 40,000 individuals commute into Hamilton County on a daily basis. Approximately 62% of these commuters travel from Marion County. Further, approximately 49,900 Hamilton County residents commute to other counties with the majority traveling to Marion County (86%).
Figure 2-3 indicates the number of workers 16 and older who do not live within Hamilton County but commute into Hamilton County for employment purposes. Similarly, Figure 2-4 indicates the number of Hamilton County residents 16 and older that commute out of the County for employment.

Hamilton County MHMP Update November 2013
12
Figure 2-3 Workers Commuting into Hamilton County
Figure 2-4 Workers Commuting out of Hamilton County

Hamilton County MHMP Update November 2013
13
REQUIREMENT §201.6(c)(2)(ii)(A): The plan should describe vulnerability in terms of the types and numbers of existing and future buildings, infrastructure, and critical facilities located in the identified hazard areas….
2.4 CRITICAL AND NON-CRITICAL INFRASTRUCTURE
Critical infrastructure are the assets, systems, and networks, whether physical or virtual, so vital to the local governments and the United States that their incapacitation or destruction would have a debilitating effect on security, economic security, public health or safety, or any combination thereof.
These structures are vital to the community’s ability to provide essential services and protect life and property, are critical to the community’s response and recovery activities, and/or are the facilities the loss of which would have a severe economic or catastrophic impact. The operation of these facilities becomes especially important following a hazard event. Homeland Security Presidential Directive 7 (HSPD-7) identified 17 critical infrastructure sectors; the Department of Homeland Security later identified Critical Manufacturing as the 18th sector.
The EMA provided the sector and locations for the following 585 critical infrastructure identified for the Hamilton County MHMP Update:
• 4 Agriculture and Food – This sector has the ability to feed and clothe people, not only locally, but globally as well.
• 51 Banking and Finance –includes financial firms such as insurers, banks, credit unions, investment companies, and securities brokers and dealers.
• 0 Chemical – comprised of facilities in 5 main segments (based on the end product produced): basic chemicals, specialty chemicals, agricultural chemicals, pharmaceuticals, and consumer products. These are included within the Critical Manufacturing Sector
• 113 Commercial –Operate on the principle of open public access; that the general public can move freely throughout these facilities without the deterrent of highly visible security barriers. There are 8 subsectors: Public Assembly, Sports Leagues, Gaming, Lodging, Outdoor Events, Entertainment and Media, Real Estate, and Retail.
• 12 Communications– This sector has evolved from predominantly a provider of voice services into a diverse, competitive, and interconnected industry using terrestrial, satellite, and wireless transmission systems.
• 14 Critical Manufacturing –The following manufacturing industries are included within this sector: Iron and Steel Mills;

Hamilton County MHMP Update November 2013
14
Alumina and Aluminum Production and Processing; Nonferrous Metal Production and Processing; Engine, Turbine, and Power Transmission Equipment; Electrical Equipment; Motor Vehicle; Aerospace Product and Parts; Railroad Rolling Stock; and Other Transportation Equipment.
• 0 Dams – A vital and beneficial part of the nation’s infrastructure providing a wide range of economic, environmental, and social benefits, including hydroelectric power, river navigation, water supply, wildlife habitat, waste management, flood control, and recreation. Dams mentioned later in the plan have been identified by the Indiana DNR.
• 0 Defense Industrial Bases – Companies and subcontractors who perform under contracts to the Department of Defense (DoD), and companies providing incidental materials and services to the DoD, as well as government-owned and/or operated facilities are within this category.
• 24 Emergency Services – Comprised of federal, state, local, tribal, and private partners, this sector is representative of several first-responder disciplines: emergency management, emergency medical services, fire, hazardous material, law enforcement, bomb squads, tactical operations/special weapons assault teams, and search and rescue.
• 14 Energy – This sector is divided into three interrelated segments: electricity, petroleum, and natural gas.
• 132 Government – These may or may not be open to the public and include general-use office buildings and special-use military installations, embassies, courthouses, national laboratories, and structures that may house critical equipment and systems, networks, and functions. This sector also includes educational facilities.
• 125 Healthcare and Public Health - This sector plays a significant role in response and recovery across all other sectors in the event of a natural or manmade disaster.
• 0 Information Technology – Virtual and distributed functions of this sector produce and provide hardware, software, and IT systems and services, and the Internet.
• 0 National Monuments and Icons – All share 3 common characteristics: they are a monument, physical structure, object, or geographic site; they are widely recognized to represent the nation’s heritage, traditions, values, or have important cultural, religious, historical, or political importance; and their primary purpose is to memorialize or represent a significant national aspect.
• 0 Nuclear Reactors, Materials, and Waste – This sector includes reactors, power plants, research facilities, testing and training facilities, and the transportation, storage, and disposal of nuclear material or waste.
Hamilton County MHMP Update November 2013
15
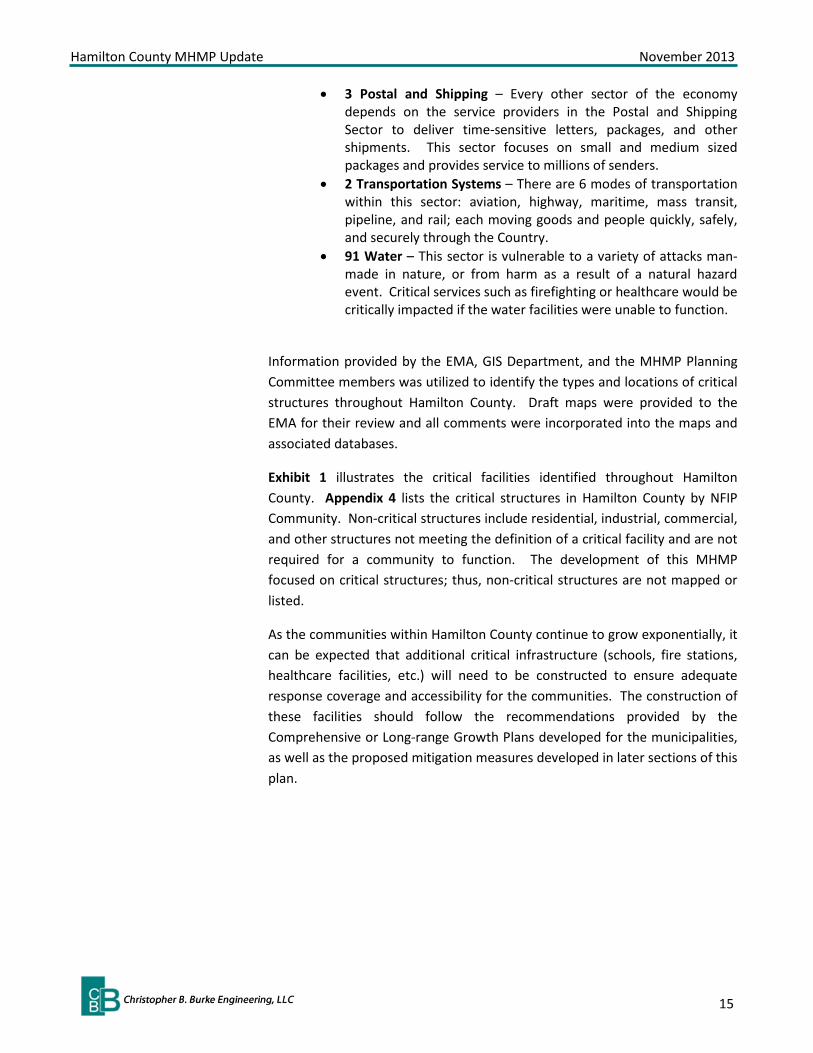
• 3 Postal and Shipping – Every other sector of the economy depends on the service providers in the Postal and Shipping Sector to deliver time-sensitive letters, packages, and other shipments. This sector focuses on small and medium sized packages and provides service to millions of senders.
• 2 Transportation Systems – There are 6 modes of transportation within this sector: aviation, highway, maritime, mass transit, pipeline, and rail; each moving goods and people quickly, safely, and securely through the Country.
• 91 Water – This sector is vulnerable to a variety of attacks man-made in nature, or from harm as a result of a natural hazard event. Critical services such as firefighting or healthcare would be critically impacted if the water facilities were unable to function.
Information provided by the EMA, GIS Department, and the MHMP Planning Committee members was utilized to identify the types and locations of critical structures throughout Hamilton County. Draft maps were provided to the EMA for their review and all comments were incorporated into the maps and associated databases.
Exhibit 1 illustrates the critical facilities identified throughout Hamilton County. Appendix 4 lists the critical structures in Hamilton County by NFIP Community. Non-critical structures include residential, industrial, commercial, and other structures not meeting the definition of a critical facility and are not required for a community to function. The development of this MHMP focused on critical structures; thus, non-critical structures are not mapped or listed.
As the communities within Hamilton County continue to grow exponentially, it can be expected that additional critical infrastructure (schools, fire stations, healthcare facilities, etc.) will need to be constructed to ensure adequate response coverage and accessibility for the communities. The construction of these facilities should follow the recommendations provided by the Comprehensive or Long-range Growth Plans developed for the municipalities, as well as the proposed mitigation measures developed in later sections of this plan.

Hamilton County MHMP Update November 2013
16
2.5 MAJOR WATERWAYS AND WATERSHEDS
According to the United States Geological Survey (USGS) there are 77 waterways in Hamilton County; they are listed in Appendix 5. The County’s main waterway is the White River and several major tributaries as they drain from the northern parts of Hamilton County to the southern regions. Geist and Morse Reservoirs also serve the county in terms of drinking water resources and recreational opportunities. Hamilton County lies completely within 1 8-digit Hydrologic Unit Code (HUC): the Upper White River (05120201). These major waterways are identified on Figure 2-5.
2.6 NFIP PARTICIPATION
The NFIP is a FEMA program that enables property owners in participating communities to purchase insurance protection against losses from flooding. Hamilton County, the Town of Arcadia, the City of Carmel, the Town of Cicero, the Town of Fishers, the City of Noblesville, the Town of Sheridan, and the Town of Westfield are participants in the NFIP. The smaller communities within Hamilton County may also be provided coverage by the MHMP through the County’s program.
Since the development of the 2006 Hamilton County MHMP, Hamilton County, the Town of Arcadia, the City of Carmel, the Town of Cicero, the Town of Fishers, the City of Noblesville, the Town of Sheridan, and the Town of Westfield continue to participate in the NFIP. These NFIP communities have also adopted Flood Hazard Ordinances containing language regarding compensatory floodplain storage.
At the time of preparing this MHMP, the only NFIP entities in Hamilton County to participate in the CRS program are the County (Class 7) and the City of
Figure 2-5 Major Waterways of Hamilton County

Hamilton County MHMP Update November 2013
17
Noblesville (Class 8). The CRS program is a voluntary incentive program that recognizes and encourages community floodplain activities that exceed the minimum NFIP requirements. As a result, flood insurance premiums are discounted to reflect the reduced flood risk resulting from community actions that meet the 3 goals of the CRS: (1) reduce flood losses; (2) facilitate accurate insurance rating; and (3) promote education and awareness of flood insurance. For CRS participating communities, flood insurance premium rates are discounted in increments of 5% for each class level achieved. Table 2-2 lists the NFIP number, effective map date, and the date each community joined the program.
Table 2-2 NFIP Participation NFIP COMMUNITY NFIP NUMBER EFFECTIVE MAP
DATE JOIN DATE
Hamilton County 180080 2-19-2003 12-16-1988 Town of Atlanta Town of Arcadia 180496 2-19-2003 12-9-1988 City of Carmel 180081 2-19-2003 5-19-1981 Town of Cicero 180320 2-19-2003 1-2-1980 Town of Fishers 180423 2-19-2003 6-30-1976 City of Noblesville 180082 2-19-2003 3-2-1981 Town of Sheridan 180516 2-19-2003 6-1-2004 Town of Westfield 180083 2-19-2003 3-16-1981
(FEMA, 2012)
2.7 TOPOGRAPHY
The highest elevation in Hamilton County, according to the Soil Survey completed by the USDA-Natural Resources Conservation Service (NRCS), is 964 feet above sea level and is located northwest of Sheridan in the northwestern corner of the county. Conversely, the lowest elevation is near where the White River flows out of Hamilton County and into Marion County and is approximately 700 feet above sea level.
Many creeks, streams, and waterways travel through the relatively flat plain make-up of Hamilton County. A few abrupt changes can be noted in the elevation throughout the county while along the White River, these abrupt changes are quite common.
2.8 CLIMATE
The Midwestern Regional Climate Center (MRCC) provided climate data that includes information retrieved from a weather station located in Noblesville, identified as station 126338. The average annual precipitation is 37.11 inches per year, with the wettest month being July averaging 4.36 inches of

Hamilton County MHMP Update November 2013
18
precipitation and the driest months being January and February with an average of 1.93 inches of precipitation. The highest 1-day maximum precipitation was recorded in September of 1926 with 5.0 inches of rain. On average, there are 75.6 days of precipitation greater than or equal to 0.1 inches, 26.1 days with greater than or equal to 0.5 inches, and 7.9 days with greater than or equal to 1.0 inch of precipitation. Mean snowfall is 27.1 inches per year. The highest monthly amount of snowfall recorded at this station is 28.5 inches for January of 1982.

Hamilton County MHMP Update November 2013
19
CHAPTER 3 RISK ASSESSMENT
A risk assessment measures the potential loss from a hazard incident by assessing the vulnerability of buildings, infrastructure, and people in a community. It identifies the characteristics and potential consequences of hazards, how much of the community will be affected by a hazard, and the impact on community assets. The risk assessment conducted for Hamilton County and the NFIP communities is based on the methodology described in the Local Multi-Hazard Mitigation Planning Guidance published by FEMA in 2008 and is incorporated into the following sections:
Section 3.1: Hazard Identification lists the natural, technological, and political hazards selected by the Planning Committee as having the greatest direct and indirect impact to the County as well as the system used to rank and prioritize the hazards.
Section 3.2: Hazard Profile for each hazard, discusses 1)historic data relevant to the County where applicable; 2) vulnerability in terms of number and types of structures, repetitive loss properties (flood only), estimation of potential losses, and impact based on an analysis of development trends; and 3) the relationship to other hazards identified by the Planning Committee.
Section 3.3: Hazard Summary provides an overview of the risk assessment process; a comparative hazard ranking with other methodologies used by the Hamilton County EMA; a table summarizing the relationship of the hazards; and a composite map to illustrate areas impacted by the hazards.
3.1 HAZARD IDENTIFICATION
3.1.1 Hazard Selection
The MHMP Planning Committee reviewed the list of natural, technological, and political hazards from the 2006 Hamilton County MHMP, and discussed recent and the potential for future hazard events. The Committee identified those hazards that affected Hamilton County and NFIP communities and
REQUIREMENT §201.6(c)(2): [The risk assessment shall provide the] factual basis for activities proposed in the strategy to reduce losses from identified hazards. Local risk assessment must provide sufficient information to enable the jurisdiction to identify and prioritize appropriate mitigation actions to reduce losses from identified hazards.

Hamilton County MHMP Update November 2013
20
selected the hazards to study in detail as part of this planning effort. As shown in Table 3-1 these include: dam & levee failure, drought, earthquake, flooding, hailstorm, hazardous materials, severe winter storm/ice, large special events, thunderstorm, tornado, and windstorm.
All hazards studied within the 2006 Hamilton County MHMP are included in the update. Other hazards like those identified on the draft Hazard Identification and Risk Assessment (HIRA) tool being developed by IDHS, were discussed but the Committee agreed that either these hazards are addressed in other documents or have little local impact and were therefore not studied in detail as a part of this planning effort.
Table 3-1: Hazard Identification
TYPE OF HAZARD LIST OF HAZARDS
DETAILED STUDY 2006
MHMP MHMP
UPDATE
Natural
Drought No Yes Earthquake Yes Yes Flood Yes Yes Hailstorm No Yes Thunderstorm Yes Yes Snow Storm (and Ice) Yes Yes Tornado Yes Yes Windstorm Yes Yes
Technological Dam & Levee Failure Yes Yes Hazardous Material Incident Yes Yes
3.2 HAZARD RANKING
The Planning Committee ranked the selected hazards in terms of importance and potential for disruption to the community using a modified version of the Calculated Priority Risk Index (CPRI). The CPRI, adapted from MitigationPlan.com, is a tool by which individual hazards are evaluated and ranked according to an indexing system. The CPRI value (as modified by CBBEL) can be obtained by assigning varying degrees of risk probability, magnitude/severity, warning time, and the duration of the incident for each event, and then calculating an index value based on a weighted scheme. For ease of communication, simple graphical scales are used.

Hamilton County MHMP Update November 2013
21
3.2.1 Probability
Probability is defined as the likelihood of the hazard occurring over a given period. The probability can be specified in one of the following categories:
• Unlikely-incident is possible, but not probable, within the next 10 years (1)
• Possible-incident is probable within the next 5 years (2) • Likely-incident is probable within the next 3 years (3) • Highly Likely-incident is probable within the next calendar year (4)
3.2.2 Magnitude/Severity
Magnitude/Severity is defined by the extent of the injuries, shutdown of critical infrastructure, the extent of property damage sustained, and the duration of the incident response. The magnitude can be specified in one of the following categories:
• Negligible-few injuries OR critical infrastructure shutdown for 24 hours or less OR less than 10% property damaged OR average response duration of less than 6 hours (1)
• Limited-few injuries OR critical infrastructure shut down for more than 1 week OR more than 10% property damaged OR average response duration of less than 1 day (2)
• Critical-multiple injuries OR critical infrastructure shut down of at least 2 weeks OR more than 25% property damaged OR average response duration of less than 1 week (3)
• Significant-multiple deaths OR critical infrastructure shut down for 1 month or more OR more than 50% property damaged OR average response duration of less than 1 month (4)
3.2.3 Warning Time
Warning Time is defined as the length of time before the event occurs and can be specified in one of the following categories:
• More than 24 hours (1) • 12-24 hours (2) • 6-12 hours (3) • Less than 6 hours (4)

Hamilton County MHMP Update November 2013
22
3.2.4 Duration
Duration is defined as the length of time that the actual event occurs. This does not include response or recovery efforts. The duration of the event can be specified in one of the following categories:
• Less than 6 hours (1) • Less than 1 day (2) • Less than 1 week (3) • Greater than 1 week (4)
3.2.5 Calculating the CPRI
The following calculation illustrates how the index values are weighted and the CPRI value is calculated. CPRI = Probability x 0.45 + Magnitude/Severity x 0.30 + Warning Time x 0.15 + Duration x 0.10. For the purposes of this planning effort, the calculated risk is defined as:
• Low if the CPRI value is between 1 and 2 • Elevated if the CPRI value is between 2 and 3 • Severe if the CPRI value is between 3 and 4
The CPRI value provides a means to assess the impact of one hazard relative to other hazards within the community. A CPRI value for each hazard was determined for each NFIP community in Hamilton County, and then a weighted CPRI value was computed based on the population size of each community. Table 3-2 presents each community, population, and the weight applied to individual CPRI values to arrive at a combined value for the entire County. Weight was calculated based on the average percentage of each community’s population in relation to the total population of the County. Thus, the results reflect the relative population influence of each community on the overall priority rank. Table 3-2 includes a profile of each of the individual hazards as well as a CPRI value for individual communities.

Hamilton County MHMP Update November 2013
23
Table 3-2 Determination of Weighted Value for NFIP Communities NFIP COMMUNITY POPULATION % OF TOTAL
POLUATION WEIGHTED
VALUE Hamilton County (w/o other NFIP) 34,155 11.8% 0.12 Town of Arcadia 1,714 0.6% 0.01 Town of Atlanta 748 0.3% 0.00 City of Carmel 81,564 28.8% 0.28 Town of Cicero 4,957 1.8% 0.02 Town of Fishers 79,127 27.9% 0.27 City of Noblesville 53,515 18.9% 0.18 Town of Sheridan 2,744 1.0% 0.01 Town of Westfield 30,971 10.9% 0.11 TOTAL 289,495 ~100.0% ~1.00
3.3 HAZARD PROFILES
The hazards studied for this report are not equally threatening to all communities throughout Hamilton County. While it would be difficult to predict the probability of an earthquake or thunderstorm affected a specific community, it is much easier to predict where the most damage would occur in a known hazard area such as a floodplain or near a facility utilizing an Extremely Hazardous Substance (EHS). The magnitude and severity of the same hazard may cause varying levels of damages in different communities.
This section describes each of the hazards that were identified by the Planning Committee for detailed study as a part of this MHMP Update. The discussion is divided into the following subsections:
• Hazard Overview provides a general overview of the causes, effects, and characteristics that the hazard represents.
• Historic Data presents the research gathered from local and national courses on the hazard extent and lists historic occurrences and probability of future incident occurrence.
• Assessing Vulnerability describes, in general terms, the current exposure, or risk, to the community regarding potential losses to critical infrastructure and the implications to future land use decisions and anticipated development trends.
• Relationship to Other Hazards explores the influence one hazard may have on another hazard.

Hamilton County MHMP Update November 2013
24
Figure 3-1 Drought Affected Soil
NATURAL HAZARDS
3.3.1 Drought
Drought: Overview
Drought, in general, means a moisture deficit extensive enough to have social, environmental, or economic effects. Drought is not a rare and random climate incident; rather, it is a normal, naturally recurring feature of climate. Drought may occur in virtually all climactic zones, but its characteristics vary significantly from one region to another. Drought is a temporary aberration and is different from aridity, which is restricted to low rainfall regions.
There are 4 academic approaches to examining droughts; these are meteorological, hydrological, agricultural, and socio-economic. Meteorological drought is based on the degree, or measure, of dryness compared to a normal, or average amount of dryness, and the duration of the
dry period. Hydrological drought is associated with the effects of periods of precipitation (including snowfall) shortfalls on surface or subsurface water supply. Agricultural drought is related to agricultural impacts; focusing on precipitation shortages, differences between actual and potential evapo-transpiration, soil water deficits, reduced ground water or reservoir levels, and crop yields. Socioeconomic drought relates the lack of moisture to community functions in the full range of societal functions, including power generation, the local economy, and food sources. Figure 3-1 shows soil affected by drought conditions.
Drought: Recent Occurrences
Data gathered from the U.S. Drought Monitor indicated that between March 1, 2006 and October 2013, there were 314 total drought related impacts to Hamilton County, 111 of which were considered statewide or regional impacts. In total, there were 183 Agricultural; 44 Business & Industry; 1 Energy; 58 Fire; 87 Plants & Wildlife; 87 Relief, Response & Restrictions; 42 Society & Public Health; 13 Tourism & Recreation; and 59 Water Supply and Quality Impacts.

Hamilton County MHMP Update November 2013
25
In August 2012, 100% of Indiana was experiencing drought conditions ranging from “D0-Abnormally Dry” to “D4-Exceptional Drought”. Figure 3-2 identifies those areas and categories of drought throughout Indiana for August 7, 2012. Hamilton County is located in the “D3-Extreme” which includes the potential impacts of major crop and pasture losses and widespread water shortages and restrictions. The August 21, 2012 report indicated that all of Hamilton County had been classified as D2-Severe, continuing through the
September 11, 2012 report when the County, and much of the state, was downgraded to a D1-Moderate drought level. It wasn’t until March 2013 that much of the state was out of drought condition status.
Approximately 95% of Indiana experienced similar drought conditions in November 2010 according to the US Drought Monitor. The southern region of Hamilton County was considered within the” D2-Severe” indicates the potential for crop or pasture losses, water shortages common, and water restrictions begin to be imposed. The remainder of Hamilton County was classified within the “D1-Moderate” zone where some damage to crops and pasture is expected; streams, reservoirs, or well levels are low; water shortages are developing; and voluntary water-use restrictions are requested. During this time, a burn ban was issued within the unincorporated areas of the county.
The USGS river gage equipped with the National Weather Service (NWS) Advanced Hydrologic Prediction Service (AHPS) capabilities (observed stage information only) and indicating low water records is located at Cicero Creek at Morse Reservoir. Since 1966 this gage has recorded 20 record low water incidents. On November 19, 1999, the overall lowest level of 800.26 feet was recorded. On October 12, 2004, the 2nd lowest level was recorded at 800.63 feet. Water stops flowing over the spillway at 810 feet and navigational hazards are realized when water levels within the reservoir reach a level of 807 feet restricting boating areas and recreational activities.
Figure 3-2 Indiana Drought Conditions
Hamilton County MHMP Update November 2013
26
No property or crop losses have been documented in Hamilton County specific to the 5 events listed by the National Climate Data Center (NCDC) between January 1996 and April 2013. Four of these events are related to the summer 2012 drought mentioned previously. One NCDC narrative report from August 2012 indicated that “Nearly all pasture land was barren in July. Late season crops, such as corn and soybeans, may see their worst yields since the Great Drought of 1988”.
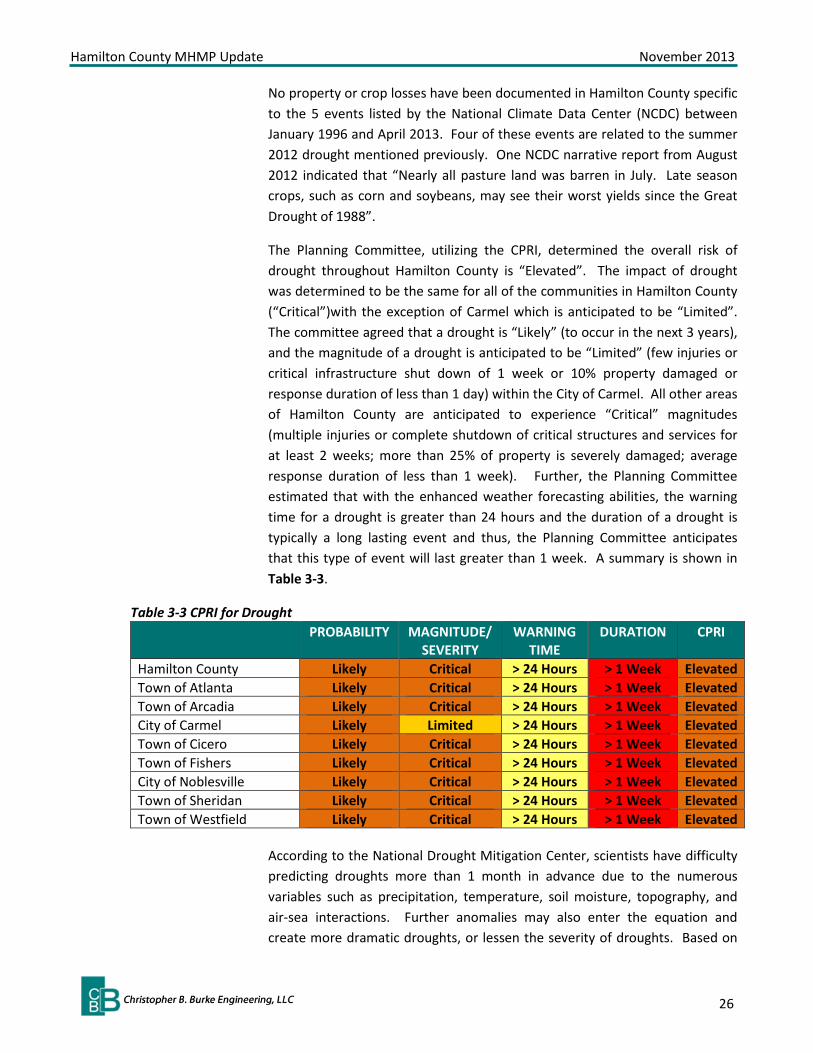
The Planning Committee, utilizing the CPRI, determined the overall risk of drought throughout Hamilton County is “Elevated”. The impact of drought was determined to be the same for all of the communities in Hamilton County (“Critical”)with the exception of Carmel which is anticipated to be “Limited”. The committee agreed that a drought is “Likely” (to occur in the next 3 years), and the magnitude of a drought is anticipated to be “Limited” (few injuries or critical infrastructure shut down of 1 week or 10% property damaged or response duration of less than 1 day) within the City of Carmel. All other areas of Hamilton County are anticipated to experience “Critical” magnitudes (multiple injuries or complete shutdown of critical structures and services for at least 2 weeks; more than 25% of property is severely damaged; average response duration of less than 1 week). Further, the Planning Committee estimated that with the enhanced weather forecasting abilities, the warning time for a drought is greater than 24 hours and the duration of a drought is typically a long lasting event and thus, the Planning Committee anticipates that this type of event will last greater than 1 week. A summary is shown in Table 3-3.
Table 3-3 CPRI for Drought PROBABILITY MAGNITUDE/
SEVERITY WARNING
TIME DURATION CPRI
Hamilton County Likely Critical > 24 Hours > 1 Week Elevated Town of Atlanta Likely Critical > 24 Hours > 1 Week Elevated Town of Arcadia Likely Critical > 24 Hours > 1 Week Elevated City of Carmel Likely Limited > 24 Hours > 1 Week Elevated Town of Cicero Likely Critical > 24 Hours > 1 Week Elevated Town of Fishers Likely Critical > 24 Hours > 1 Week Elevated City of Noblesville Likely Critical > 24 Hours > 1 Week Elevated Town of Sheridan Likely Critical > 24 Hours > 1 Week Elevated Town of Westfield Likely Critical > 24 Hours > 1 Week Elevated
According to the National Drought Mitigation Center, scientists have difficulty predicting droughts more than 1 month in advance due to the numerous variables such as precipitation, temperature, soil moisture, topography, and air-sea interactions. Further anomalies may also enter the equation and create more dramatic droughts, or lessen the severity of droughts. Based on

Hamilton County MHMP Update November 2013
27
the previous occurrences of droughts and drought related impacts felt within Hamilton County, the Planning Committee estimated that the probability of a drought occurring in the area is “Likely”; or occurrence is probable within the next 3 years.
Drought: Assessing Vulnerability This type of hazard will generally affect entire counties and even multi-county regions at one time. Within Hamilton County, direct and indirect effects from a long period of drought may include:
Direct Effects: • Urban and developed areas such as Carmel, Cicero, Fishers,
Noblesville, and Westfield may experience revenue losses from landscaping companies, golf courses, restrictions on industry cooling and processing demands, businesses dependent on crop yields; and increased potential for fires.
• Smaller towns such as Atlanta, Arcadia, and Sheridan may experience similar effects but perhaps on a smaller scale.
• Rural areas within the County such as Adams, Jackson, Wayne, and White River Townships may experience revenue losses from reductions in livestock and crop yields as well as increased field fires.
• Citizens served by drinking water wells may be impacted during low water periods and may require drilling of deeper wells or loss of water service for a period of time.
Indirect Effects: • Loss of income of employees from businesses and industry
affected; loss of revenue to support services (food service, suppliers, etc.)
• Loss of revenue from recreational or tourism sectors associated with reservoirs, streams, and other open water venues.
• Lower yields from domestic gardens increasing the demand on purchasing produce and increased domestic water usage for landscaping
• Increased demand on emergency responders and firefighting resources
• Special events such as fireworks displays, reservoir related events, and outdoor events may be cancelled due to increased potential for fires or increased dry conditions.

Hamilton County MHMP Update November 2013
28
Estimating Potential Losses It is difficult to estimate the potential losses associated with a drought for Hamilton County because of the nature and complexity of this hazard and the limited data on past occurrences. However, for the purpose of this MHMP Update, a scenario was used to estimate the potential crop loss and associated revenue lost due to a drought similar to that experienced during the 1988 drought. Using the range of crop yield decreases reported in 1988 and 1989, just after the 1988 drought period (50%-86%) and assuming a typical year, economic losses could range between $45.7M-$78.5M; depending on the crop produced and the market demand.
Purdue Agriculture News reports that as of March 2013, Indiana producers received more than $1.0B in crop insurance payments for 2012 corn, soybean, and wheat losses. This amount is nearly double that of the previous record, $522M following 2008 losses, also due to drought. Effects of drought on corn crops can be seen in Figure 3-3.
According to a July 5, 2012 article in The Times, “The effects of drought also could touch agricultural businesses, such as handlers and processors, equipment dealers, and see, fertilizer and pesticide providers”. Further, “…consumers are likely to see an increase in food prices of 2.5 percent to 3.5 percent into 2013”.
Additional losses associate with a prolonged drought are more difficult to quantify. Drought has lasting impacts on urban trees: death to all or portions of a tree, reduction in the tree’s ability to withstand insects and diseases, and interruption of normal growth patterns. Such effects on trees, especially urban trees can lead to additional impacts, both environmentally and monetarily in terms of the spread of Emerald Ash Borer insect and the weakening of tree limbs and trunks which may lead to increased damages during other hazard events such as wind and ice storms.
Figure 3-3 Crops Affected by Drought

Hamilton County MHMP Update November 2013
29
Future Considerations
Advancements in plant hybrids and development have eased the impacts from short-lived droughts. Seeds and plants may be more tolerant of dryer seasons and therefore fewer crop losses may be experienced.
As the more urban areas of the county continue to grow and expand, protocols may need to be developed which create a consistency throughout the communities and the unincorporated portions of the county for burn bans and water usage advisories.
Drought: Relationship to Other Hazards
A drought will not be caused by any other hazard studied during this planning effort. However, it is anticipated that areas of the county may be more susceptible to fires during a drought and this may increase the dependency on several response agencies.

Hamilton County MHMP Update November 2013
30
3.3.2 Earthquake
Earthquake: Overview
An earthquake is a sudden, rapid shaking of the earth caused by the breaking and shifting of rock beneath the earth’s surface. For hundreds of millions of years, the forces of plate tectonics have shaped the earth as the huge plates that form the earth’s surface move slowly over, under, and past each other. Sometimes the movement is gradual. At other times, the plates are locked together, unable to release the accumulating energy. When the accumulated energy grows strong enough, the plates break free, causing the ground to shake. Most earthquakes occur at the boundaries where the plates meet; however, some earthquakes occur in the middle of the plates.
Ground shaking from earthquakes can collapse buildings and bridges; disrupt gas, electric, and phone service; and sometimes trigger landslides, avalanches, flash floods, fires, and huge destructive ocean waves (tsunamis). Buildings with foundations resting on unconsolidated landfill and other unstable soil, and trailers and homes not tied to their foundations are at risk because they can move off their mountings during an earthquake. When an earthquake occurs in a populated area, it may cause deaths, injuries, and extensive property damage.
Earthquakes strike suddenly, without warning. Earthquakes can occur at any time of the year and at any time of the day or night. On a yearly basis, 70-75 damaging earthquakes occur throughout the world. Estimates of losses from a future earthquake in the United States approach $200B. Scientists are currently studying the New Madrid fault area and have predicted that the chances of an earthquake in the M8.0 range occurring within the next 50 years
are approximately 7%-10%. However, the chances of an earthquake at a M6.0 or greater, are at 90% within the next 50 years.
There are 45 states and territories in the United States at moderate to very high risk from earthquakes, and they are located in every region of the country (Figure 3-4). California experiences the most frequent damaging earthquakes; however, Alaska experiences the
Figure 3-4 Earthquake Hazard Areas in the US

Hamilton County MHMP Update November 2013
31
greatest number of large earthquakes-most located in uninhabited areas. The largest earthquakes felt in the United States were along the New Madrid Fault in Missouri, where a three-month long series of quakes from 1811 to 1812 occurred over the entire Eastern United States, with Missouri, Tennessee, Kentucky, Indiana, Illinois, Ohio, Alabama, Arkansas, and Mississippi experiencing the strongest ground shaking.
Earthquake: Recent Occurrences
Indiana, as well as several other Midwestern states, lies in the most seismically active region east of the Rocky Mountains. Hamilton County is located in close proximity to the Sharpsville Fault, which runs through southeastern Howard County and northern Tipton County.
On April 18, 2008, an M5.2 quake, reported by the Central United States Earthquake Consortium, struck southeast Illinois in Wabash County and included reports of strong shaking in southwestern Indiana, Kansas, Georgia, and the upper peninsula of Michigan. With over 25,000 reports of feeling the earthquake, there were no reports of injuries or fatalities caused by the event.
On December 30, 2010, central Indiana experienced an earthquake with a magnitude of 3.8; rare for this area in Indiana as it is only the 3rd earthquake of notable size to occur north of Indianapolis. Even rarer is the fact that scientists believe that the quake was centered in Greentown, Indiana approximately 13 miles southeast of Kokomo, Indiana. According to The Times, no reports of injury or damages were provided although “Effects were felt differently throughout the county with some reporting computers sliding across desks and buildings shaking to others saying they had no idea anything took place”.
Most recently, an M5.8 centered in Mineral, Virginia affected much of the East Coast on August 23, 2011. According to USA Today, 10 nuclear power plants were shutdown of precautionary inspections following the quake, over 400 flights were delayed, and the Washington Monument was closed indefinitely pending detailed inspections by engineers.
Figure 3-5 Earthquake Damaged Porch

Hamilton County MHMP Update November 2013
32
Based on historical earthquake data, local knowledge of previous earthquakes, and the results of the HAZUS-MH scenario conducted as a part of this planning effort, the Planning Committee determined that the probability of an earthquake occurring in Hamilton County or any of the communities is “Unlikely”. Should an earthquake occur, the impacts associated with this hazard are anticipated to range from “Critical” within all incorporated areas to “Negligible” within the unincorporated areas of the County. Variations within this estimation are due to the number of critical structures, population and population density, as well as major transportation routes within each of the areas.
As will all earthquakes, it was determined that the residents of Hamilton County would have little to no warning time (less than 6 hours) and that the duration of the event would be expected to be less than 6 hours. A summary is shown in Table 3-4.
Table 3-4 CPRI for Earthquake PROBABILITY MAGNITUDE/
SEVERITY WARNING
TIME DURATION CPRI
Hamilton County Unlikely Negligible < 6 Hours < 1 Week Low Town of Atlanta Unlikely Critical < 6 Hours < 1 Week Elevated Town of Arcadia Unlikely Critical < 6 Hours < 1 Week Elevated City of Carmel Unlikely Critical < 6 Hours < 1 Week Elevated Town of Cicero Unlikely Critical < 6 Hours < 1 Week Elevated Town of Fishers Unlikely Critical < 6 Hours < 1 Week Elevated City of Noblesville Unlikely Critical < 6 Hours < 1 Week Elevated Town of Sheridan Unlikely Critical < 6 Hours < 1 Week Elevated Town of Westfield Unlikely Critical < 6 Hours < 1 Week Elevated
According to the Ohio Department of Natural Resources Division of Geological Survey, “…it is difficult to predict the maximum-size earthquake that could occur in the state and certainly impossible to predict when such an event would occur. In part, the size of an earthquake is a function of the area of a fault available for rupture. However, because all known earthquake-generating faults in Ohio are concealed beneath several thousand feet of Paleozoic sedimentary rock, it is difficult to directly determine the size of these faults.” Further according to the Indiana Geological Survey, “…no one can say with any certainty when or if an earthquake strong enough to cause significant property damage, injury, or loss of life in Indiana will occur…we do indeed face the possibility of experiencing the potentially devastating effects of a major earthquake at some point in the future”. The Planning Committee felt that an earthquake occurring within or near to Hamilton County is “Unlikely” to occur within the next 10 years.

Hamilton County MHMP Update November 2013
33
Earthquake: Assessing Vulnerability
Earthquakes generally affect broad areas and potentially many counties at one time. Within Hamilton County, direct and indirect effects from an earthquake may include:
Direct Effects:
• Urban areas (Carmel, Fishers, Noblesville) may experience more damages due to the number of structures and critical structures located in these areas
• Rural areas (County) may experience losses associated with agricultural structures such as barns and silos
• Bridges, buried utilities, and other infrastructure may be affected throughout the County and municipalities
Indirect Effects:
• Provide emergency response personnel to assist in the areas with more damage
• Provide shelter for residents of areas with more damage • Delays in delivery of goods or services originating from areas
more affected by the earthquake
Types of loss caused by an earthquake could be physical, economic, or social in nature. Due to the unpredictability and broad impact regions associated with an earthquake, all critical and non-critical infrastructure are at risk of experiencing earthquake related damages. Damages to structures, infrastructure, and even business interruptions can be expected following an earthquake. Examples of varying degrees of damages are shown in Figure 3-5 and Figure 3-6.
Estimating Potential Losses In order to determine the losses associated with an earthquake, the HAZUS-MH software was utilized to determine the impact anticipated from a M5.1 earthquake with an epicenter near Kokomo, Indiana; the location for the December 2010 earthquake. To be conservative in the anticipated damages, the M5.1 (the magnitude of the largest recorded earthquake in
Figure 3-6 Minor Earthquake Damages

Hamilton County MHMP Update November 2013
34
Indiana) was utilized for the HAZUS-MH earthquake model.
According to the HAZUS-MH scenario, total economic loss associated with this earthquake is anticipated to be near $1M. The HAZUS-MH model computes anticipated economic losses for the hypothetical earthquake due to direct building losses and business interruption losses. Direct building losses are the costs to repair or to replace the damage caused to the building and contents, while the interruption losses are associated with the inability to operate a business due to the damage sustained. Business interruption losses also include the temporary living expenses for those people displaced from their homes. Total building related losses are anticipated to be $870K, of which 30% of the estimated business losses are related to business interruption. Much of the damage is anticipated to be experienced within the City of Carmel and Fall Creek Township. These areas, along with estimations of damage for other census tracts within Hamilton County, are indicated on Exhibit 2.
The HAZUS-MH Earthquake Model allows local building data to be imported into the analysis. However, these local data are imported as “general building stock”, meaning that the points are assigned to a census tract rather than a specific XY coordinate. HAZUS performs the damage analysis as a county wide analysis and reports losses by census tract. In addition to importing local building data, the Hamilton County model was further enhanced by adding localized parameters (i.e., shake maps, liquefaction, soils). While the results of the annualized run appear to be plausible, care should be taken when interpreting these results. Based on damages estimated throughout the HAZUS-MH model, it is anticipated that this type of hazard would produce the least amount of monetary damages in Hamilton County.
Future Considerations While the occurrence of an earthquake in or near to Hamilton County may not be the highest priority hazard studied for the development of the Plan, it is possible that residents, business owners, and visitors may be affected should an earthquake occur. For that reason, Hamilton County should continue to provide education and outreach regarding earthquakes and even earthquake insurance along with education and outreach for other hazards. As Hamilton County and the communities within the County continue to grow and develop, the proper considerations for the potential of an earthquake to occur may help to mitigate against social, physical, or economic losses in the future.

Hamilton County MHMP Update November 2013
35
Earthquake: Relationship to Other Hazards
Hazardous materials incidents may occur as a result of damage to material storage containers or transportation vehicles involved in road crashes or train derailments. Further, dam failures and levee failures may occur following an earthquake or associated aftershocks due to the shifting of the soils in these hazard areas. These types of related hazards may have greater impacts on Hamilton County communities than the earthquake itself. It is not expected that earthquakes will be caused by other hazards studied within this plan.

Hamilton County MHMP Update November 2013
36
3.3.3 Flood
Flood: Overview
Floods are the most common and widespread of all natural disasters. Most communities in the United States have experienced some kind of flooding, after spring rains, heavy thunderstorms, or winter snow melts. A flood, as defined by the NFIP, is a general and temporary condition of partial or complete inundation or 2 or more acres of normally dry land area or of 2 or more properties from overflow of inland or tidal waters and unusual and rapid accumulation or runoff of surface waters from any sources, or a mudflow. Floods can be slow or fast rising but generally develop over a period of days.
Flooding and associated flood damages is most likely to occur during the spring because of heavy rains combined with melting snow. However, provided the right saturated conditions, intense rainfall of short duration during summer rainstorms are capable of producing damaging flash flood conditions.
The traditional benchmark for riverine or coastal flooding is a 1% annual chance of flooding, or the 100-year flood. This is a benchmark used by FEMA to establish a standard of flood protection in communities throughout the country. The 1% annual chance flood is referred to as the “regulatory” or “base” flood. Another term commonly used, the “100-year flood”, is often incorrectly used and can be misleading. It does not mean that only 1 flood of that size will occur every 100 years. What it actually means is that there is a 1% chance of a flood of that intensity and elevation happening in any given year. In other words, the regulatory flood elevation has a 1% chance of being equaled, or exceeded, in any given year and it could occur more than once in a relatively short time period.
Flood: Recent Occurrences
Flooding is a common occurrence in Hamilton County. The NCDC reports that between January 2006 and December 31, 2012, there were 19 flood events that resulted in approximately $84.5K in property damages. While no loss estimates were provided for many of the events, reports do indicate that roads were flooded, neighborhoods were affected, and damages occurred in agricultural areas. Appendix 6 provides the NCDC information regarding flood events that have resulted in injuries, deaths, or monetary damages to property and/or crops.

Hamilton County MHMP Update November 2013
37
Central Indiana, including much of Hamilton County, experience damaging floods in April 2013. Heavy rains brought several inches, in some areas 5-10 inches of rain, on top of saturated soils caused several local water courses to crest well above flood stage. Localized flooding and numerous road closures were experienced with this event as well. Unfortunately, 2 deaths are attributed to this event and in both cases, involved motorists attempting to drive over flooded
roads. As a result of these tragedies, Hamilton County has purchased additional warning signs to be placed near frequently flooded travel routes including those associated with the national “Turn Around, Don’t Drown” awareness program.
Flooding in March of 2011 caused several roads to be closed, flooded basements, and potentially the worst flooding experienced in the 4 years prior. Heavy rain and melting snow led to the White River (Figure 3-7) cresting approximately 5 feet over flood stage. According to a report by WTHR Channel 13 a Noblesville resident stated “You can stand here and watch the river rise. It was coming up an inch every few minutes. Faster than I’ve ever seen it”. The Times reported several road closures due to flood waters covering the roadway. These included State Road 19, Allisonville Road, Edith Avenue, Riverwood Drive, and 186th Street. The Claire and Riverwood neighborhoods were also reported to be “inundated with river water”. A separate article in The Times reported “Hamilton County Highway Department Director Brad Davis said so far it appears no major damage has been sustained on roads the county covers. To this point the department’s main task has been to set up high water and road closed signs warning motorists of hazardous road conditions, monitoring those situations and re-opening to traffic when able”.
On April 7 2011, WTHR.com reported flooding in Fishers and Carmel affected several neighborhoods and parks due to continued rain and saturated soils. Carmel’s Northwood Hills suffered damage as debris from floodwaters clogged culverts and caused road undercutting. The Hamilton County EMA estimated they were providing approximately 800 sandbags each day.
Figure 3-7 White River in Noblesville

Hamilton County MHMP Update November 2013
38
June 2011 saw additional flooding in central Indiana, including Hamilton County. The Town of Sheridan “reported 70 to 80 percent of its streets were flooded and unsafe for travel as of 10:45 a.m.” according to a June 20, 2011 article appearing on WishTV.com.
Stream gages are utilized to monitor surface water elevations and/or discharges at key locations and time periods. Some such gages are further equipped with NWS’ Advanced Hydrologic Prediction Service (AHPS) capabilities. These gages have the potential to provide valuable information regarding historical high and low water stages, hydrographs representing current and forecasted stages, and a map of the surrounding areas likely to be flooded. Within Hamilton County, the 6 active USGS stream gages equipped with the AHPS capabilities (identified on Exhibit 3) are at the following locations:
• Cicero Creek at Arcadia • Cicero Creek at Morse Reservoir • Stony Creek near Noblesville • Stony Creek at Fishersburg • White River at 146th Street near Noblesville • White River near Noblesville • William Locke Drain at 186th and Mystic Road
Any property having received 2 insurance claim payments for flood damages totaling at least $1,000, paid by the NFIP within any 10-year period since 1978 is defined as a repetitive loss property. These properties are important to the NFIP because they account for approximately 1/3 of the country’s flood insurance payments. According to the IDNR, Division of Water, there are 41 properties within the Town of Fishers that are considered to be repetitive loss properties. Further, within the other areas of Hamilton County, there are 57 additional repetitive loss properties. The number of repetitive loss properties within each NFIP community is indicated in Table 3-x below. As a part of the City of Noblesville’s mitigation efforts, the City has purchased 66 properties in a repetitive loss area known as Johnstown, or the Old Southside; and would like to acquire an additional 40 properties in the future.
There have been numerous claims made for damages associated with flooding in Hamilton County. Within the unincorporated areas of Hamilton County, there have been 36 claims and more than $300K in payments. In addition, there have been 161 claims within the City of Noblesville resulting in approximately $1.35M in payments. Table 3-5 identifies the number of claims per NFIP community as well as payments made.

Hamilton County MHMP Update November 2013
39
Table 3-5 Repetitive Loss Claims and Payments NFIP COMMUNITY # OF REPETITIVE
LOSS PROPERTIES CLAIMS SINCE
1978 $$ PAID
Hamilton County 19 36 $337K Town of Arcadia 0 2 $31K Town of Atlanta City of Carmel 24 84 $416K Town of Cicero 2 3 $100K Town of Fishers 41 20 $214K City of Noblesville 12 161 $1.4M Town of Sheridan 0 1 $19K City of Westfield 0 6 $7K TOTAL 98 313 $2.5M
(IDNR, 2012)
Currently in Hamilton County, the flood insurance coverage required for structures located in the 1% annual chance floodplain and the unnumbered Zone A is approximately $232M. The Unnumbered Zone A is the area subjected to a 1% annual chance of flooding and is determined in a Flood Insurance Study (FIS) by approximate methods of analysis. Because of the absence of detailed studies, no Base Flood Elevations (BFEs) are shown. BFEs are the elevations to which floodwater is anticipated to rise during the base flood. Within Hamilton County, rivers and tributaries within the incorporated areas have delineated flood plains, while the unincorporated areas are primarily represented as Unnumbered Zone A streams. Exhibit 3 identifies the floodplain boundaries for streams and rivers in Hamilton County. These flood boundaries are considered to be preliminary Flood Insurance Rate Maps (FIRMs) as they haven’t yet been approved by the FEMA.
Mandatory flood insurance purchase requirements apply to structures in 1% annual chance of flooding delineated areas. Total flood insurance premiums for Hamilton County and the NFIP communities is approximately $727K. Of that total, $296K is flood insurance coverage for the City of Carmel, while an additional $192K is coverage for the City of Noblesville. Table 3-6 further indicates the premiums and coverage totals for individual NFIP communities and Hamilton County.

Hamilton County MHMP Update November 2013
40
Table 3-6 Flood Insurance Premiums and Coverage NFIP COMMUNITY FLOOD INSURANCE
PREMIUMS FLOOD INSURANCE
COVERAGE Hamilton County $73K $15M Town of Arcadia $0.7K $0.5M Town of Atlanta City of Carmel $285K $94M Town of Cicero $13K $7M Town of Fishers $54K $28M City of Noblesville $191K $58M Town of Sheridan $4K $2M City of Westfield $68K $24M TOTAL $689K $229M
(IDNR, 2012)
As determine by the Planning Committee, the probability of a flood occurring throughout Hamilton County is “Possible” to “Highly Likely” varying by community, with impacts anticipated to range from “Negligible” in many communities to “Limited” within the unincorporated areas of the county, the City of Carmel, and the City of Noblesville. The Planning Committee also determined that the warning time varied by community based on upstream notification capabilities, and that the duration of such an event is anticipated to last less than 1 day in all areas expect Noblesville. A summary is shown in Table 3-7.
Table 3-7 CPRI for Flood PROBABILITY MAGNITUDE/
SEVERITY WARNING
TIME DURATION CPRI
Hamilton County Highly Likely Limited > 24 hours < 1 day Elevated Town of Arcadia Possible Negligible > 24 hours < 1 day Low Town of Atlanta Possible Negligible > 24 hours < 1 day Low City of Carmel Highly Likely Limited 12-24 hours < 1 day Elevated Town of Cicero Possible Negligible 6-12 hours < 1 day Low Town of Fishers Possible Negligible 12-24 hours < 1 day Low City of Noblesville Highly Likely Limited 12-24 hours < 1 week Elevated Town of Sheridan Possible Negligible 12-24 hours < 1 day Low City of Westfield Possible Negligible 12-24 hours < 1 day Low
As mentioned within this section, there is a 1% chance each year that the regulatory flood elevation will be equaled or exceeded and these types of events may occur more than once throughout each year. Further, based on information provided by the USGS/NWS stream gages, the NCDC, and previous experiences, the Planning Committee determined that flooding is “Possible” to “Highly Likely” throughout the county.

Hamilton County MHMP Update November 2013
41
Flood: Assessing Vulnerability
Flood events may affect large portions of Hamilton County at one time as large river systems and areas with poor drainage cover much of the county and several communities. Within Hamilton County, direct and indirect effects of a flood event may include:
Direct Effects:
• Structural and content damages and/or loss of revenue for properties affected by increased water
• Increased costs associated with additional response personnel, evacuations, and sheltering needs
Indirect Effects:
• Increased response times for emergency personnel if roads are impassable
• Increased costs associated with personnel to carry out evacuations in needed areas
• Increased risk of explosions and other hazards associated with floating propane tanks or other debris
• Losses associated with missed work or school due to closures or recovery activities
• Cancellations of special events in impacted areas or water related activities that become too dangerous due to high water
Estimating Potential Losses
Critical and non-critical structures located in regulated floodplains, poorly drained areas, or low lying areas are most at risk for damages associated with flooding. For this planning effort, a GIS Desktop Analysis methodology was utilized to estimate flood damages.
For the GIS Desktop Analysis method, an analysis was completed utilizing the effective Digital FIRMs (DFIRMs) overlaid upon the Modified Building Inventory provided by Hamilton County and structures located within each flood zone were tallied using GIS analysis techniques.
The Modified Building Inventory was created in ESRI ArcGIS by converting parcels to centroids, and joining Assessor Data to these centroids. Assessor data included square footage for the structure, and any structure that was listed as less than 400 ft2 in area or was classified in the Assessor’s database as a non-habitable structure was assumed to be an outbuilding. Also, buildings with a calculated replacement value of $0.00 or buildings that did not match

Hamilton County MHMP Update November 2013
42
the Assessor Data (parcel numbers did not match) were excluded from the analysis. Replacement values were included in the Assessor’s database, and Content Values were calculated using:
1. Residential = Replacement Value x 0.5 2. Commercial = Replacement Value x 1.0 3. Industrial = Replacement Value x 1.5 4. Agricultural = Replacement Value x 1.0 5. Education = Replacement Value x 1.0 6. Government = Replacement Value x 1.0 7. Religious = Replacement Value x 1.0
The resulting Modified Building Inventory was used in the GIS analyses.
In order to estimate anticipated damages associated with each flood in Hamilton County and NFIP communities, it was estimated that 25% of structures in the flood zones would be destroyed, 35% of structures would be 50% damaged, and 40% of structures would be 25% damaged. Table 3-8 below identifies the estimated losses associated with structures in the floodway, the 100-year floodplain, and the 500-year floodplain by NFIP community within Hamilton County.
Table 3-8 Manual GIS Analysis Utilizing Most Recent Preliminary DFIRM Data and Hamilton County Building Inventory
FLOODWAY 1% 0.2% UNNUMBERED # $ # $ # $ # $ Hamilton County 341 69.4M 428 142.6M 111 34.9M 278 44.6M Town of Arcadia Town of Atlanta City of Carmel 182 39.3M 374 88.6M 668 143.4M 19 3.4M Town of Cicero 12 5.8M Town of Fishers 20 20.6M 209 45.1M 152 28.6M 231 49.0M City of Noblesville 137 42.4M 361 114.0M 10 5.4M 21 3.2M Town of Sheridan City of Westfield 82 25.2M 169 43.6M 20 4.4M 19 3.9M Total 774 $202.7M 1,541 $433.9M 961 $216.7M 568 $104.1M
Structures and Damages within each zone are not inclusive
Utilizing the same GIS information and process, Table 3-9 identifies the number of critical infrastructure within each of the SFHAs in Hamilton County (where these conditions exist). These buildings are included in the overall number of structures and damage estimates information provided in Table 3-8.

Hamilton County MHMP Update November 2013
43
Table 3-9 Critical Infrastructure in SFHA by NFIP Community NFIP
COMMUNITY FLOODWAY 1% 0.2% UNNUMBERED
Hamilton County 1 Transportation System
1 Manufacturing
1 Energy
Carmel 2 Water 1 Banking & Finance 1 Manufacturing
1 Communications 1 Manufacturing 1 Water
Fishers 1 Emergency Services
1 Transportation System 2 Water
Noblesville 2 Government 1 Healthcare
4 Commercial 2 Government 4 Healthcare 4 Water
Westfield 1 Healthcare 3 Water
1 Commercial 1 Communication 1 Government 4 Water
1 Food & Agriculture
2 Water
Total 9 25 5 5
Utilizing the information in Table 3-8 regarding the number of structures within each Flood Hazard Area, it is also important to note the number of flood insurance policies within each NFIP area in Hamilton County. Table 3-10 provides the comparison between the number of structures in the SFHA and the number of flood insurance policies.
Table 3-10 Number of Structures within the SFHA and Number of Flood Insurance Policies
NFIP COMMUNITY # STRUCTURES IN SFHA # POLICIES Hamilton County 1,158 95 Town of Arcadia 0 2 Town of Atlanta 0 0 City of Carmel 1,243 384 Town of Cicero 12 29 Town of Fishers 612 107 City of Noblesville 529 273 Town of Sheridan 0 5 City of Westfield 290 6 Total 3,844 313
(IDNR, 2012)
A second method, utilizing HAZUS-MH was completed to further estimate potential losses from a 1% annual chance flood event. HAZUS-MH model included the 2012 preliminary DFIRMs and flood depth grids that were created

Hamilton County MHMP Update November 2013
44
using the Enhanced Quick Look and the USGS 30 meter National Elevation Dataset (NED). The estimated building damage is representative of the damage only to the structure and does not make any estimates based on contents or land value (as in the Manual GIS method presented in Table 3-8). The total estimated numbers of damaged buildings and monetary damages are given in Table 3-11.
Table 3-11 HAZUS-MH GIS Analysis with the 1% Annual Chance Flood Hazard and the Hamilton County Building Inventory
OCCUPANCY TYPE # BUILDINGS $$ DAMAGE Residential 1,440 $129M Commercial 111 $24M Industrial 22 $5M Agricultural 93 $9M Religious 31 $10M Government 29 $8M Education 11 $14M Total 1,737 $200M
The loss values within these 2 scenarios may seem significantly different, as with the near $637M in estimated damages within the 1% annual chance flood hazard using the desktop GIS analysis and $200M in estimated damages using the HAZUS-MH analysis. However, because of the analysis methods utilized and the variations between the general building stock and the user defined building stock, these anticipated damages are comparable.
Future Considerations
As the municipalities within Hamilton County continue to grow in population, it can be anticipated that the number of critical and non-critical infrastructure will also increase accordingly. Location of these new facilities should be carefully considered and precautions should be encouraged to ensure that school, medical facilities, community centers, municipal buildings, and other critical infrastructure are located outside the 0.2% annual chance (500-year) floodplain and/or are protected to that level along with a flood-free access to reduce the risk of damages caused by flooding and to ensure that these critical structures will be able to continue functioning during major flood events.
The City of Noblesville recognized the need to protect the riverfront as well as the residents and structures within the 2007 Downtown Strategic Development Plan. One of the development strategies, the Riverfront Enhancement Program, includes “public open space, trails, active recreation, wetlands restoration and residential to connect the east and west sides of the

Hamilton County MHMP Update November 2013
45
White River”. This strategy highlights the need to protect the function of the riverfront while also creating “a unique regional destination”.
The City of Westfield and Washington Township developed their Comprehensive Plan in 2007 and included a section regarding open space and recreation. According to the Plan, “Open fields, farms, parks, water bodies, and other open space and recreation areas, whether public or private, are important to the community character of Westfield-Washington Township. Little Eagle creek is an especially valuable natural feature that should be protected as development takes place in the community”. Further, development polices outlined within the Plan include:
• Maintain stream corridors, woodlands, hedge rows, and other valuable natural and historic resources as part of the dedicated open space.
• Preserve natural features such as stands of trees, water bodies, and wetlands when land is developed.
• Use open space as part of an integrated storm water management approach to maintain natural drainage patters, attenuate water quality impacts, replenish groundwater, and incorporate detention facilities as visual and environmental amenities such as ponds.
It is also important to ensure that owners and occupants of residences and businesses within the known hazard areas, such as delineated or approximated flood zones, are well informed about the potential impacts from flooding incidents as well as proper methods to protect themselves and their property. As new FIRMS have been developed throughout Hamilton County, residents within these areas are being notified that they may be subject to an increased risk of damages associated with flooding. These new FIRMs are in the preliminary stages and are expected
to be finalized near the end of 2013. Additionally, several individual stream studies are being completed in order to revise the Unnumbered Zone A areas, or to provide detailed delineations for the SFHA.
Figure 3-8 Fire Engine in Flood Waters
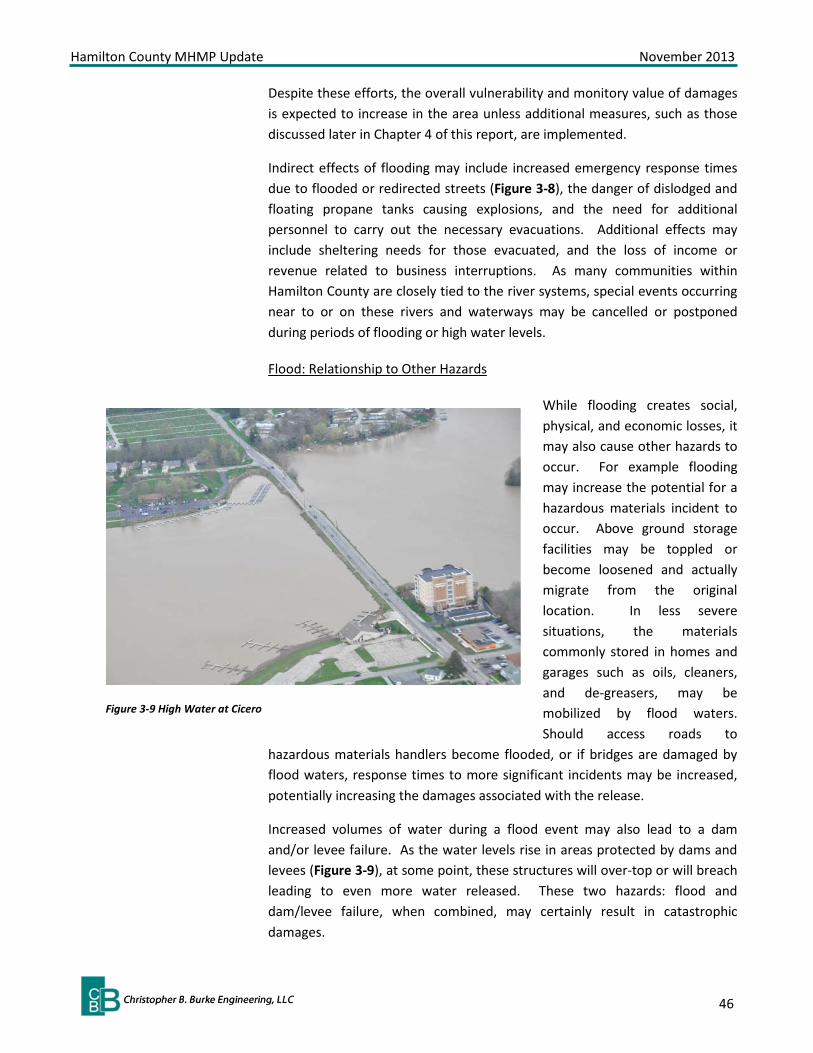
Hamilton County MHMP Update November 2013
46
Despite these efforts, the overall vulnerability and monitory value of damages is expected to increase in the area unless additional measures, such as those discussed later in Chapter 4 of this report, are implemented.
Indirect effects of flooding may include increased emergency response times due to flooded or redirected streets (Figure 3-8), the danger of dislodged and floating propane tanks causing explosions, and the need for additional personnel to carry out the necessary evacuations. Additional effects may include sheltering needs for those evacuated, and the loss of income or revenue related to business interruptions. As many communities within Hamilton County are closely tied to the river systems, special events occurring near to or on these rivers and waterways may be cancelled or postponed during periods of flooding or high water levels.
Flood: Relationship to Other Hazards
While flooding creates social, physical, and economic losses, it may also cause other hazards to occur. For example flooding may increase the potential for a hazardous materials incident to occur. Above ground storage facilities may be toppled or become loosened and actually migrate from the original location. In less severe situations, the materials commonly stored in homes and garages such as oils, cleaners, and de-greasers, may be mobilized by flood waters. Should access roads to
hazardous materials handlers become flooded, or if bridges are damaged by flood waters, response times to more significant incidents may be increased, potentially increasing the damages associated with the release.
Increased volumes of water during a flood event may also lead to a dam and/or levee failure. As the water levels rise in areas protected by dams and levees (Figure 3-9), at some point, these structures will over-top or will breach leading to even more water released. These two hazards: flood and dam/levee failure, when combined, may certainly result in catastrophic damages.
Figure 3-9 High Water at Cicero

Hamilton County MHMP Update November 2013
47
In a similar fashion, a snow storm or ice storm can also lead to flooding on either a localized or regional scale. When a large amount of snow or ice accumulates, the potential for a flood is increased. As the snow or ice melts, and the ground becomes saturated or remains frozen, downstream flooding may occur. Ice jams near bridges and culverts may also result in flooding of localized areas and potentially damage the bridge or culvert itself.

Hamilton County MHMP Update November 2013
48
3.3.4 Hailstorms, Thunderstorms, and Windstorms
Hailstorms, Thunderstorms, and Windstorms: Overview
Hail occurs when frozen water droplets form inside a thunderstorm cloud, and then grow into ice formations held aloft by powerful thunderstorm updrafts, and when the weight of the ice formations becomes too heavy, they fall to the ground as hail. Hail size ranges from smaller than a pea to as large as a softball, and can be very destructive to buildings, vehicles (Figure 3-10), and crops. Even small hail can cause significant damage to young and tender plants. Residents should take cover immediately in a hailstorm, and protect pets and livestock, which are particularly vulnerable to hail, and should be under shelter as well.
Thunderstorms are defined as strong storm systems produced by a cumulonimbus cloud, usually accompanied by thunder, lightning, gusty winds, and heavy rains. All thunderstorms are considered dangerous as lightening is one of the by-products of the initial storm. In the United States, on average, 300 people are injured and 80 people are killed each year by lightning. Although most lightening victims survive, people struck by lightning often report a variety of long-term, debilitating symptoms. Other associated dangers of thunderstorms included tornados, strong winds, hail, and flash flooding.
Windstorms or high winds can result from thunderstorm inflow and outflow, or downburst winds when the storm cloud collapses, and can result from strong frontal systems, or gradient winds (high or low pressure systems). High winds are speeds reaching 50 mph or greater, either sustained or gusting.
Hailstorm, Thunderstorm, and Windstorm: Historic Data
In Hamilton County, the NCDC has recorded 27 hailstorms since October 2006 and over 40 thunder and/or windstorms within the same time period. Significant windstorms are characterized by the top wind speed achieved during the incident, characteristically occur in conjunction with thunderstorms, and have historically occurred year round with the greatest frequency and damage occurring in May, June, and July. Within Hamilton County,
Figure 3-10 Damage to Vehicle Caused by Hailstones

Hamilton County MHMP Update November 2013
49
NCDC reports 37 instances where top wind speeds were greater than 58 mph.
Total NCDC recorded damages for hailstorms, thunderstorms, and windstorms throughout Hamilton County are $387.K in property damages and no reported crop damages. The NCDC further reported 4 injuries associated with thunder and windstorms. Many of the reports recorded by the NCDC did not include descriptive information on the social, physical, or economic losses resulting from individual storm events specific to Hamilton County. Appendix 6 provides the NCDC information regarding hailstorms, thunderstorms, and windstorms that have resulted in injuries, deaths, or monetary damages to property and/or crops.
According to NCDC, a June 2, 2009 hailstorm with hailstones ranging from 1.75 inches to 2.00 inches caused over $100K in damages in the Fishers area. Reports included hail damaged buildings and vehicles from 106th to 126th St; broken residential windows; and many homes in the Cherry Hill neighborhood with siding and window damage. This date was also reported within the thunderstorm category with winds exceeding 58 mph and causing additional damages within Noblesville as several trees were knocked down. Figure 3-11 identifies hailstones obtained by a Carmel resident.
Approximately $50K in damages were sustained in a June 2008 windstorm near the Town of Sheridan. According to the NCDC report, 10 structures, most of which were barns, were damaged and trees blocked several roadways. Semi-tractor trailers were damaged as 1 was blown over near 236th and US 31, and a tree fell onto another trailer at 281st and SR 213.
More recently, a March 2011 thunderstorm resulted in approximately $60K in damages such as stripped shingles and siding from several homes. Several trees and fences near SR 37 were blown down and damaged, as were several other trees throughout the Noblesville area.
Several other smaller hailstorms, thunderstorms, and windstorms have affected the Hamilton County area. However, the majority of the reports do not go into more detail than describing downed power lines and trees with no reports of damages or associated injuries. It is possible that in additional structures, vehicles, or crops and additional injuries were experienced but not reported to local officials, insurance companies, or the NCDC.
According to the Institute for Business and Home Safety, northeastern Indiana can expect to experience damaging hailstorms 3-4 times over 20 years; the average life of a residential roof. Further, thunderstorms and windstorms are considered a high frequency hazard and may occur numerous times per year.
Figure 3-11 Hailstones from Carmel Resident

Hamilton County MHMP Update November 2013
50
The Planning Committee determined the probability of a hailstorm, thunderstorm, or windstorm occurring in Hamilton County or any of the NFIP communities is “Highly Likely” and will typically affect broad portions of the County at one time resulting in an overall ranking of “Negligible” damages. The warning time for a storm is likely to be greater than 24 hours while the duration is anticipated by the Planning Committee to be less than 6 hours.
Hailstorms, thunderstorms, and windstorms are highly unpredictable and the occurrences are distributed through the county. Therefore the CPRI values reflect the equally distributed risk and associate priority for a hailstorm, thunderstorm, or windstorm. A summary of the Planning Committee’s risk assessment is provided in Table 3-12.
Table 3-12 CPRI for Hailstorm, Thunderstorm, and Windstorm PROBABILITY MAGNITUDE
/ SEVERITY WARNING
TIME DURATION CPRI
Hamilton County Highly Likely Negligible > 24 Hours < 6 Hours Elevated Town of Arcadia Highly Likely Negligible > 24 Hours < 6 Hours Elevated Town of Atlanta Highly Likely Negligible > 24 Hours < 6 Hours Elevated City of Carmel Highly Likely Negligible > 24 Hours < 6 Hours Elevated Town of Cicero Highly Likely Negligible > 24 Hours < 6 Hours Elevated Town of Fishers Highly Likely Negligible > 24 Hours < 6 Hours Elevated City of Noblesville Highly Likely Negligible > 24 Hours < 6 Hours Elevated Town of Sheridan Highly Likely Negligible > 24 Hours < 6 Hours Elevated City of Westfield Highly Likely Negligible > 24 Hours < 6 Hours Elevated
Specific locations and frequency of hailstorms, thunderstorms, and windstorms are difficult to predict as many of these individual events are without significant warning time and may have impacts to very limited areas, or may affect broader areas. However, based on NCDC data and personal experiences of the Planning Committee, it was determined that Hamilton County and all communities within are anticipated to experience a hailstorm, thunderstorm, or windstorm within the calendar year. More likely, Hamilton County communities will be impacted by several of these hazard events each year.
Hailstorm, Thunderstorm, and Windstorm: Assessing Vulnerability
The effects of a hailstorm, thunderstorm, or windstorm may be minimal to extensive in nature and may affect small or broad ranges of land area. Within Hamilton County, direct and indirect effects from a hailstorm, thunderstorm, or windstorm may include:

Hamilton County MHMP Update November 2013
51
Figure 3-12 Uprooted Tree
Direct Effects:
• Damages to infrastructure such as power lines, poles, and other electrical components
• Damages to individual property such as homes, cars, and other buildings
Indirect Effects:
• Downed power lines due to falling tree limbs • Losses associated with power outages • Damages sustained from blowing debris • Cancellation of special events due to impending weather • Increased number of field fires in agricultural areas and structural
fires in developed/residential areas
Estimating Potential Losses
Due to the unpredictability of this hazard, all critical infrastructure and non-critical structures in Hamilton County are at risk of damage including temporary or permanent loss of function. For hailstorms, thunderstorms, and windstorms, it is not possible to isolate specific critical or non-critical structures that would be more or less vulnerable to damages. However, areas where utility lines are above ground and areas where dead or dying trees have not been removed may be at a higher risk of property damages or power outages during hailstorms, thunderstorms, and windstorms. The City of Carmel, Fishers, or Noblesville may experience increased damages due to the number of structures and vehicles within the communities. Additionally, mobile homes and accessory buildings such as pole barns and sheds may also be at a higher risk of damages from hailstorms, thunderstorms, and windstorms if not property anchored to the ground.
Future Considerations
As the population of Hamilton County and the individual municipalities continue to grow, it can be anticipated that the number of critical and non-critical structures will also increase. In order to reduce the vulnerability for damages resulting from a hailstorm, thunderstorm, or windstorm, measures such as proper anchoring, enforcement of the International Building Codes, and burial of power lines should be completed. While measures can be taken to remove existing structures or prevent future structures from being built in known hazard areas such as floodplains and hazardous
Hamilton County MHMP Update November 2013
52
materials facility buffers, such measures are not applicable to hailstorms, thunderstorms, and windstorms due to the diffuse nature and regional impacts of this hazard.
Indirect effects resulting from a hailstorm, thunderstorm, or windstorm can power outages caused by downed tree limbs or uprooted trees (Figure 3-12), damages resulting from prolonged power outages, and damages to structures or property as a result of debris.
Hailstorm, Thunderstorm, and Windstorm: Relationship to Other Hazards
While it is not expected that hailstorms, thunderstorms, and windstorms will be caused by other hazards studied in this planning effort, they may be the precursor for several other hazards. For example, hazardous materials incidents can be the result of a hailstorm, thunderstorm, or a windstorm. Material storage containers can become damaged by high winds, debris, or even lightning, and can result in a spill or release of materials. With wind speeds greater than 58 mph, tankers and other transportation vehicles carrying hazardous materials are also at risk while on the road. High winds may also cause gaseous substances to travel farther distances at a much faster rate, increasing the evacuation area necessary to protect residents and visitors of Hamilton County.
Additionally, rainfall typically occurs with a thunderstorm and this additional precipitation may lead to localized flooding or riverine flooding depending on the amount of rain during the event. Debris from a windstorm may also lead to localized flooding if debris is deposited over drains or if obstructions are created by downed limbs, trees, or other storm related debris. Additional precipitation (and the increased volumes and velocities) combined with typical high winds may also lead to excessive streambank erosion, dam or levee failures, and potentially even transportation infrastructure failures.
Power outages may affect individual homeowners or entire businesses. However, if a power outage occurs at a livestock facility, the resulting damages may be as severe as an entire loss of animals within hours due to loss of cooling or air circulation capabilities.
The risk of social losses also increases during a hailstorm, thunderstorm, or windstorm as many times, these hazards result in downed power lines, utility poles, and trees. Debris such as this may impede traffic patterns and make it difficult for emergency vehicles (Fire, EMS, and Police) to pass through affected areas or people may be directly injured as a result of falling debris.

Hamilton County MHMP Update November 2013
53
Figure 3-13 Ice Covered Power Lines
3.3.5 Snow Storms and Ice Storms
Snow Storms and Ice Storms: Overview
A snow storm can range from moderate snow over a few hours to blizzard conditions with high winds, ice storms, freezing rain or sleet, heavy snowfall with blinding wind-driven snow, and extremely cold temperatures that can last for several days. Some such storms may be large enough to affect several states while others may affect only a single community. All winter storms are accompanied by cold temperatures and blowing snow, which can severely reduce visibility. A snow storm is one that drops 4 or more inches of snow during a 12-hour period, or 6 or more inches during a 24-hour span. An ice storm occurs when freezing rain falls from clouds and freezes immediately on impact. All winter storms make driving and walking extremely hazardous. The aftermath of a winter storm can affect a community or region for days, weeks, and even months.
Storm effects such as extreme cold, flooding, and snow accumulation can cause hazardous conditions and hidden problems for people in the affected area. People can become stranded on the road or trapped at home, without utilities or other services, including food, water, and fuel supplies. Ice covered power lines such as those in Figure 3-13 may lead to extensive power outages and failures. The conditions may overwhelm the capabilities of a local jurisdiction. Winter storms are considered deceptive killers as they may indirectly cause transportation accidents, and injury and death resulting from exhaustion/overexertion, hypothermia and frostbite from wind chill, and asphyxiation; and house fires occur more frequently in the winter due to lack of proper safety precautions.
Wind chill is a calculation of how cold it feels outside when the effects of temperature and wind speed are combined. On November 1, 2001, the NWS implemented a replacement Wind Chill Temperature (WCT) index for the 2001/2002 winter season. The reason for the change was to improve upon the current WCT Index, which was based on the 1945 Siple and Passel Index.
Hamilton County MHMP Update November 2013
54
A winter storm watch indicates that severe winter weather may affect your area. A winter storm warning indicates that severe winter weather conditions are definitely on the way. A blizzard warning means that large amounts of falling or blowing snow and sustained winds of at least 35 mph are expected for several hours. Winter storms are common in Hamilton County. Such conditions can result in substantial personal and property damage, even death.
Snow Storms and Ice Storms: Historic Data
Since the completion of the March 2006 Hamilton County MHMP, the NCDC has recorded 5 snow storms, 1 ice storm, 1 blizzard, and 2 winter weather events. Damage estimates were only provided for 1 winter storm event during this time period, the incident occurring on March 3, 2008. During this event, an estimated $10K in damages was a result of 0.5 inches of ice accumulation on electrical power lines. In addition, a transformer near 96th Street blew causing increased power outages in the area.
NCDC reported an ice storm occurring on February 1, 2011 and affecting the entire county. The event narrative provided indicates “Approximately one quarter inch of ice accumulation from freezing rain was received. Scattered power outages were also noted”. In several articles appearing in The Times the Noblesville Street Department was praised for their efforts in keeping the streets clean during the snow and ice storm lasting nearly 1 week. One article in the February 5, 2011 edition noted that a roof at Circle City Auto Parts had collapsed; believed to be caused by the increased weight from the accumulated snow and ice. According to the article, “Two employees were inside when the structure collapsed but were not injured having been in a different area than the collapse”. Later in the week (February 7, 2011), The Times reported that shelters were opened providing warm areas for those affected by power outages and a group of Noblesville High School football players shoveled sidewalks and wheelchair ramps for residents.
Appendix 6 provides the NCDC information regarding snow storms and ice storms that have resulted in injuries, deaths, or monetary damages to property and/or crops.
The probability, magnitude, warning times, and duration of a snow storm or ice storm causing disruption to residents and businesses in Hamilton County, as determined by the Planning Committee, is expected to be consistent throughout the County and NFIP communities. It is “Highly Likely” that this type of hazard will occur in this area and will typically affect the entire county, and possibly several surrounding counties, at one time, resulting in primarily “Limited” severity. The warning time for severe temperatures or several

Hamilton County MHMP Update November 2013
55
inches of snow associated with a winter storm is usually greater than 24 hours while the duration of the incident is anticipated to last less than 1 day. A summary is shown in Table 3-13.
Table 3-13 CPRI for Snow Storms and Ice Storms PROBABILITY MAGNITUDE
/ SEVERITY WARNING
TIME DURATION CPRI
Hamilton County Highly Likely Limited > 24 Hours < 1 Day Elevated Town of Arcadia Highly Likely Limited > 24 Hours < 1 Day Elevated Town of Atlanta Highly Likely Limited > 24 Hours < 1 Day Elevated City of Carmel Highly Likely Limited > 24 Hours < 1 Day Elevated Town of Cicero Highly Likely Limited > 24 Hours < 1 Day Elevated Town of Fishers Highly Likely Limited > 24 Hours < 1 Day Elevated City of Noblesville Highly Likely Limited > 24 Hours < 1 Day Elevated Town of Sheridan Highly Likely Limited > 24 Hours < 1 Day Elevated City of Westfield Highly Likely Limited > 24 Hours < 1 Day Elevated
The Planning Committee determined that the probability for a snow storm or ice storm to occur in Hamilton County or any of the communities within is “Highly Likely”, or will occur within the calendar year. Based on historical data and the experience of the Planning Committee, snow storms and ice storms are common within Hamilton County and will continue to be an annual occurrence.
Snow Storms and Ice Storms: Assessing Vulnerability
A snow storm typically affects a large regional area with potential for physical, economic, and/or social losses. Direct and indirect effects of a snow storm or ice storm within Hamilton County may include:
Direct Effects: • More urban area employers may experience loss of production as
employees may not be able to get to work • Rural (County) roads may impassable • Expenses related to snow removal or brine/sand applications
Indirect Effects: • Loss of revenue as businesses are closed • Increased emergency response times based on safety of roads • Loss of income if unable to get to place of employment
Estimating Potential Losses
Given the nature and complexity of a regional hazard such as a snow storm, it is difficult to quantify potential losses to property and infrastructure. As a

Hamilton County MHMP Update November 2013
56
Figure 3-14 Travel Impacted During Snow Storm
result, all critical and non-critical structures and infrastructure are at risk from snow storm and ice storm incidents.
For planning purposes, information collected in snow storms impacting other communities around the nation is also useful in assessing the potential social, physical, and economic impact that a winter storm could have on Hamilton County communities. For example, a March 2003 snow storm in Denver, Colorado dropped approximately 31 inches of snow and caused an estimated $34M in total damages. In addition, a February 2003 winter storm dropped an estimated 15-20 inches of snow in parts of Ohio. The Federal and Ohio Emergency Management Agencies and U.S. Small Business Administration surveyed damaged areas and issued a preliminary assessment of $17M in disaster related costs. These costs included snow and debris removal, emergency loss prevention measures, and public utilities repair. The agencies found over 300 homes and businesses either damaged or destroyed in 6 counties. Snow storms and blizzards also make road travel difficult and dangerous, as in Figure 3-14.
The Denver, Colorado area snowstorms from December 2006 through January 2007 surpassed the expenses and damages of the 2003 winter storms. In snow removal costs alone, it is estimated that over $19M was spent throughout the area, with approximately $6.4M of that allocated to clearing Denver International Airport. Additional economic expenses are realized when such a large storm closes local businesses and Denver International Airport for nearly 48 hours.
While the above examples indicate the wide-ranging and large-scale impact that winter storms can have on a community or region, in general, winter storms tend to result in less direct economic impacts than many other natural hazards. According to the Workshop on the Social and Economic Impacts of Weather, which was sponsored by the U.S. Weather Research Program, the American Meteorological Society, the White House Subcommittee on Natural Disaster Relief, and others, winter storms resulted in an average of 47 deaths and more than $1B in economic losses per year between 1988 and 1995. However, these totals account for only 3% of the total weather-related

Hamilton County MHMP Update November 2013
57
economic loss and only 9% of fatalities associated with all weather related hazards over the same period.
Future Considerations
As populations increase and communities continue to grow in size, the need to respond to snow storms or ice storms will remain an important municipal effort. As new construction or re-development occurs, especially new or existing critical infrastructure, it is important to ensure that these new structures are equipped to deal with the potential risks associated with this hazard. Those may include lengthy power outages and potentially impassable transportation routes, making it difficult to obtain supplies or for passage of response vehicles.
Winter storms can also result in substantial indirect costs. Increased emergency response times, loss of work or the inability to get to work, as well as business interruption, are possible indirect effects of a winter storm. According to a report by the National Center for Environmental Predictions, the cold and snowy winter in late 1977 and early 1978, which impacted several heavily populated regions of the country, was partially responsible for reducing the nation’s Gross Domestic Product (GDP) from an estimated growth rate of between 6% and 7% during the first 3 quarters of 1977 to approximately -1% in the last quarter of 1977 and 3% during the first quarter of 1978.
Snow Storm and Ice Storm: Relationship to Other Hazards
Winter storms and ice storms can lead to flooding as the precipitation melts and enters local receiving water bodies. This increased volume of water on already saturated, or still frozen ground can quickly result in flooding related damages to structures and properties (Figure 3-15) as well as within the stream or river channel. The increased flooding may then lead to a dam or levee failure within the same area, further exacerbating the damages.
Hazardous materials incidents may be caused by poor road conditions during winter storms or ice storms. Many hazardous materials are transported by rail or
by tanker over highways and interstates. In the more suburban/rural areas of Hamilton County, or where open areas are more susceptible to drifted roads, the possibility of a traffic related hazardous materials incident may increase.
Figure 3-15 Flooding Caused by Snow Melt

Hamilton County MHMP Update November 2013
58
Power outages and other infrastructure failures may also occur during a winter storm. Weight from snow and ice accumulations can directly or indirectly cause power lines to fail. During extreme cold temperatures, power outages may prove deadly for certain populations such as the elderly or ill.

Hamilton County MHMP Update November 2013
59
3.3.6 Tornado
Tornado: Overview
Tornadoes are defined as violently rotating columns of air extending from thunderstorms to the ground. Funnel clouds are rotating columns of air not in contact with the ground. However, the funnel cloud may reach the ground very quickly – becoming a tornado. If there is debris lifted and blown around by the “funnel cloud”, then it has reached the ground and is a tornado.
A tornado is generated when conditions in a strong cell are produced that exhibit a wall of cool air that overrides a layer of warm air. The underlying layer of warm air rapidly rises, while the layer of cool air drops – sparking the swirling action. The damage from a tornado is a result of the high wind velocity and wind-clown debris. Tornado season is generally April through June in Indiana, although tornadoes can occur at any time of year. Tornadoes tend to occur in the afternoons and evenings; over 80 percent of all tornados strike between 3:00 pm and 9:00 pm, but can occur at any time of day or night as shown in Figure 3-16. Tornadoes occur most frequently in the United States east of the Rocky Mountains. Tornadoes in Indiana generally come from the south through the east. In Hamilton County, the predominant tornado path seems to be from the southwest to the northeast.
While most tornadoes (69%) have winds of less than 100 mph, they can be much stronger. Although violent tornadoes (winds greater than 205 mph) account for only 2% of all tornadoes, they cause 70% of all tornado deaths. In 1931, a tornado in Minnesota lifted an 83-ton rail car with 117 passengers and carried it more than 80 feet. In another instance, a tornado in Oklahoma carried a motel sign 30 miles and dropped it in Arkansas. In 1975, a Mississippi tornado carried a home freezer more than a mile.
Tornado: Recent Occurrences
The classification of tornadoes utilizes the Fujita Scale of Tornado Intensity, described in Table 3-14. Tornado intensity ranges from low intensity (F0) tornadoes with effective wind speeds of 40-70 mph to high intensity (F5+) tornadoes with effective wind speeds of 261-318+ mph. According to the NCDC, Hamilton County has experienced 1 tornado between 2006 and 2013; an F2. Exhibit 4 illustrates these tornado touchdowns and paths through Hamilton County.
Figure 3-16 Funnel Cloud During a Lightning Storm at Night
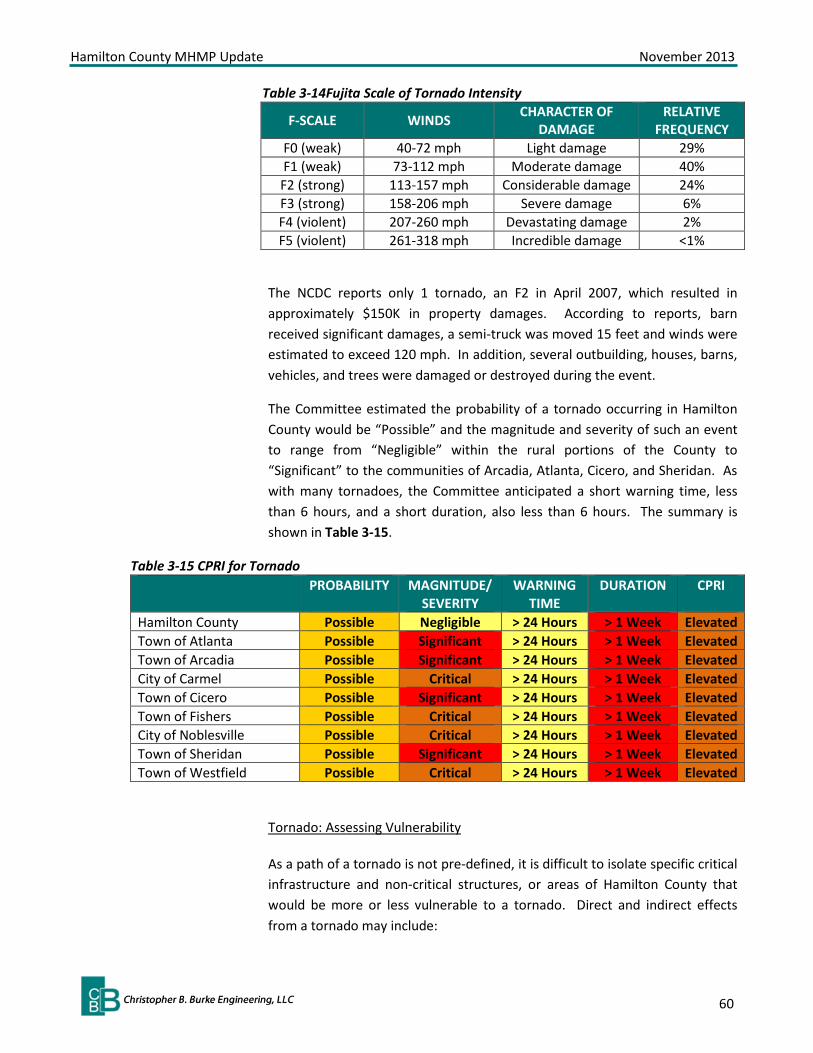
Hamilton County MHMP Update November 2013
60
Table 3-14Fujita Scale of Tornado Intensity
F-SCALE WINDS CHARACTER OF DAMAGE
RELATIVE FREQUENCY
F0 (weak) 40-72 mph Light damage 29% F1 (weak) 73-112 mph Moderate damage 40% F2 (strong) 113-157 mph Considerable damage 24% F3 (strong) 158-206 mph Severe damage 6% F4 (violent) 207-260 mph Devastating damage 2% F5 (violent) 261-318 mph Incredible damage <1%
The NCDC reports only 1 tornado, an F2 in April 2007, which resulted in approximately $150K in property damages. According to reports, barn received significant damages, a semi-truck was moved 15 feet and winds were estimated to exceed 120 mph. In addition, several outbuilding, houses, barns, vehicles, and trees were damaged or destroyed during the event.
The Committee estimated the probability of a tornado occurring in Hamilton County would be “Possible” and the magnitude and severity of such an event to range from “Negligible” within the rural portions of the County to “Significant” to the communities of Arcadia, Atlanta, Cicero, and Sheridan. As with many tornadoes, the Committee anticipated a short warning time, less than 6 hours, and a short duration, also less than 6 hours. The summary is shown in Table 3-15.
Table 3-15 CPRI for Tornado PROBABILITY MAGNITUDE/
SEVERITY WARNING
TIME DURATION CPRI
Hamilton County Possible Negligible > 24 Hours > 1 Week Elevated Town of Atlanta Possible Significant > 24 Hours > 1 Week Elevated Town of Arcadia Possible Significant > 24 Hours > 1 Week Elevated City of Carmel Possible Critical > 24 Hours > 1 Week Elevated Town of Cicero Possible Significant > 24 Hours > 1 Week Elevated Town of Fishers Possible Critical > 24 Hours > 1 Week Elevated City of Noblesville Possible Critical > 24 Hours > 1 Week Elevated Town of Sheridan Possible Significant > 24 Hours > 1 Week Elevated Town of Westfield Possible Critical > 24 Hours > 1 Week Elevated
Tornado: Assessing Vulnerability
As a path of a tornado is not pre-defined, it is difficult to isolate specific critical infrastructure and non-critical structures, or areas of Hamilton County that would be more or less vulnerable to a tornado. Direct and indirect effects from a tornado may include:

Hamilton County MHMP Update November 2013
61
Direct Effects:
• Damages to older construction structures, mobile homes, and accessory structures (pole barns, sheds, etc.)
• Damages to above ground utility lines and structures
Indirect Effects:
• Expenses related to debris clean-up and/or reconstruction • Loss of revenue for affected businesses • Loss of work if employers are affected
Estimating Potential Losses
Due to the unpredictability of this hazard, all critical and non-critical structures within the County are at risk of future damage or loss of function. Estimates of potential physical losses were determined through a hypothetical exercise where F2 intensity tornadoes traveled through portions of the County. This is intended to present a “what-if” scenario of a tornado incident and associated damages. Damage estimates were derived by assuming that 25% of all structures in the path of the tornado would be completely destroyed, 35% would be 50% damaged, and 40% would have only 25% damage. These estimations were also determined utilizing 3 wind speed zones based on distance from the tornado path. Table 3-16 provides a summary of damages resulting from the hypothetical tornado, which is identified on Exhibit 4.
Table 3-16 Summary of Hypothetical Tornado Damages NUMBER OF STRUCTURES
DAMAGED ESTIMATED DAMAGE ($)
Hamilton County 5 $1.2M Carmel 350 $56.2M Noblesville 349 $60.4M Westfield 229 $37.5M Total 933 $155.3M

Hamilton County MHMP Update November 2013
62
Future Considerations
Within Hamilton County, there are numerous events each year that draw many thousands of Indiana residents as well as international guests. Due to this, it is imperative that the EMA place continued importance on the need to maintain and, as necessary, upgrade the outdoor warning siren coverage.
Currently, approximately 50% of Hamilton County is covered by an outdoor warning siren. The existing siren locations and the coverage areas for outdoor warning sirens are provided in Figure 3-17.
There may also be indirect effects of a tornado event. For example, post-event clean-up may result in high expenses or inability to work for property owners that have experienced damages from either the tornado directly or by debris from high winds. Affected business owners may experience loss of revenue if unable to continue operations following the event. Similarly, if a business is affected and unable to operate, employees may experience a loss of wages during the period of recovery.
Tornado: Relationship to Other Hazards
Tornadoes may result in a hazardous materials incident. Material storage containers can become damaged by high winds and debris can result in a spill or release of materials. As wind speeds increase, the potential for damages to above ground storage containers also increases. Tankers and other transportation vehicles carrying hazardous materials are also at an increased risk while on the road or rail.
Tornadoes may also result in a dam or levee failure as described within the hailstorm, thunderstorm, and windstorm section. The increased wind speeds, and debris caused by the tornado, may directly impact the dam or levee, or cause indirect damages through large debris or downed trees. In addition,
Figure 3-17 Outdoor Warning Siren Coverage

Hamilton County MHMP Update November 2013
63
tornadoes may lead to structural fires as the destruction path is sometimes long and broad, leading to an increased number of potentially damaged homes, exposed power lines, and large amounts of debris.

Hamilton County MHMP Update November 2013
64
TECHNOLOGICAL HAZARDS
3.3.7 Dam and Levee Failure
Dam and Levee Failure: Overview
A dam is defined as a barrier constructed across a watercourse for the purpose of storage, control, or diversion of water. Dams typically are constructed of earth, rock, concrete, or mine tailings. A dam failure is a collapse, breach, or other failure resulting in downstream flooding.
A dam impounds water in the upstream area, referred to as the reservoir. The amount of water impounded is measured in acre-feet. An acre-foot is the volume of water that covers an acre of land to a depth of one foot. As a function of upstream topography, even a very small dam may impound or detain many acre-feet of water. Two factors influence the potential severity of a full or partial dam failure: the amount of water impounded, and the density, type, and value of development and infrastructure located downstream.
Of the approximately 80,000 dams identified nationwide in the National Inventory of Dams, the majority are privately owned. Each dam is assigned a downstream hazard classification based on the potential loss of life and damage to property should the dam fail. The three classifications are high, significant, and low. With changing demographics and land development in downstream areas, hazard classifications are updated continually. The following definitions of hazard classification currently apply to dams in Indiana:
• High Hazard Dam: a structure the failure of which may cause the loss of life and serious damage to homes, industrial and commercial buildings, public utilities, major highways, or railroads.
• Significant Hazard Dam: a structure the failure of which may damage isolated homes and highways, or cause the temporary interruption of public utility services.
• Low Hazard Dam: a structure the failure of which may damage farm buildings, agricultural land, or local roads.
A levee is a flood control structure designed to hold water away from a building. Levees protect buildings from flooding as well as from the force of water, from scour at the foundation, and from impacts of floating debris. The principle causes of levee failure are similar to those associated with dam

Hamilton County MHMP Update November 2013
65
failure and include overtopping, surface erosion, internal erosion, and slides within the levee embankment or the foundation walls. Levees are designed to protect against a particular flood level and they may be overtopped in a more severe event. When a levee system fails or is overtopped, the result can be catastrophic and often times more damaging that if the levee were not there, due to increased elevation differences and water velocity. The water flowing through the breach continues to erode the levee and increase the size of the breach until it is repaired or water levels on the two side of the levee have equalized.
Dam and Levee Failure: Recent Occurrences
Within Hamilton County, there are 11 DNR regulated dams: 2 high hazard dams, 3 significant hazard dams, 6 low hazard dams as shown on Exhibit 3. High Hazard dams include: Keystone Woods Lake Dam and Morse Reservoir Dam. There have been no recorded dam failures within Hamilton County. Morse Reservoir Dam is pictured in Figure 3-18
There is 1 levee considered to be consequential in terms of buildings identified as in or out of the 100-year floodplain. While there may be other levees constructed within Hamilton County, they are not providing protection for the 100-year flood and as such, not included within this planning effort.
Based on the information provided to them, the Committee determined the probability of a dam or levee failure is “Unlikely” with an anticipated effect of “Negligible” (areas not anticipated to be within the inundation area) to “Significant” (based on the number of structures or populations downstream of the dam) damages. Table 3-17 provides a summary of the Planning Committee’s expectations during a dam or levee failure.
Figure 3-18 Morse Reservoir Dam

Hamilton County MHMP Update November 2013
66
Table 3-17 CPRI for Dam and Levee Failure PROBABILITY MAGNITUDE/
SEVERITY WARNING
TIME DURATION CPRI
Hamilton County Unlikely Critical < 6 Hours < 1 Week Elevated Town of Atlanta Unlikely Negligible > 24 Hours < 6 Hours Low Town of Arcadia Unlikely Negligible > 24 Hours < 6 Hours Low City of Carmel Unlikely Critical < 6 Hours < 1 Day Elevated Town of Cicero Unlikely Negligible > 24 Hours < 6 Hours Low Town of Fishers Unlikely Negligible > 24 Hours < 6 Hours Low City of Noblesville Unlikely Significant < 6 Hours < 1 Week Elevated Town of Sheridan Unlikely Negligible > 24 Hours < 6 Hours Low Town of Westfield Unlikely Limited < 6 Hours < 1 Day Low
Dam & Levee Failure: Assessing Vulnerability
Within Hamilton, direct and indirect effects from a dam failure or a levee failure may include:
Direct Effects:
• Loss of life and serious damage to downstream homes, industrial and commercial buildings, public utilities, major highways, or railroads
Indirect Effects:
• Loss of land in the immediate scour area • Increased response times due to damaged or re-routed
transportation routes and/or bridges
Due to the conditions beyond the control of the dam owner or engineer, there may be unforeseen structural problems, natural forces, mistakes in operation, negligence, or vandalism that may cause a dam to fail. Fortunately, Morse Reservoir Dam, a high hazard dam, is scheduled to have an IEAP prepared along with detailed dam failure inundation mapping. However, at this same time, the Keystone Woods Lake Dam, also a high hazard dam, does not have such a plan or mapping.
Estimating Potential Losses
The potential dam failure inundation area for the Morse Reservoir Dam was overlaid onto recent aerial photography to estimate the number of critical and non-critical structures that may be affected by a dam failure. The actual magnitude and extent of damage depend on the type of dam break, volume of water that is released, and the width of the floodplain valley to accommodate the dam break flood wave. The anticipated damages to the structures and

Hamilton County MHMP Update November 2013
67
contents located within the Keystone Woods Lake Dam potential inundation area are identified in Table 3-18; while anticipated damages for a failure of the Morse Reservoir Dam are identified in Table 3-19.
Table 3-18 Estimated Damages for Keystone Woods Lake Dam Failure CARMEL
Structures (>400 sq. ft.) 140 Outbuildings (<400 sq. ft.) 31 TOTAL Structures 171 TOTAL Damages ($) $22.4M
Table 3-19 Estimated Damages for Morse Reservoir Dam Failure
There are several critical and non-critical infrastructure located within the delineated potential dam failure inundation areas for the Keystone Woods Lake Dam and the Morse Reservoir Dam. Table 3-20 identifies the number and type of critical structures within the Morse Reservoir Dam potential inundation area. There is 1 critical structure within the potential Keystone Woods Lake Dam inundation area: 1 Government. These buildings are included in the overall number of structures and damage estimates information provided in Tables 3-17 and 3-18.
HAMILTON COUNTY
CARMEL FISHERS NOBLESVILLE
Structures (>400 sq. ft.) 1,343 140 111 6,289 Outbuildings (<400 sq. ft.) 718 31 9 2,134 TOTAL Structures 2,061 171 120 8,423 TOTAL Damages ($) $340.3M $22.4M $63.6M $1.9B

Hamilton County MHMP Update November 2013
68
Table 3-20 Critical Structures in the Morse Reservoir Potential Dam Inundation Area
NFIP COMMUNITY #/SECTOR Carmel 1 Banking & Finance
1 Communication 2 Manufacturing
1 Government 4 Water
Fishers 2 Government 2 Water
Hamilton County 1 Commercial 1 Energy
1 Transportation 1 Water
Noblesville 31 Commercial 3 Emergency Response
21 Government 14 Healthcare
22 Manufacturing 11 Water
TOTAL Structures 101
FEMA accredits levees as providing adequate risk reduction on the FIRM if the certification and adopted operation and maintenance plan provided by the levee owner are confirmed to be adequate. This accreditation process is not a standard of safety; it only affects insurance and building requirements for the areas protected by the levee.
Within the City of Noblesville, along the southeast border of Morse Reservoir is a Provisionally Accredited Levee (PAL). This indicates that the community believes that the levee should be fully certified and is working to provide the needed documentation to FEMA in a specified time frame. The owner of the levee, Citizens Energy Group (CEG), at the time of this planning effort, is currently working to re-accredit this levee.
Future Considerations
As areas near existing dams or levees continue to grow in population, it can be anticipated that the number of critical and non-critical structures will also increase accordingly. Location of these new facilities should be carefully considered and precautions should be taken to ensure that schools, medical facilities, municipal buildings, and other critical infrastructure are located outside of the delineated or estimated dam failure inundation areas and outside the levee-protected areas. Also, flood-free access should be provided for these facilities.

Hamilton County MHMP Update November 2013
69
It is also very important to all downstream communities and property owners that all IEAPs are kept up-to-date as well as routinely exercised to ensure the greatest safety to those within the hazard area. It is also important to note that, due to their relatively low design standard, the levees are vulnerable to overtopping and failure. Detailed flood response and evacuation plans should be prepared for these areas and exercised routinely. There should also be a significant targeted level of public education for these areas.
Dam & Levee Failure: Relationship to Other Hazards
With the potentially large volumes and velocities of water released during a dam breach, it can be expected that a dam failure would lead to flooding and within the inundation areas downstream of the dam. Similarly, if levee systems are located within the dam failure inundation area, increased stress may be applied to these systems leading to a potential levee failure as well.
Downstream bridges and roads are also in danger of being destroyed or damaged due to a dam failure. Bridges may become unstable and portions of road surfaces may be washed away or the entire road may be undermined. Other infrastructure such as utility poles and lines may be damaged as the water flows along the surface or pipes may become exposed due to scouring; all of which may lead to utility failures within the area downstream of the dam failure.
Several other independent hazards may also lead to a dam failure. Hazards such as flooding, the melting of snow or ice, or rapid precipitation associated with thunderstorms, may all lead to increased pressure on the dam structures or overtopping of the structures, leading to failure. Additionally, earthquakes or tornadoes may cause damage to the structures or earthen components of the dam resulting in irreparable damages or failure.

Hamilton County MHMP Update November 2013
70
Figure 3-19 Drums of Potentially Hazardous Waste
3.3.8 Hazardous Materials Incident
Hazardous Materials Incident: Overview
Hazardous materials are substances that pose a potential threat to life, health, property, and the environment if they are released. Examples of hazardous materials include corrosives, explosives, flammable materials, radioactive materials, poisons, oxidizers, and dangerous gases. Despite precautions taken to ensure careful handling during manufacture, transport, storage, use, and disposal, accidental releases are bound to occur. These releases create a serious hazard for workers, neighbors, and emergency response personnel. Emergency response may require fire, safety/law enforcement, search and rescue, and hazardous materials response units.
As materials are mobilized for treatment, disposal, or transport to another facility, all infrastructure, facilities, and residences in close proximity to the transportation routes are at an elevated risk of being affected by a hazardous materials release. Often these releases can cause serious harm to Hamilton County and its residents if proper and immediate actions are not taken. Most releases are the result of human error or improper storage (Figure 3-19), and corrective actions to stabilize these incidents may not always be feasible or practical in nature.
Railways often transport materials that are classified as hazardous and preparations need to be made and
exercised for situations such as derailments, train/vehicle crashes, and/or general leaks and spills from transport cars.
Hazardous Materials Incident: Recent Occurrences
During conversations with Committee members and through information provided by local news outlets, it was noted that several incidents involving manufacturing facilities and transportation routes occur each year in Hamilton County. The number of facilities utilizing, storing, and/or manufacturing chemicals and the number of high volume transportation routes increase the likelihood of an incident.
Many small spills or releases have taken place within Hamilton County over the years, and it is anticipated that this will continue to occur as many substances are utilized and transported throughout the County every day. For example, within 2012 several instances of releases less than 50 gallons of gasoline were reported as well as a release of hydraulic fluid. In 2011, several

Hamilton County MHMP Update November 2013
71
moderate releases were noted including a raw sewage release within the Town of Fishers due to a pump station failure. Asphalt sealant made its way to a pond near the Kahlo Dealership resulting in a fish kill. Within Noblesville, a residence where approximately 100 gallons of gasoline was being stored caught fire and required the response of several fire crews.
According to the Committee, the probability of a hazardous materials release or incident is “Highly Likely” within the City of Carmel, the Town of Fishers, and the City of Noblesville, while it is “Likely” within all other areas of Hamilton County. “Negligible” damages are anticipated to result from an incident within the rural areas of Hamilton County, while all other areas are expected to receive “Limited” damages. As with hazards of this nature, a short warning time and a short duration, both less than 6 hours, are anticipated in the event of a hazardous materials incident. A summary is shown in Table 3-21Table 3-21.
Table 3-21 CPRI for Hazardous Materials Incident PROBABILITY MAGNITUDE/
SEVERITY WARNING
TIME DURATION CPRI
Hamilton County Likely Negligible < 6 Hours < 6 Hours Elevated Town of Atlanta Likely Limited < 6 Hours < 6 Hours Elevated Town of Arcadia Likely Limited < 6 Hours < 6 Hours Elevated City of Carmel Highly Likely Limited < 6 Hours < 6 Hours Severe Town of Cicero Likely Limited < 6 Hours < 6 Hours Elevated Town of Fishers Highly Likely Limited < 6 Hours < 6 Hours Severe City of Noblesville Highly Likely Limited < 6 Hours < 6 Hours Severe Town of Sheridan Likely Limited < 6 Hours < 6 Hours Elevated Town of Westfield Likely Limited < 6 Hours < 6 Hours Elevated
Relatively small hazardous materials incidents have occurred throughout Hamilton County in the past and are highly likely, according to the Committee, to occur again. As the number of hazardous materials producers, users, and transporters increase within or surrounding Hamilton County, it can be anticipated that the likelihood of a future incident will also increase.
Hazardous Materials Incident: Assessing Vulnerability
Within Hamilton County, direct and indirect effects from a hazardous materials incident may include: Direct Effects:
• More densely populated areas with a larger number of structures, railroad crossings, and heavily traveled routes are more vulnerable
• Expense of re-construction of affected structures
Hamilton County MHMP Update November 2013
72
Indirect Effects:
• Loss of revenue or production while recovery and/or reconstruction occurs
• Anxiety or stress related to event • Potential evacuation of neighboring structures or facilities
While the possibility of an incident occurring may be likely, the vulnerability of Hamilton County has been lowered due to the enactment of Superfund Amendments and Reauthorization Act (SARA) Title III national, state and local requirements. SARA Title III, also known as the Emergency Planning and Community Right to Know Act (EPCRA), establishes requirements for planning and training at all levels of government and industry. EPCRA also establishes provisions for citizens to have access to information related to the type and quantity of hazardous materials being utilized, stored, transported or released within their communities.
One local result of SARA Title III is the formation of the Local Emergency Planning Commission (LEPC). This commission has the responsibility for preparing and implementing emergency response plans, cataloging Material Safety Data Sheets (MSDS), chemical inventories of local industries and businesses, and reporting materials necessary for compliance.
In Hamilton County, 48 extremely hazardous substance (EHS) facilities that are subject to SARA Title III provisions due to the presence of listed hazardous materials in quantities at or above the minimum threshold established by the Act. These facilities are also required to create and distribute emergency plans and facility maps to local emergency responders such as the LEPC, fire departments, and police departments. With this knowledge on hand, emergency responders and other local government officials can be better prepared to plan for an emergency, the response it would require, and prevent serious affects to the community involved.
Estimating Potential Losses
In addition, the very nature of these events makes predicting the extent of their damage very difficult. A small-scale spill or release might have a minor impact and would likely require only minimal response efforts. Another slightly larger incident might result in the disruption of business or traffic patterns, and in this situation might require active control response measures to contain a spill or release. On the other hand, even small or moderate events could potentially grow large enough that mass evacuations or shelter in place techniques are needed, multiple levels of response are utilized, and

Hamilton County MHMP Update November 2013
73
Figure 3-20 Fuel Tanker Fire
additional hazards such as structural fires and/or additional hazardous materials releases (or explosions) may occur. Given the unpredictable nature of hazardous materials incident, an estimate of potential losses was not estimated.
Future Considerations
Additional facilities, both critical and non-critical in nature may be affected if a hazardous materials release were to occur along a transportation route (Figure 3-20). Several routes including railways, Interstates 69 and 465; and numerous segments of US Highways and State Routes are traveled by carriers of hazardous materials.
By restricting development within the known hazardous materials facility buffer zones, future losses associated with a hazardous
materials release can be reduced. Critical infrastructure especially should be discouraged from being located within these areas. Further, by restricting construction in these zones, the number of potentially impacted residents may also be greatly reduced, lowering the risk for social losses, injuries, and potential deaths. Future construction of hazardous materials facilities should be located away from critical infrastructure such as schools, medical facilities, municipal buildings, and daycares, reducing the risk to highly populated buildings and potentially populations with specials needs or considerations such as children, elderly, and medically unfit.
Hazardous Materials Incident: Relationship to Other Hazards
Dependent on the nature of the release, conditions may exist where an ignition source such as a fire or spark is in close proximity to a flammable or explosive substance. As the fire spreads throughout the facility or the area, structural and/or property damages will increase. Response times to a hazardous materials incident may be prolonged until all necessary information is collected detailing the type and amount of chemicals potentially involved in the incident. While this may increases structural losses, it may actually decrease the social losses such as injuries or even deaths.

Hamilton County MHMP Update November 2013
74
3.4 HAZARD SUMMARY
For the development of this MHMP, the Committee utilized the CPRI method to prioritize the hazards they felt affected Hamilton County. Hazards were assigned values based on the probability or likelihood of occurrence, the magnitude or severity of the incident, as well as warning time and duration of the incident itself. A weighted CPRI was calculated based on the percent of the County’s population present in the individual NFIP communities.
Table 3-22 summarizes the CPRI values for the various hazards studied within this MHMP. The hazards that ranked as “Elevated” risk were flooding; drought; earthquake; hailstorm, thunderstorm and windstorm; hazardous materials incident; tornado; winter storm and ice storm. The hazard with a “Low” risk was dam and levee failure.

Hamilton County MHMP Update November 2013
75
Table 3-22 Combined CPRI TYPE OF HAZARD LIST OF HAZARDS WEIGHTED AVERAGE CPRI
Nat
ural
Drought
Earthquake
Flood
Hail/Thunder/Wind
Tornado
Winter Storm/Ice
Tech
nolo
gica
l Dam/Levee Failure
Hazardous Materials Incident
It can be important to understand the cause and effect relationship between the hazards selected by the Committee. Table 3-23 can be utilized to identify those relationships. For example, a winter storm (along the side of the table) can result in a flood (along the top of the table). In a similar fashion, a hazardous materials incident (along the top of the table) can be caused by an earthquake; flood; hailstorm, thunderstorm, or windstorm; tornado; or a winter storm or ice storm (along the side of the table).
Low Severe
Low Severe
Low Severe
Low Severe
Low Severe
Low Severe
Low Severe
Low Severe
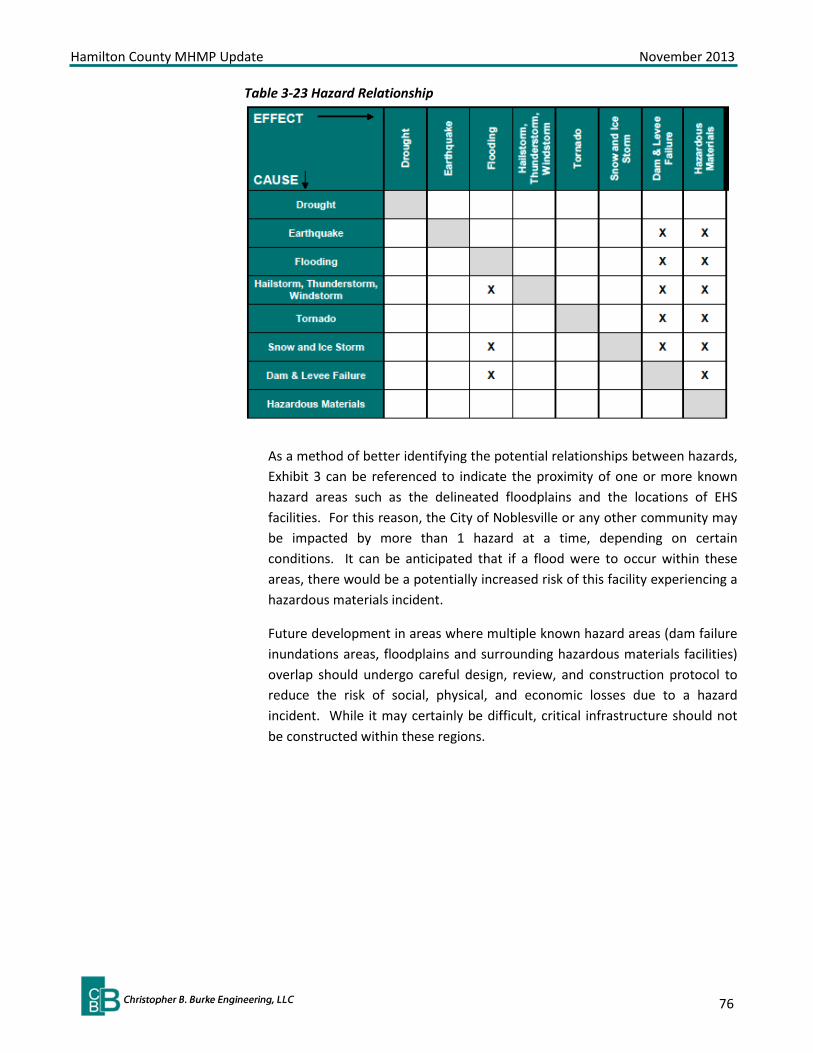
Hamilton County MHMP Update November 2013
76
Table 3-23 Hazard Relationship
As a method of better identifying the potential relationships between hazards, Exhibit 3 can be referenced to indicate the proximity of one or more known hazard areas such as the delineated floodplains and the locations of EHS facilities. For this reason, the City of Noblesville or any other community may be impacted by more than 1 hazard at a time, depending on certain conditions. It can be anticipated that if a flood were to occur within these areas, there would be a potentially increased risk of this facility experiencing a hazardous materials incident.
Future development in areas where multiple known hazard areas (dam failure inundations areas, floodplains and surrounding hazardous materials facilities) overlap should undergo careful design, review, and construction protocol to reduce the risk of social, physical, and economic losses due to a hazard incident. While it may certainly be difficult, critical infrastructure should not be constructed within these regions.
Hamilton County MHMP Update November 2013
77
REQUIREMENT §201.6(c)(3)(i): [The hazard mitigation strategy shall include a] description of mitigation goals to reduce or avoid long-term vulnerabilities to the identified hazards.
REQUIREMENT §201.6(c)(3)(ii): [The mitigation strategy shall include a] section that identifies and analyzed a comprehensive range of specific mitigation actions and projects being considered to reduce the effects of each hazard, with particular emphasis on new and existing buildings and infrastructure. REQUIREMENT §201.6(c)(3)(iii): [The mitigation strategy section shall include] an action plan describing how the actions identified in section (c)(3)(ii) will be prioritized, implemented, and administered by the local jurisdiction. Prioritization shall include a special emphasis on the extent to which benefits are maximized according to a cost benefit review of the proposed projects and their associated costs.
CHAPTER 4 MITIGATION GOALS AND PRACTICES
This section identifies the overall goal for the development and implementation of the Hamilton County MHMP. A summary of existing and proposed mitigation practices discussed by the Committee is also provided.
4.1 MITIGATION GOAL
The Committee reviewed the mitigation goals as outlined within the 2006 Hamilton County MHMP and determined that each of these remain valid and effective. In summary, the overall goal of the Hamilton County MHMP is to reduce the social, physical, and economic losses associated with hazard incidents through emergency services, natural resource protection, prevention, property protection, public information, and structural control mitigation practices.
4.2 MITIGATION PRACTICES
In 2005, the Multi-Hazard Mitigation Council conducted a study about the benefits of hazard mitigation. This study examined grants over a 10-year period (1993-2003) aimed at reducing future damages from earthquake, wind, and flood. It found that mitigation efforts were cost-effective at reducing future losses; resulted in significant benefits to society; and represented significant potential savings to federal treasury in terms of reduced hazard-related expenditures. This study found that every $1 spent on mitigation efforts resulted in an average of $4 savings for the community. The study also

Hamilton County MHMP Update November 2013
78
found that FEMA mitigation grants are cost-effective since they often lead to additional non-federally funded mitigation activities, and have the greatest benefits in communities that have institutionalized hazard mitigation programs. Six primary mitigation practices defined by FEMA are:
• Emergency Services – measures that protect people during and after a hazard.
• Natural Resource Protection – opportunities to preserve and restore natural areas and their function to reduce the impact of hazards.
• Prevention – measures that are designed to keep the problem from occurring or getting worse.
• Property Protection – measures that are used to modify buildings subject to hazard damage rather than to keep the hazard away.
• Public Information – those activities that advise property owners, potential property owners, and visitors about the hazards, ways to protect themselves and their property from the hazards.
• Structural Control – physical measures used to prevent hazards from reaching a property.
4.2.1 Existing Mitigation Practices
As part of this planning effort, the Committee discussed the strengths and weaknesses of existing mitigation practices and made recommendations for improvements, as well as suggested new practices. The following is a summary of existing hazard mitigation practices within Hamilton County. Mitigation measures that were included in the 2006 Hamilton County MHMP are noted as such.
Emergency Services
• The individual municipalities own and maintain 75 outdoor warning sirens providing approximately 50% coverage for Hamilton County. (2006 Measure)
• The Hamilton County EMA maintains a Memorandum of Understanding with neighboring communities which provide overlapping coverage for outdoor warning sirens. (2006 Measure).
• The County is investigating potential options for mass alerts for hazardous events. (2006 Measure)
• Weather radios are encouraged throughout the County during presentations, events, and on the EMA website. (2006 Measure)
• Stream gages are utilized for flood forecasting and flood warnings for various stream levels. (2006 Measure)
Hamilton County MHMP Update November 2013
79
Natural Resource Protection
• Hamilton County, the Town of Arcadia, the City of Carmel, the Town of Cicero, the City of Fishers, the City of Noblesville, the Town of Sheridan, and the Town of Westfield are in good standing with the NFIP Program and have flood protection ordinances which meet minimum requirements.
• The MS4 communities enforce erosion and sediment control practices during construction activities to prevent the restriction of conveyances from sedimentation. (2006 Measure)
Prevention
• Hamilton County and the City of Noblesville participate in the CRS program at a Class 7 and 8 (respectively) which provides a reduction in flood insurance premiums throughout those jurisdictions. (2006 Measure)
• Information related to hazard mitigation has been incorporated, where appropriate, into individual Comprehensive Land Use Plans and other long-range plans. (2006 Measure)
• Hazard Zones have been incorporated into Zoning Ordinances (where appropriate) to limit development in some critical areas. (2006 Measure)
• Several watershed studies, Stormwater Master Plans, hydraulic and hydrologic modeling have been completed in areas of concern. Hamilton County is a Cooperative Technical Partner with FEMA. (2006 Measure)
• Several representatives from the more urban municipalities participate in the Indiana Association of Floodplain and Stormwater Managers (INAFSM) or are certified as a CFM. (2006 Measure)
• Hamilton County and several municipalities have developed GIS databases which are used in land use planning decisions and can be utilized in HAZUS-MH “what-if” scenarios. (2006 Measure)
• The Hamilton County LEPC maintains training and reporting records for hazmat facilities and provides training for the proper storage, transport, and disposal of hazardous materials. (2006 Measure)
• Electric providers routinely complete preventative maintenance on trees within the ROW and utility corridor. (2006 Measure)
• Local developers routinely bury new and retrofitted utilities to minimize exposure to hazards. (2006 Measure)
Property Protection

Hamilton County MHMP Update November 2013
80
• All communities follow the International Building Code which includes requirements to minimize damages from natural hazards.
• The City of Noblesville has purchased nearly 70 frequently flooded properties with planning underway to purchase an additional 40 properties in the future.
• Hamilton County is currently planning to purchase 5 parcels to reduce losses associate with repeated flooding damages.
Public Information
• Outreach materials are routinely provided within office and agencies throughout Hamilton County, large public events, speaking opportunities within schools, etc. (2006 Measure)
Structural Control
• Stormwater conveyances and regulated drains are maintained on a routine basis to prevent localized flooding, increased erosion, and material deposition as a result of rainfall or snowmelt. (2006 Measure)
4.2.2 Proposed Mitigation Practices
After reviewing existing mitigation practices, the Committee reviewed the list of mitigation ideas for each of the hazards studied as a part of this planning effort and identified which of these they felt best met their needs as a community according to selected social, technical, administrative, political, and legal criteria. The following identifies the key considerations for each evaluation criteria:
• Social – the proposed mitigation projects will have community acceptance, they are compatible with present and future community values, and do not adversely affect one segment of the population.
• Technical – the proposed mitigation project will be technically feasible, reduce losses in the long-term, and will not create more problems than they solve.
• Administrative – the proposed mitigation projects may require additional staff time, alternative sources of funding, and have some maintenance requirements.
• Political – the proposed mitigation projects will have political and public support.
• Legal – the proposed mitigation projects will be implemented through the laws, ordinances, and resolutions that are in place.
• Economic – the proposed mitigation projects can be funded in current or upcoming budget cycles.

Hamilton County MHMP Update November 2013
81
• Environmental – the proposed mitigation projects may have negative consequences on environmental assets such as wetlands, threatened or endangered species, or other protected natural resources.
Table 4-1 lists a summary of all proposed mitigation practices identified for all hazards, as well as information on the local status, local priority, benefit-cost ratio, project location, responsible entity, and potential funding source, associated with each proposed practice. The proposed mitigation practices are listed in order of importance to Hamilton County for implementation. Projects identified by the Committee to be of “high” local priority may be implemented within 5 years from final Plan adoption. Projects identified to be of “moderate” local priority may be implemented within 5-10 years from final Plan adoption, and projects identified by the Committee to be of “low” local priority may be implemented within 10+ years from final Plan adoptions. However, depending on availability of funding, some proposed mitigation projects may take longer to implement.
The benefit derived from each mitigation practice along with the estimated cost of that practice was utilized to identify the mitigation practices having a high, moderate, or low benefit cost ratio. Preparing detailed benefit cost ratios was beyond the scope of this planning effort and the intent of the MHMP.
The update of this MHMP is a necessary step of a multi-step process to implement programs, policies, and projects to mitigate the effect of hazards in Hamilton County. The intent of this planning effort was to identify the hazards and the extent to which they affect Hamilton County and to determine what type of mitigation strategies or practices may be undertaken to mitigate for these hazards. A FEMA-approved MHMP is required in order to apply for and/or receive project grants under the HMGP, PDM, FMA, and SRL. FEMA may require a MHMP under the Repetitive Flood Claims (RFC) program. Although this MHMP meets the requirements of DMA 2000 and eligibility requirements of these grant programs additional detailed studies may need to be completed prior to applying for these grants. Section 5.0 of this plan includes an implementation plan for all high priority mitigation practices identified by the Committee.
The CRS program credits NFIP communities a maximum of 72 points for setting goals to reduce the impact of flooding and other known natural hazards; identifying mitigation projects that include activities for prevention, property protection, natural resource protection, emergency services, structural control projects, and public information.

Hamilton County MHMP Update November 2013
82
This page intentionally blank

Hamilton County MHMP Update November 2013
83
Table 4-1 Proposed Mitigation Practices
MITIGATION PRACTICE MITIGATION STRATEGY HAZARD ADDRESSED STATUS PRIORITY BENEFIT-COST RATIO
RESPONSIBLE ENTITY
FUNDING SOURCE
Emergency Preparedness & Warning 1. Obtain additional mobile electronic
messaging boards and investigate the potential to install permanent message boards to utilize during hazard events.
2. Provide weather radios in all critical infrastructure.
3. Increase utilization of hazard broadcast system or mass alert system.
4. Prepare a detailed flood response and evacuation plan to improve response and reduce losses from a flood event.
5. Improve outdoor warning siren coverage to alert populations of severe weather conditions.
6. Propose and adopt an ordinance to require developers to pay to install additional outdoor warning sirens for new developments or pay into a siren fund as part of new development.
Emergency Services Nat. Res. Protection Prevention Property Protection Public Information Structural Control
Drought Earthquake Flood Hail/Thunder/Wind Tornado Winter Storm/Ice Dam/Levee Failure HazMat Incident
Ongoing – 1. Limited number of mobile electronic messaging
boards. 2. Many weather radios have been provided through
outreach efforts. 3. Hamilton County is investigating the available mass
notification systems to provide alerts to potentially affected areas and populations.
5. Outdoor warning sirens cover much of the urban areas within the County
Proposed Enhancements – 1. Purchase and utilize additional mobile message
boards. 2. Continue to provide weather radios at public events
and as funding allows. 3. Determine and acquire the best appropriate mass
notification system. 4. Prepare plans for individual communities 5. Purchase and install additional outdoor warning
sirens in rural areas 6. Adopt local ordinance requiring payment for
additional outdoor warning sirens
High
High EMA Red Cross Floodplain Administrator (County, Atlanta, Arcadia, Carmel, Cicero, Fishers, Noblesville, Sheridan, Westfield)
Existing budget Grant
Management of High Hazard Dams and Levees 1. Request that all dam inspection
documentation and IEAP update are forwarded to the EMA and encourage dam owners to make necessary repairs to improve structural conditions.
2. Prepare IEAP and inundation mapping for Keystone Woods Lake Dam.
3. Alert property owners in the dam failure inundation areas or in the areas protected by levees about the potential hazards.
Emergency Services Nat. Res. Protection Prevention Property Protection Public Information Structural Control
Drought Earthquake Flood Hail/Thunder/Wind Tornado Winter Storm/Ice Dam/Levee Failure HazMat Incident
Ongoing – 1. IDNR receives inspection reports and IEAP updates Proposed Enhancements – 1. Ensure inspections are reported and required
improvements and repairs are completed in a timely manner
2. Complete IEAP and inundation mapping 3. Inventory property owners in potential inundation
areas and provide an annual alert of the risk associated with the dam or the levee.
High
High Dam / Levee Owners EMA IDNR
Existing budget
Tree Maintenance 1. Purchase ROW easements to assist in
preventing the planting of improper tree species or the overgrowth of existing trees and/or vegetation under power lines.
Emergency Services Nat. Res. Protection Prevention Property Protection Public Information Structural Control
Drought Earthquake Flood Hail/Thunder/Wind Tornado Winter Storm/Ice Dam/Levee Failure HazMat Incident
Ongoing – Proposed Enhancement – 1. Purchase prioritized ROW areas and maintain
existing trees to reduce the risk
High Moderate County Highway Municipal Street Departments (Atlanta, Arcadia, Carmel, Cicero, Fishers, Noblesville, Sheridan, Westfield)
Existing Budget Power Suppliers

Hamilton County MHMP Update November 2013
84
MITIGATION PRACTICE MITIGATION STRATEGY HAZARD ADDRESSED STATUS PRIORITY BENEFIT-COST RATIO
RESPONSIBLE ENTITY
FUNDING SOURCE
Power Back-Up Generators 1. Promote power back-up generators in all
critical infrastructures. (2006 Measure) 2. Obtain funding to retrofit public facilities
and/or all critical infrastructures with appropriate wiring and electrical capabilities for utilizing a large generator for power back-up.
3. Obtain and install battery back-ups for integral intersections within the municipalities.
Emergency Services Nat. Res. Protection Prevention Property Protection Public Information Structural Control
Drought Earthquake Flood Hail/Thunder/Wind Tornado Winter Storm/Ice Dam/Levee Failure HazMat Incident
Ongoing – 1. Many critical infrastructure have generators Proposed Enhancements – 2. Retrofit critical infrastructure with generator
capabilities as feasible 3. Install back up power for intersection traffic lights
High
Low Building owners EMA
Existing budget Grant
Safe Rooms and Community Shelters 1. Encourage the construction of safe rooms
in all new municipal facilities and incentives for private buildings with approved safe rooms.
2. Clearly advertise or announce locations of safe rooms and community shelters for large gatherings of people. (football games, 4H Fair, etc.)
3. Continue to establish “pet friendly” shelters at appropriate locations throughout Hamilton County.
Emergency Services Nat. Res. Protection Prevention Property Protection Public Information Structural Control
Drought Earthquake Flood Hail/Thunder/Wind Tornado Winter Storm/Ice Dam/Levee Failure HazMat Incident
Ongoing – 1. Some areas provide announcements prior to or
during large gatherings 3. Work has begun for “pet friendly” shelters Proposed Enhancement – 1. Encourage safe rooms and provide incentives 2. Increase the number of spoken or printed
announcements during large gatherings 3. Increase the number of “pet friendly” shelters
High Low EMA Large gathering liaisons Red Cross
Grant Developers or Builders
Water Conservation Ordinance 1. Develop standard procedures for issuing
an open burning ban during dry periods.
Emergency Services Nat. Res. Protection Prevention Property Protection Public Information Structural Control
Drought Earthquake Flood Hail/Thunder/Wind Tornado Winter Storm/Ice Dam/Levee Failure HazMat Incident
Ongoing – 1. Burn bans have been issued during previous dry
periods Proposed Enhancement – 1. Establish consistent and standard procedures for
issuing burn bans
High Low Code Enforcement Planning
Existing budget
Geographic Information Systems 1. Enhance existing GIS system to
incorporate county-wide data on a consistent platform.
2. Train GIS staff in HAZUS-MH to quantitatively estimate losses in “what if scenarios” and continue to use the most recent GIS data in land use planning efforts.
Emergency Services Nat. Res. Protection Prevention Property Protection Public Information Structural Control
Drought Earthquake Flood Hail/Thunder/Wind Tornado Winter Storm/Ice Dam/Levee Failure HazMat Incident
Ongoing – 1. GIS is used by several communities
Proposed Enhancement – 1. Create a consistent platform county-wide 2. Additional training for GIS staff
High (Enhance GIS) Moderate (Training)
High GIS Departments Existing Budget

Hamilton County MHMP Update November 2013
85
MITIGATION PRACTICE MITIGATION STRATEGY HAZARD ADDRESSED STATUS PRIORITY BENEFIT-COST RATIO
RESPONSIBLE ENTITY
FUNDING SOURCE
Public Education & Outreach 1. Provide multi-lingual hazard
preparedness literature (warning sirens, radio stations, go-kits, insurance protection, lightning rods, etc.) at public facilities and events and to populations within known hazard areas such as floodplains, downstream of a dam, near hazmat facilities, etc. (2006 Measure)
2. Complete ALOHA analysis for all Tier II Facilities.
3. Inform residents that earthquake damage may not be covered under certain homeowner’s insurance policies.
4. Survey traffic patterns to determine most traveled routes (other than interstates) and contents of transportation vehicles.
Emergency Services Nat. Res. Protection Prevention Property Protection Public Information Structural Control
Drought Earthquake Flood Hail/Thunder/Wind Tornado Winter Storm/Ice Dam/Levee Failure HazMat Incident
Ongoing – 1. Literature is provided at several public facilities and
office locations as well as large public events throughout Hamilton County. Populations within the special flood hazard areas are educated through required flood insurance purchases and various website and literature pieces.
2. ALOHA analysis has been completed for Tier II facilities within Noblesville
Proposed Enhancement – 1. Encourage the enhancement of the messages
provided to various cultural groups and neighborhoods; Educate landowners within the dam inundation areas and levee-protected areas of the potential dangers and what to do in an emergency situation. Such as encourage voluntary purchase of federally-subsidized flood insurance; formalize a neighborhood or local campaign where community representatives familiar with the culture and language provide residents with emergency information and protocols.
2. Develop ALOHA analysis for all other Tier II facilities 3. Develop a specific literature piece regarding
homeowner’s insurance and earthquake damage 4. Complete traffic pattern survey
High (Literature, ALOHA) Moderate (Earthquake insurance, traffic patterns)
High EMA Red Cross Municipal Offices (Atlanta, Arcadia, Carmel, Cicero, Fishers, Noblesville, Sheridan, Westfield)
Existing budget Grant
Building Protection 1. Encourage property owners in known
hazard areas to have proper insurance coverage to protect their property and assets from potential damage.
2. Protect existing critical infrastructure in 1% & 0.2% annual chance flood hazard. (2006 Measure)
3. Prohibit development of new critical infrastructure in 1% & 0.2% annual chance flood hazard. (2006 Measure)
4. Investigate possible mitigation measures for frequently flooded roads and intersections.
5. Relocate, buyout, or floodproof (non-residential) existing non-critical structures that are subject to repetitive flooding. (2006 Measure)
(Will assist with NFIP compliance)
Emergency Services Nat. Res. Protection Prevention Property Protection Public Information Structural Control
Drought Earthquake Flood Hail/Thunder/Wind Tornado Winter Storm/Ice Dam/Levee Failure HazMat Incident
Ongoing – 2. There are additional requirements for construction
within floodplains throughout Hamilton County. Proposed Enhancements – 1. Include insurance options (above flood insurance) to
protect structures from additional hazards. 2. Determine needs and encourage protection of
existing structures 3. Continue to discourage development within
floodplains. 4. Investigate frequent flooding areas and implement
recommendations to reduce flooding. 5. Prioritize structures located in floodplains or other
known hazard areas and work with facility owners to relocate, buyout, or floodproof these structures to a minimum of 500-year protection with flood-free access.
High (Insurance, Protect existing, prohibit ne ) Moderate (relocate, buyout, floodproof)
Moderate Building / Infrastructure owners EMA Floodplain Administrator (County, Atlanta, Arcadia, Carmel, Cicero, Fishers, Noblesville, Sheridan, Westfield) Public Works Planning County Surveyor / Drainage Board
Grant Existing budget Municipal Bond
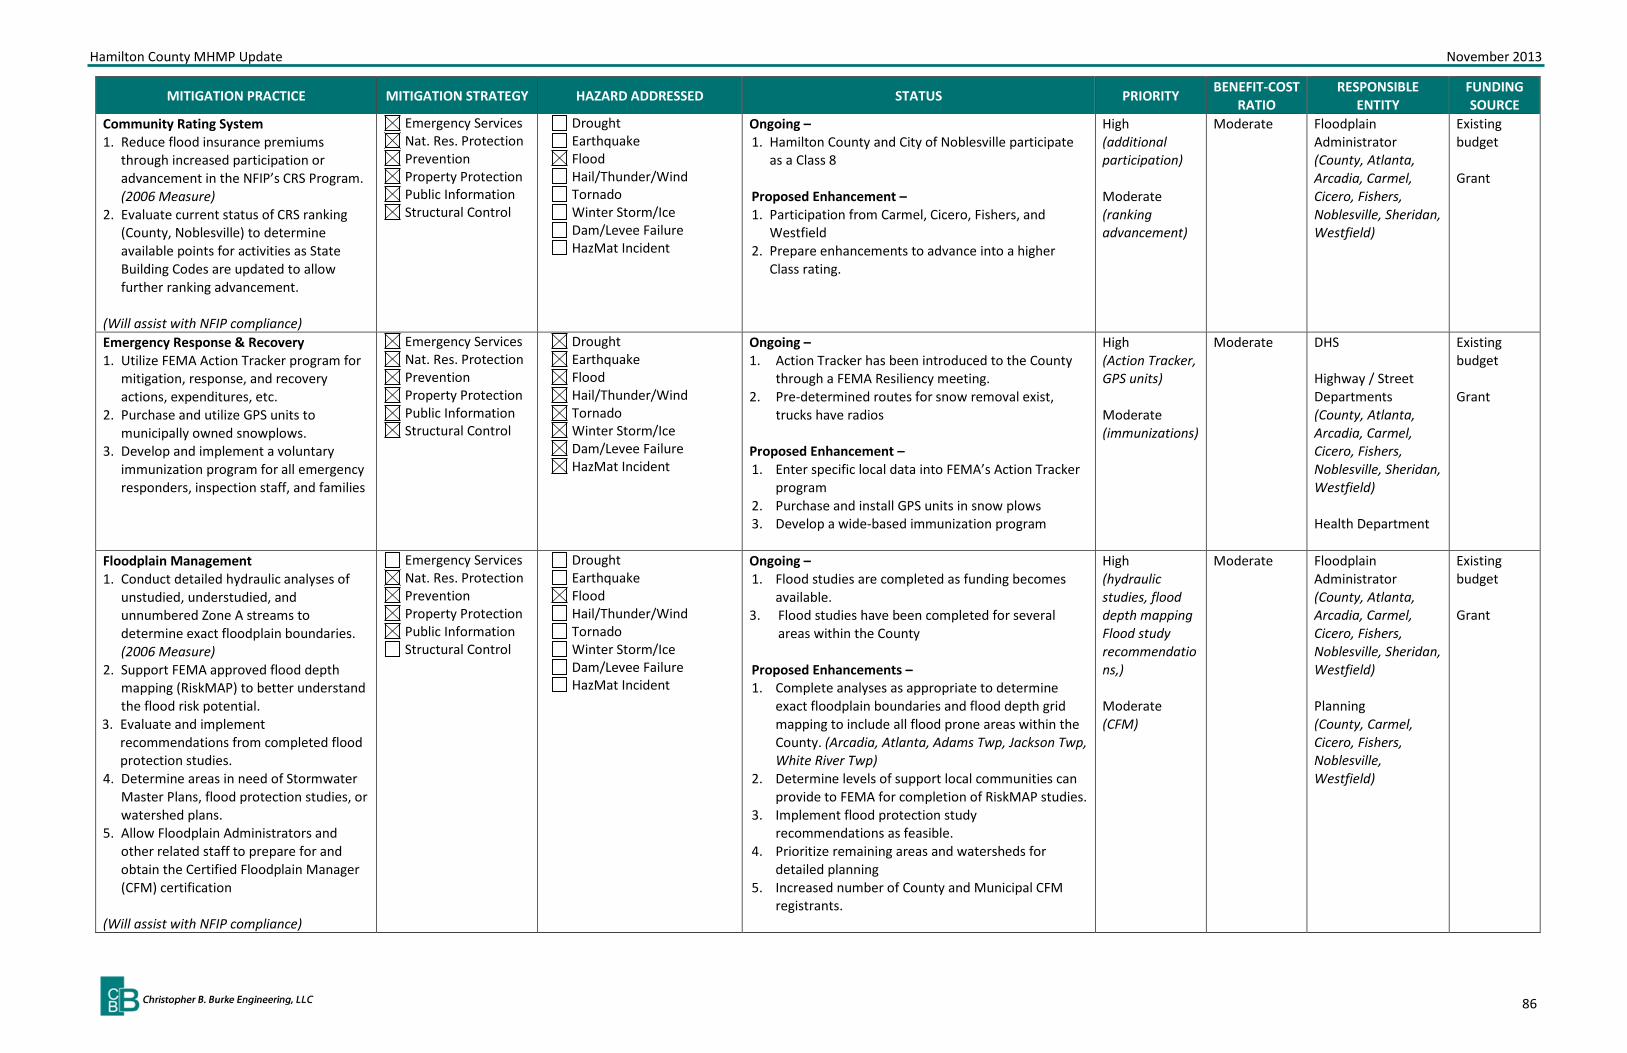
Hamilton County MHMP Update November 2013
86
MITIGATION PRACTICE MITIGATION STRATEGY HAZARD ADDRESSED STATUS PRIORITY BENEFIT-COST RATIO
RESPONSIBLE ENTITY
FUNDING SOURCE
Community Rating System 1. Reduce flood insurance premiums
through increased participation or advancement in the NFIP’s CRS Program. (2006 Measure)
2. Evaluate current status of CRS ranking (County, Noblesville) to determine available points for activities as State Building Codes are updated to allow further ranking advancement.
(Will assist with NFIP compliance)
Emergency Services Nat. Res. Protection Prevention Property Protection Public Information Structural Control
Drought Earthquake Flood Hail/Thunder/Wind Tornado Winter Storm/Ice Dam/Levee Failure HazMat Incident
Ongoing – 1. Hamilton County and City of Noblesville participate
as a Class 8 Proposed Enhancement – 1. Participation from Carmel, Cicero, Fishers, and
Westfield 2. Prepare enhancements to advance into a higher
Class rating.
High (additional participation) Moderate (ranking advancement)
Moderate Floodplain Administrator (County, Atlanta, Arcadia, Carmel, Cicero, Fishers, Noblesville, Sheridan, Westfield)
Existing budget Grant
Emergency Response & Recovery 1. Utilize FEMA Action Tracker program for
mitigation, response, and recovery actions, expenditures, etc.
2. Purchase and utilize GPS units to municipally owned snowplows.
3. Develop and implement a voluntary immunization program for all emergency responders, inspection staff, and families
Emergency Services Nat. Res. Protection Prevention Property Protection Public Information Structural Control
Drought Earthquake Flood Hail/Thunder/Wind Tornado Winter Storm/Ice Dam/Levee Failure HazMat Incident
Ongoing – 1. Action Tracker has been introduced to the County
through a FEMA Resiliency meeting. 2. Pre-determined routes for snow removal exist,
trucks have radios
Proposed Enhancement – 1. Enter specific local data into FEMA’s Action Tracker
program 2. Purchase and install GPS units in snow plows 3. Develop a wide-based immunization program
High (Action Tracker, GPS units) Moderate (immunizations)
Moderate DHS Highway / Street Departments (County, Atlanta, Arcadia, Carmel, Cicero, Fishers, Noblesville, Sheridan, Westfield) Health Department
Existing budget Grant
Floodplain Management 1. Conduct detailed hydraulic analyses of
unstudied, understudied, and unnumbered Zone A streams to determine exact floodplain boundaries. (2006 Measure)
2. Support FEMA approved flood depth mapping (RiskMAP) to better understand the flood risk potential.
3. Evaluate and implement recommendations from completed flood protection studies.
4. Determine areas in need of Stormwater Master Plans, flood protection studies, or watershed plans.
5. Allow Floodplain Administrators and other related staff to prepare for and obtain the Certified Floodplain Manager (CFM) certification
(Will assist with NFIP compliance)
Emergency Services Nat. Res. Protection Prevention Property Protection Public Information Structural Control
Drought Earthquake Flood Hail/Thunder/Wind Tornado Winter Storm/Ice Dam/Levee Failure HazMat Incident
Ongoing – 1. Flood studies are completed as funding becomes
available. 3. Flood studies have been completed for several
areas within the County Proposed Enhancements – 1. Complete analyses as appropriate to determine
exact floodplain boundaries and flood depth grid mapping to include all flood prone areas within the County. (Arcadia, Atlanta, Adams Twp, Jackson Twp, White River Twp)
2. Determine levels of support local communities can provide to FEMA for completion of RiskMAP studies.
3. Implement flood protection study recommendations as feasible.
4. Prioritize remaining areas and watersheds for detailed planning
5. Increased number of County and Municipal CFM registrants.
High (hydraulic studies, flood depth mapping Flood study recommendations,) Moderate (CFM)
Moderate Floodplain Administrator (County, Atlanta, Arcadia, Carmel, Cicero, Fishers, Noblesville, Sheridan, Westfield) Planning (County, Carmel, Cicero, Fishers, Noblesville, Westfield)
Existing budget Grant

Hamilton County MHMP Update November 2013
87
MITIGATION PRACTICE MITIGATION STRATEGY HAZARD ADDRESSED STATUS PRIORITY BENEFIT-COST RATIO
RESPONSIBLE ENTITY
FUNDING SOURCE
Stormwater Management 1. Assess areas of development or re-
development for the applicable uses of Low Impact Development to assist with on-site stormwater management.
Emergency Services Nat. Res. Protection Prevention Property Protection Public Information Structural Control
Drought Earthquake Flood Hail/Thunder/Wind Tornado Winter Storm/Ice Dam/Levee Failure HazMat Incident
Ongoing – 1. Municipalities are installing LID practices in
appropriate locations to increase on-site stormwater management
Proposed Enhancement – 1. Additional practices are installed throughout the
County where appropriate.
Moderate Moderate Stormwater Departments (County, Carmel, Cicero, Fishers, Noblesville, Westfield) Planning Departments (County, Carmel, Cicero, Fishers, Noblesville, Westfield)
Existing Budget

Hamilton County MHMP Update November 2013
88
This page intentionally blank
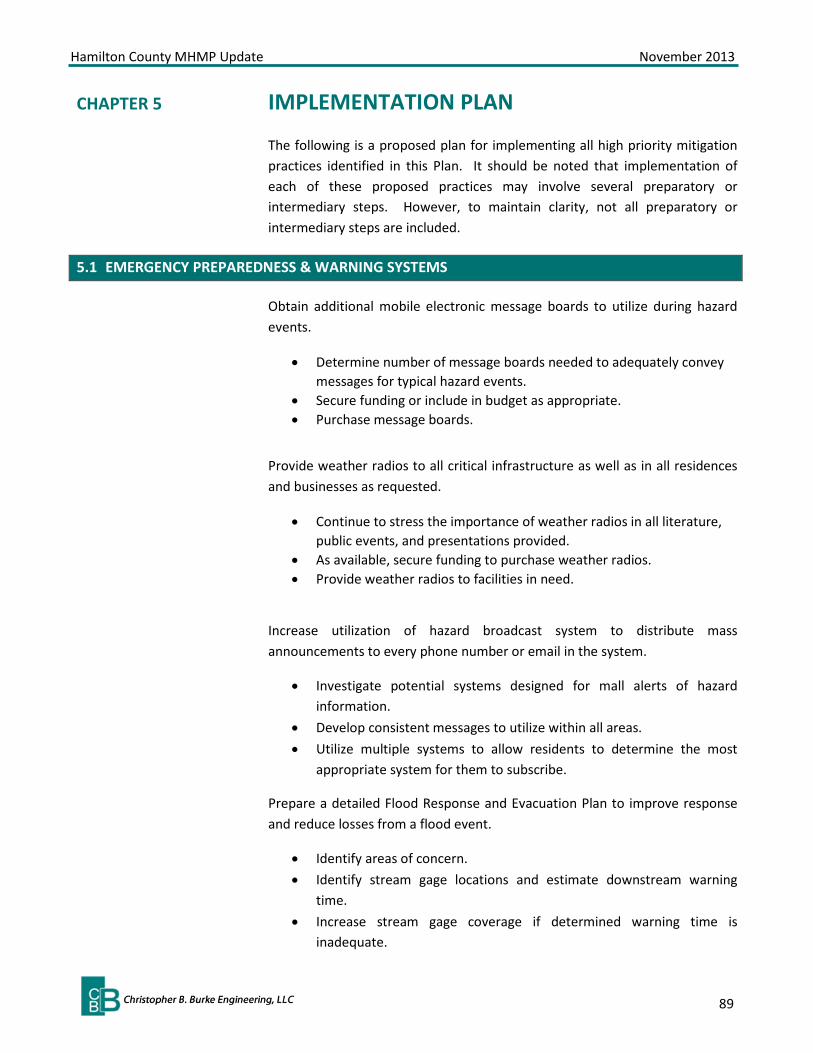
Hamilton County MHMP Update November 2013
89
CHAPTER 5 IMPLEMENTATION PLAN
The following is a proposed plan for implementing all high priority mitigation practices identified in this Plan. It should be noted that implementation of each of these proposed practices may involve several preparatory or intermediary steps. However, to maintain clarity, not all preparatory or intermediary steps are included.
5.1 EMERGENCY PREPAREDNESS & WARNING SYSTEMS
Obtain additional mobile electronic message boards to utilize during hazard events.
• Determine number of message boards needed to adequately convey messages for typical hazard events.
• Secure funding or include in budget as appropriate. • Purchase message boards.
Provide weather radios to all critical infrastructure as well as in all residences and businesses as requested.
• Continue to stress the importance of weather radios in all literature, public events, and presentations provided.
• As available, secure funding to purchase weather radios. • Provide weather radios to facilities in need.
Increase utilization of hazard broadcast system to distribute mass announcements to every phone number or email in the system.
• Investigate potential systems designed for mall alerts of hazard information.
• Develop consistent messages to utilize within all areas. • Utilize multiple systems to allow residents to determine the most
appropriate system for them to subscribe.
Prepare a detailed Flood Response and Evacuation Plan to improve response and reduce losses from a flood event.
• Identify areas of concern. • Identify stream gage locations and estimate downstream warning
time. • Increase stream gage coverage if determined warning time is
inadequate.

Hamilton County MHMP Update November 2013
90
• Utilize flood forecasting capabilities include stream gages, flood forecasting maps, and flood alerts to determine potential inundation areas.
• Establish event detection, notification and communication, expected actions, and termination and follow-up procedures.
Improve outdoor warning siren coverage to alert population of severe weather conditions.
• Evaluate areas in need of additional outdoor warning sirens (based on population and distance from nearest siren).
• Prioritize areas in need. • Secure funding and install additional sirens.
Propose and adopt an ordinance to require developers to pay to install additional sirens for new developments or pay into a siren fund as part of new development.
• Review ordinance language from other communities. • Prepare consistent ordinance language from each community. • Adopt an ordinance.
5.2 MANAGEMENT OF HIGH HAZARD DAMS & LEVEES
Request all dam and levee inspection reports and IEAP updates are sent to the EMA.
• Contact IDNR to request duplicate copies of dam and levee inspection reports
• Contact appropriate private owners to request duplicate dam and levee inspection reports
• Track inspections, actions, etc. to better assess risk to property owners.
Prepare an IEAP and inundation mapping for Keystone Woods Lake Dam.
• Contact the dam owner and provide information on developing an IEAP for the dam.
• Encourage inundation mapping to better assess the risk area downstream of the dam.
• Partner with the dam owner and IDNR to provide outreach materials to property owners within the inundation area.
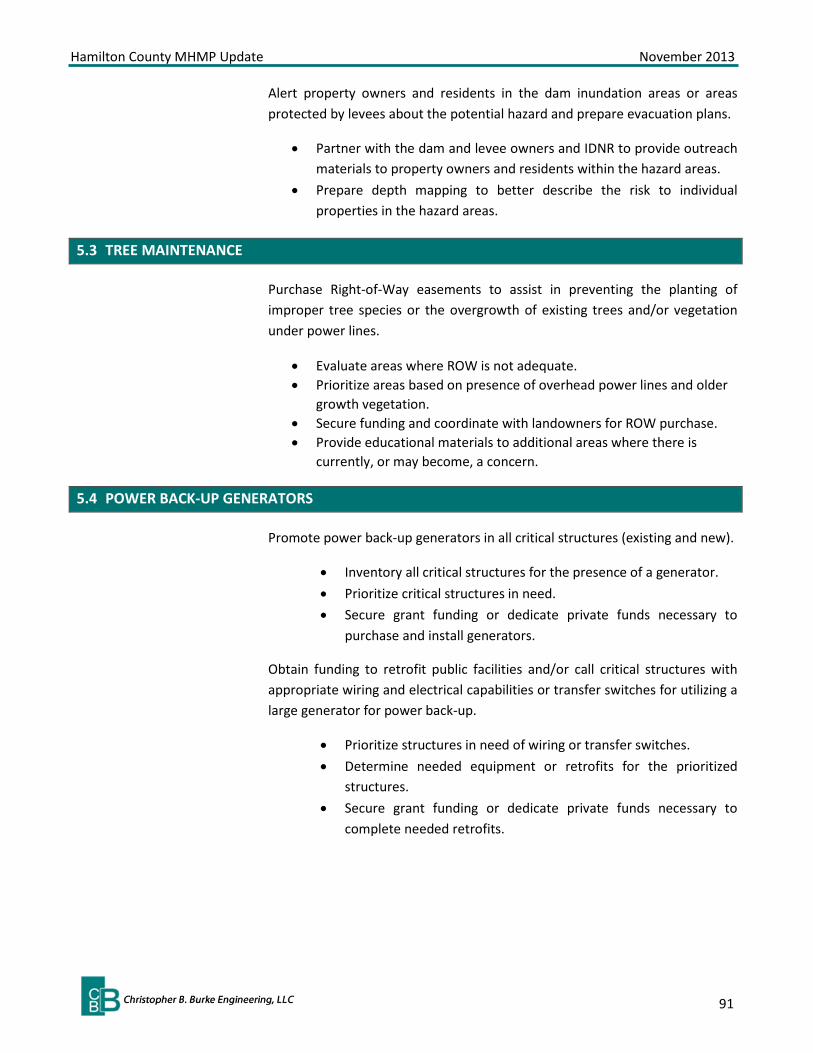
Hamilton County MHMP Update November 2013
91
Alert property owners and residents in the dam inundation areas or areas protected by levees about the potential hazard and prepare evacuation plans.
• Partner with the dam and levee owners and IDNR to provide outreach materials to property owners and residents within the hazard areas.
• Prepare depth mapping to better describe the risk to individual properties in the hazard areas.
5.3 TREE MAINTENANCE
Purchase Right-of-Way easements to assist in preventing the planting of improper tree species or the overgrowth of existing trees and/or vegetation under power lines.
• Evaluate areas where ROW is not adequate. • Prioritize areas based on presence of overhead power lines and older
growth vegetation. • Secure funding and coordinate with landowners for ROW purchase. • Provide educational materials to additional areas where there is
currently, or may become, a concern.
5.4 POWER BACK-UP GENERATORS
Promote power back-up generators in all critical structures (existing and new).
• Inventory all critical structures for the presence of a generator. • Prioritize critical structures in need. • Secure grant funding or dedicate private funds necessary to
purchase and install generators.
Obtain funding to retrofit public facilities and/or call critical structures with appropriate wiring and electrical capabilities or transfer switches for utilizing a large generator for power back-up.
• Prioritize structures in need of wiring or transfer switches. • Determine needed equipment or retrofits for the prioritized
structures. • Secure grant funding or dedicate private funds necessary to
complete needed retrofits.

Hamilton County MHMP Update November 2013
92
Obtain and install battery back-ups for stop lights at integral intersections within the municipalities.
• Inventory major intersections throughout the County. • Prioritize intersections based on traffic patterns, car counts, and
evacuation routes. • Secure grant funding to purchase and install battery back-up
systems.
5.5 SAFE ROOMS & COMMUNITY SHELTERS
Encourage the construction of safe rooms in all new municipal facilities and incentives for private buildings with approved safe rooms.
• Investigate incentives offered in other communities or States. • Include language within local ordinances and review protocols
that requires the consideration of safe rooms in all new municipal facilities.
Clearly advertise/announce location of safe rooms and community shelters for large gatherings of people (Football games, 4H Fair, etc.)
• Collaborate with local entities responsible for large outdoor gatherings (sporting events, festivals, etc.)
• Determine location of nearest shelter area and personnel responsible for ensuring the shelter is available during the outdoor event.
• Announce or advertise the location of shelter during the event.
Continue to establish “pet friendly” shelters at appropriate locations throughout the County.
• Evaluate existing pet friendly locations. • Determine if additional locations are needed and in which areas. • Coordinate with property owners to develop procedures for
opening shelters.
5.6 WATER CONSERVATION ORDINANCE
Develop standard procedures for issuing an open burning ban during dry periods.
• Evaluate existing ordinance language and contingency plans from other communities.

Hamilton County MHMP Update November 2013
93
• Determine conditions which would necessitate an open burning ban.
• Educate law enforcement and officials of the procedures. • Develop language that clearly describes the ban and the potential
consequences.
5.7 GEOGRAPHIC INFORMATION SYSTEMS
Enhance existing GIS system to incorporate county-wide data on a consistent platform.
• Evaluate existing GIS capabilities and protocols of each community.
• Coordinate GIS information into a comprehensive systems with varied levels of access.
• Develop standardized protocols for the county-wide platform.
5.8 PUBLIC EDUCATION & OUTREACH
Provide multi-lingual hazard preparedness (warning sirens, radio stations, go-kits, insurance protection, lightning rods, etc.) literature at public facilities and events and to populations within known hazard areas such as floodplains, downstream of a dam, near hazmat facilities, etc. as appropriate.
• Distribute literature at large public events throughout the County. • Provide literature at all municipal offices as appropriate. • Evaluate additional media outlets and utilize as appropriate (social
media, print, billing inserts, etc.) Complete ALOHA analysis for all Tier II facilities.
• Review existing ALOHA information completed for Tier II facilities within Noblesville.
• Prioritize remaining Tier II facilities throughout the County. • Develop ALOHA analysis for remaining facilities.
5.9 BUILDING PROTECTION
Encourage property owners in known hazard areas to have proper insurance coverage to protect their property and assets from potential damage.
• Overlay known hazard area delineations onto parcel information. • Develop listing of property owners and residents.

Hamilton County MHMP Update November 2013
94
• Mail annual postcard, letter, or other announcement indicating the potential need for insurance coverage.
Protect existing critical infrastructure (and access/egress routes) in floodplains.
• Review list of critical infrastructure and determine which structures need to be in the floodplains (bridges, lift stations, etc.)
• Determine feasibility of flood-proofing individual structures. • Provide information to infrastructure owners.
Prohibit developments of new critical infrastructure in the 100-year and 500-year floodplains.
• Review examples of ordinance language from other communities. • Develop ordinance language specific to Hamilton County and/or
communities within. • Provide support for the adoption of such ordinance language.
Investigate possible mitigation measures for frequently flooded roads and intersections.
• Complete inventory of all frequently flooded roads and intersections.
• Review most recent FIRMs and local watershed plans, stormwater master plans, etc.
• Prioritize roads and intersections for further study.
5.10 COMMUNITY RATING SYSTEM
Reduce flood insurance premiums through increased participation and advancement in the NFIP’s CRS Program.
• Review application and guidance materials and begin gathering supporting documentation.
• Complete application and calculate credits. • Consult with ISO representative to review application prior to
submission. • Submit application for advancement within the CRS program. • Maintain and record information as necessary for annual
recertification.

Hamilton County MHMP Update November 2013
95
5.11 EMERGENCY RESPONSE & RECOVERY
Utilize FEMA Action Tracker program for mitigation, response and recovery actions, expenditures, etc.
• Review components of Action Tracker. • Designate a coordinator for each community. • Update Action Tracker with information specific to resources,
actions, and needs within each community.
Add GPS to municipally owned snow plows.
• Determine number of GPS systems needed for each community. • Secure grant funding or provide a budgetary line item. • Purchase and install GPS systems.
5.12 FLOODPLAIN MANAGEMENT
Conduct detailed hydraulic analyses of unstudied, understudied, and unnumbered Zone A streams to determine exact floodplain boundaries.
• Review listing of unstudied streams and floodprone areas. • Secure funding, municipal bond, or funds from existing budgets to
complete floodplain studies. • Update the Floodplain Prioritization Study to direct future analyses. • Establish a template for these studies and distribute to developers to
ensure consistency from reach to reach.
Support FEMA approved flood depth mapping (RiskMAP) to better understand the flood risk potential.
• Prioritize areas of greatest potential impact from flooding. • Review effective floodplain boundaries. • Secure funding and prepare a depth map to indicate the flood risk
potential as a depth of water in affected areas. • Inform land and property owners of the potential risk to their property
and structures.
Evaluate and implement recommendations of completed flood protection studies and Stormwater Master Plans.
• Review existing plans. • Prioritize recommendations based available funding, cost-benefit,
and the benefitted populations.
Hamilton County MHMP Update November 2013
96
• Secure or dedicate funding to implement recommendations.
Determine areas in need of Stormwater Master Plans, flood protection studies, or watershed plans.
• Review watersheds and areas within existing SWMPs, flood protection studies, etc.
• Prioritize remaining watershed in need of such planning efforts. • Secure or dedicate funding to develop such plans.

Hamilton County MHMP Update November 2013
97
REQUIREMENT §201.6(c)(4)(i): [The plan maintenance process shall include a] section describing the method and schedule of monitoring, evaluating, and updating the mitigation plan within a five-year cycle.
CHAPTER 6 PLAN MAINTENANCE PROCESS
6.1 MONITORING, EVALUATING, AND UPDATING THE PLAN
To effectively reduce social, physical, and economic losses in Hamilton County, it is important that implementation of this MHMP be monitored, evaluated, and updated. The EMA Director is ultimately responsible for the MHMP. As illustrated in Section 4.2 Mitigation Practices, this Plan contains mitigation program, projects, and policies from multiple departments within each NFIP community. Depending on grant opportunities and fiscal resources, mitigation practices may be implemented independently, by individual NFIP communities, or through local partnerships. Therefore the successful implementation of this MHMP will require the participation and cooperation of the entire Committee to successfully monitor, evaluate, and update the Hamilton County MHMP.
The EMA Director will reconvene the MHMP Committee on an annual basis and follow a significant hazard incident to determine whether:
• the nature, magnitude, and/or type of risk have changed • the current resources are appropriate for implementation • there are implementation problems, such as technical, political, legal,
or coordination issues with other agencies • the outcomes have occurred as expected • the agencies and other partners participated as originally proposed
During the annual meetings the Implementation Checklist provided in Appendix 9 will be helpful to track any progress, successes, and problems experienced.
The data used to prepare this MHMP was based on “best available data” or data that was readily available during the development of this Plan. Because of this, there are limitations to the data. As more accurate data becomes available, updates should be made to the list of critical infrastructure, the risk assessment and vulnerability analysis.

Hamilton County MHMP Update November 2013
98
REQUIREMENT §201.6(c)(4)(ii): [The plan shall include a] process by which local governments incorporate the requirements of the mitigation plan into other planning mechanisms such as the comprehensive or capital improvements, when appropriate.
DMA 2000 requires local jurisdictions to update and resubmit their MHMP within 5 years (from the date of FEMA approval) to continue to be eligible for mitigation project grant funding. In early 2018, the EMA Director will once again reconvene the MHMP Committee for a series of meetings designed to replicate the original planning process. Information gathered following individual hazard incidents and annual meetings will be utilized along with updated vulnerability assessments to assess the risks associated with each hazard common in Hamilton County. These hazards, and associated mitigation goals and practices will be prioritized and detailed as in Section 3.0 this MHMP. Sections 4.0 and 5.0 will be updated to reflect any practices implemented within the interim as well as any additional practices discussed by the Committee during the update process.
Prior to submission of the updated MHMP, a public meeting will be held to present the information to residents of Hamilton County and to provide them an opportunity for review and comment of the draft MHMP. A media release will be issued providing information related to the update, the planning process, and details of the public meeting.
6.2 INCORPORATION INTO EXISTING PLANNING MECHANISMS
Many of the mitigation practices identified as part of this planning process are ongoing with some enhancement needed. Where needed, modifications will be proposed to be made to each NFIP communities’ planning documents and ordinances during the regularly scheduled update. Among other things, local planning documents and ordinances may include comprehensive plans, floodplain management plans, zoning ordinances, building codes, site development regulations, or permits. Modifications include discussions related to hazardous material facility buffers, floodplain areas, and discouraging development of new critical infrastructure in known hazard areas.
Based on added language within each of the Comprehensive Plan updates the appropriate Zoning Ordinances and Floodplain Management Ordinances within each community would also need to be amended.

Hamilton County MHMP Update November 2013
99
REQUIREMENT §201.6(c)(4)(iii): [The plan maintenance process shall include a] discussion on how the community will continue public participation in the plan maintenance
6.3 CONTINUED PUBLIC INOLVEMENT
Continued public involvement is critical to the successful implementation of the Hamilton County MHMP. Comments gathered from the public on the MHMP will be received by the EMA Director and forwarded to the MHMP Committee for discussion. Education efforts for hazard mitigation will be the focus of the annual Severe Weather Awareness Week as well as incorporated into existing stormwater planning, land use planning, and special projects/studies efforts. Once adopted, a copy of this Plan will be available for the public to review in the EMA Office and the Hamilton County website.
Updates or modifications to the Hamilton County MHMP will require a public notice and/or meeting prior to submitting revisions to the individual jurisdictions for approval.
The CRS program credits NFIP communities a maximum of 37 points for adopting the Plan; establishing a procedure for implementation, review, and updating the Plan; and submitting an annual evaluation report.

Hamilton County MHMP Update November 2013
100
This page intentionally blank

Hamilton County MHMP Update November 2013
101
REFERENCES Association of State Floodplain Managers (ASFPM). No Adverse Impact: A Toolkit for Common Sense Floodplain Management. 2003. www.floods.org
Britt, Robert Roy. “New Data Confirms Strong Earthquake Risk to Central U.S.”. Live Science. June 22, 2005. www.livescience.com/3871-data-confirms-strong-earthquake-risk-central.html
Business Courier. “Ohio Winter Storm Losses Hit $17.5 Million”. March 11, 2003.
Christopher B. Burke Engineering, Ltd. “Hamilton County Critical Facility Flood Vulnerability Study”. March 2010.
Christopher B. Burke Engineering, Ltd. “Hamilton County Multi-Hazard Mitigation Plan”. 2006
Christopher B. Burke Engineering, Ltd. “Town of Fishers Stormwater Master Plan”. April 2010.
Christopher B. Burke Engineering, Ltd. “Mud Creek Watershed Master Plan”. February 2005.
Christopher B. Burke Engineering, Ltd. “Stony Creek Watershed Master Plan”. February 2005.
Christopher B. Burke Engineering, Ltd. “Williams Creek Watershed Master Plan”. May 2011.
Environmental Protection Agency. Multi-Resolution Land Characteristics Consortium. www.mrlc.gov
Federal Emergency Management Agency. “Community Ratings System”. www.fema.gov/nfip/crs.shtm
Federal Emergency Management Agency. 44 CFR Parts 201 and 206 Hazard Mitigation Planning and Hazard Mitigation Grant Program
Federal Emergency Management Agency. 2012 Preliminary Flood Insurance Rate Maps for Hamilton County, Indiana.
Federal Emergency Management Agency. “HAZUS-MH (v1.3) Earthquake Model”. 2007
Federal Emergency Management Agency. “Local Multi-Hazard Mitigation Planning Guidance”. July, 2008
Fowler, Kathleen K. “Description and Effects of 1988 Drought on Groundwater Flows, Streamflow, and Reservoir Levels in Indiana”. USGS, Water Resource Investigations Report 91-4100. Pg 91. 1992
Furlow, Steven. The Times of Noblesville, IN. “Quake Shakes Some in County”. December 30, 2010.
Hamilton County Emergency Management Agency. “Comprehensive Hazard Analysis”. January 2012.
Hamilton County Emergency Management Agency. “Mass Evacuation Plan”. July 2006.
Hansen, Michael C. “Earthquakes in Ohio”. Ohio Department of Natural Resources Division of Geological Survey. Educational Leaflet No. 9. 2005
Hamilton County MHMP Update November 2013
102
Indiana Department of Homeland Security. “Hazard Identification and Risk Assessment (HIRA) Tool” DRAFT.
Indiana Department of Homeland Security. “Severe Weather Preparedness” www.in.gov/dhs/3163.htm
Indiana Department of Environmental Management. Impaired Waters – Integrated Water Monitoring and Assessment Report. www.in.gov/idem/nps/2639.htm
Indiana Geological Survey. “Earthquakes in Indiana” www.igs.indiana.edu/earthquakes/
Institute for Business and Home Safety. www.disastersafety.org
Kocin, Paul J. National Centers for Environmental Prediction. “Some Thoughts on the Societal and Economic Impact of Winter Storms.” 1997
Midwestern Regional Climate Center. “Climate Summaries” http://mcc.sws.uius.edu/climate_midwest/mwclimate_data_summaries.htm#
National Oceanic and Atmospheric Administration. National Climate Data Center. www.ncdc.noaa.gov
National Oceanic and Atmospheric Administration. National Weather Service Office of Climate, Water, and Weather Services. “Heat: A Major Killer”. www.nws.noaa.gov/os/heat/index.shtml#wwa
National Oceanic and Atmospheric Administration. National Weather Service. “Wind Chill”. http://www.crh.noaa.gov/ddc/?n=windchill
National Oceanic and Atmospheric Administration. National Weather Service. Central Illinois Weather Forecast Office. “Earthquakes of April 18, 2008 and Aftershocks”.
Purdue University. Purdue Agricultural News. ”Indiana Crop Insurance Payouts Top $1 billion”. March 12, 2013
Runevitch, Jennie. WTHR-TV Channel 13. “Indiana Earthquake Strikes in Rare Location”. December 30, 2010. www.wthr.com/story/13760207/indiana-earthquake-strikes-in-rare-location
STATS Indiana. “Hamilton County, Indiana”. http://www.stats.indiana.edu/profiles
Stewart, Jennifer. The Times of Noblesville, IN. “Indiana Drought Worst on Crop Conditions Since ‘88”. July 5, 2012.
Strauss, Gary; Carolyn Pesce, and Dan Vergano. USA Today. “East is all shook up after strong earthquake for region”. August 25, 2011. www.usatoday.com/news/nation/story/2011-08-23/Easrthquake-rocks-East-Coast/50107542/1
Superfund Amendments and Reauthorization Act & Emergency Planning and Community Right to Know Act. 40 CFR 350-372
US Department of Agriculture. National Agricultural Statistics Service. “Indiana”. www.nass.usda.gov/statistics_by_state/indiana/index.asp

Hamilton County MHMP Update November 2013
103
US Drought Monitor. http://drought.unl.edu/dm
US Geological Survey. “Stream Gage Data”. http://waterdata.usgs.gov/nwis/si

Hamilton County MHMP Update November 2013
104
This page intentionally blank