multi-ethnic green consumers - city of london, …€¦ · · 2015-04-1448 multi-ethnic green...
TRANSCRIPT

48
MULTI-ETHNIC GREEN CONSUMERS
PRIZM: 11/29/4643% of segment16% of market*
Demographic Highlights **
The Multi‐Ethnic Green Consumers are health conscious, large suburban multi‐ethnic families, which take price and the environment into consideration when making a purchase. Residents in this segment are more likely to be drawn toward messages which focus on the savings and health benefits associated with reducing their carbon footprint.
Multi‐Ethnic Green ConsumersU5 46 Newcomers Rising 68 110 123 95 153 128 82 117S1 11 Pets & PCs 75 106 122 111 93 94 71 103S2 29 Suburban Rows 104 161 119 114 80 101 68 120
City of London PRIZM Clusters
Key Segment Variables
Prim
acy of
Environm
ental
Protectio
n
Legacy
Impo
rtance of
Price
Effort Tow
ard
Health
Activ
e Go
vernmen
t
Glob
al
Consiousne
ss
Attractio
n to
Nature
Ecological
Lifestyle
$94K 37% 29% 27%24%UniversityFamily w/kids Non‐official LanguageIncome
+Hhd Size
*market is the City of London households; **compared to the City of London average
DEMOGRAPHIC HIGHLIGHTS
49Source: Environics Analytics PRIZMC2; 2014 DemoStats vs LondonMarket = City of London
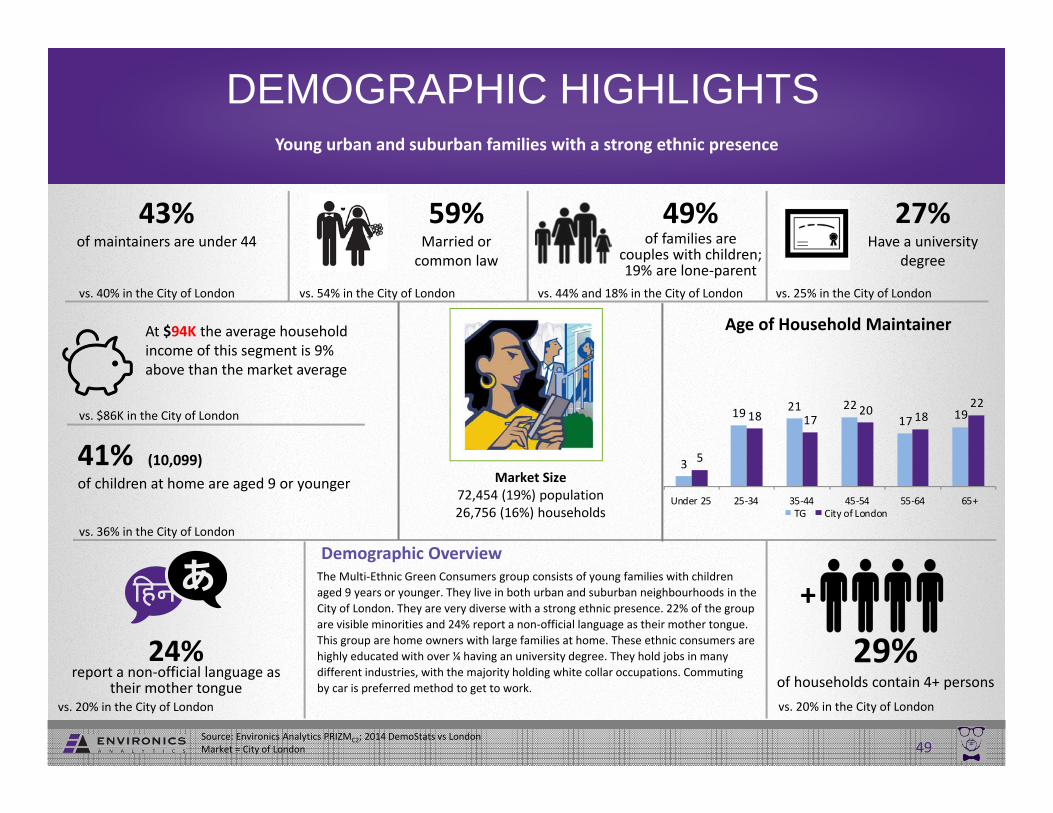
43%of maintainers are under 44
59%Married or common law
27%Have a university
degree
The Multi‐Ethnic Green Consumers group consists of young families with children aged 9 years or younger. They live in both urban and suburban neighbourhoods in the City of London. They are very diverse with a strong ethnic presence. 22% of the group are visible minorities and 24% report a non‐official language as their mother tongue. This group are home owners with large families at home. These ethnic consumers are highly educated with over ¼ having an university degree. They hold jobs in many different industries, with the majority holding white collar occupations. Commuting by car is preferred method to get to work.
Demographic Overview
At $94K the average household income of this segment is 9% above than the market average
24% report a non‐official language as
their mother tongue
29%of households contain 4+ persons
49%of families are
couples with children;19% are lone‐parent
41% (10,099) of children at home are aged 9 or younger
vs. 40% in the City of London vs. 54% in the City of London vs. 44% and 18% in the City of London vs. 25% in the City of London
vs. $86K in the City of London
vs. 20% in the City of London
vs. 36% in the City of London
vs. 20% in the City of London
Market Size72,454 (19%) population26,756 (16%) households
Young urban and suburban families with a strong ethnic presence
3
19 21 2217 19
5
18 1720 18
22
Under 25 25‐34 35‐44 45‐54 55‐64 65+TG City of London
Age of Household Maintainer
+

Religiosity National Pride
Need for Escape Importance of Price
Time Stress Legacy
Saving on Principle Need for Status Recognition
Vitality Ecological Lifestyle
ADAPTABILITY TO COMPLEXITY
SOCIAL RESPONSIBILITYPURSUIT OF INTENSITYJOY OF CONSUMPTION
PRIMACY OF ENVIRONMENTAL PROTECTIONREJECTION OF AUTHORITYATTRACTION TO NATURE
FULFILMENT THROUGH WORK
Strong Social Values
Weak Social Values
50Source: Environics Analytics PRIZMC2; PRIZMC2Link2014_SocialValues_2013 vs Canada
Value ImplicationsResidents in this segment feel that there is not enough time in the day to accomplish all of their goals. Position the campaign as a pain free and easy to use. They may be deterred if the campaign requires too much of their time.
Residents in this segment are price conscious and reluctant to part with their hard earned dollars. As a result messages which speak directly to the cost saving implications associated with the campaign my resonate with residents.
Being Canadian is an important part of the identify of Multi‐Ethnic Green Consumers. As a result positioning your campaign or initiative as a Canadian thing to do, or evoke Canadian imagery.
The ability to track and decrease your household’s greenhouse gas footprint with financial implications may resonate with members of this segment as they want to be respected by their peers and seen as environmentally conscious.
Images or themes focused on nature or the outdoors will not resonate with these urban residents.
MULTI-ETHNIC GREEN CONSUMERSSOCIAL VALUES

Direct & Outdoor preferences:• Coupon booklets, catalogues, flyers in
newspapers and magazines, and brochures tend to be the most popular direct mail option for this segment
• Above average and high rates for taking more trips on public transit per week
• One person out of 4 went to the mall two or three times
LightMixedModerate HeavyInternet
MULTI-ETHNIC GREEN CONSUMERS MEDIA SUMMARY
51
Light/MedNewspaper Magazine Radio Television
Source: Environics Analytics PRIZMC2; PRIZMC2Link2014_PMB_Fall2013
Note: “Top 10” lists have been identified by sorting all category variables by Index, then by % Penetration in the Index ranges 120+, and 100‐119. Top 10 variables have a minimum % Penetration of 10%,.
• Watch videos/movies/ TV programs, email, searches, download apps, instant messaging
• Accessed magazines
• London Free Press• General news, food,
entertainment, finance/ business, arts/ culture, sports, health sections
• Cineplex, enRoute, ELLE Canada, Today’s Parent, Fashion, Flare, Tribute, Parents Canada
• One out of 5 people watch CTV Early Evening News which is at average rates
• Top 40/Current Hits, All News, Urban/Rap/ Hip Hop, Retro, Soft Music, Classical/Fine Arts, All Sports type programs
The media habits of the Multi‐Ethnic Green Consumers are:• Print usage is average, with mixed magazine and moderate newspaper readership• Light radio listenership; Top 40/Current Hits, All News, Urban/Rap/ Hip Hop,
Retro, Soft Music, Classical/Fine Arts, All Sports type stations when they do listen• TV viewership is light to moderate; they watch a much broader than average
variety of shows• Internet use is heavy; it’s used for a variety of activities including watching videos/
movies/ TV programs, email, searches, download apps, instant messaging and accessing magazines
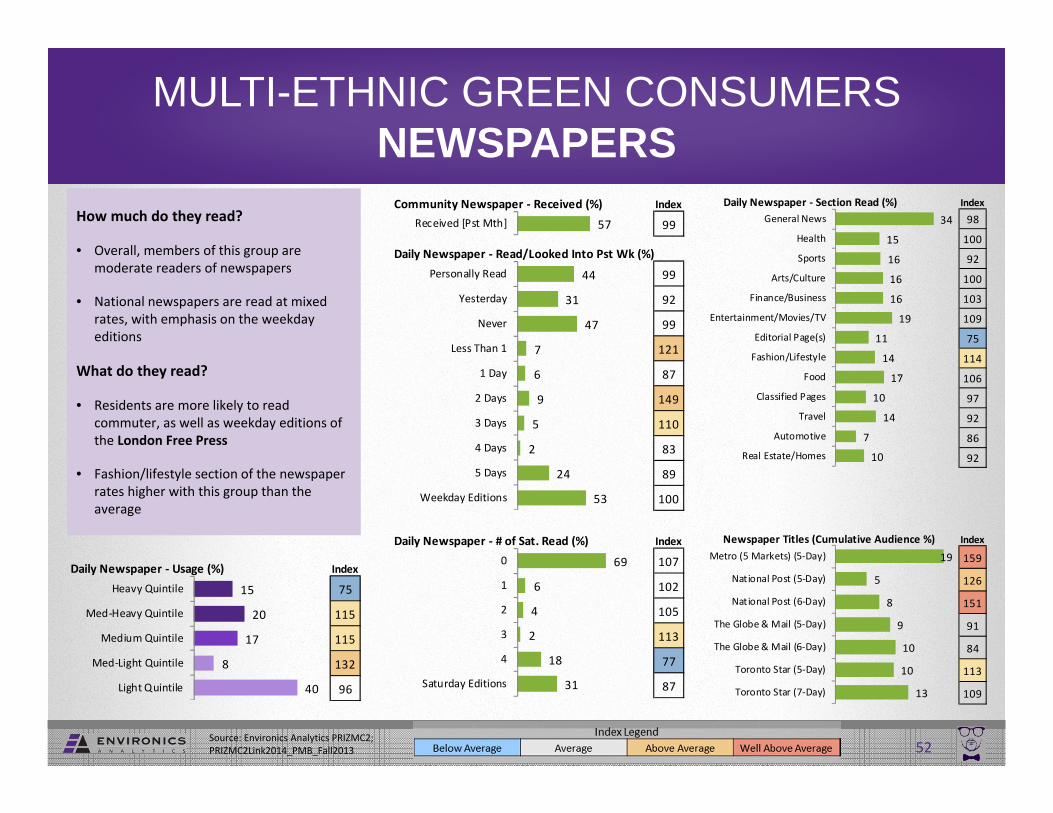
How much do they read?
• Overall, members of this group are moderate readers of newspapers
• National newspapers are read at mixed rates, with emphasis on the weekday editions
What do they read?
• Residents are more likely to read commuter, as well as weekday editions of the London Free Press
• Fashion/lifestyle section of the newspaper rates higher with this group than the average
52Source: Environics Analytics PRIZMC2; PRIZMC2Link2014_PMB_Fall2013
Daily Newspaper ‐ Usage (%) Index
75
115
115
132
96
15
20
17
8
40
Heavy Quintile
Med‐Heavy Quintile
Medium Quintile
Med‐Light Quintile
Light Quintile
Daily Newspaper ‐ # of Sat. Read (%) Index
107
102
105
113
77
87
69
6
4
2
18
31
0
1
2
3
4
Saturday Editions
Community Newspaper ‐ Received (%) Index
99
Daily Newspaper ‐ Read/Looked Into Pst Wk (%)
99
92
99
121
87
149
110
83
89
100
57Received [Pst Mth]
44
31
47
7
6
9
5
2
24
53
Personally Read
Yesterday
Never
Less Than 1
1 Day
2 Days
3 Days
4 Days
5 Days
Weekday Editions
Daily Newspaper ‐ Section Read (%) Index
98
100
92
100
103
109
75
114
` 106
97
92
86
92
34
15
16
16
16
19
11
14
17
10
14
7
10
General News
Health
Sports
Arts/Culture
Finance/Business
Entertainment/Movies/TV
Editorial Page(s)
Fashion/Lifestyle
Food
Classified Pages
Travel
Automotive
Real Estate/Homes
Newspaper Titles (Cumulative Audience %) Index
159
126
151
91
84
113
109
19
5
8
9
10
10
13
Metro (5 Markets) (5‐Day)
National Post (5‐Day)
National Post (6‐Day)
The Globe & Mail (5‐Day)
The Globe & Mail (6‐Day)
Toronto Star (5‐Day)
Toronto Star (7‐Day)
MULTI-ETHNIC GREEN CONSUMERSNEWSPAPERS

53Source: Environics Analytics PRIZMC2; PRIZMC2Link2014_PMB_Fall2013
How much do they watch?
When they do watch, what are they watching?
TV ‐ Usage (%) Index
83
85
99
127
101
15
16
19
28
22
Heavy Quintile
Med‐Heavy Quintile
Medium Quintile
Med‐Light Quintile
Light Quintile
TV ‐ Days Watched per Week (%) Index
120
124
81
134
95
7
6
6
5
67
1 Day/Wk or Less
2 Days/Wk
3 Days/Wk
4 Days/Wk
5 Days/Wk
Top 10 TV Program Types Watched (%) Index
122
131
127
123
130
147
121
129
135
136
20
19
19
18
15
15
14
13
13
11
Soccer Major Events
Modern Family
Bones
Amazing Race
Entertainment Tonight
Global News Final
MuchMusic Video Awards
The Good Wife
Entertainment Tonight: Canada
Rookie Blue
Top 10 TV Stations Watched (%) Index
119
118
158
121
118
135
103
111
100
110
28
25
20
12
10
9
34
17
14
13
CTV News Channel (CTVNC)
Food Network Canada (FN)
CP24 (CP24)
YTV (YTV)
The Score (SCR)
OMNI (OMNI)
Discovery Channel (DIS)
Family Channel (FAM)
Showcase (SHO)
MuchMusic (MM)
TV ‐ News, Sports, Current Affairs (%) Index
104
108
101
21
11
12
CTV Early Evening News
Noon News
CTV Late Local News
MULTI-ETHNIC GREEN CONSUMERSTELEVISION
• Sports programs and news stations are popular and viewed at above average rates
• More likely than average to watch CP24
• Consider featuring the campaigns on this station
• And 12 out of 100 watch late local news which is the same as the general population
• Light to moderate viewers overall
• 13% of residents watch television 2 days a week or less

MULTI-ETHNIC GREEN CONSUMERSRADIO
54Source: Environics Analytics PRIZMC2; PRIZMC2Link2014_PMB_Fall2013
How much do they listen?
When they do listen, what are they listening to?
Radio ‐ Usage (%) Index
88
104
93
92
123
16
20
20
20
25
Heavy Quintile
Med‐Heavy Quintile
Medium Quintile
Med‐Light Quintile
Light Quintile
Radio ‐ Days Listened per Week (%) Index
38
84
108
98
114
123
92
0
2
4
5
6
3
59
Never/Wk
0‐1 Day/Wk
1 Day/Wk
2 Days/Wk
3 Days/Wk
4 Days/Wk
5 Days/Wk
Radio Station Types Listened To (%) Index
119
109
103
98
92
120
118
115
28
26
31
10
15
15
18
15
Top 40/Current Hits
Modern Rock/Alternative Rock
Album Rock/Classic Rock
Traditional Country
New Country
Soft Music/Adult Contemporary
Urban/Rap/Hip Hop
Retro (80's)
Radio Station Types Listened To (%) Index
121
115
115
100
134
106
123
95
11
22
10
16
6
13
6
18
Classical/Fine Arts
All News
All Sports
News/Talk/Information/Sports
Multicultural
Dance
Big Band/Music of Your Life
Oldies (50's, 60's, 70's)
Listened to the Radio…. (%) Index
9765Yesterday
• Overall, Multi‐Ethnic Green Consumers listen to all stations at average to above average rates
• Most popular are Album Rock/Classic Rock, Top 40/Current Hits, and Modern Rock
• Multicultural and Big Band rate highly, but in small counts
• Light to moderate listeners overall
• 6 out of 10 people listen five days per week
55Source: Environics Analytics PRIZMC2; PRIZMC2Link2014_PMB_Fall2013
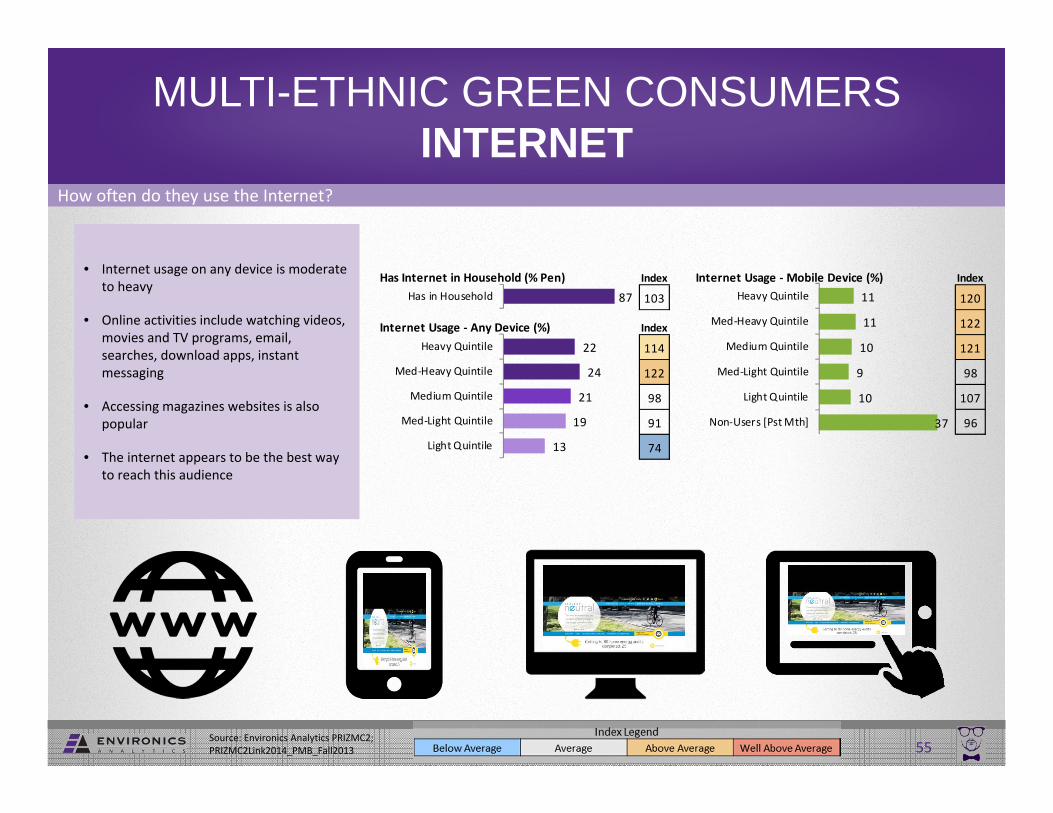
How often do they use the Internet?
MULTI-ETHNIC GREEN CONSUMERSINTERNET
• Internet usage on any device is moderate to heavy
• Online activities include watching videos, movies and TV programs, email, searches, download apps, instant messaging
• Accessing magazines websites is also popular
• The internet appears to be the best way to reach this audience
Has Internet in Household (% Pen) Index
103
Internet Usage ‐ Any Device (%) Index
114
122
98
91
74
22
24
21
19
13
Heavy Quintile
Med‐Heavy Quintile
Medium Quintile
Med‐Light Quintile
Light Quintile
87Has in HouseholdInternet Usage ‐ Mobile Device (%) Index
120
122
121
98
107
96
11
11
10
9
10
37
Heavy Quintile
Med‐Heavy Quintile
Medium Quintile
Med‐Light Quintile
Light Quintile
Non‐Users [Pst Mth]

56Source: Environics Analytics PRIZMC2; PRIZMC2Link2014_PMB_Fall2013
How do they access the Internet?
How often do they access the Internet?
Internet Connection ‐ Type (%) Index
117
95
103
42
19
6
Cable service
High speed phone line
Regular phone line
Internet Connection ‐ Type (%) Index
106
127
102
106
3
5
18
32
Fiber Optic
Wireless Internet Using Stick
Laptop Built in Wireless
Wireless Modem/Router
When Accessed (%) Index
107
105
105
105
104
104
109
104
72
81
88
89
89
89
89
1
91
9
Yesterday
Past 7 Days
Past 14 Days
Past Month
Past Two Months
Past Three Months
3+ Months
Past Year
Never
Time Spent Online Pst Wk (%) Index
73
75
96
93
122
138
100
120
119
105
12
3
22
16
13
8
10
6
9
88
0 mins
1‐59 mins
60‐300 mins
301‐600 mins
601‐900 mins
901‐1200 mins
1201‐1800 mins
1801‐2400 mins
2401+ mins
1+ Hours
MULTI-ETHNIC GREEN CONSUMERSINTERNET
• Four out of ten people use cable to connect to the Internet
• Wireless connection is popular as well
• 4 out of 5 people accessed the Internet yesterday
• Overall, this group is online at rates which are slightly higher than the general population
• 1 out of 4 people spent more than 1200+ minutes (20 hours) online in the past week

57Source: Environics Analytics PRIZMC2; PRIZMC2Link2014_PMB_Fall2013
What type of device do they use?/Where do they access the Internet?
What activities do they do online?
Device Used (%) Index
105
115
114
114
115
86
37
53
9
17
Household Desktop/Laptop
Employer Desktop/Laptop
Household Mobile Device
Employer Mobile Device
Computer (Third Party/Public)
Internet ‐ Where Accessed (%) Index
104
124
112
119
128
79
41
17
10
9
Home
Work
School/Library
Café/Restaurant
Other
PC/Laptop (%) Index
115
103
106
103
106
99
103
7
2
63
9
14
32
47
Used For Blogging
Used For Podcasting
Used For E‐mail
Used For Text Messaging
Used For Instant Messaging
Used For Social Networking
Used For Searches/Search Engines
MULTI-ETHNIC GREEN CONSUMERSINTERNET
• Although the vast majority access the internet from home using either a desktop or laptop, this group goes online everywhere: at work, in the library, cafes and restaurants and other places at above average rates
• Most online activities are done at rates higher than the general population
• Email and online searches are very popular online activities
• Texting and social networking are popular too
• More likely to access newspaper and magazines online
Any Device (%) Index
115
132
108
111
112
104
108
117
116
129
111
9
4
68
40
27
38
53
31
17
19
24
Blogging
Podcasting
E‐mail
Text Messaging
Instant Messaging
Social Networking
Searches/Search Engines
Watched Videos
Listen to radio/podcast
Accessed Magazine Website
Accessed Newspaper Website

Index
92
103
115
105
78
In‐Town Travel [Past Week] (%)
35
22
24
10
4
1‐49 KM
50‐99 KM
100‐249 KM
250‐500 KM
500+ KM
MULTI-ETHNIC GREEN CONSUMERSDIRECT & OUTDOOR
58Source: Environics Analytics PRIZMC2; PRIZMC2Link2014_PMB_Fall2013
Index: “Always”
How do they feel about direct mail?
Flyers and Direct Mail ‐ Use (%)
Index
85
80
95
109
99
115
100
87
3
4
9
10
6
3
8
4
5
10
11
7
9
6
15
4
38
39
35
22
22
20
24
14
Brochures
Catalogues
Coupon Booklets
Envelopes
e‐Flyers
e‐Newsletters
Flyers in News/Mags
Flyers in Polybag
Always Often Sometimes
How often do they visit malls or take trips on public transit?
Any Public Transit Pst Wk (%) Index
90
117
164
138
69
12
10
8
0
1‐5
6‐10
11+
Bus/Streetcar Pst Wk (%) Index
131
133
144
99
11
14
8
3
0
1‐5
6‐10
11+
Shopping Malls Pst Wk (%) Index
80
116
104
96
132
27
35
27
7
5
0
1
2‐3
4‐5
6+
• This segment has a preference for eNewsletters
• Coupon booklets, catalogues, flyers in newspapers and magazines, and brochures tend to be the most popular direct mail option for this segment
• All other forms of direct mail use is used at average rates compared to other people in London
• Three quarters this segment visited a mall last week
• One person out of 4 went to the mall two or three times
• More likely than the average residents to take public transit
• Some members of this group show an above average propensity to travel between 100‐249 km per week
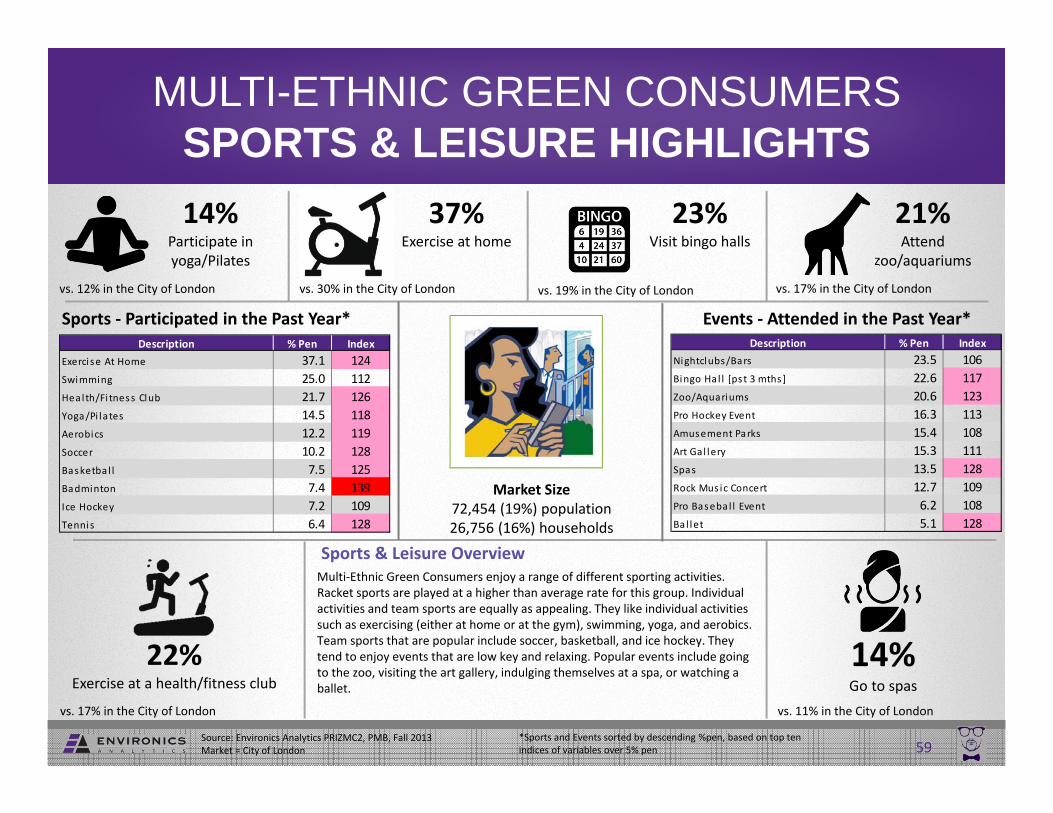
Description % Pen IndexNightclubs/Bars 23.5 106Bingo Hal l [pst 3 mths] 22.6 117Zoo/Aquariums 20.6 123Pro Hockey Event 16.3 113Amusement Parks 15.4 108Art Gal lery 15.3 111Spas 13.5 128Rock Music Concert 12.7 109Pro Basebal l Event 6.2 108Bal let 5.1 128
59
37%Exercise at home
vs. 12% in the City of London
14%Participate in yoga/Pilates
21%Attend
zoo/aquariums
vs. 17% in the City of London
14% Go to spas
Sports & Leisure OverviewMulti‐Ethnic Green Consumers enjoy a range of different sporting activities. Racket sports are played at a higher than average rate for this group. Individual activities and team sports are equally as appealing. They like individual activities such as exercising (either at home or at the gym), swimming, yoga, and aerobics. Team sports that are popular include soccer, basketball, and ice hockey. They tend to enjoy events that are low key and relaxing. Popular events include going to the zoo, visiting the art gallery, indulging themselves at a spa, or watching a ballet.
vs. 17% in the City of London
22%Exercise at a health/fitness club
vs. 11% in the City of London
Market Size72,454 (19%) population26,756 (16%) households
Source: Environics Analytics PRIZMC2, PMB, Fall 2013Market = City of London
Sports ‐ Participated in the Past Year* Events ‐ Attended in the Past Year*Description % Pen Index
Exerci se At Home 37.1 124Swimming 25.0 112Heal th/Fi tness Club 21.7 126Yoga/Pi lates 14.5 118Aerobics 12.2 119Soccer 10.2 128Basketba l l 7.5 125Badminton 7.4 139Ice Hockey 7.2 109Tennis 6.4 128
*Sports and Events sorted by descending %pen, based on top ten indices of variables over 5% pen
vs. 30% in the City of London
23%Visit bingo halls
vs. 19% in the City of London
MULTI-ETHNIC GREEN CONSUMERSSPORTS & LEISURE HIGHLIGHTS