multi-disciplinary research: bioenergy, land use change
TRANSCRIPT
Multi-Disciplinary Research: Bioenergy, Land Use Change and Food Security. Plus: Global Calculator
Environmental Science Division
Climate Change Science Institute and
Center for Bioenergy Sustainability
Oak Ridge National Laboratory
Oak Ridge, Tennessee
http://www.ornl.gov/sci/ees/cbes/
Climate Change Science Institute
21 April, 2014
Keith L. Kline [email protected]
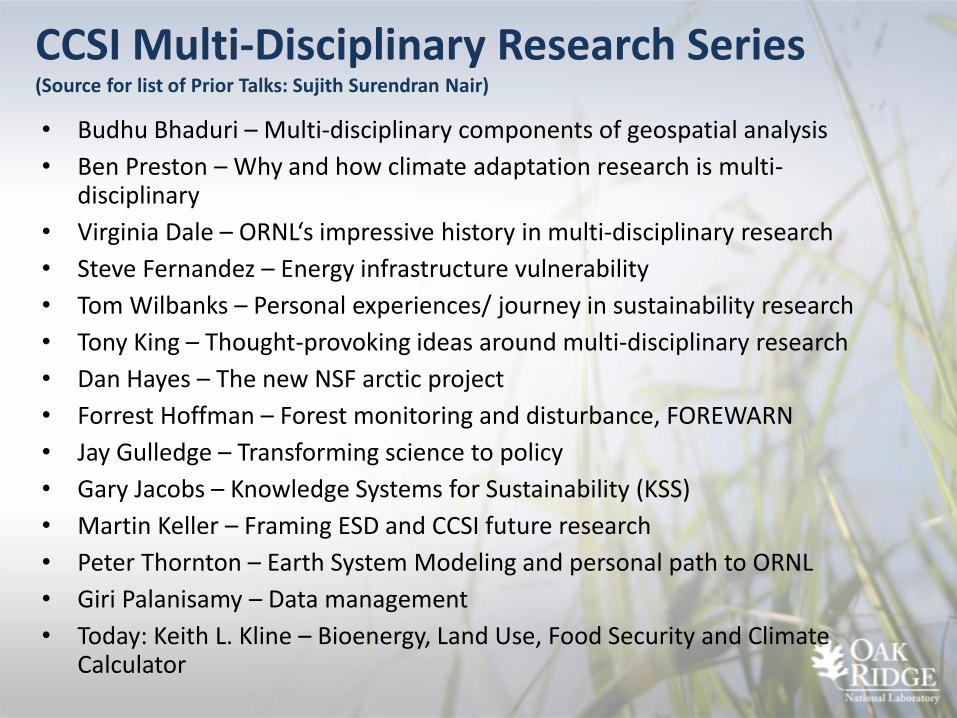
CCSI Multi-Disciplinary Research Series (Source for list of Prior Talks: Sujith Surendran Nair)
• Budhu Bhaduri – Multi-disciplinary components of geospatial analysis
• Ben Preston – Why and how climate adaptation research is multi-disciplinary
• Virginia Dale – ORNL‘s impressive history in multi-disciplinary research
• Steve Fernandez – Energy infrastructure vulnerability
• Tom Wilbanks – Personal experiences/ journey in sustainability research
• Tony King – Thought-provoking ideas around multi-disciplinary research
• Dan Hayes – The new NSF arctic project
• Forrest Hoffman – Forest monitoring and disturbance, FOREWARN
• Jay Gulledge – Transforming science to policy
• Gary Jacobs – Knowledge Systems for Sustainability (KSS)
• Martin Keller – Framing ESD and CCSI future research
• Peter Thornton – Earth System Modeling and personal path to ORNL
• Giri Palanisamy – Data management
• Today: Keith L. Kline – Bioenergy, Land Use, Food Security and Climate Calculator

Why bioenergy, LUC and Food? • Do the right thing: conserve resources
for future generations
– “Living within our means”
– Important “wedge” to reduce fossil fuel dependence
• IEA, IPCC, WWF… all assume important role for bioenergy
• 80-250 EJ (2050) to help meet emission targets
• Sustainable development
– Involving stakeholders in process
– Integrated land-use planning
– More sustainable rural livelihoods
– Landscapes managed for CC mitigation, adaptation, resilience
• Improve land management, efficiency (disturbances including fire and pests destroy over 500 million Ha biomass each year)
• Address issues surrounding global “LUC” (land-use change)

Global biomass potential estimates vary: 50-500 EJ (in 2050)
• “Technical Potential” 750-1500 EJ per year
• 300-500 EJ of “sustainable biomass” in 2050 – Dornburg et al. 2010 (Energy & Env Science)
• “…impossible that bioenergy could physically provide more than 250 EJ yr-1 in 2050” – Haberl et al. 2013 (Environ. Res. Lett. 8)
– Land assumptions limit estimate
Slide from Kline presentation to “Pathways to Climate Solutions: Assessing Energy Technology and Policy Innovation” Workshop organized by the Aspen Global Change Institute; 24-28 February, 2014. Aspen CO.

5 Managed by UT-Battelle for the U.S. Department of Energy
IPCC Special Report Renewable Energy “most likely range is 80-190 EJ”
-IPCC 2012 Special Report on Renewables
and Climate Change Mitigation

6 Managed by UT-Battelle for the U.S. Department of Energy
IPCC Special Report Renewable Energy
-IPCC 2012 Special Report on
Renewables and Climate Change
Mitigation
155 EJ in 2050

7 Managed by UT-Battelle for the U.S. Department of Energy
IPCC Special Report Renewable Energy Climate mitigation scenarios
-IPCC 2012 Special Report on Renewables
and Climate Change Mitigation

8 ORNL Bioenergy Resource and Engineering Systems Group
U.S. Bioenergy supply model
Billion Ton Update (USDOE 2011)
• Forecasts of potential biomass
– POLYSYS partial equilibrium model of US agricultural and forestry sectors.
– 20-year projections of economic availability of biomass (price, location, scenario)
• Forest resources – Logging residues – Forest thinnings (fuel treatments) – Conventional wood – Fuelwood – Primary mill residues – Secondary mill residues – Pulping liquors – Urban wood residues
• Agricultural resources – Crop residues – Grains to biofuels – Perennial grasses – Perennial woody crops – Animal manures – Food/feed processing residues – MSW and landfill gases – Annual energy crop (added for 2011)

9 ORNL Bioenergy Resource and Engineering Systems Group
Supply curve for biomass in US, 2022
-Langholtz et al. 2014
(in press, BioFPR)

Obstacles to bioenergy include
– Food security and land concerns
– LUC-related effects on biodiversity, carbon debt, water
– Markets: lack of security for investment, increased production
– Distribution of benefits and costs
– Need for integrated policy across agriculture, forestry, waste, environment, energy…
– Sector- and nation-specific challenges (e.g., US “blend wall,” distribution infrastructure)
Source: Kline presentation to “Pathways to Climate Solutions: Assessing Energy Technology and Policy
Innovation” Workshop organized by the Aspen Global Change Institute; 24-28 February, 2014. Aspen CO.

Should the USA establish mechanism to lift ethanol mandates to address “food price crises” in other nations?
Food security

12
0
50
100
150
200
250
300
350
Jan-
70
1972
M1
1974
M1
1976
M1
1978
M1
Jan-
80
1982
M1
1984
M1
1986
M1
1988
M1
Jan-
90
1992
M1
1994
M1
1996
M1
1998
M1
Jan-
00
2002
M1
2004
M1
2006
M1
2008
M1
Jan
-10
2012
M1
Index: January 2002 = 100
Source: Ron Trostle, ERS; based on International Monetary Fund: International Financial Statistics, Jan 2012p
6 price spikes since 1970
Weighted average of 4 crops (wheat, soybeans, corn & rice) 1/
202%
226%

13
0
50
100
150
200
250
300
350
400
450
500
550
600
650
700
Jan 80 Jan 85 Jan 90 Jan 95 Jan 2000 Jan 05 Jan 10
Crude oil
All commodities
Food commodities
Index: January 2002 = 100
Non-food commodity prices have risen even more
Source: Ron Trostle, ERS; based on International Monetary Fund: International Financial Statistics, Jan 2012p

14
150
200
250
300
350
May
10
Jul
10
Oct
10
Jan
11
Apr
11
Jul
11
Oct
11
Jan
12
Index: January 2002 = 100
Primary factors affecting crop prices1 (June 2010 – Jan 2012)
Strong LDC economic growth.
Rising oil price. U.S. $ depreciates
Russia
wheat
export ban
EU suspends
barley & feed wheat
import levies
Importers
aggressively
buying
Reductions in estimated global ending grain stocks
Argentina drought
China dryness
U.S. HRW drought
Canada & NW Europe:
rain damages
wheat crop Aust. rain
damages
wheat crop
Russia drought
E. Africa drought
Russia stops
grain import
duty
U.S. corn
yields drop
(high temps)
Mexico
freeze
Argentine
& Brazil
drought
14-crop monthly price index: Wheat, rice, corn, & soybean prices; based on IMF price and trade share data.
Russia
ends
export ban
U.S. $ appreciates
Favorable weather
In Europe & FSU
Higher estimated global grain stocks
Source: Ron Trostle, ERS

Food Prices versus field crop prices
Chart: http://www.ers.usda.gov/data-products/chart-gallery/detail.aspx?chartId=41700&ref=collection&embed=True&widgetId=39734

Weather, energy and import/export policy
shifts are key factors in food price spikes

Issues that influence estimated LUC:
1. Economic decision-making assumptions
2. Conceptual framework for drivers of ‘land conversion’
3. Land supply and management specifications
4. Assumed land use dynamics (ref. scenarios, baseline choices)
5. Modeling yield change
6. Issues of time, scale
7. Fire and other disturbances
8. Differentiate correlation versus causation
9. Attribution among different drivers of change
10. Representation of bioenergy/policy in model specifications
11. Data issues related to all above, to test hypotheses
See IEA Joint Task 38-40-43 Kline presentation on LUC: http://ieabioenergy-task38.org/workshops/campinas2011 on CBES website
Bioenergy assessment depends on estimated “land-use change” (LUC) effects
It depends

LUC estimates, compared to what?
• Land available for ag-expansion without deforestation (previously cleared, underutilized) = 500 million to 4 000 million ha(1)
Circle size assumes 1500
• Global land area impacts: [million hectares per year]
– Fire = 330-430 (2) est. 380 – Dev./Urban exp. (1) = 1.5 – LUC bioenergy est. (3) = 0.2 not visible (1) Enormous range due to pasture, grassland,
marginal land estimates
Sources: (1) Kline et al. 2009; calc. by author based on FAO 2007.
(2) Giglio et al. 2010. (3) Tyner et al. 2010 (3 m ha total/14 years = 0.2/year)

Source: USDA ERS 2011. http://www.ers.usda.gov/publications/eib89/
Contrary to some modeling assumptions, in the US, expectations of commodity prices and risk affect choices of what to grow on previously defined agricultural landscapes, not how much total area is dedicated to agriculture
Check assumptions about price/LUC
(policy funded set-asides)

http://www.ers.usda.gov/data-products/chart-gallery/detail.aspx?chartId=43538&ref=collection
U.S. agricultural exports nearly tripled from 2000 to 2013
2008 Recession

21 Managed by UT-Battelle for the U.S. Department of Energy
Consider historic data and trends What drives destructive land transitions? Crop prices?

Putting global “Land Use
Change” emissions into
perspective (1960-2012)
Over 90% of current CO2 emissions from fossil fuels (GCP 2013)
LUC emissions, uncertain, small and shrinking
Land management: high importance as potential sink
Fossil emissions rising rapidly
Shaded areas around lines represent estimated range of uncertainty
Source: Le Quéré, C. et al. Nature Geosci.v2, 831–836 (2009) for sink; Global Carbon Project (2013) for LUC and fossil.
GCP “Land-Use Change” estimate
based on emission factors
associated with global reported
deforestation and fires

Opportunity:
Improve NET land
SINK via better
management.
Investments in
management
requires incentives.
Who pays?
For what services?
On whose land?
Source: Global Carbon Project 2013

Opportunities
More emphasis on win-win policy and planning scenarios
Build consensus on:
– Goals
Criteria and indicators
How to measure them
Speak “common language”
– Better models of human behavior ref. LUC
Empirical data to test hypotheses
International collaboration to resolve contentious issues…
Source: Adapted from Kline presentation to “Pathways to Climate Solutions: Assessing Energy Technology and
Policy Innovation” Workshop organized by the Aspen Global Change Institute; 24-28 February, 2014. Aspen CO.

Opportunity to contribute to global multi-disciplinary collaboration
– Global initiative modeled on national tools

Opportunity to contribute to global multi-disciplinary collaboration • The Global Calculator models carbon and land use dynamics
for: Transport; Manufacturing; Electricity; Land, Bioenergy and Food (“Land/Bio/Food”); and Buildings.
• Many collaborating institutions:
– Imperial College leads Land/Bio/Food with University of Versailles, PIK-Potsdam, Universities of Reading and Oxford
– World Resources Institute leads Transport
– ClimAct (Brussels, Belgium) - Manufacturing
– Ernst & Young (Delhi, India) - Electricity
– Energy Research and Development International (Beijing, China) - Buildings
– Climate Media Factory at PIK-Potsdam - Visuals and online version of Calculator… London School of Economics and Political Science (LSE) is managing the climate science contribution.
• For more info see: http://globalcalculator.org/
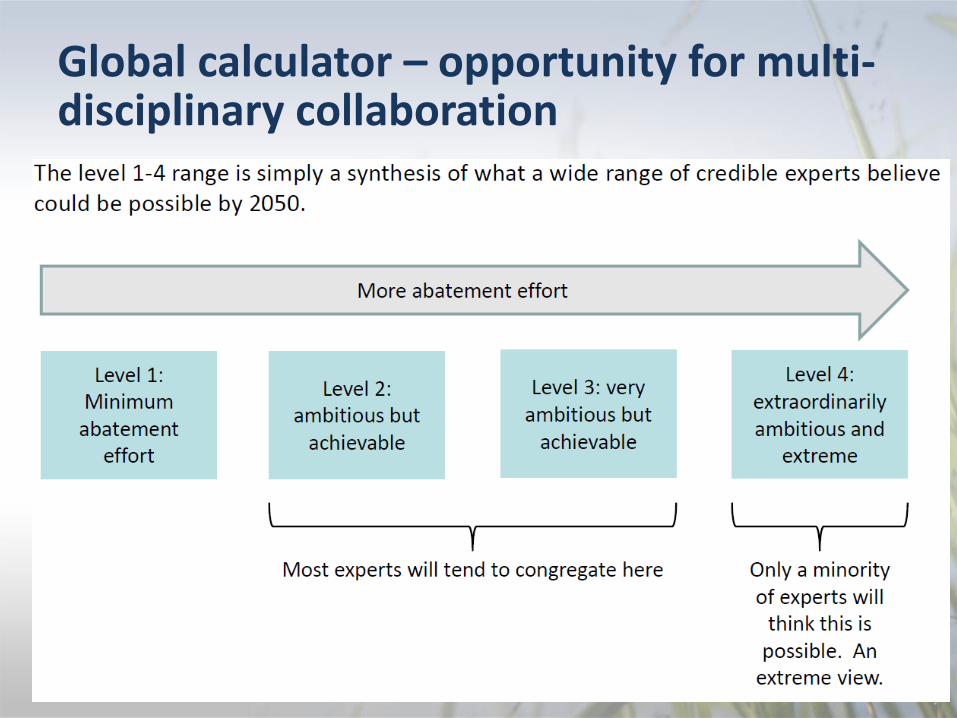
Global calculator – opportunity for multi-disciplinary collaboration

Global calculator – opportunity

Land-Bioenergy-Food “Levers” in calculator
DRAFT for comment only.
Not for citation

Global calculator – opportunity for multi-disciplinary collaboration

Global calculator – opportunity for multi-disciplinary collaboration

Thoughts for discussion • Many research studies and analyses
of potential begin with land. Is land the primary constraint? No… – Social, political, economic/market issues
– Institutions, governance… water
• Needed: Incentives for improved soil/water (resource) management – Increase carbon and nutrient retention
– And capacity to store carbon
• On the radar – Integrated production systems (ILUP)
– Urban food-energy systems (nutrient and energy recycling)
Source: Kline presentation to “Pathways to Climate Solutions: Assessing Energy Technology and Policy Innovation” Workshop organized by the Aspen Global Change Institute; 24-28 February, 2014. Aspen CO.

33 Managed by UT-Battelle for the U.S. Department of Energy
http://www.ornl.gov/sci/ees/cbes/
Thank you!

Win-Win Opportunities • Precision management and nutrient recycling
• Reduce disturbance/tillage intensity
• Crop mix, rotations, cover crops
• Land restoration
• Technology (seed, microbe, equipment)
Improve soil & water
management
• Reduce inputs/increase yields
• Open, transparent markets
• Minimize transaction costs
• Prioritize, incentivize, measure
Increase Efficiency
• Uses and markets
• Substitution options
• Bases of production Diversify
• Multi-scale
• Long term and adaptive
• Integrated land-use plans
Adopt Systems
Perspective
Source: Kline presentation to Coordinating Research Council CRC, Argonne IL, 13 Oct 2013

Research challenges for consistent measures of LUC • Accurate representations based on
clear definitions for variables and conditions of concern: – land attributes – management practices – baseline trends and change dynamics
• Causal analysis that can be validated at multiple scales
• Adequate empirical data to test models and hypotheses
• Multi-disciplinary, multi-institutional learning and problem-solving mechanisms
• Approaches with low transaction costs and high value-added
Source: Kline presentation to “Pathways to Climate Solutions: Assessing Energy Technology and Policy Innovation” Workshop organized by the Aspen Global Change Institute; 24-28 February, 2014. Aspen CO.

Example lever in DRAFT Climate Calculator

Example lever in DRAFT Climate Calculator

38 Managed by UT-Battelle for the U.S. Department of Energy
How to effectively involve society?
• Stakeholder engagement in process: define problem, goals and priorities, assess options, and validate proposed solutions
– How does society define the problem?
– What are priority objectives?
• Define spatial and temporal scales
• Consider constraints and opportunities
– Apply tools to obtain range of solutions
– Analyze trade-offs and complementarities
– Extract general rules, guidance for decision makers
– Monitor to guide further improvements over time
• Use of indicators to measure change
Source: Kline presentation to Vital Signs Trade-Offs Workshop, Oxford, UK, 6 Feb. 2014

39 Managed by UT-Battelle for the U.S. Department of Energy
Recommendation International Committee Food Security
• McPhail et al. (2012) noted that speculation and oil price spikes are both important in the short run while in the long run petroleum price grows in importance and the role of speculation diminishes (see Table). However, in all time periods, speculation and other factors analyzed are more important in affecting corn prices than ethanol demand for biofuel, often by an order of magnitude or more.
• Note to Table 1: McPhail et al. tried to identify the share attributable to four specific types of “shock:” in global demand, crude oil price, ethanol demand, and corn speculation. “Corn market shocks” represented everything else not studied explicitly (weather, policies, exchange rates, etc.).
Source: Kline comments to FAO on draft report for contingency plans for “food price crises”
April 18, 2014

References (partial list) • Dale VH, KL Kline, LL Wright, RD Perlack, M Downing, RL Graham. 2011. Interactions among bioenergy
feedstock choices, landscape dynamics and land use. Ecological Applications 21(4):1039-1054. • Dale, VH, RA Efroymson, KL Kline, MH Langholtz, PN Leiby, GA Oladosu, MR Davis, ME Downing, MR Hilliard.
2013. Indicators for assessing socioeconomic sustainability of bioenergy systems: A short list of practical measures. Ecological Indicators 26: 87-102.
• Oladosu D, KL Kline, P Leiby, R Martinez, M Davis, M Downing, L Eaton. 2012. Global economic effects of the US biofuel policy and the potential contribution from advanced biofuels. Biofuels 3(6):703-723. http://www.future-science.com/doi/pdfplus/10.4155/bfs.12.6
• USDOE 2011. U.S. Billion-Ton Update: Biomass Supply for a Bioenergy and Bioproducts Industry. ORNL. http://www1.eere.energy.gov/bioenergy/pdfs/billion_ton_update.pdf
• USDoe State of Technology updates: http://www1.eere.energy.gov/bioenergy/key_publications.html • Dornburg et al. 2010. Bioenergy revisited: Key factors in global potentials of bioenergy. Energy Environ. Sci.,
2010,3, 258-267.. • Efroymson, R. A., V. H. Dale, K. L. Kline, A. C. McBride, J. M. Bielicki, R. L. Smith, E. S. Parish, P. E. Schweizer,
D. M. Shaw. 2012. Environmental indicators of biofuel sustainability: What about context? Environmental Management DOI 10.1007/s00267-012-9907-5
• Giglio L., J. T. Randerson, G. R. van derWerf, P. S. Kasibhatla, G. J. Collatz, D. C. Morton, and R. S. DeFries. Assessing variability and long-term trends in burned area by merging multiple satellite fire products. Biogeosciences, 7, 1171–1186, 2010.
• IPCC 2012 Special Report on Renewables and Climate Change Mitigation. • Kline KL, Dale VH, Lee R, Leiby P. 2009. In Defense of Biofuels, Done Right. Issues in Science and Technology
25(3): 75-84. http://www.issues.org/25.3/kline.html • Langholtz M, Eaton L and Turhollow A. (in press). 2013 Feedstock Supply and Price Projections and
Sensitivity Analysis. (BioFPR 2014). • McBride A, VH Dale, L Baskaran, M Downing, L Eaton, RA Efroymson, C Garten, KL Kline, H Jager, P
Mulholland, E Parish, P Schweizer, and J Storey. 2011. Indicators to support environmental sustainability of bioenergy systems. Ecological Indicators 11(5) 1277-1289.
• Parish ES, M Hilliard, LM Baskaran, VH Dale, NA Griffiths, PJ Mulholland, A Sorokine, NA Thomas, ME Downing, R Middleton. 2012. Multimetric spatial optimization of switchgrass plantings across a watershed. Biofuels, Bioprod. Bioref. 6(1):58-72.
Acknowledgements
Research supported by the U.S. Department of Energy (DOE) under the Office of the Biomass Program and performed at Oak Ridge National Laboratory (ORNL). Oak Ridge National Laboratory is managed by the UT-Battelle, LLC, for DOE under contract DE-AC05-00OR22725.
The views in this presentation are those of the author who is responsible for any errors or omissions.
Collaborators include LM Baskaran, VH Dale, M Davis, B Davison, ME Downing, LM Eaton, RA Efroymson, C Farley, NA Griffiths, M Hilliard, H Jager, S Kang, PN Leiby, M Langholtz, LR Lynd, G Marland, A McBride, S Surendran Nair, GA Oladosu, ES Parish, RD Perlack, T Wilbanks, SB Wright, LL Wright…
DOE OBP staff – Z Haq, K Johnson, A Lindauer, P Grabowski, A Goss-Eng.
Other labs and organizations – H Chum, D Inman (NREL), M Wang (ANL), MTU-PIRE project, others