multi-dimensional data visualization
DESCRIPTION
Multi-Dimensional Data Visualization. Information Types. Multi-dimensional: databases,… 1D: timelines,… 2D: maps,… 3D: volumes,… Hierarchies/Trees: directories,… Networks/Graphs: web, communications,… Document collections: digital libraries,…. The Simple Stuff. Univariate - PowerPoint PPT PresentationTRANSCRIPT

Multi-Dimensional Data Visualization

Information Types
• Multi-dimensional: databases,…
• 1D: timelines,…
• 2D: maps,…
• 3D: volumes,…
• Hierarchies/Trees: directories,…
• Networks/Graphs: web, communications,…
• Document collections: digital libraries,…

The Simple Stuff
• Univariate
• Bivariate
• Trivariate

Univariate
• Dot plot
• Bar chart (item vs. attribute)
• Tukey box plot
• Histogram

Bivariate
• Scatterplot
•

Trivariate
• 3D scatterplot, spin plot
• 2D plot + size (or color…)

Multi-Dimensional Data
• Each attribute defines a dimension
• Small # of dimensions easy
• What about many dimensional data? n-D
What does 10-D space look like?

Projection
• map n-D space onto 2-D screen

Glyphs: Chernoff Faces
• 10 Parameters:• Head Eccentricity
• Eye Eccentricity
• Pupil Size
• Eyebrow Slope
• Nose Size
• Mouth Vertical Offset
• Eye Spacing
• Eye Size
• Mouth Width
• Mouth Openness • http://hesketh.com/schampeo/projects/Faces/chernoff.html
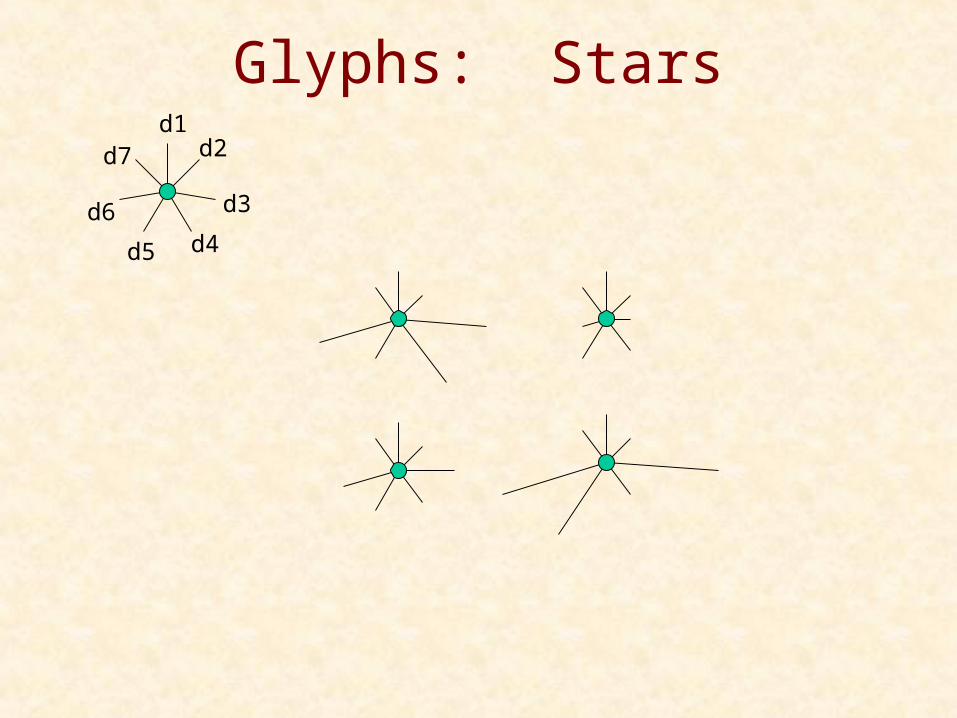
Glyphs: Starsd1
d2
d3
d4d5
d6
d7

Multiple Views withBrushing-and-linking

Scatterplot Matrix
• All pairs of attributes
• Brushing and linking
• http://noppa5.pc.helsinki.fi/koe/3d3.html

… on steroids

Different Arrangements of Axes
• Axes are good – Lays out all points in a single space– “position” is 1st in Cleveland’s rules– Uniform treatment of dimensions
• Space > 3D ?
• Must trash orthogonality

Parallel Coordinates
• Inselberg, “Multidimensional detective” (parallel coordinates)
•

Parallel Coordinates
• Bag cartesian
• (0,1,-1,2)=
0
x
0
y
0
z
0
w
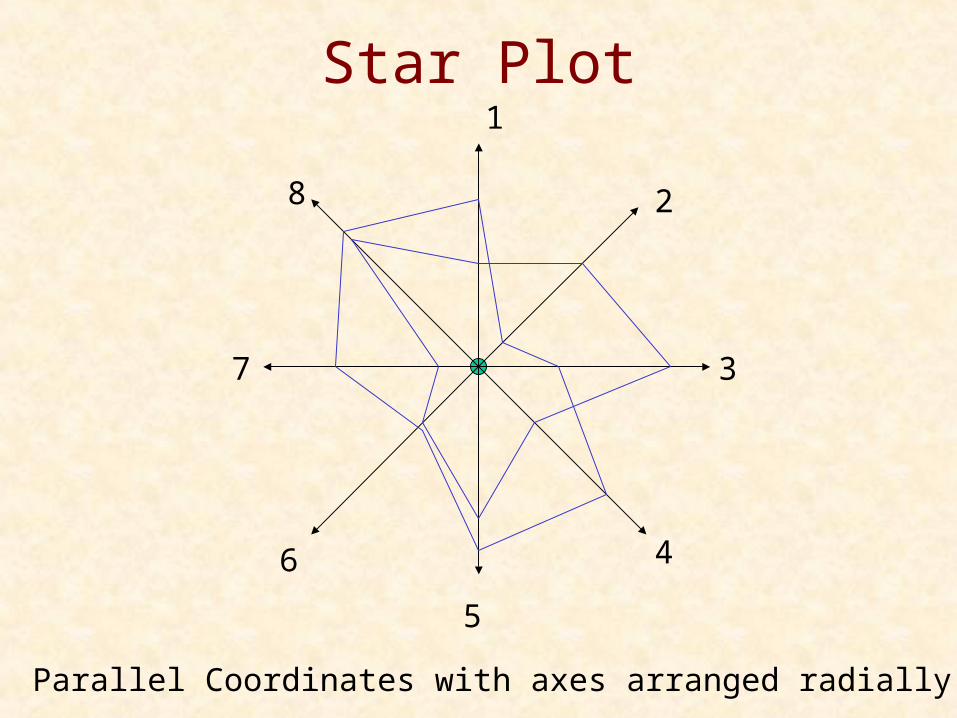
Star Plot1
8
7
6
5
4
3
2
Parallel Coordinates with axes arranged radially

Star Coordinates
• Kandogan, “Star Coordinates”•

Star Coordinates
Cartesian Star Coordinates
d1
d2
d5
d6
d8
v1
v2
v3
v4
v5
v6
v7
v8
p
d7 d3
d4
P=(v1,v2,v3,v4,v5,v6,v7,v8)P=(v1, v2)
v1
v2
d1
d2
p
Mapping:• Items → dots• Σ attribute vectors → (x,y)

Analysis
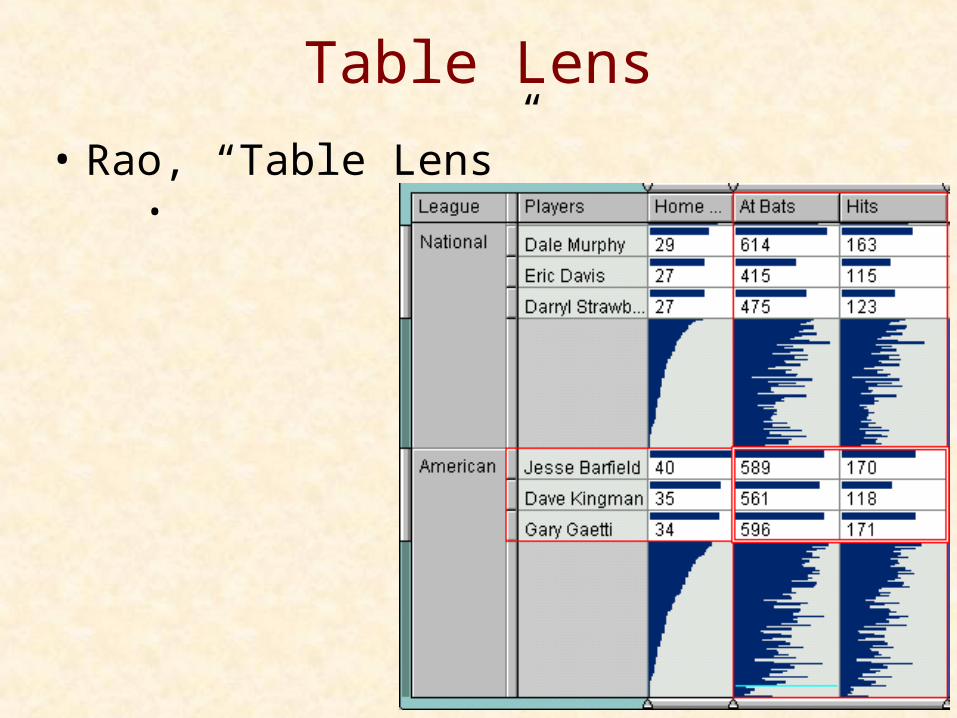
Table Lens
• Rao, “Table Lens”•

FOCUS / InfoZoom
• Spenke, “FOCUS”•
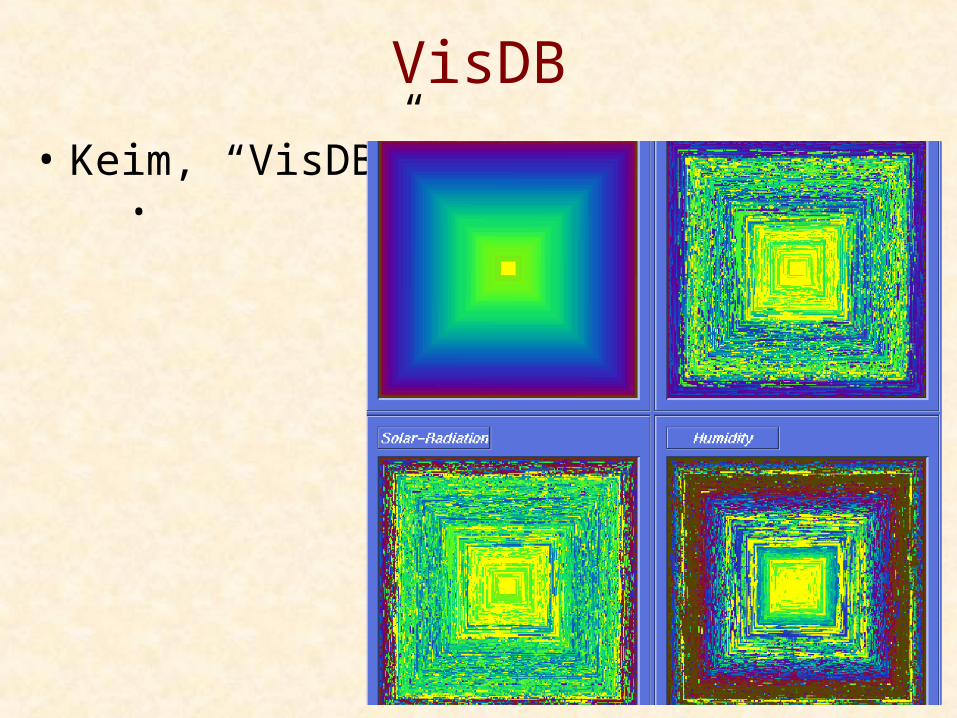
VisDB
• Keim, “VisDB”•

Pixel Bar Charts
• Keim

Comparison of Techniques

Comparison of Techniques
• ParCood: <1000 items, <20 attrs» Relate between adjacent attr pairs
• StarCoord: <1,000,000 items, <20 attrs» Interaction intensive
• TableLens: similar to par-coords» more items with aggregation
» Relate 1:m attrs (sorting), short learn time
• Visdb: 100,000 items with 10 attrs» Items*attrs = screenspace, long learn time, must query
• Spotfire: <1,000,000 items, <10 attrs (DQ many)» Filtering, short learn time
Multi-DimensionalFunctions
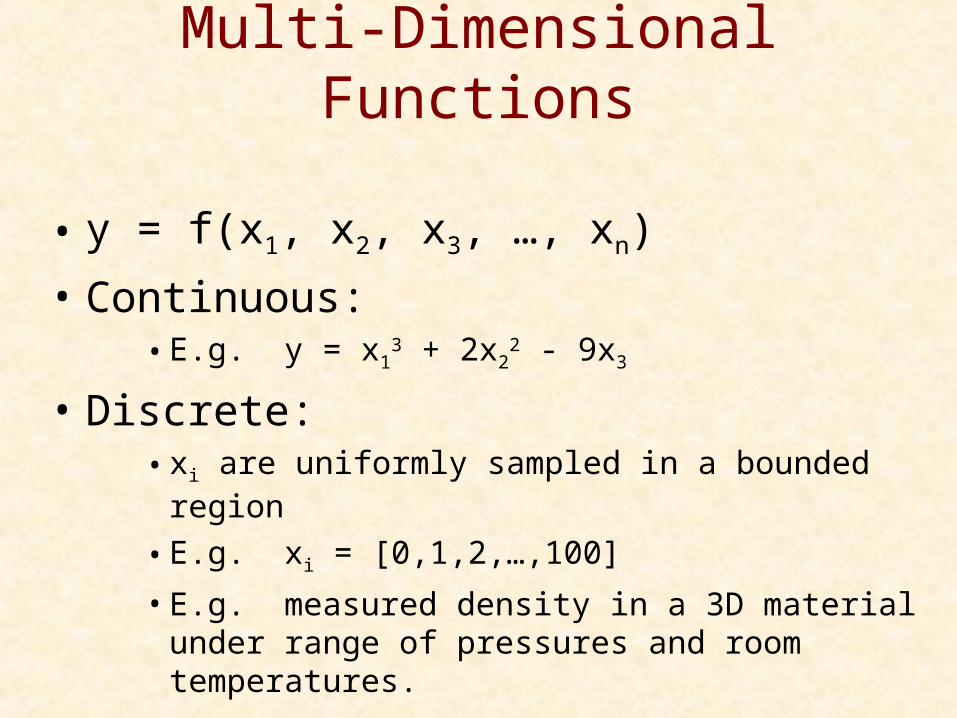
Multi-Dimensional Functions
• y = f(x1, x2, x3, …, xn)
• Continuous:• E.g. y = x1
3 + 2x22 - 9x3
• Discrete:• xi are uniformly sampled in a bounded region
• E.g. xi = [0,1,2,…,100]
• E.g. measured density in a 3D material under range of pressures and room temperatures.

Relations vs. Functions
• Relations:• R(A, B, C, D, E, F)
• All dependent variables (1 ind.var.?)
• Sparse points in multi-d dep.var. space
• Functions:• R(A, B, C, D, E, F, Y) : Y=f(A, B, C, D, E, F)
• Many independent variables
• Defined at every point in multi-d ind.var. space (“onto”)
• Huge scale: 6D with 10 samples/D = 1,000,000 data points

Multi-D Relation Visualizations…
• Don’t work well for multi-D functions
• Example:• Parallel coords
• 5D func sampled on 1-9 for all ind.vars.

• Typically want to encode ind.vars. as spatial attrs

1-D: Easy
• b = f(a)
• a x
• b y
a
b

2-D: Easy
• c = f(a, b)
• Height field:
• a x
• b y
• c z b
a
c

2-D: Easy
• c = f(a, b)
• Heat map:
• a x
• b y
• c color
b
a
c

3-D: Hard• d = f(a, b, c)
• Color volume:
• a x
• b y
• c z
• d color
• What’s inside?
a
b
c
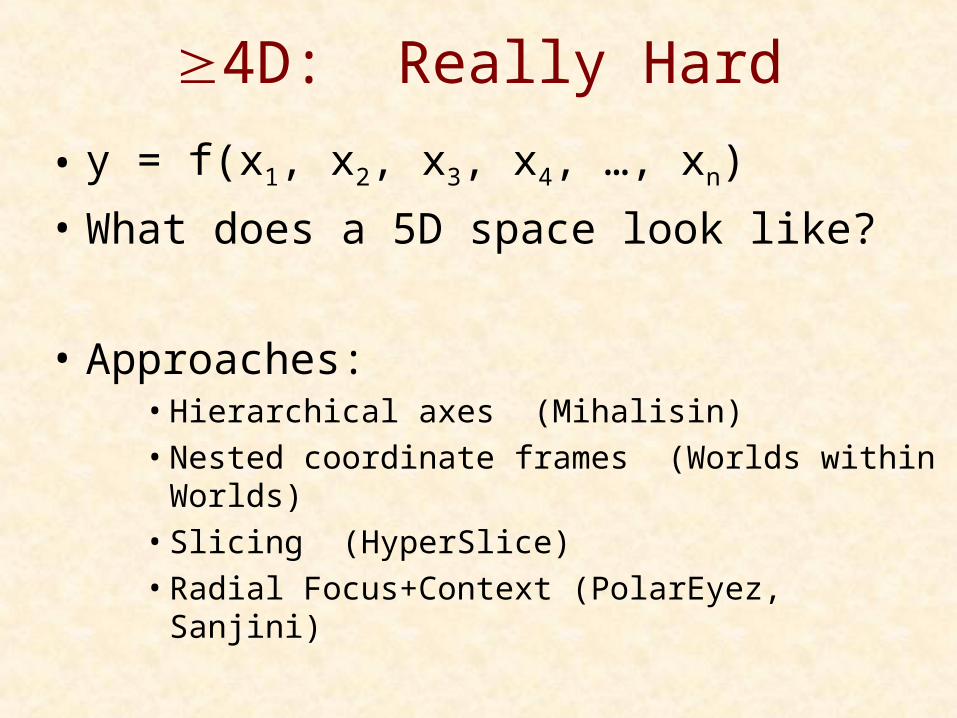
4D: Really Hard
• y = f(x1, x2, x3, x4, …, xn)
• What does a 5D space look like?
• Approaches:• Hierarchical axes (Mihalisin)
• Nested coordinate frames (Worlds within Worlds)
• Slicing (HyperSlice)
• Radial Focus+Context (PolarEyez, Sanjini)

Hierarchical Axes• 1D view of 3D function: (Mihalisin et al.)
f(x1, x2, x3)
x3
x2
x1

as in TableLens
5D9 samp/D


Hierarchical Axes• 2D view of 4D function (using heat maps)
• y = f(x1, x2, x3, x4)
• Discrete: xi = [0,1,2,3,4]
x1
x2
x3
x4
y = f(x1,x2,0,0) as color

Hierarchical Axes• Scale?
• 6d = 3 levels in the 2d approach
• 10 samples/d = 1,000,000 data points = 1 screen
• For more dimensions:• zoom in on “blocks”
• reorder dimensions

• 5D9 sample/D

Nested Coordinate Frames
• Feiner, “Worlds within Worlds”•

Slicing
• Van Wijk, “HyperSlice”•

Radial Focus+Context
• Jayaraman, “PolarEyez”
• infovis.cs.vt.edux1
x2x3
x4
x5
-x1
-x2-x4
-x5

Comparison
• Hierarchical axes (Mihalisin): •
• Nested coordinate frames (Worlds in Worlds)•
• Slicing (HyperSlice): •
• Radial Focus+Context (PolarEyez)•

Comparison
• Hierarchical axes (Mihalisin): • < 6d by 10 samples, ALL slices, view 2d at a time
• Nested coordinate frames (Worlds in Worlds)• < 5-8d, continuous, no overview, 3d hardware
• Slicing (HyperSlice): • < 10d by 100 samples, 2d slices
• Radial Focus+Context (PolarEyez)• < 10d by 1000 samples, overview, all D uniform, rays

Dynamic Queries

HomeFinder

Spotfire
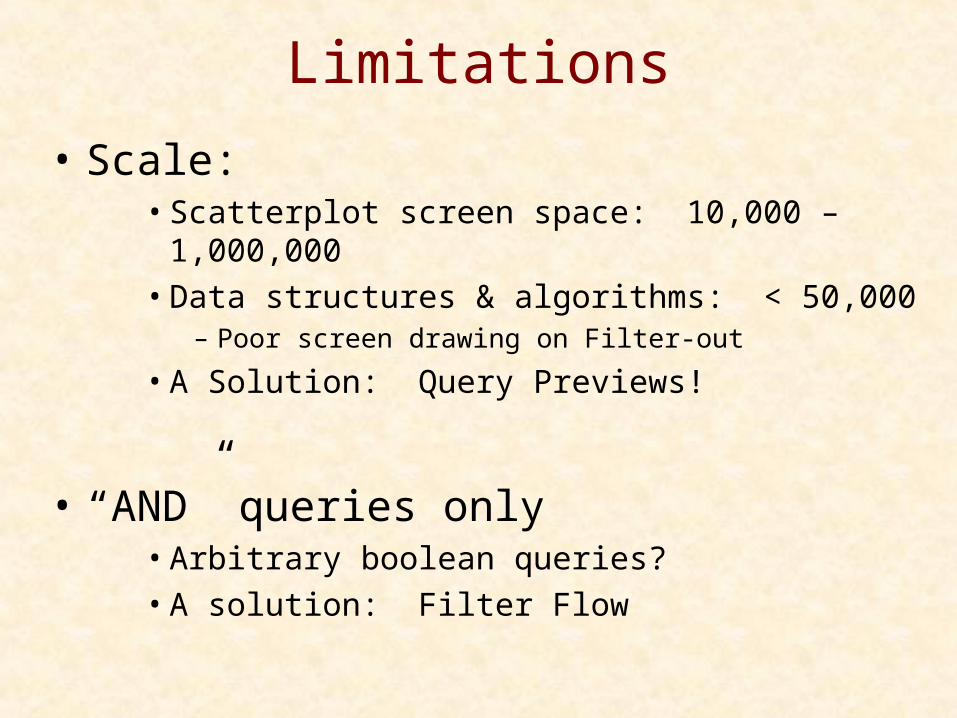
Limitations
• Scale:• Scatterplot screen space: 10,000 – 1,000,000
• Data structures & algorithms: < 50,000– Poor screen drawing on Filter-out
• A Solution: Query Previews!
• “AND” queries only• Arbitrary boolean queries?
• A solution: Filter Flow

DQ Algorithm
• Idea: incremental algorithm • only deal with data items that changed state
• When slider moves:• Calculate slider delta
• Search in data structure for data items in the delta region
• If slider moved inward (filter out):– Erase data items from visualization
• Else slider moved outward (filter in):– Draw data items on visualization Problem!
Overlapped items, erases items
underneath too

DQ Data Structures (1)
• Sorted array of the data for each slider
• Need counter for each data item = # sliders that filter it• Attribute Explorer visualizes these counters too!
• O(delta)
Year:
Delta

DQ Data Structures (2)
• Multi-dimensional data structure• E.g.: K-d tree, quad-tree, …
• Recursively split space, store in tree structure
• Enables fast range search, O()

DQ Data Structures (2)
• Multi-dimensional data structure• E.g.: K-d tree, quad-tree, …
• Recursively split space, store in tree structure
• Enables fast range search, O(logn)
Delta

Erasure Problem
• Each pixel has counter = number of items• Can visualize this for density!
• Z-buffer?
• Redraw local area only

Filter-Flow
BettyCatherineEdnaFredaGraceHildaJudyMarcusTom
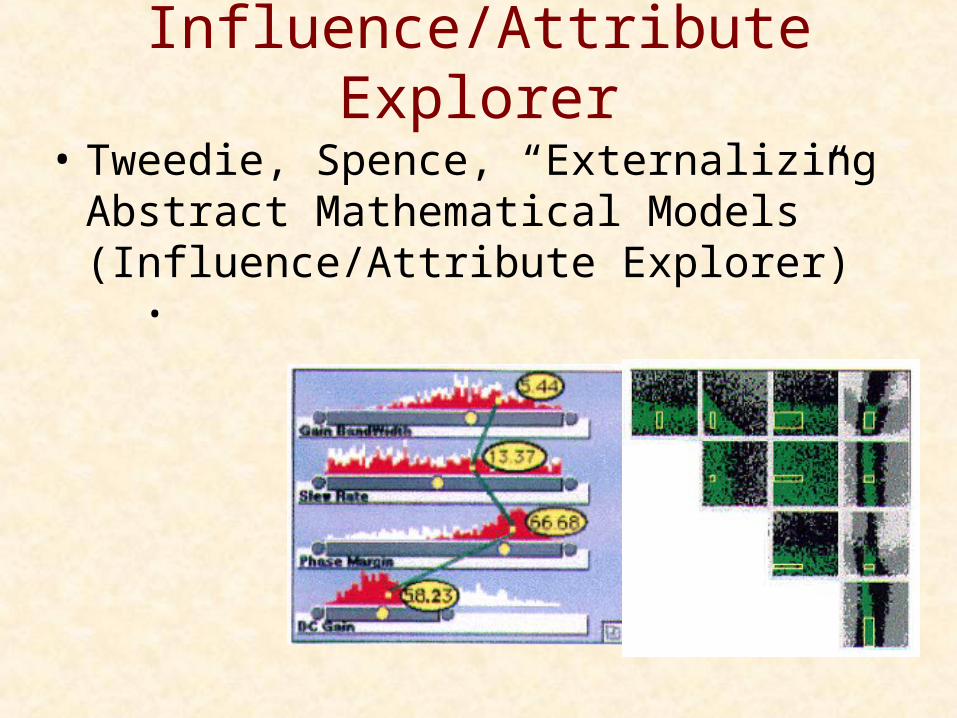
Influence/Attribute Explorer
• Tweedie, Spence, “Externalizing Abstract Mathematical Models” (Influence/Attribute Explorer)
•

Query Previews
• Doan, “Query Previews”•