multi-channel reliability and spectrum usage in real homes
TRANSCRIPT
Multi-Channel Reliability and Spectrum Usage inReal Homes: Empirical Studies for Home-Area
Sensor NetworksMo Sha, Gregory Hackmann, Chenyang Lu
Department of Computer Science and EngineeringWashington University in St. Louis, USA
Abstract—Home area networks (HANs) consisting of wirelesssensors have emerged as the enabling technology for importantapplications such as smart energy. These applications imposeunique QoS constraints, requiring low data rates but highnetwork reliability in the face of unpredictable wireless envi-ronments. This paper presents two in-depth empirical studies onwireless channels in real homes, providing key design guidelinesfor meeting the QoS constraints of HAN applications. Thespectrum study analyzes spectrum usage in the 2.4 GHz bandwhere HANs based on the IEEE 802.15.4 standard must coexistwith existing wireless devices. We characterize the ambientwireless environment in six apartments through passive spectrumanalysis across the entire 2.4 GHz band over seven days ineach apartment. We find that the wireless conditions in theseresidential environments are much more complex and variedthan in a typical office environment. Moreover, while 802.11signals play a significant role in spectrum usage, there alsoexists non-negligible noise from non-802.11 devices. The multi-channel link study measures the reliability of different 802.15.4channels through active probing with motes in ten apartments.We find that there is not always a persistently reliable channelover 24 hours, and that link reliability does not exhibit cyclicbehavior at daily or weekly timescales. Nevertheless, reliabilitycan be maintained through infrequent channel hopping, sug-gesting dynamic channel hopping as a key tool for meeting theQoS requirements of HAN applications. Our empirical studiesprovide important guidelines and insights in designing HANs forresidential environments.
I. INTRODUCTION
In recent years, there has been growing interest in providingfine-grained metering and control of home appliances in resi-dential settings as an integral part of the smart grid. Wirelesssensor networks offer a promising platform for home automa-tion applications because they do not require a fixed wiredinfrastructure. Hence, home area networks (HANs) based onwireless sensor network technology can be used to easilyand inexpensively retrofit existing apartments and householdswithout the need to run dedicated cabling for communicationand power. Similarly, assisted living applications such as vitalsign monitoring and real-time fall detection leverage HANs toprovide continuous health monitoring in the patient’s home.
Such HAN applications have increasingly adopted the IEEE802.15.4 wireless personal area network standard [1] to pro-vide wireless communication among sensors and actuators.
802.15.4 radios are designed to operate at a low data rate andbe inexpensively manufactured, making them a good fit forhome automation applications where energy consumption andmanufacturing costs are often at a premium. Industry standardssuch as ZigBee Smart Energy [2] have adopted 802.15.4technology for use in residential automation applications. TheIETF has promoted efforts to standardize IPv6 on top of802.15.4 for integrating wireless sensors into the Internet [3],[4].
However, meeting the QoS requirements of these emergingapplications often poses unique technical challenges, particu-larly in residential environments. A typical HAN applicationmay feature a low data rate but require high network reliability.These QoS constraints are easily be met by wired communica-tion but are non-trivial when dealing with unreliable wirelesschannels. Notably, the low-power wireless sensor networksused in these applications are highly susceptible to externalfactors beyond the application’s control, such as uncontrolledinterference from other devices. In particular, 802.15.4 sharesthe unlicensed 2.4 GHz spectrum with Wi-Fi access points,Bluetooth peripherals, cordless phones, and numerous otherdevices prevalent in residential environments.
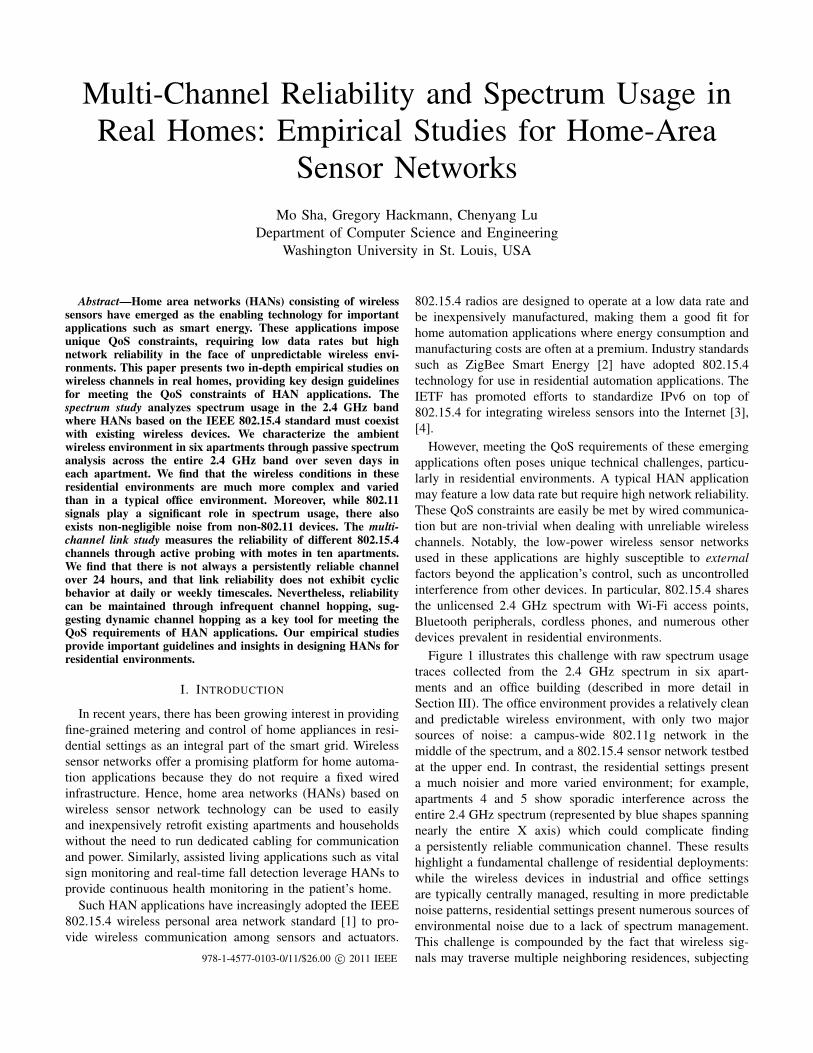
Figure 1 illustrates this challenge with raw spectrum usagetraces collected from the 2.4 GHz spectrum in six apart-ments and an office building (described in more detail inSection III). The office environment provides a relatively cleanand predictable wireless environment, with only two majorsources of noise: a campus-wide 802.11g network in themiddle of the spectrum, and a 802.15.4 sensor network testbedat the upper end. In contrast, the residential settings presenta much noisier and more varied environment; for example,apartments 4 and 5 show sporadic interference across theentire 2.4 GHz spectrum (represented by blue shapes spanningnearly the entire X axis) which could complicate findinga persistently reliable communication channel. These resultshighlight a fundamental challenge of residential deployments:while the wireless devices in industrial and office settingsare typically centrally managed, resulting in more predictablenoise patterns, residential settings present numerous sources ofenvironmental noise due to a lack of spectrum management.This challenge is compounded by the fact that wireless sig-nals may traverse multiple neighboring residences, subjecting978-1-4577-0103-0/11/$26.00 c⃝ 2011 IEEE

2
Figure 1. Histogram over 7 days’ raw energy traces. X axis indicates 802.15.4 channels, Y axis indicates power, and color indicates how often a signal wasdetected at x GHz with an energy level of y dBm.
neighbors’ networks to interference beyond their control. Forexample, in just one apartment in our dataset, a deployedlaptop was able to decode beacons from 28 distinct Wi-Fiaccess points.
In this paper, we present a two-part empirical study whichaims to characterize the real-world network performance ofHANs, focusing specifically on devices based on the 802.15.4standard. Our study is divided into two major parts. First, wecarry out an analysis over spectrum analyzer traces collected insix apartments. This spectrum study of ambient wireless con-ditions in homes illustrates the challenge of finding a “clean”part of the shared 2.4 GHz spectrum in such settings. Ouranalysis demonstrates that the wireless environments in theseapartments are much more crowded and more variable thanan office setting. Moreover, while 802.11 WLANs contributea significant fraction of the spectrum usage, we also identifiedsignals across the 2.4 GHz band indicating non-negligiblenoise from non-802.11 devices.
Second, we explore how these challenging environmentsmay directly affect applications’ QoS, through an active prob-ing study of wireless link reliability across all 16 channels inten apartments. This second study focuses on packet receptionratio (PRR), which is both a direct indicator of link reliabilityand closely related to other important QoS metrics suchas latency and energy consumption. From this active study,we make several more key observations which could greatlyimpact the QoS of wireless sensor networks deployed in res-idential environments: (1) Link reliability varies significantlyfrom channel to channel and over time. (2) In a typicalapartment environment, there may not be a single channelwhich is persistently reliable for 24 hours. (3) Exploitingchannel diversity by infrequent channel hopping at runtime
can effectively maintain long-term reliable communication. (4)Channel conditions are not cyclic. These findings indicate theimportance of channel diversity in achieving reliable HANdeployments and provide design guidelines for meeting theQoS requirements of HAN applications.
The rest of the paper is organized as follows. Section IIreviews related work. Section III discusses the findings ofour passive spectral study. Section IV then presents ouractive probing study. Finally, we conclude in Section V byhighlighting the implications of our findings on HAN design.
II. RELATED WORK
Several recent studies have aimed to characterize the im-pact of interference on wireless networks through controlledexperiments [5]–[9]. [10]–[12] present theoretical analysisbased on simulation study. Gummadi et al. [13] presents anempirical study on the impact of ZigBee and other interferers’impact on 802.11 links, proposing to alleviate interferencewith rapid channel-hopping in conjunction with 802.11b’s ex-isting support for Direct-Sequence Spread Spectrum (DSSS).Srinivasan et al. [14] examines the packet delivery behaviorof two 802.15.4-based mote platforms, including the impactof interference from 802.11 and Bluetooth. Liang et al. [15]measures the impact of interference from 802.11 networkson 802.15.4 links, proposing the use of redundant headersand forward error correction to alleviate packet corruption. Incontrast to these controlled studies, our own study examinesthe performance of HANs under normal residential activity.Moreover, our study considers ambient wireless conditions asa whole, rather than analyzing specific sources of interference.For instance, our spectrum study in six apartments showedthat — while Wi-Fi is a significant source of interference in

3
residential environments — non-Wi-Fi devices may also benon-negligible sources of interference. This result indicatesthat solutions specifically targeted at one type of co-existingwireless technology may not be generally applicable to allresidential environments.
Bahl et al. [16] presents a study of UHF white spacenetworking, while Chen et al. [17] presents a large-scalespectrum measurement study followed by a 2-dimensionalfrequent pattern mining algorithm for channel prediction.These studies focus on supporting wide-area networks basedon white space networking and the GSM band, respectively.Our own study focuses on the reliability of static, indoorwireless sensor networks designed for home environments,and on the unlicensed 2.4 GHz band used by IEEE 802.15.4and shared by other wireless devices prevalent in residentialenvironments. Accordingly, our study provides new insightsinto the reliability of HANs, including the high variabilityof residential wireless environments, the lack of persistentlyreliable wireless channels, the diverse sources of interference(including the non-negligible impact of non-Wi-Fi devices),and the effectiveness of infrequent channel hopping in main-taining link reliability.
Papagiannaki et al. [18] performed an empirical study ofhome networks based on 802.11 technology. Our study con-siders devices based on the 802.15.4 standard, which operateat a much lower transmission power than 802.11 devices andhence are significantly more susceptible to interference. Ourstudy therefore leads to a different set of observations thatunderscores the impact of spectrum usage on these low-power802.15.4 networks.
Ortiz et al. [19] evaluates the multi-channel behavior of802.15.4 networks in a machine room, a computer room, andan office testbed. Ortiz’s study finds path diversity to be aneffective strategy to ensure reliability. Our own study findsthat residential environments provide significantly differentwireless conditions than an office, with the residential settingsexhibiting more complex noise patterns and higher variability.This difference may be attributed to homes being open envi-ronments with no centralized control on spectrum usage; many2.4 GHz devices are used in homes, and the physical proximityof some residences means that strong interferers (such as802.11 APs, Bluetooth devices, and cordless phones) may evenaffect the wireless conditions in other homes. Accordingly, ouractive study in Section IV finds exploiting channel diversity tobe an attractive strategy for ensuring reliability in residentialenvironments. We note that channel and path diversity areorthogonal strategies; the two could be used together inparticularly challenging wireless environments.
Hauer et al. [20] discusses a multi-channel measurementof Body Area Networks (BANs) and proposes a noise floor-triggered channel hopping scheme to detect and mitigatethe effects of interference. Hauer’s study features controlledindoor experiments along with outdoor experiments carriedout during normal urban activity. Shah el al. [21] performed acontrolled experiment to study the effect of the human body onBANs. Shah’s study measures the effects of various activities
(sitting, standing, and walking) and node placements (ear,chest, waist, knee, and ankle) on 802.15.4 radio performance.Instead of body-area networks, our own study focuses onHANs designed for smart energy, which feature significantlydifferent setups and wireless properties. Moreover, our study isperformed under normal home activities, providing a realisticsetting to evaluate HAN performance.
III. WIRELESS SPECTRUM STUDY
In this section, we present a study of the ambient wirelessconditions in real-world residential environments. For thisstudy, we collected 7 days’ energy traces in the 2.4 GHzspectrum from six apartments in different neighborhoods.
As a baseline for comparison, we also collected energytraces from an office in Bryan Hall at Washington University inSt. Louis. We note that this baseline is meant to illustrate howcontrolled testbed settings within an office environment maypotentially be very different from real home environments; it isnot meant to be a comprehensive study of office environments.
Specifically, this study addresses the following questions.(1) Is there a common area of the 2.4 GHz spectrum whichis free in all apartments? (2) Does spectrum usage changewith time? (3) Do residential settings have similar spectrumusage properties as office settings? (4) Is 802.11 the dominantinterferer in residential environments?
A. Experimental Methodology
We are primarily interested in the spectrum usage between2.400 GHz and 2.495 GHz, which are the parts of the spectrumused by the 802.15.4 standard for wireless sensor networks.To analyze this part of the spectrum, we collected energytraces using a laptop equipped with a Wi-Spy 2.4x spec-trum analyzer [22]. The Wi-Spy sweeps across the 2.4 GHzspectrum approximately once every 40 ms, returning a signalstrength reading (in dBm) for each of 254 discrete frequencies.We continuously collected energy traces for 7 days in eachapartment during the residents’ normal daily activities, as wellas in an office in Bryan Hall. The resulting traces contained15,120,000 readings for each of the 254 frequencies, resultingin a data set of approximately 2.5 GB per location. Figure 1presents a histogram of the raw spectrum usage data in allseven datasets.
For the purposes of analysis, we apply a thresholdingprocess like that employed in [17] to convert signal strengthreadings into binary values, with 0 denoting a channel be-ing idle and 1 denoting a channel being busy. We foundexperimentally that a receive signal strength of −80 dBmis needed to create a high-quality link between a pair ofChipcon CC2420 radios; however, a noise level of −85 dBmor higher would be enough to induce packet drops on such alink. (For brevity, we discuss this experiment in more detailin [23].) Hence, throughout our analysis, we use −85 dBmas our threshold value to denote a busy channel. Using aconstant threshold allows for a fair comparison across differentapartments. While the specific numerical results of our analysisare dependent on the threshold, the trends and observations

4
Figure 2. Channel occupancy rate. X axis designates channels, Y axisdesignates experimental settings, and color represents the proportion ofreadings above the occupancy threshold.
we make from these results should generally apply to otherthreshold values.
To assess the impact of ambient wireless signals on HANs,we aggregate the data from the Wi-Spy’s 254 channels into the16 channels used by the 802.15.4 standard; i.e., an 802.15.4channel is deemed busy if any of its corresponding Wi-Spychannels are busy.
B. Is There a Common Idle Channel in Different Homes?
We first considered whether any 802.15.4 channel can beconsidered “clean” in all the tested residences. If such achannel exists, it could be used as a default, factory presetchannel for HANs. For example, channel 26 is often assumedas a good default channel, because it does not overlap withthe spectrum used by 802.11 in North America.
To determine this, we calculate the channel occupancy rate— i.e., the proportion of samples that exceeded the −85 dBmthreshold — over all channels in the six apartments and theoffice building. High occupancy rates correspond to a largeproportion of samples where interference could have causedpacket loss on an otherwise high-quality link.
Figure 2 plots the occupancy rate of each channel in eachlocation. If we compare Figures 1 and 2, we can note variousphenomenon that prevent finding a common idle channel. Forexample, apartment 5 has a channel occupancy rate above 95%for 15 of its 16 channels. Notably, even channel 26 has achannel occupancy rate as high as 95.04%, contradicting thecommonly-held assumption that channel 26 will be open. Theuniformly high occupancy rate across channels is likely causedby a relatively high-power spread-spectrum signal across thewhole 2.4 GHz spectrum, which appears in Figure 1 as a seriesof thin blue arches. Devices with such wireless footprints in-clude Bluetooth transmitters, baby monitors, wireless speakersystems, and game controllers [24]. (Unfortunately, by the verynature of residential environments lacking central managementof wireless devices, there is no way to be certain about thesources of some of these phenomena.)
The only channel in apartment 5 with an occupancy ratebelow 95% is channel 15, which in contrast has an occupancyrate of 100.0% in apartments 3 and 4; thus, there is no common
(a) Daily standard deviation
(b) Hourly standard deviation
(c) 5-minute standard deviation
Figure 3. The standard deviation in channel occupancy rate at differenttimescales.
good channel in these apartments. In the case of apartment 3,channel 15 is unusable due to it intersecting with the middleof multiple 802.11 APs, represented as superimposed arcs onthe left side of apartment 3’s energy trace. For apartment 4, wesee that only channels 25 and 26 have low occupancy rates;this phenomenon is likely caused by the tall blue shape acrossmost of apartment 4’s energy trace, corresponding to somesporadic but high-power interferer.
Observation S1: There may not exist a common idle channelacross different homes, due to significant diversity in theirspectrum usage patterns.
C. Does Spectrum Usage Change with Time?
We next explored whether the spectrum was stable inthese residential settings. If spectrum is stable within a given

5
Figure 4. A comparison of the average channel occupancy rate betweenchannels that overlap with Wi-Fi and channels that do not.
apartment, it would be possible for a technician to pick a single“best” channel for the HAN at deployment time and expect itto work well over a long time period.
To determine this, we calculated the standard deviation inoccupancy (�) for each apartment and each channel. Figure 3plots the standard deviation from day-to-day, from hour-to-hour, and for every 5 minutes. We see that channel conditionsin most apartments can be quite variable, regardless of thetimescale used. Except for apartment 4, � ranges from 24.0%–36.2% for the worst channel at a daily timescale, from 27.4%–43.9% at an hourly timescale, and 36.4%–50.0% at a 5-minutetimescale. Apartment 4 is stable across the spectrum on aday-to-day basis, with � ≤ 2.5% for all channels. However,even for this apartment, some variability emerges at shortertimescales, with channel 24 featuring a � = 14.9% on anhourly timescale and � = 36.0% at a 5-minute timescale.
We also note that the office had much lower variability thanall but apartment 4. For example, at a daily timescale, 10 ofthe 16 channels had � < 1.0%, and the most highly-variablechannel had � of only 13.7%. Indeed, even at a 5-minutetimescale, only three channels reveal significant variability;these three channels are at the edge of the campus 802.11gnetwork (15), at the center of the same network (19), and atthe center of the building’s 802.15.4 testbed (25).
Observation S2: Spectrum occupancy in homes can exhibitsignificant variability over time, whether looking at timescalesof days, hours, or minutes.
D. Is Wi-Fi the Dominant Source of Spectrum Usage?
Because of Wi-Fi’s ubiquity and relatively high transmissionpower, it is often treated as a dominant interferer. Thus, our fi-nal analysis of our passive spectrum data is to identify whetherthere are other significant sources of interference. If Wi-Fiis indeed the dominant interferer in residential settings, thenHANs could leverage solutions which are specifically designedto avoid interference from Wi-Fi networks (e.g., [15]).
A visual inspection of Figures 1 and 2 suggests otherimportant interferers besides Wi-Fi. Wi-Fi APs have a dis-tinctive radiation pattern that manifests in Figure 1 as arcs thewidth of several 802.15.4 channels. For example, the energytraces for apartment 3 show two distinct arcs that are likely
caused primarily by 802.11 APs configured to two differentchannels. Referring to Figure 2, we see that these areas ofthe spectrum are indeed highly occupied. However, looking atthe energy trace for apartment 5, we see evidence of Wi-FiAPs on only part of the spectrum; nevertheless, the channeloccupancy rate is above 95% for nearly the entire spectrum.This phenomenon can be explained by the series of blue arcsacross the 2.4 GHz spectrum, which indicate sporadic buthigh-powered spread-spectrum transmissions. (Again, by thenature of the environment, we cannot be certain about thesource of this noise pattern.)
To quantify the relative impact of Wi-Fi, we leverage afeature of the Wi-Spy which logs the service set identifier(SSID) and 802.11 channel of all visible 802.11 access points(APs)1. Based on this data, we are able to divide the 802.15.4channels in each apartment into two groups: those that overlapwith 802.11 APs detectable from the corresponding apartment,and those that do not. We then calculated the average channeloccupancy rate for each of the two groups in each apartment,as shown in Figure 4.
In most of the apartments, there is a clear distinctionbetween the overlapping and non-overlapping channels. Forexample, apartment 1 has an average occupancy rate of 89.7%for the overlapping channels compared to 18.3% for thenon-overlapping ones. But strikingly, we find that the non-overlapping channels are not always significantly more idlethan those which overlap with Wi-Fi APs. In apartments 4 and5, the channel occupancy rates of the non-overlapping chan-nels are similar to the overlapping ones; indeed, in apartment5, the non-overlapping channels are slightly more occupiedon average than the overlapping ones. This observation canhave important implications on the design of HANs, in thatsolutions specifically designed to deal with Wi-Fi interferencemay not be effective in all residential environments.
Observation S3: While Wi-Fi is an important source ofinterference in residential environments, other interferers canalso be non-negligible contributors to spectrum occupancy.
IV. MULTI-CHANNEL LINK STUDY
In this section, we present a multi-channel link study inhomes. The spectrum study presented in Section III focuseson characterizing the ambient wireless environment in homes.While link quality can be significantly influenced by interfer-ence from existing wireless signals, other factors such as signalattenuation and multi-path fading due to human activities canalso impact the reliability of low-power wireless links. Ourlink study directly evaluates the multi-channel behavior ofHANs by actively sending packets between motes equippedwith 802.15.4 radios.
Specifically, this study addresses the following questions.(1) Can a HAN find a single persistently reliable channelfor wireless communication? (2) If no single channel can beused for reliable operation, can the network exploit channel
1Although many APs may be configured not to broadcast their SSID, wehave observed that the Wi-Spy software can still identify these “hidden” accesspoints in practice.

6
Figure 5. Floor plan of an apartment used in the study.
diversity to achieve reliability? (3) Do channel conditionsexhibit cyclic behavior over time?
A. Experimental Methodology
For this active study, we carried out a series of experimentsin ten real-world apartments in different neighborhoods. (Dueto the participating residents moving, only four of the apart-ments in this study are the same as those instrumented in thespectrum study.) Figure 5 shows an example floor plan of oneof the apartments used in the study; a similar topology wasdeployed in the other apartments. Each experiment was carriedout continuously for 24 hours with the residents’ normal dailyactivities.
Our experiments were carried out using networks of TmoteSky and TelosB [25] motes. Each mote is equipped withan IEEE 802.15.4 compliant Chipcon CC2420 radio [26].IEEE 802.15.4 radios like the CC2420 can be programmed tooperate on 16 channels (numbered 11 to 26) in 5 MHz steps.We leverage the CC2420’s Received Signal Strength (RSS)indicator in our experiments to measure the signal power ofenvironmental noise. Our experiments are written on top of theTinyOS 2.1 operating system [27] using the CC2420 driver’sdefault CSMA/CA MAC layer.
We measure the packet reception ratio (PRR), defined asthe fraction of transmitted packets successfully received by thereceiver. PRR is not only a direct indicator of link reliability,but also closely related to other important QoS metrics such aslatency and energy consumption. To measure the PRR of allchannels at a fine granularity, we deployed a single transmitternode in each apartment which broadcast packets over eachof the 16 channels. Specifically, the transmitter sent a batchof 100 consecutive packets to the broadcast address using asingle wireless channel, then proceeded to the next channel in around robin fashion. The process of sending 16 batches of 100packets repeated every 5 minutes. The recipient nodes recordthe PRR over each batch of packets into their onboard flashmemory. The use of a single sender and multiple recipientsallowed us to test multiple links simultaneously while avoidinginterference between senders. (Inter-link interference is not amajor concern in many HANs due to the low data rates thatare typically employed; for example, 1 temperature reading
every 5 minutes is sufficient for an HVAC system to controlambient temperature.)
It is worth noting that HAN applications such as smartenergy require persistent, long-term reliability. Transient linkfailures are non-negligible — these failures represent periodswhere parts of a household may experience sporadic serviceor no service at all (e.g., changing the thermostat may have noeffect until a wireless link is restored minutes or hours later).Hence, our study looks not just at the average PRR of eachlink but at its entire range of performance, including thoseoutliers that indicate temporary failures.
In [14], links with a PRR below 10% were found to bepoor-quality, and links with a PRR between 10% and 90%to be bursty. Accordingly, we use a PRR of 90% throughoutthis section as a threshold to designate links as “good” or“reliable”.
B. Is There a Persistently Good Channel?
We first analyzed our data from the perspective of findinga single, persistently good channel across all of the testedapartments. Again, if a common good channel exists across allapartments, then it could be used as a preset default channelfor HANs. For this analysis, we grouped the data from all linksin all apartments together and then subdivided it by channel.Figure 6 presents a box plot of the PRR in 4 channels in all theapartments, where the PRR has been calculated over 5-minutewindows. (The remaining 12 channels exhibit similar behaviorand are omitted for reasons of clarity.) From this figure, wesee significant variations in PRR on the same channel whenmoving from apartment to apartment. For example, channel11 achieves a median PRR > 90% in apartments 1, 3, and9, albeit with many outliers; however, the same channel has anear-zero median PRR in apartment 2. Only channel 26 has amedian PRR above the 90% threshold in all apartments.
We also see significant variations in PRR from channelto channel, even in the same apartment. Strikingly, thesevariations even affect channel 26, which is often considered anopen channel since it is nominally outside the 802.11 spectrumin North America. Although channel 26 achieves uniformlyhigh median PRR in all apartments, there are numerous pointsduring the experiment where the PRR falls much lower. Forexample, apartment 9 has a 25th percentile PRR of 0.0%,indicating a substantial portion of the experiment where thechannel experienced total link failure.
Further analysis showed that there is not likely to be a singlegood channel across multiple links in the same apartment. Weregrouped the PRR data, this time looking at the performanceof each link/channel pair individually. Figure 7 presents a box-plot of the PRR for all five links within one apartment; again,for reasons of clarity, we present the data from only 4 of the16 channels. We observe that the median PRR on a givenchannel varies greatly across links, particularly for outlierpoints. Again, this variation even affects channel 26: all fivelinks have at least one outlier below the 90% threshold, andfour links have numerous outliers below the threshold. Link 1

7
Channels
PRR
11 16 21 26 11 16 21 26 11 16 21 26 11 16 21 26 11 16 21 26 11 16 21 26 11 16 21 26 11 16 21 26 11 16 21 26 11 16 21 260
20
40
60
80
100PR
R
ChannelsFigure 6. Box plot of the PRR for four channels in all ten apartments, calculated over 5-minute windows. Central mark in box indicates median; bottomand top of box represent the 25th percentile (q1) and 75th percentile (q2); crosses indicate outliers (x > q2 + 1.5 ⋅ (q2 − q1) or x < q1 − 1.5 ⋅ (q2 − q1));whiskers indicate range excluding outliers. Vertical lines delineate apartments.
11 16 21 26 11 16 21 26 11 16 21 26 11 16 21 26 11 16 21 260
50
100
Channels
PRR
Figure 7. Box plot of the PRR of five different links in the same apartment on four channels, calculated over 5-minute windows. Vertical lines delineatelinks.
Figure 8. The lowest PRR observed on each link’s most reliable channel.
shows particularly high variance on channel 26, with a 25th-percentile PRR of only 73.5% in spite of a 98.0% median PRR.We also note that all four channels had numerous outliersbelow a PRR of 10%; that is, any single channel selectionwould have led to at least one link experiencing near-totaldisconnection at some point during the day.
Interestingly, these large channel-to-channel variations sug-gest that the links in our experiment are outside the “grayregion” where small temporal changes in link quality can causebursts of packet losses [28]. Moreover, each link had at leastone channel with a high median PRR. Had the links been inthe gray region, we would have expected lower median PRRor uniform variability across all channels.
Observation L1: Link reliability varies greatly from channelto channel.
Looking at the entire dataset across all apartments, we foundthat few links were able to achieve a consistently high PRR,even on their most reliable channels. Figure 8 plots the lowestPRR observed on each link’s most reliable channel: i.e., forthe channel which achieves the highest average PRR over24 hours, we plot the worst PRR out of all the 100-packetbatches. Notably, only 12 of the 34 links in our dataset areable to persistently reach the 90% PRR threshold on even theirbest channel. Indeed, even lowering the threshold to 70%,more than half the links in our dataset would still have nopersistently good channel.
Observation L2: Link reliability varies greatly over time,even within the same channel. Hence, even when selectingchannels on a per-link basis, there is not always a singlepersistently reliable channel.
C. Is Channel Diversity Effective?
Our analysis above indicates that using a single channelis often not acceptable when long-term reliability must bemaintained. Thus, a natural question to ask is whether it isfeasible to exploit channel diversity to achieve reliability insituations where single channel assignments are not practical.
To understand the potential for channel hopping, we retro-spectively processed our dataset to find the minimum numberof channel hops needed to maintain a 90% PRR threshold.Figure 9(a) plots the number of channel hops required for10 links in the dataset, one randomly selected from eachapartment. We find that relatively few channel hops are needed

8
(a) Minimum number of channel hops required; one linkrandomly selected per apartment.
(b) The proportion of windows where the PRR threshold wasmet.
Figure 9. Retrospective channel-hopping analysis in different apartments.
to maintain link reliability; in no case is more than 20 hopsrequired per day.
We note that there are periods where none of the 16 channelsmeet the PRR threshold, and hence no channel hopping occursduring these times. Nevertheless, channel-hopping can signifi-cantly reduce the number of link failures compared to pickingthe single “best” channel (i.e., that with the highest averagePRR). Figure 9(b) compares the proportion of windows whichmeet the 90% threshold under two retrospective strategies:an ideal channel-hopping strategy that maintains the PRRthreshold with the minimum number of channel hops, and astrategy that fixes each link to its single “best” channel with thehighest average PRR. (Note that both strategies make decisionsbased on the entire data trace retrospectively, and hence cannotbe employed at run time; they are chosen here to analyzethe potential benefit of channel hopping.) In some cases,the improvements achieved by channel hopping are modest.For example, links 6 and 7 only achieve a 0.7% and 1.0%higher success rate under channel hopping, largely becausetheir success rates were already high without channel hopping.However, in most cases, we find notable improvements in linksuccess. For example, 6 out of the 10 links experience atleast 5% fewer failures with channel hopping than with theirsingle best channel; and links 1 (11.0%) and 4 (13.1%) havesubstantially higher success rates with channel hopping.
Channel hopping has been proposed in industry standardsas a means for improving wireless link reliability, includingestablished standards like Bluetooth’s AFH [29] and newerstandards such as WirelessHART’s TSMP [30] and the forth-
(a) PMCC of PRRs during the same time on consecutivedays.
(b) PMCC of PRRs during the same time in consecutiveweeks.
Figure 10. The Pearson’s product correlation coefficient (PMCC) comparingthe PRR at the same time on consecutive days or weeks.
coming IEEE 802.15.4e [31]. The results of our analysisconfirm that this feature is indeed beneficial for maintaininglink reliability in challenging residential environments.
Observation L3: Channel hopping is effective in alleviatingpacket loss due to channel degradation. Infrequent channelhopping can effectively maintain reliable communication.
D. Can Hopping be Scheduled Statically?
Because channel quality varies over time, we next exploredwhether it exhibits cyclic properties (e.g., due to recurrenthuman activities and schedules). If so, then channel-hoppingcould be implemented in a lightweight fashion by generatinga static channel schedule for each environment. To performthis comparison, we carried out an extended experiment usingsame setup in one apartment over a period of 14 days. We thencalculated the Pearson product-moment correlation coefficient(PMCC) [32], a common measure of dependence between twoquantities, as r. Intuitively, r values near −1 or 1 indicatestrong correlation, while values near 0 indicate independence.
Figure 10(a) plots r for PRRs calculated at the same timeson subsequent days (e.g., 4 PM on Monday vs. 4 PM onTuesday). Figure 10(b) compares the PRR during the sametime in consecutive weeks (e.g., 4 PM on Monday vs. 4 PMon the next Monday). ∣r∣ is almost always smaller than 0.4,regardless of the channel used; this indicates that there is noobvious correlation between consecutive days or consecutiveweeks. Therefore, channel-hopping decisions must be madedynamically based on channel conditions observed at runtime.
Observation L4: Channel conditions are not cyclic, sochannel-hopping decisions must be made dynamically.

9
V. CONCLUSION
HANs based on wireless sensor network technology repre-sent a promising communication platform for emerging homeautomation applications such as smart energy. These emergingapplications often impose stringent QoS requirements in termsof network reliability, which are made challenging by thecomplex and highly variable wireless environments in typicalresidential environments. This paper presents an empiricalstudy on the performance of HANs in real-life apartments,looking both at passive spectrum analysis traces and anactive probing link study. The observations made in our studyhighlight the significant challenges that face HAN applicationsfor achieving acceptable QoS in residential settings. Never-theless, our observations also suggest that these challengesmay be tamed through the judicious use of channel diversity.Specifically, we may distill our findings into set of key designguidelines for developing reliable HANs:
1) Channel selection can have a profound impact on HANreliability. Channel selection cannot be simply relegateda static channel assignment, whether made at the factoryor at deployment time. (S1, L1, L2)
2) Although Wi-Fi is a major source of channel usage,other wireless technologies may also contribute sig-nificantly to channel usage. Solutions which target asingle interfering technology are not always sufficientin residential environments. (S3)
3) Reliable communication can be maintained through in-frequent channel hopping. (L3)
4) Channel hopping cannot be performed based on a static,cyclic schedule. (L4) Instead, channel-hopping decisionsshould be made dynamically based on conditions ob-served at runtime. (S2, L2)
We believe that our findings and insights will provide generaldesign guidelines and impact the development of HANs thatare gaining increasing importance with the emergence of smartenergy as the “killer app” for wireless sensor networks.
ACKNOWLEDGMENT
This work was supported by NSF under grants CNS-0448554 (CAREER) and CNS-1035773 (CPS), and by gener-ous support from Broadcom Corporation and Emerson ClimateTechnologies.
REFERENCES
[1] IEEE Computer Society, Part 15.4: Wireless Medium Access Control(MAC) and Physical Layer (PHY) Specifications for Low-Rate WirelessPersonal Area Networks (WPANs), 2006.
[2] ZigBee Standards Organization, ZigBee Smart Energy Profile Specifica-tion, 2008.
[3] “IPv6 over low power WPAN,” http://datatracker.ietf.org/wg/6lowpan/charter/.
[4] “Routing over low power and lossy networks (ROLL),” http://datatracker.ietf.org/wg/roll/charter/.
[5] X. Jing, S. S. Anandaraman, M. A. Ergin, I. Seskar, and D. Raychaud-huri, “Distributed coordination schemes for multi-radio co-existencein dense spectrum environments: An experimental study on the orbittestbed,” in DySPAN, 2008.
[6] A. Sikora and V. F. Groza, “Coexistence of IEEE 802.15.4 with othersystems in the 2.4 GHz ISM band,” in IMTC, 2005.
[7] ZigBee Alliance, “Zigbee and wireless radio frequency coexistence,”2007.
[8] I. Howitt and J. A. Gutierrez, “IEEE 802.15.4 low rate - wirelesspersonal area network coexistence issues,” in WCNC, 2003.
[9] S. Y. Shin, H. S. Park, S. Choi, and W. H. Kwon, “Packet error rateanalysis of ZigBee under WLAN and Bluetooth interferences,” in IEEEtrans. on wireless communications, 2007.
[10] S. Y. Shin, H. S. Parky, S. Choi, and W. H. Kwon, “Packet error rateanalysis of IEEE 802.15.4 under IEEE 802.11b interference,” in WWIC,2005.
[11] D. G. Yoon, S. Y. Shin, W. H. Kwon, and H. S. Park, “Packet error rateanalysis of IEEE 802.11b under IEEE 802.15.4 interference,” in VTCSpring, 2006.
[12] S. Pollin, M. Ergen, M. Timmers, A. Dejonghe, L. van der Perre,F. Catthoor, I. Moerman, and A. Bahai, “Distributed cognitive coex-istence of 802.15.4 with 802.11,” in Cognitive Radio Oriented WirelessNetworks and Communications, 2006.
[13] R. Gummadi, D. Wetherall, B. Greenstein, and S. Seshan, “Understand-ing and mitigating the impact of RF interference on 802.11 networks,”in Sigcomm, 2007.
[14] K. Srinivasan, P. Dutta, A. Tavakoli, and P. Levis, “An empirical study oflow power wireless,” in ACM Transactions on Sensor Networks, 2010.
[15] C.-J. M. Liang, B. Priyantha, J. Liu, and A. Terzis, “Surviving Wi-Fiinterference in low power zigbee networks,” in SenSys, 2010.
[16] P. Bahl, R. Chandra, T. Moscibroda, R. Murty, and M. Welsh, “Whitespace networking with Wi-Fi like connectivity,” in Sigcomm, 2009.
[17] D. Chen, S. Yin, Q. Zhang, M. Liu, and S. Li, “Mining spectrum usagedata: a large-scale spectrum measurement study,” in Mobicom, 2009.
[18] K. Papagiannaki, M. Yarvis, and W. S. Conner, “Experimental char-acterization of home wireless networks and design implications,” inINFOCOM, 2006.
[19] J. Ortiz and D. Culler, “Multichannel reliability assessment in real worldWSNs,” in IPSN, 2010.
[20] J.-H. Hauer, V. Handziski, and A. Wolisz, “Experimental study of theimpact of WLAN interference on IEEE 802.15.4 body area networks,”in EWSN, 2009.
[21] R. C. Shah, L. Nachman, and C.-y. Wan, “On the performance ofbluetooth and ieee 802.15.4 radios in a body area network,” in BodyNets,2008.
[22] Wi-Spy, http://www.metageek.net/.[23] M. Sha, G. Hackmann, and C. Lu, “Multi-channel reliability and
spectrum usage in real homes: Empirical studies for home-area sensornetworks,” Washington University in St. Louis, Tech. Rep. WUCSE-2010-32, 2010. [Online]. Available: http://cse.wustl.edu/Research/Pages/technical-reports.aspx
[24] [Online]. Available: http://www.metageek.net/recordings[25] J. Polastre, R. Szewczyk, and D. Culler, “Telos: Enabling ultra-low
power wireless research,” in IPSN, 2005.[26] 2.4 GHz IEEE 802.15.4 / ZigBee-ready RF Transceiver, Texas Instru-
ments.[27] http://www.tinyos.net/.[28] J. Zhao and R. Govindan, “Understanding packet delivery performance
in dense wireless sensor networks,” in Sensys, 2003.[29] Specification of the Bluetooth System, Version 4.0.[30] Technical Overview of Time Synchronized Mesh Protocol, White Paper,
http://www.dustnetworks.com.[31] “IEEE 802.15.4e WPAN task group.” [Online]. Available: http:
//www.ieee802.org/15/pub/TG4e.html[32] S. M. Stigler, “Francis Galton’s account of the invention of correlation,”
Statistical Science, vol. 4, no. 2, 1989.