mule deer associations with the all american … · velocity is too fast or too slow. when the...
TRANSCRIPT

Galemys 22 (nº especial): 123-147, 2010ISSN: 1137-8700
123
MULE DEER ASSOCIATIONS WITH THE ALL AMERICAN CANAL, EASTERN CALIFORNIA, USA
PAUL R. KRAUSMAN & MELANIE BUCCI
1. University of Montana, 32 Campus Drive; Missoula, MT 59812, USA.2. Ecology and Evolutionary Biology, University of Arizona, AZ 85721, USA.
ABSTRACT
Concrete-lined canals can interfere with native ungulate populations because they have the potential to disrupt dispersal, seasonal or daily movements, or they are an attractive nuisance. The All American Canal (AAC) is immediately north of the US-Mexico border and transports water from the Colorado River to western California. Because it traverses the Algondone Sand Dunes in eastern California, a significant amount of water is lost each year due to evaporation and seepage. To minimize this water loss the AAC was lined for 36.8 km beginning at Pilot Knob, Imperial County, California. The concrete lining changed the dynamics of the canal from a more natural riparian area to a steep sided, faster flowing waterway. We monitored the landscape adjacent to the AAC that was lined with concrete to determine the extent of deer usage of the area prior to the lining (November 2004-December 2006), during the lining (2007-2008), and after the lining was complete (2009-present). We monitored deer with track and road plots, weekly ground, and monthly aerial surveys. Deer use of the canal was limited and concentrated along a 1 km section (i.e., deer use area) of the canal. Only 1 deer was reported in the area during the pre-lining phase but activity increased during the warm months during the lining phase. At least one deer drowned and 2-3 crossed the canal during the lining phase. Tracks continued to be reported along the deer use area after the lining was completed, and were highest in hot months. Although, deer use of the area is limited and the habitat is marginal for deer, mitigation to eliminate any mortality includes the addition of water catchments and fencing. Deer in this part of the desert are rare and management agencies want to minimize any unnecessary reduction in the population.
Key Words: California, desert mule deer, habitat use, water.
RESUMEN
Asociaciones del ciervo mulo con el Canal Americano, en el extremo este de California (USA)
La canalización de los cursos de agua pueden interferir con las poblaciones de ungulados al ser elementos que pueden interrumpir los movimientos de dispersión diarios y estacionales y no son atractivos. El Canal Americano (ACC) se localiza al norte de la frontera entre USA y México y transporta agua desde el rio Colorado hasta el oeste de California. Este canal atraviesa la zona de

124
Galemys 22 (nº especial), 2010
Dunas Algodonales, al este de California, por donde se pierde cada año una cantidad significativa de agua debido a la evaporación y filtración. Para minimizar esta pérdida de agua, el ACC fue canalizado mediante revestido de hormigón en 36,8 km en el Condado Imperial, California. Esta canalización ha cambiado la fisionomía del canal, de una zona natural ribereña ha pasado a ser un cauce lineal y uniforme , donde el agua fluye más rápido. Hemos monitorizado el paisaje adyacente al canal para determinar el uso por parte de los ciervos, antes del revestimento (noviembre 2004-diciembre 2006), durante el revestimento (2007-2008) y cuando la obra finalizó, de 2009 hasta la actualidad. Hemos monitorizado a los ciervos mediante itinerarios semanales por carretera y reconocimientos aéreos mensuales. El uso del canal por los ciervos es limitado y se centra en 1 Km (a esta zona la hemos llamado área de uso por el ciervo). Sólo se observo un animal durante la fase previa a las obras en el canal, pero la actividad se incremento en los meses de calor durante la ejecución de las mismas. Por lo menos un ciervo se ahogo y 2-3 cruzaron el canal durante la fase de canalización. Las pistas dejadas por los ciervos siguieron apareciendo después de finalizar los trabajos, siendo estás más numerosas en los meses de calor. Si bien el uso de este área por los ciervos es limitado y el hábitat es marginal, para reducir la mortalidad es necesario crear puntos de agua accesibles y cercar el canal. El ciervo en esta parte del desierto es raro por lo que los organismos de gestión deben reducir al mínimo cualquier interferencia en la población.
Palabras clave: Agua, California, ciervo mulo, hábitat.
INTRODUCTION
Growth and development in the western United States depends on the
availability of water. Over 12,000 km of canals carry water from rivers and
reservoirs to industrial, residential, and agricultural users. Unfortunately, animals
can drown in concrete-lined canals while attempting to cross or drink from them.
There are ≥21 canals in 9 western states and 1 Canadian province where ≥10 deer
drown in them in 1 year (Rautenstrauch & Krausman 1986; Table 1). In 1977
and 1978, an average of 259 deer (Odocoileus spp.) and 5 elk (Cervus elaphus) drowned in 22 U.S. Bureau of Reclamation (USBR) canals; 51% were in the
Pacific Northwest (Rautenstrauch & Krausman 1986). Over 95% of ungulates
that drown in USBR canals are deer (Latham & Verzuh 1971, Rautenstrauch
& Krausman 1986); most are mule deer (Odocoileus hemionus). White-tailed
deer (O. virginianus) were found in the Ainsworth Canal, Nebraska (Shult
1968). Other native ungulates that drowned in canals include elk, pronghorn
(Antilocapra americana) including endangered Sonoran Pronghorn (A. americana

Deer and canals
125
Can
alSt
ate
Min
imum
no
. dr
owne
dT
ime
peri
odC
omm
ents
Sour
ce
Cen
tral
Ari
zona
Pr
ojec
tA
rizo
na21
1979
-198
3D
urin
g co
nstr
ucti
onK
raus
man
(19
85)
3319
85A
fter
con
stru
ctio
nU
SBR
unp
ublis
hed
data
Wel
ton-
Moh
awk
Ari
zona
>40
9/19
68-1
/196
9 Fu
rlow
(19
69)
170
1977
-80
USB
R u
npub
lishe
d da
ta
Coa
chel
laC
alifo
rnia
2919
80D
urin
g co
nstr
ucti
onR
orab
augh
and
Gar
cia
(198
3)
1819
81-8
2A
fter
con
stru
ctio
nR
orab
augh
and
Gar
cia
(198
3)
Del
ta-M
endo
taC
alifo
rnia
1319
54-5
5G
ubse
r (1
960)
1019
58-5
9G
ubse
r (1
960)
Fria
nt-K
ern
Cal
iforn
ia12
1950
’sA
nnua
l XG
ubse
r (1
960)
Ham
ilton
B
ranc
hC
alifo
rnia
1319
67-8
1A
nnua
l XFr
y et
al.
(198
4)
Rob
les-
Cas
itas
Cal
iforn
ia>1
0019
57To
tal i
nclu
des
all b
ig
gam
e sp
ecie
sG
ubse
r (1
960)
Teha
ma-
Col
usa
Cal
iforn
ia36
019
74-8
1M
ichn
y an
d M
cKev
itt (
1982
)
Tig
er C
reek
Cal
iforn
ia15
-30
Ear
ly 7
0’s
Ann
ual X
Fry
et a
l. (1
984)
340
1960
-76
Seam
an (
1977
)
Will
ows
Proj
ect
Cal
iforn
ia29
1977
USB
R u
npub
lishe
d da
taC
harl
es H
anse
n Fe
eder
Col
orad
o49
119
57-6
8La
than
and
Ver
zuh
(197
1)
Tabl
e 1.
Rep
orts
of d
eer
dyin
g in
can
als
in th
e w
este
rn U
nite
d St
ates
, 194
0-19
85.

126
Galemys 22 (nº especial), 2010
Can
alSt
ate
Min
imum
no
. dr
owne
dT
ime
peri
odC
omm
ents
Sour
ce
Hor
seto
oth
Col
orad
o13
812
/194
9-2/
1955
Min
er in
Shu
lt (1
968:
5)
Hea
rt M
ount
ain
Wyo
min
g15
1977
-78
USB
R u
npub
lishe
d da
ta
Ain
swor
thN
ebra
ska
253
1965
-69
Men
zel i
n Se
aman
(19
77)
9519
73-7
5M
enze
l in
Seam
an (
1977
)
2219
78U
SBR
unp
ublis
hed
data
Nav
ajo
Irri
gati
on
Proj
ect
New
M
exic
o
3819
69-7
5D
urin
g co
nstr
ucti
onB
ould
ers
and
Bai
ley
(198
0)
2619
77-7
9A
fter
con
stru
ctio
nB
ould
ers
and
Bai
ley
(198
0)
How
ard
Prai
rie
Ore
gon
557/
21/5
9-8/
3/31
/59
Gub
ser
(196
0)
190
1961
-196
8La
than
and
Ver
zuh
(197
1)
2919
77-7
8U
SBR
unp
ublis
hed
data
Toke
tee
Proj
ect
Ore
gon
5719
52-5
9G
ubse
r (1
960)
Span
ish
Fork
Uta
h10
1978
USB
R u
npub
lishe
d da
ta
Col
umbi
a B
asin
Pr
ojec
tW
ashi
ngto
n17
119
77-7
8G
ubse
r (1
960)
42U
SBR
unp
ublis
hed
data
Yaki
ma
Proj
ect
Was
hing
ton
184
1977
-78
USB
R u
npub
lishe
d da
ta
Sout
hern
O
kana
gan
Bri
tish
C
olum
bia
8-12
1940
’sB
lair
in S
eam
an (
1977
)
4-6
1970
sB
lair
in S
eam
an (
1977
)
Tabl
e 1.
Rep
orts
of d
eer
dyin
g in
can
als
in th
e w
este
rn U
nite
d St
ates
, 194
0-19
85. (
cont
.).

Deer and canals
127
sonoriensis; Arizona Game and Fish Department, 1981), and bighorn sheep (Ovis canadensis). Ungulates also drown in concrete-lined canals in Europe (Peris and
Morales 2004).
Causes of Ungulate-Canal Interactions Concrete-lined canals interfere with ungulate populations because they
disrupt seasonal, dispersal or daily movements, or they are an attractive nuisance
(Busch et al. 1984).
Movement barriers. The Pacific Gas and Electric Company’s Hamilton
Branch Canal transects a migration route of California’s Tehama black-tailed deer
(O.h. columbianus) herd. Deer become entrapped in the canal while attempting
to cross between their summer and winter ranges (Fry et al. 1984).
Eighty-three percent of the deer found in the Ainsworth Canal in 1966
and 1967 were yearlings (Menzel 1969). Sixty-seven percent of the deer-canal
interactions (DCI= any observation of ≥1 deer or deer track in or along a canal
right-of-way [ROW]) they observed occurred from June through August,
during the fawning period. Shult (1968) and Menzel (1969) concluded that
this canal may disrupt the dispersion of yearling deer that have recently left
family groups.
The Charles Hansen Feeder Canal, Colorado, may prevent deer from moving
between bedding sites on one side of this canal and agricultural forage on the
other (Haegele & Blevins 1980). The Central Arizona Projects’ Hayden Rhodes
Aqueduct may also prevent movements to foraging sites. Eight of 22 mule deer
captured and radiocollared near the Hayden Rhodes aqueduct crossed this canal
while it was under construction. Some of these deer crossed to feed in agriculture
fields south of the canal (Krausman & Hervert 1984).
Attractive nuisance. Deer may be attracted to forage and cover in canal
ROW’s and adjacent agricultural fields or to water in a canal. During a winter
aerial survey in North Dakota, Gatz et al. (1984) found 6.3 white-tailed deer/10
km in the McClusky Canal ROW, and only 0.4 deer/10 km in an adjacent
control area. They believed that the deer were attracted to the cover and forage
along the canal ROW.

128
Galemys 22 (nº especial), 2010
Michny & McKevitt (1982) stated that mule deer were attracted to small
game food and cover plots and other vegetation next to the Tehama-Colusa
Canal. In the arid regions of the southwest U.S., mule deer are attracted to canals
to drink. To get to parts of the Coachella Canal where they were drowning,
deer had to cross <1-5 km of bare sand dunes. Deer have also drowned while
attempting to drink from the Mohawk Canal (Guenther et al. 1979) and the
Central Arizona Project (Krausman & Hervert 1984).
Deer drown more often in most canals during summer. All deer drownings
in the Coachella Canal occurred in summer. Thirty-nine of 42 deer trapped
in the Central Arizona Project during construction were found during summer
(Krausman 1985). Deer tracks were found along the Navajo Indian Irrigation
Project during all months, but track counts increased during late summer
(Boulders & Bailey 1980). Deer drowned in the Tehama-Colusa Canal in all
months, but drownings were highest from May through November (Michny &
McKevitt 1982). However, Furlow (1969) reported that although deer drowned
in the Mohawk Canal, Arizona during all months, “November and December
were the worst months”.
Canal Design and Operation Features Influencing Drownings Busch et al. (1984) reviewed the canal design features and operation
procedures that prevent trapped deer from escaping from canals. Most canals
with deer drownings had concrete-lined side slopes of 2:1 or greater. Mud and
algae on these canal walls often make it difficult for deer to escape, even when
the water level is high (Seaman 1977).
Deer have trouble escaping from concrete-lined canals when the water
velocity is too fast or too slow. When the velocity is too fast, deer may become
exhausted from fighting the current before they have a chance to escape. Seventy-
four percent of the deer trapped in the Ainsworth Canal drowned when the
flow rate was >1.5 m3/sec; 19.4% drowned when the flow rate was <1.5 m3/
sec (Menzel 1969). High water velocity made it difficult for deer to use escape
structures at the Tiger Creek Canal (Fry et al. 1984). When water velocities are
too low, deer may exhaust themselves attempting to escape at the point they

Deer and canals
129
entered and may never be forced toward an escape structure (Guenther at al. 1979, Busch et al. 1984).
Water depth also influences deer survival in canals. When a canal is filled
to the top of the lining, deer can drink without falling in, and those that enter
to cross can easily escape. When the depth of water at the Mohawk Canal is
>31 cm, deer cannot escape without assistance (Guenther et al. 1979). However,
when the water level is below a certain point, deer may hesitate to drink or enter
the canal to cross. Fourteen of 15 deer found in the Navajo Indian Irrigation
Project entered the canal where the water was checked to within 0.9 m of the top
of the canal lining (Boulders & Bailey 1980).
Empty canals are also a hazard to ungulates. Thirty-eight deer and 2 pronghorn
died in, and 150 deer were rescued from, the empty Navajo Indian Irrigation
Project during construction. They may have been attracted to water in the siphons
(Boulders & Bailey 1980). About 10% of the 171 deer mortalities in the Columbia
Basin Project between 1952 and 1959 occurred in dry canals (Latham & Verzuh
1971). Twenty-one deer died in, or shortly after, being removed from the empty
Central Arizona Project during 4 years of construction. These deer either drowned
in pools of standing rain water or of exposure to extreme heat; temperatures
exceeded 54oC in the canal bottom during summer (Krausman 1985).
Preventing Ungulate Drownings in Concrete-lined Canals There are two ways to prevent deer from drowning in canals: prevent them
from entering the canal or provide a way for them to escape from the canal
after entering. Some authors have concluded that preventing deer from entering
canals is the most effective way to prevent drowning (Gubser 1960, Shult &
Menzel 1982, Krausman 1985), but this is not always possible.
Preventing deer from entering canals. Busch et al. (1984) identified three ways
to prevent deer from entering canals: fencing, building crossing structures, and
providing alternate water sources.
Michny & McKevitt (1982), Busch et al. (1984), and Marcy (1986) reviewed
the use of fences to prevent drowning. Deer-proof fences should be at least 2.4 m
tall and should have no gaps or holes.
130
Galemys 22 (nº especial), 2010
Deer drowning in the Tiger Creek Canal decreased from 15-30/year prior to
fencing to 8 the first year after fencing (Fry et al. 1984). A 2 m fence along the
Tehama-Colusa Canal was not effective because there were too many gaps, low
gates, and short cattle guards (Michny & McKevitt (1982).
There are many problems associated with fencing canals. The average
construction cost for upright deer-proof fence was $8,200 (US)/km in 1984
(Marcy 1986). The cost of fencing the Central Arizona Project was $47,800/
km in 1984 (Busch et al. 1984). The New Mexico Department of Game and
Fish estimated that the annual maintenance cost of a proposed fence along the
Navajo Indian Irrigation Project was $155/km in 1976 (Seaman 1977). Costs
are certainly higher in 2009. If there are any gaps in a fence, deer finding them
will be trapped between the fence and the canal. More than 57 deer entered
the Central Arizona Project through open gates or incomplete sections of fence
during the summers of 1984-85, and the same problem occurred in 1986 (USBR,
unpublished data). Deer have also jumped the 2.4 m fence along the Central
Arizona Project (USBR, unpublished data). Building fences may prevent deer
from crossing canals and disrupt migratory movements.
Deer crossings have been constructed at many canals to prevent movements
from being disrupted. There were 235 wooden bridges (1/300 m) built on the
Talent Division Project (Gubser 1960). A number of bridges built over the
Charles Hansen Canal were used extensively by deer, but there was no decrease
in drowning after their construction (Haegele & Blevins 1980). Deer crossed 2
1.8 m wide concrete bridges over the Navajo Indian Irrigation Project 13 times
in 1978-79 (Boulders & Bailey 1980). Deer crossings have also been used in
the Colorado Big Thompson, Rouge River (Latham & Verzuh 1971), Central
Arizona Project (Krausman 1985), and other canals (Gubser 1960, Seaman
1977). Crossings should be at least 2.5 m wide and covered with dirt (Latham &
Verzuh 1971).
Deer will also use other structures to cross canals. Krausman (1985) created
track plots in 3 siphons, 11 road bridges, 10 dirt plugs, 15 overchutes, 2 livestock
crossings, and 2 deer bridges crossing the Central Arizona Project. During the
summer of 1982, 235 sets of tracks were recorded: 53% at siphons, 19% at road

Deer and canals
131
bridges, 19% at dirt plugs, 7% at overchutes, and 2% at the deer bridge. Deer
may have used some of these structures more than the deer bridge because they
were built along major drainages that deer travel and the deer bridge may not have
been located near a travel corridor. Michny & McKevitt (1982) recommended
that specially designed deer crossings were not needed on the Tehama-Colusa
Canal because there were enough roads bridges and other crossings.
Alternate water sources have been built at the Coachella and Mohawk
Canals. Nineteen windmills and drinkers built near the Coachella Canal were
used by deer, and may have contributed to the decrease in deer losses at that
canal (Rorabaugh & Garcia 1983). Water troughs temporarily installed along
the Mohawk Canal prior to 1960 may have prevented some drowning (Gubser
1960), but a later effort to divert water into a ditch next to the Mohawk Canal
did not decrease drowning (Furlow 1969).
Deer escape structures. Where methods used to prevent deer from entering
a canal have failed to work or were impractical to use, structures have been
developed to help deer escape from canals. Many devices have been attached
to canal walls to help deer gain a footing on the steep, slippery sides. Metal
grates and ladders, snow fences, wooden slats, asphalt pads, and grooves and
steps cut into the canal walls have all been tested, but none have reduced deer
losses (Gubser 1960, Shult & Menzel 1969, Seaman 1977, Boulders & Bailey
1980). These escape structures are either too steep and slippery (Seaman 1977),
or deer do not recognize that they are a way to escape.
Guenther et al. (1979) described steps cut into the concrete wall of the Mohawk
Canal that were ineffective because deer could not locate them or recognize them
as escape structures. To solve this problem, directors such as cables, pipes, and
wooden booms have been used in many canals to direct swimming deer toward
escape structures and prevent them from swimming further downstream.
Semi-tame deer were put in the Ainsworth Canal to test 2 types of escape
structures (Shult 1968). One structure had A-frame pipe directors that extended
from the top of the canal to the bottom, and 5x10 cm boards attached to the
canal wall for steps. Five of the 6 times deer made it to the structure they were
able to escape; the other time a deer slipped through the pipes and had to be

132
Galemys 22 (nº especial), 2010
rescued. A seventh deer, placed in 0.3 m of water, walked away from the escape
structure and drowned in a drop structure pool. The second escape structure
had a diagonal pipe director that could be raised or lowered when the water level
changed and angle iron steps attached to the canal wall. Deer were swept under
this director in 4 of 5 tests. Although Shult (1968) concluded that deer could
use the first type of escape structure, both types were removed because they
interfered with the water flow.
Richmond ramps, named after the person who designed them, have been
used successfully on the Okanagan Canal of the southern Okanagan Lands
Irrigation District since 1960 (Seaman 1977). These ramps have a slope of 4:1;
are set perpendicular or diagonal to the canal wall; and have a floating, triangular,
wooden director attached to the canal wall. Modified ramps that extend to the
canal bottom so that small trucks can enter the canal for maintenance have been
constructed on the canal.
Similar ramps have been built on the Pacific Gas and Electric Company’s
Tiger Creek and Hamilton Branch Canals (Seaman 1977, Fry et al. 1984). These
ramps have “flasher” type directors (15 cm wide aluminum strips attached to a
cable suspended over the water at one end and to a cable suspended at water level
at the other end). The water flow shakes the strips, which drives deer toward the
ramps (Seaman 1977). Tests with captured deer showed that these are effective
escape structures (Fry et al. 1984).
Three types of directors were tested on the Mohawk Canal (Guenther et al. 1979). Flashers similar to those used on the Tiger Creek Canal accumulated too
much debris behind them. Wooden booms became water logged and sunk. Three
cm diameter cables with swimming pool floats worked well because they did not
interfere with water flow and were easy to install and maintain (USBR, unpublished
data). However, because it appeared that deer could easily swim over or under
them, it was not known if these cable directors would prevent drowning.
Escape structures should be placed just upstream from all check dams,
siphons, and other obstructions. If deer are entering a canal to cross, escape
structures should be placed on both sides of the canal. The Hamilton Branch
Canal has ramps on both sides and the angle of the directors is changed seasonally

Deer and canals
133
so deer can only exit in the direction they are migrating (Fry et al. 1984).
Most of the escape structures and directors designed for full canals will not
work in dry canals. Richmond ramps modified to extend to the canal bottom
may work, but only if deer recognize them as a way to escape. Deer used dirt
plugs to escape from the Coachella and Central Arizona Project Canals during
construction (USBR; unpublished data; Krausman & Hervert 1984). However,
these plugs collect rainwater behind them, which may attract deer into the canal.
Deer and the All American Canal The All American Canal (AAC) is an important water delivery system
that converted Imperial and Coachella Valley, California into one of the most
productive agricultural regions in the state (Schaefer & O’Neill 2001). The
canal also delivers water for residential and commercial development and power
generation. Construction of the 130 km AAC began in 1934 and began delivering
water in 1940. The AAC irrigates nearly 202,500 ha of farmland (Schaefer &
O’Neill 2001).
The AAC was built by the USBR when the Boulder Canyon Project of 1928
was signed into law. It is still owned by the USBR but the Imperial Irrigation
District (IID) is responsible for its maintenance and operation. The Boulder
Canyon Project Act authorized the construction of Boulder Dam (now Hoover
Dam), Imperial Dam (480 km downstream of the Colorado River), the AAC,
and the Coachella Branch of the AAC. A detailed account of the history of the
AAC is provided by Schaefer & O’Neill (2001).
To conserve water in the AAC (approximately 67,700 acre-feet/yr) the
USBR and IID are replacing a 36.8 km section of the canal (i.e., 1.6 km west of
Pilot Knob to Drop 3) with a concrete-lined parallel canal. Lining this portion
of the AAC may have adverse impacts on air quality, wetlands habitat, terrestrial
habitat and special status species, large mammal escape, canal fishery, cultural
resources, recreation, geodetic survey monuments, sand and gravel supplies,
transportation, public safety, and immigration from Mexico (Imperial Irrigation
District 2004). The remainder of this report will examine the adverse impacts on
large mammal (e.g., mule deer) escape.

134
Galemys 22 (nº especial), 2010
The proposed parallel canal will have steeper sided slopes (i.e., 1-1/2:1) and
water will move at higher velocities than the present unlined canal. Both conditions
could cause high risk of drowning to large mammals that attempt to drink from or
cross the canal (Imperial Irrigation District 2004). Our objective is to determine
the presence of large mammals in the area where the canal will be lined, determine
any interactions they have with the canal, and propose measures that minimize or
eliminate adverse impacts of the canal on large mammals. The study will examine
deer-canal interactions prior to lining, during the lining phase, and post-lining.
This study covers the pre-lining phase and part of the lining phase only.
STUDY AREA
The AAC lining project is in Imperial County, California, immediately north
of the international boarder. The AAC will be lined for 36.8 km from 1.6 km west
of Pilot Knob to Drop 3. The AAC originates at Imperial Dam on the Colorado
River and flows into Imperial Valley (Bransfield and Rorabaugh 1993).
The canal is in the Sonoran Desert of southeastern California. The climate
is arid with daytime summer temperatures >45oC and low annual rainfall (= 70
mm) in Imperial County, California (Imperial Irrigation District, unpublished
data). Plant species in the project area are common to the Lower Colorado
River Valley Subdivision of Sonoran Desert scrub. Desert scrub can be divided
into sand dune associations and creosote (Larrea tridentate) scrub. Several plant
species in the sand dune association have limited distribution but are adapted
to the dunes including Peirson’s milk vetch (Astragalus magdalanae peirsonii), sand food (Pholisma sonorae), and desert sunflower (heliantus niveus tephrodes), which are also sensitive species. Dominant plants include creosote and bursage
(Ambrosia dumosa) in the creosote scrub association. Areas adjacent to the AAC
contain cattails (Typha domingensis), Goodding willows (Salix gooddingii), salt
cedar (Tamarix shinensis), honey mesquite (Prosopis glandulosa), screwbean
mesquite (Prosopis pubescens), and arrowweed (Pluchea sericea).
There are over 50 mammal species in the project area but mule deer
(Odocoileus hemionus eremicus) are the only native large mammal. Mountain
lions (Felis concolor) are rare in this desert (Bransfield & Rorabaugh 1993).

Deer and canals
135
The seasons for this report will follow Marshal et al. (2002): hot-dry (April-
June, hot-moist (July-September), and cool (October-March). We will examine
weather throughout the study, which may alter season designation for the final
report following post construction monitoring.
MULE DEER
The density of mule deer in the study area is unknown. Mule deer occupy
washes (Krausman et al. 1985b) in desert habitats and bajadas east of the
Algondones Dunes and occupy mountain ranges and riparian zones along the
Colorado River. Harvey & Stanley Associates (undated; cited in Bransfield
& Rorabaugh 1993) estimated there were 900 to 2,000 mule deer from the
Algondones Dunes to the Colorado River. These are likely high estimates. Reports
of deer drowning near Pilot Knob along the AAC are rare but deer have been
reported in the area specifically on Quechan Indian Reservation land at Pilot
Knob (Imperial Irrigation District 2004). Mule deer inhabiting deserts have large
home ranges (>90 km2) (Krausman & Etchberger 1993, 1995). Some biologists
assume that deer along the study portion of the AAC “… roamed south from the
Chocolate Mountain and Picacho Peak ranges along the Colorado River to the
Knob area of the AAC” (Imperial Irrigation District 2004). However, in a recent
study of mule deer in the Sonoran Desert of southeastern California (33o00’N,
114o 45’W) >34 deer were captured and radio collared in the East Chocolate and
Cargo Muchacho mountains north of the AAC. The mean home-range size for
34 deer was 153.4 km2 (range= 43.2-615.1 km2) and only 6 females approached
(within 5 km) the AAC. These 6 females had a mean home-range size of 285.8
km2 (range= 117.3-615.1 km2). The southern portion of their home range was
within 5 km of the AAC in all seasons but they were closer to the canal during hot-
dry and hot-moist seasons. None of these deer were reported south of Interstate
8 and not closer than 5 km to portions of the AAC; they were north and east of
Pilot Knob and not in the project area. Although mule deer in deserts have large
home ranges, the deer in the Cargo Muchacho and Chocolate mountains did not
appear to use the project area (Marshal 2005). However, these movement data
were collected with Very High Frequency technology and it is likely they could

136
Galemys 22 (nº especial), 2010
have approached the canal closer than the reported 5 km without detection.
Deer in the project area likely come from the mountains north of the AAC.
Currently, deer use of the study area has been to obtain water from the AAC.
METHODS
The study was conducted in 2 phases depending on the construction
schedules: pre-lining and lining. The pre-lining phase included November 2004
through 2006. The concrete lining phase began in 2007 and is on-going. During
the pre-lining phase, we surveyed the project area for deer using a combination
of track plots (Popowski & Krausman 2002), road surveys for sign (i.e., tracks
pellets, observations of deer), and aerial surveys from a Cessna 172 (Krausman &
Etchberger 1993). We also contacted people who used the area on a regular basis
(i.e., Border Patrol, California Fish and Game employees, and interested citizens
knowledgeable about the area wildlife (e.g., L. Leisca). We examined IID files
and others that may indicate the number of deer that entered the project area
along the AAC.
Road and track plot surveys were conducted at least weekly (Figure 1) and
aerial surveys east of Pilot Knob to Drop 3 were conducted monthly with a pilot
and 2 observers. Surveillance of the landscape was made from Pilot Knob, and
Figure 1. Deer track plots (dots), deer use area, and the All American Canal (canal),Eastern California, USA, 2004-2008.

Deer and canals
137
by driving along >56 km of authorized roads that had sandy substrate suitable
for reading tracks. The availability of the substrate varied because the Border
Patrol dragged the roads to detect illegal aliens. The dragged roads were useful
to detect animal tracks also. Most observations and plots were established south
of the AAC. However, there was a patch of vegetation north of the AAC (north
of I-8 at the junction of the canal and I-8 west of Pilot Knob) that was surveyed
from the air and on ground. This area is primarily sand dunes with scattered
shrubs and trees and tracks are easily detectable. We used systematic observation,
examination of roads and track plots, and aerial surveys to indicate the extent of
use of the project area by mule deer.
We estimated site occupancy using track plots and site occupancy models
(i.e., PRESENCE; MacKenzie et al. 2003). Occupancy models have been
successfully used with an array of taxa from butterflies in Finland to tigers
(Panthera tigris) in India (MacKenzie & Royle 2005). Occupancy models are
applicable to studies of species occurrence and distribution, habitat selection and
modeling and, metapopulation studies (MacKenzie & Royle 2005). We used the
model to detect occurrence and distribution during the concrete lining phase
when deer were detected.
In 2008, we established 11 additional plots adjacent to the AAC on the north
side of I-8. The only area that was regularly accessible was a 1.6 km strip from the I-
8 bridge to the west. This area could not be regularly surveyed due to construction
activity and sand dunes. However, construction activities created a road that was
functional in 2008. We classified the 11 plots as those central to the strip, east
(toward Olgilby), and west (toward the dunes) for occupancy modeling.
RESULTS
Preliminary Phase (2004-2006) During the pre-lining phase (November 2004-December 2006), only 1 deer
was observed in the study area. A deer was photographed by IID personnel on
the AAC roadway at the beginning of Reach 1B in July 2006. Although it is
likely deer used the study area to acquire water since canal construction, this was

138
Galemys 22 (nº especial), 2010
the first documentation of deer use of the canal during this study. No other deer
were observed from the air or ground, no tracks were recorded, and no other
sign of deer were recorded by me or reported by the U.S. Border Patrol or others
working in the study area.
Lining Phase (2007-2008 ) We began to consistently document deer north of the AAC and I-8 in a
patch of vegetation approximately 1 km x 0.5 km (i.e., deer use area; Figure1)
during the hot-dry season 2007. From May 2007 through 2008, we observed
deer, deer tracks and signs in the study area except from December 2007 until
May 2008. (Tables 2, 3).
The detection probabilities (Ψ; i.e., the probability that a site is occupied)
calculated in 2008 for the deer use area are useful to determine the probability
of deer using various sections (Table 4). After a number of surveys (e.g., weekly),
when deer have not been detected the species is considered absent from the
sampling unit and Ψ= 0. These probabilities are similar to the track plot data
from 2007 that reveal that deer approach the canal during hot periods (Table 4).
August 2008 had the highest probability of deer for all months examined and
the central portion of the deer use area had the highest probability of detecting
deer in July and August (Table 4). In addition, the west and east sections had the
highest probabilities at any time for their respective sections; the east section had
the highest probability of detecting deer for the entire year (Table 4).
Observations of deer were rare but were seen 3 and 18 July 2007, 7 September
2007, and 4 deer were observed during aerial flights on 28 September 2007
(Table 2). Deer did not use the area from January-April 2008 but returned in
May and were recorded through December 2008.
No deer were detected south I-8 from plots. However, there were 2-3 deer
that crossed the canal and I-8 to the south and died in the canal or on I-8 (verbal
reports; i.e., 1 died in the canal south of I-8 in September 2008, and mortalities
occurred on I-8 in July 2007, June 2008, and November 2008). These deer came
from the north and to my knowledge are the only deer that have been reported
south of the AAC during this study. It is highly unlikely deer could enter the

Deer and canals
139
study area from the south due to the fence being constructed by Homeland
Security along the border.
TABLE 2Deer tracks recorded in 1X1 m sand plots adjacent to the All American Canal from
Pilot Knob to Drop 3, Imperial County, California, 2004-2008.
Pre-lining phase Lining phase
Month 2004 2005 2006 2007 2008
January 0 0 0 0
February 0 0 0 0
March 0 0 0 0
April 0 0 0 0
May 0 0 0 2f
June 0 0 0a 9f
July 0 0 0b,c 15f
August 0 0 0b 23f
September 0 0 0b,d,e 13f
October 0 0 0f 7f
November 0 0 0 0f 8f
December 0 0 0 0f 1f
a Located deer tracks 26 June and pellets north of I-8 where the canal goes under the freeway the first time west of Pilot Knob.
b Located deer tracks and pellets in a patch of vegetation 2 km x 0.5 km (i.e., deer use area) north of I-8 at the junction of the canal and I-8 west of Pilot Knob.
Observed ≤3 deer >500 m north of the canal at the west end of the deer use area at the edge of the dunes, 3 July.
c Observed 1 adult male deer foraging 100 m northeast of the canal at sunrise, 18 July. California Fish and Game Department reported 1 female deer hit and killed by a vehicle in
eastbound lane of I-8 near Olgilby Road, 22 July.d Observed 1 female with fawn 250 m north of the canal at the junction of the canal and I-8
west of Pilot Knob, 7 September.e Observed 3 females and 1 male mule deer during aerial survey, northeast of the canal and
west of Olgilby Road, 28 September.f Located deer tracks in the deer use area.
140
Galemys 22 (nº especial), 2010
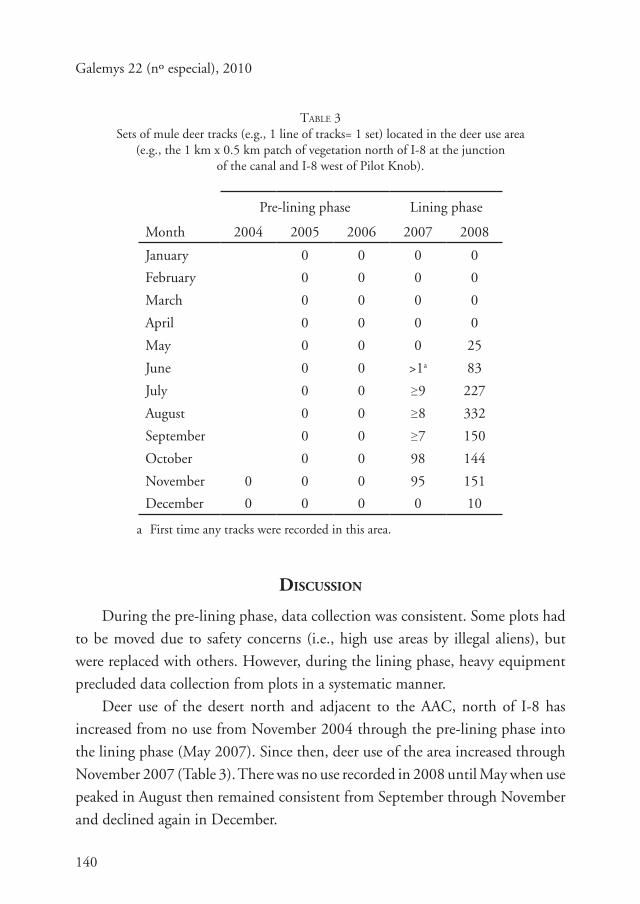
TABLE 3Sets of mule deer tracks (e.g., 1 line of tracks= 1 set) located in the deer use area
(e.g., the 1 km x 0.5 km patch of vegetation north of I-8 at the junctionof the canal and I-8 west of Pilot Knob).
Pre-lining phase Lining phase
Month 2004 2005 2006 2007 2008
January 0 0 0 0
February 0 0 0 0
March 0 0 0 0
April 0 0 0 0
May 0 0 0 25
June 0 0 >1a 83
July 0 0 ≥9 227
August 0 0 ≥8 332
September 0 0 ≥7 150
October 0 0 98 144
November 0 0 0 95 151
December 0 0 0 0 10
a First time any tracks were recorded in this area.
DISCUSSION
During the pre-lining phase, data collection was consistent. Some plots had
to be moved due to safety concerns (i.e., high use areas by illegal aliens), but
were replaced with others. However, during the lining phase, heavy equipment
precluded data collection from plots in a systematic manner.
Deer use of the desert north and adjacent to the AAC, north of I-8 has
increased from no use from November 2004 through the pre-lining phase into
the lining phase (May 2007). Since then, deer use of the area increased through
November 2007 (Table 3). There was no use recorded in 2008 until May when use
peaked in August then remained consistent from September through November
and declined again in December.

Deer and canals
141
TABLE 4Detection probability (Ψ) of desert mule deer along 1.6 km of the All-American Canal north
of I-8 (from the first bridge west of Pilot Knob to the edge of the dunes), 2008, eastern California. The 1.6 km section is divided into 3 areas: central (central 0.5 km),
west (0.3 km west of central), and east (0.3 km east of central).
Season and monthMonthly
ΨWestΨ
CentralΨ
EastΨ
Cool
February 0.0000 0.0000 0.0000 0.0000
March 0.0000 0.0000 0.0000 0.0000
Hot-Dry
April 0.0000 0.0000 0.0000 0.0000
May 0.0130 0.0000 0.0000 0.0476
June 0.1202 0.0000 0.1533 0.0417
Hot-Moist
July 0.1690 0.0000 0.2133 0.0417
August 0.1882 0.1111 0.1556 0.3234
September 0.0099 0.0046 0.1000 0.0000
Cool
October 0.0739 0.000 0.0889 0.0000
November 0.0909 0.0417 0.0750 0.0000
December 0.0130 0.0000 0.0286 0.0000
Why deer started to approach the AAC during the lining phase is unknown.
Possible explanations for the increase in use of the AAC include a reduction
of functional catchments, temperature increases, or deer population increases.
According to some (G. P. Mulcahy, California Game and Fish Department,
personal communication, 19 November 2008) deer will use landscapes adjacent
to the AAC for several years, then may not use the area for several years before
they return. However, deer have started using the AAC (or at least approach it)
and soon will likely fall in and drown if the canal is accessible.
142
Galemys 22 (nº especial), 2010
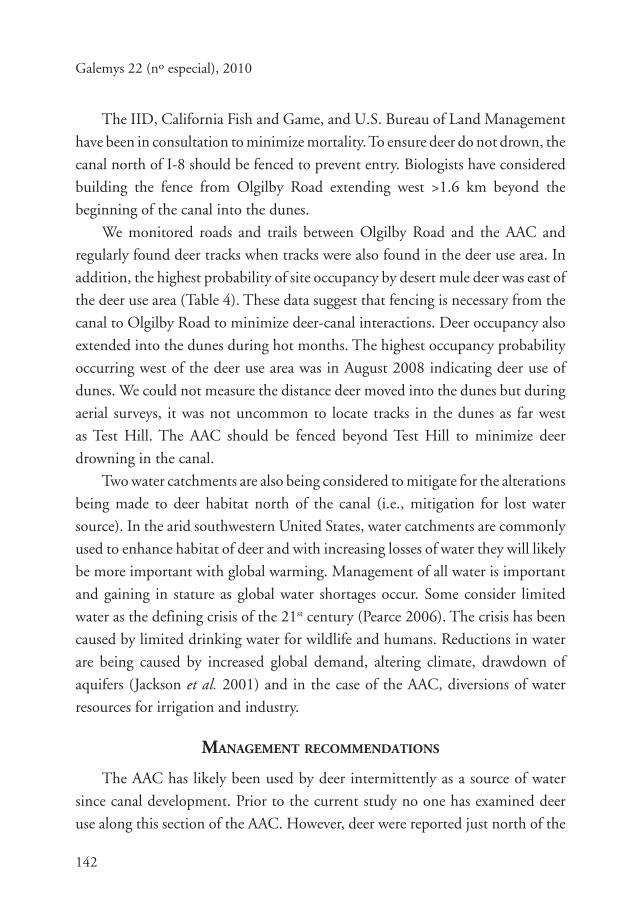
The IID, California Fish and Game, and U.S. Bureau of Land Management
have been in consultation to minimize mortality. To ensure deer do not drown, the
canal north of I-8 should be fenced to prevent entry. Biologists have considered
building the fence from Olgilby Road extending west >1.6 km beyond the
beginning of the canal into the dunes.
We monitored roads and trails between Olgilby Road and the AAC and
regularly found deer tracks when tracks were also found in the deer use area. In
addition, the highest probability of site occupancy by desert mule deer was east of
the deer use area (Table 4). These data suggest that fencing is necessary from the
canal to Olgilby Road to minimize deer-canal interactions. Deer occupancy also
extended into the dunes during hot months. The highest occupancy probability
occurring west of the deer use area was in August 2008 indicating deer use of
dunes. We could not measure the distance deer moved into the dunes but during
aerial surveys, it was not uncommon to locate tracks in the dunes as far west
as Test Hill. The AAC should be fenced beyond Test Hill to minimize deer
drowning in the canal.
Two water catchments are also being considered to mitigate for the alterations
being made to deer habitat north of the canal (i.e., mitigation for lost water
source). In the arid southwestern United States, water catchments are commonly
used to enhance habitat of deer and with increasing losses of water they will likely
be more important with global warming. Management of all water is important
and gaining in stature as global water shortages occur. Some consider limited
water as the defining crisis of the 21st century (Pearce 2006). The crisis has been
caused by limited drinking water for wildlife and humans. Reductions in water
are being caused by increased global demand, altering climate, drawdown of
aquifers (Jackson et al. 2001) and in the case of the AAC, diversions of water
resources for irrigation and industry.
MANAGEMENT RECOMMENDATIONS
The AAC has likely been used by deer intermittently as a source of water
since canal development. Prior to the current study no one has examined deer
use along this section of the AAC. However, deer were reported just north of the

Deer and canals
143
study site (Marshal 2005) and a deer was photographed by IID personnel at the
beginning of Reach 1B in July 2006 during the pre-lining phase. We began to
consistently detect deer presence north of the AAC in the deer use area (Figure 1)
during the hot-dry season 2007. Deer use the AAC north of I-8. Based upon the
literature, canals similar to the AAC in similar habitat, and expert opinion, unless
this portion of the canal is fenced with a deer proof fence, deer will continue to
use the canal and some will fall in and drown. At least 1 reportedly died in the
AAC south of I-8. In addition at least 3 deer were killed by vehicles along I-8.
In summary, we have documented the presence of mule deer along the AAC and
interactions with the canal. Most of these data are from tracks and occupancy
models and show a clear trend of deer approaching the AAC through the deer
use area (Figure 1) from the north.
An array of actions could be initiated from doing nothing to fencing all or
part of the canal. If no action is taken deer will fall into the canal and drown.
Deer populations in deserts are generally small and additional mortality (e.g.,
from drowning) usually represents additive (not compensatory) mortality. Based
on the literature, canals in similar habitats, and expert opinion, a second option
would be to fence the entire canal north of I-8 to Olgilby Road with a deer
proof fence. Deer will not be able to approach the AAC from the south due
to the border fence constructed by Homeland Security. Furthermore, we never
detected deer approaching the AAC from the south prior to the construction of
the border fence. This option would minimize deer mortality by drowning.
A third option would be to fence part of the AAC that is north of I-8 (e.g.,
from Olgilby Road to Test Hill). This option would likely reduce mortality but
eventually some deer would walk along the fence until they came to the open
canal and could fall in. Because deer likely traveled >5-10 km to reach water in
the AAC, they could be expected to travel a bit further by following a fenceline
until they reached water.
To minimize mortality we recommend the second option. All deer sign
observed occurred between Olgilby Road, the deer use area (Figure 1), and
surrounding dunes. By reducing access to this area deer will not be able to interact
with the canal north of I-8.

144
Galemys 22 (nº especial), 2010
Another mitigation factor is the creation of additional water sources to mitigate
for the loss of the AAC as a water source. Because biologists do not want deer to
use the area adjacent to the AAC, establishing water catchments near the canal is
not recommended. However, the creation of water sources between the AAC and
the mountains to the north may not serve the intended purpose of short stopping
deer because there are several existing water sources in the area used by deer. There
are no data available to suggest that additional waters would be detrimental to the
population and when water from the AAC is no longer available to deer (due to
fencing) additional sources of water may be an appropriate mitigation. In summary, deer use the AAC north of I-8 and have died trying to cross the freeway and in the canal. To minimize mortality from the canal we recommend that the entire canal north of I-8 be fenced to Olgilby Road. Deer use the area between Olgilby Road and the AAC and have used the dunes at least to Test Hill. If the decision was made to terminate the fence at, or prior to Test Hill, managers and administrators should be prepared and willing to accept occasional mortalities from deer moving west beyond the fence. The fence could be designed with additional fencing perpendicular to the main fence every 0.5 km that would extend ≥100 m to the north to direct deer away from the canal. However, due to the high human use of this area by off-road recreationists, it would be difficult to maintain. If any fence is constructed, we recommend that it will be immediately
north and close to the service road associated with the AAC.
POSTSCRIPT
This report covers 2004 through 2008. Since then, deer use patterns have remained similar to 2007 and 2008. They did not use the AAC in cool months (except once in February) and began using the deer use area in May 2009. Between 2008 and 2009, algae grew on the canal walls below the water line, and when scraped, a distinctive mark is created. We recorded deer tracks going into the canal adjacent to the I-8 bridge and ≥2 deer fell in the canal and scraped marks in the algae with their hooves. One deer traveled 0.16 km before exiting the canal and a second deer traveled 2.56 km to Test Hill, where the canal is not lined, and escaped (as evidenced by deer tracks). This was an unique opportunity
Deer and canals
145
due to the undisturbed algae. Once this section of the canal is lined, deer will not be able to escape easily. Animals that are able to escape will likely damage their hooves in attempts to exit the AAC.
REFERENCES
Arizona Game and Fish Department. 1981. The Sonoran pronghorn. Arizona Game and Fish Department Special Report No. 10, Phoenix, Arizona, USA.
Boulders J. & Bailey J. 1980. Big game loss monitoring study: Navajo Indian Irrigation Project. US. Bureau of Reclamation contract number 7-07-50-VO959. Final Report.
Bransfield R. & Rorabaugh J. 1993. Final Fish and Wildlife Coordination Act Report, All American Canal Lining Project, Imperial County, California. U.S. Bureau of Reclamation, Lower Colorado Region, Boulder City, Nevada, USA.
Busch D.E., Rorabaugh J. C. & Rautenstrauch K.R. 1984. Deer entrapment in canals of the western United States: a review of the problem and attempted solution. Pp: 95-100. In: P.R. Krausman & N.S. Smith (eds). Deer in the southwest: a symposium. School of Renewable Natural Resources, Univ. of Arizona, Tucson, Arizona, USA.
Fry E.M., Wyman V.L. & Yoeman E.H. 1984. A method for evaluating the effectiveness of a deer protection system on a concrete-lined canal with comments on planning these systems. Pp: 647-658 In: A.F. Crabtree (ed). Third international symposium on environmental concerns in rights-of-way management. Mississippi State University, Mississippi State, Mississippi, USA.
Furlow B. 1969. The Wellton-Mohawk Canal Incident. Arizona Wildlife Views, 12 (2): 22-25.
Gatz T., Brucker G., Otto W., Rothe S. & Orthmeyer D. 1984. Wildlife use of an irrigation canal rights-of-way in the prairie pothole region of North Dakota. Pp: 630-639 In: A.F. Crabtree (ed). Third international symposium on environmental concerns in rights-of-way management. Mississippi State University, Mississippi State, Mississippi, USA.
Gubser C.E. 1960. An inquiry into the effects of reservoirs and canals on big-game migrations. Proceedings of the Annual Conference of the Western Association of State Game and Fish commissions, 40: 42-52.
Guenther H.R., Sharpe F.P. & Strauss P. 1979. Mule deer losses-Mohawk Canal, Arizona: a problem identified-a solution sought. Pp: 642-644 In: G.A. Swanson (ed). The mitigation symposium: a national workshop on mitigating losses of fish and wildlife habitats. U. W. Forest Service General Technical Report RM-65.

146
Galemys 22 (nº especial), 2010
Haegele M.A. & Blevins Z.C. 1980. Experimental animal escape ramps for concrete-lined canals. Unpublished paper presented at the Colorado Wildlife Society Meeting, Glenwood Springs, Colorado, USA.
Hooge P.N. & Eichenlaub B. 1997. Animal movement extension to Arc View, Version 2.0. Alaska Biological Science Center, U. S. Geological Survey, Anchorage, Alaska, USA.
Imperial Irrigation District. 2004. Environmental commitment plan and addendum to the All American Canal Lining Project EIS/EIR. California State Clearinghouse Number SCH90010472.
Jackson R.B., Carpenter S.R., Dahm C.N., McKnight D.E., Naiman R.J., Pastel L.L. &. Running S.W. 2001. Water in a changing world. Ecological Applications, 11: 1027-1045.
Kenward R.E. 2001. A manual for wildlife radio tagging. Academic Press, London, United Kingdom.
Krausman P.R. 1985. Impacts of the Central Arizona Project on desert mule deer and desert bighorn sheep. U. S. Bureau of Reclamation Contract Number 9-07-30-X069.
Krausman P.R. & Etchberger R.C. 1993. Effectiveness of mitigation features for desert ungulates along the Central Arizona Project. U. S. Bureau of Reclamation, Phoenix, Arizona, USA. Final Report 9-C5-32-00350.
Krausman P.R. & Etchberger R.C. 1995. Response of desert ungulates to a water project in Arizona. Journal of Wildlife Management. 59: 292-300.
Krausman P.R. & Hervert J.J. 1984. Impacts of the Granite Reef Aqueduct on desert ungulates. Pp: 640-646 In: A.F. Crabtree (ed). Third international symposium on environmental concerns in rights-of-way management. Mississippi State University, Mississippi State, Mississippi, USA.
Krausman P.R. Hervert J.J. & Ordway L.L. 1985a. Capturing deer and mountain sheep with a net gun. Wildlife Society Bulletin, 13: 71-73.
Krausman P.R., Rautenstrauch K.R. & Leopold B.D. 1985b. Xeroriparian systems used by desert mule deer in Texas and Arizona. Pp: 144-149 In: R. Johnson et al. (eds). Riparian ecosystems and their management: reconciling conflicting uses. U. S. Forest Service General Technical Report RM-120.
Latham H.S. & Verzuh J.M. 1976. Reducing hazards to people and animals on reclamation Canal. U. S. Bureau of Reclamation, Engineering and Research Center Report Number REC-ERC-71-36. Denver, Colorado, USA.
Marcy L.E. 1986. Impassable wire fences. U. S. Department of the Army Corp of Engineers, Wildlife Resource Management Manual Technical Report EL-86-7.
Marshal J.P. 2005. Interactions of mule deer, vegetation, and water in the Sonoran Desert. Dissertation, University of Arizona, Tucson, USA,

Deer and canals
147
Marshal J.P, Krausman P.R., Bleich V.C., Ballard W.A. & McKeever J.S. 2002. Rainfall El Niño, and dynamics of mule deer in the Sonoran Desert, California. Journal of Wildlife Management, 66: 1283-1289.
MacKenzie D.I., Nichols J.D., Hines J.E., Knutson M.G. & Franklin A.B. 2003. Estimating site occupancy, colonization, and local extinction when a species is detected imperfectly. Ecology, 84: 2200-2207.
MacKenzie D.I. & Royle A. 2005. Designing occupancy studies: general advice and allocating survey effort. Journal of Applied Ecology, 42: 1105-1114.
Menzel K. 1969. Deer incidence in the Ainsworth Canal, March 1, 1968 through February 28, 1969. Nebraska Game and Parks Commission Job A-7.
Michny F. & McKevitt J.J. 1982. Tehama-Colusa Canal deer study. U. S. Bureau of Reclamation, mid-Pacific region. Final report.
Mohr C.O. 1947. Table of equivalent population of North American mammals. American Midland Naturalist, 37: 223-249.
Pearce F. 2006. When the rivers run dry: water, the defining crisis of the twenty-first century. Beacon Press, Boston Massachusetts, USA.
Peris S. & Morales J. 2004. Use of passages across a canal by wild mammals and related mortality. European Journal of Wildlife Research, 50: 67-72.
Popowski R.J. & Krausman P.R. 2002. Use of crossings over the Tucson Aqueduct by selected mammals. The Southwestern Naturalist, 47: 363-371.
Rautenstrauch K.R. & Krausman P.R. 1986. Preventing desert mule deer drownings in the Mohawk Canal, Arizona. U. S. Bureau of Reclamation, Boulder City, Nevada, USA. Contract 9-07-30-X0069.
Rorabaugh J. & Garcia J.R. 1983. An evaluation of wildlife response to windmill wells at the Coachella Canal and Algodones Sand Dunes. Imperial County, California, USA.
Seaman D.E. & Powell R.A. 1996. An evaluation of the accuracy of kernel density estimators for home-range analysis. Ecology, 77: 2075-2085.
Seaman E.A. 1977. Wild and domestic mammal control in concrete-line canals. U. S. Bureau of Reclamation, unpublished report.
Shult M.J. 1968. Incidence of deer in the Nebraska concrete-lined Ainsworth Irrigation Canal. Thesis, Iowa State University, Ames, Iowa, USA.
Shult M.J. & Menzel K.E. 1969. Some observed deer behavior in relation to an irrigation canal in Nebraska. Iowa State journal of Science, 43: 335-340.
Swihart R.K. & Slade N.A. 1985. Influence of sampling interval on estimates of home-rang size. Journal of Wildlife Management, 49: 1019-1025.
White G.C. & Garrott R.A. 1990. Analysis of wildlife radio-tracking data. Academic Press, San Diego, California, USA.
Worton B.J. 1989. Kernel methods for estimating the utilization distribution in home-range studies. Ecology, 70: 164-168.
